Concurrent remodelling of nucleolar 60S subunit precursors by the Rea1 ATPase and Spb4 RNA helicase
- Biochemistry Center, University of Heidelberg, Germany
- Gene Center, University of Munich, Germany
Figures
Figure 1 with 1 supplement
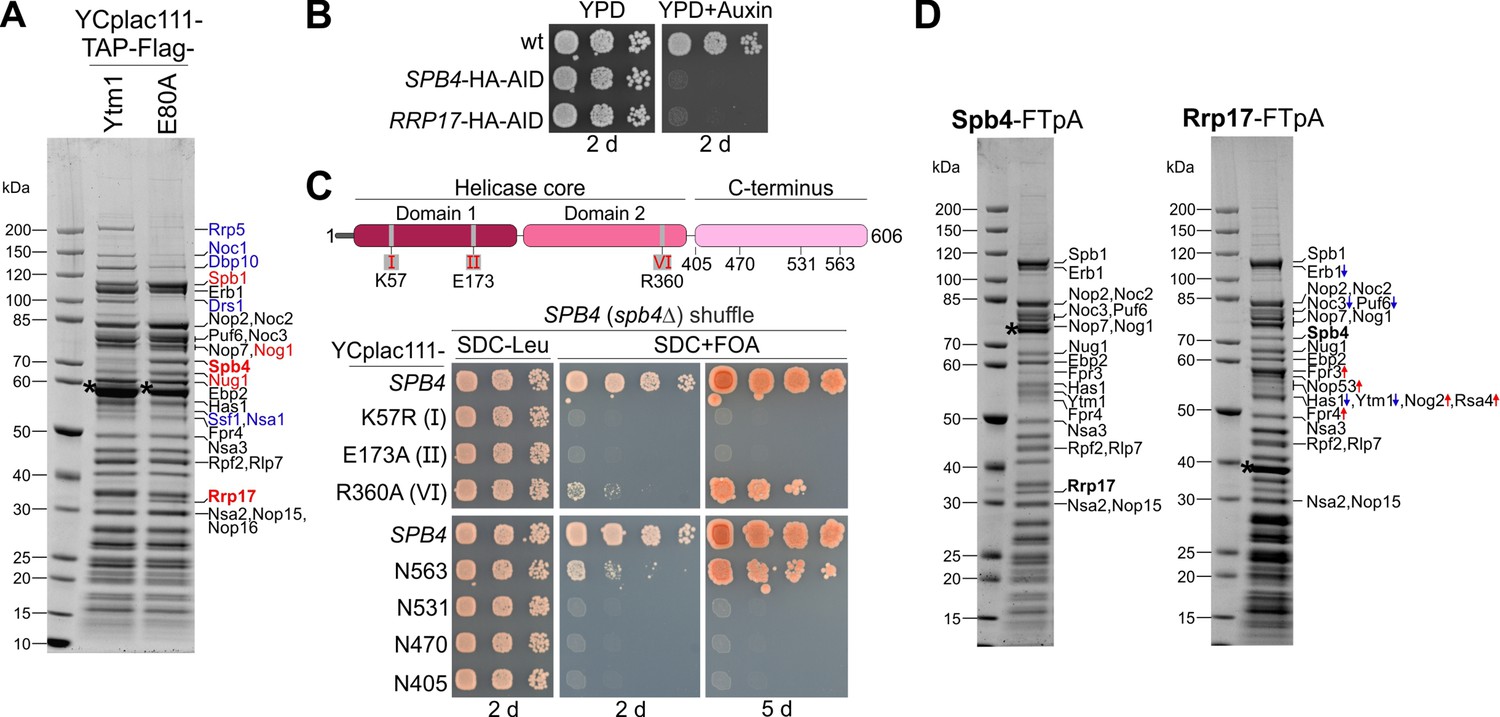
Spb4 and Rrp17 bind to late nucleolar 60S precursors.
(A) Spb4 and Rrp17 are enriched on Ytm1 E80A particles. Plasmid-borne TAP-Flag tagged wild-type YTM1 or the ytm1 E80A mutant were affinity purified and final eluates analysed by SDS-PAGE and Coomassie staining. (B) SPB4-HA-AID and RRP17-HA-AID strains were spotted in tenfold serial dilutions on YPD plates without (YPD) or containing auxin (YPD + Auxin) and incubated for 2 d at 30°C. (C) Upper panel: Spb4 protein domain organization. Amino acids within the conserved helicase core signature motifs I (K57: ATP-binding), II (E173: ATP hydrolysis), and VI (R360: ATP-hydrolysis) that were mutated in this study are indicated. Lower panel: A SPB4 (spb4Δ) shuffle strain was transformed with plasmids harbouring wild-type SPB4 or indicated spb4 mutant alleles. Transformants were spotted in tenfold serial dilutions on SDC-Leu or 5-FOA containing plates (SDC + FOA) and growth was monitored after incubation at 30°C for the indicated days. (D) Spb4-FTpA (left panel) and Rrp17-FTpA (right panel) affinity purifications enrich late nucleolar pre-60S particles. Pre-60S particles were isolated via chromosomally encoded Spb4- or Rrp17-FTpA. Final eluates were analysed by SDS-PAGE and Coomassie staining and indicated protein bands identified by mass spectrometry. Bands that show an increased or decreased relative intensity in the Rrp17 eluate compared to the Spb4 sample are depicted in red and blue, respectively. Note that the nucleoplasmic factors Nog2 and Rsa4 were detectable only in the Rrp17 sample. Bait proteins are marked with an asterisk.
-
Figure 1—source data 1
Unedited and uncropped Coomassie-stained gels shown in Figure 1.
Dashed boxes in the PDF indicate the respective areas shown in the figure.
- https://cdn.elifesciences.org/articles/84877/elife-84877-fig1-data1-v3.zip
Figure 1—figure supplement 1
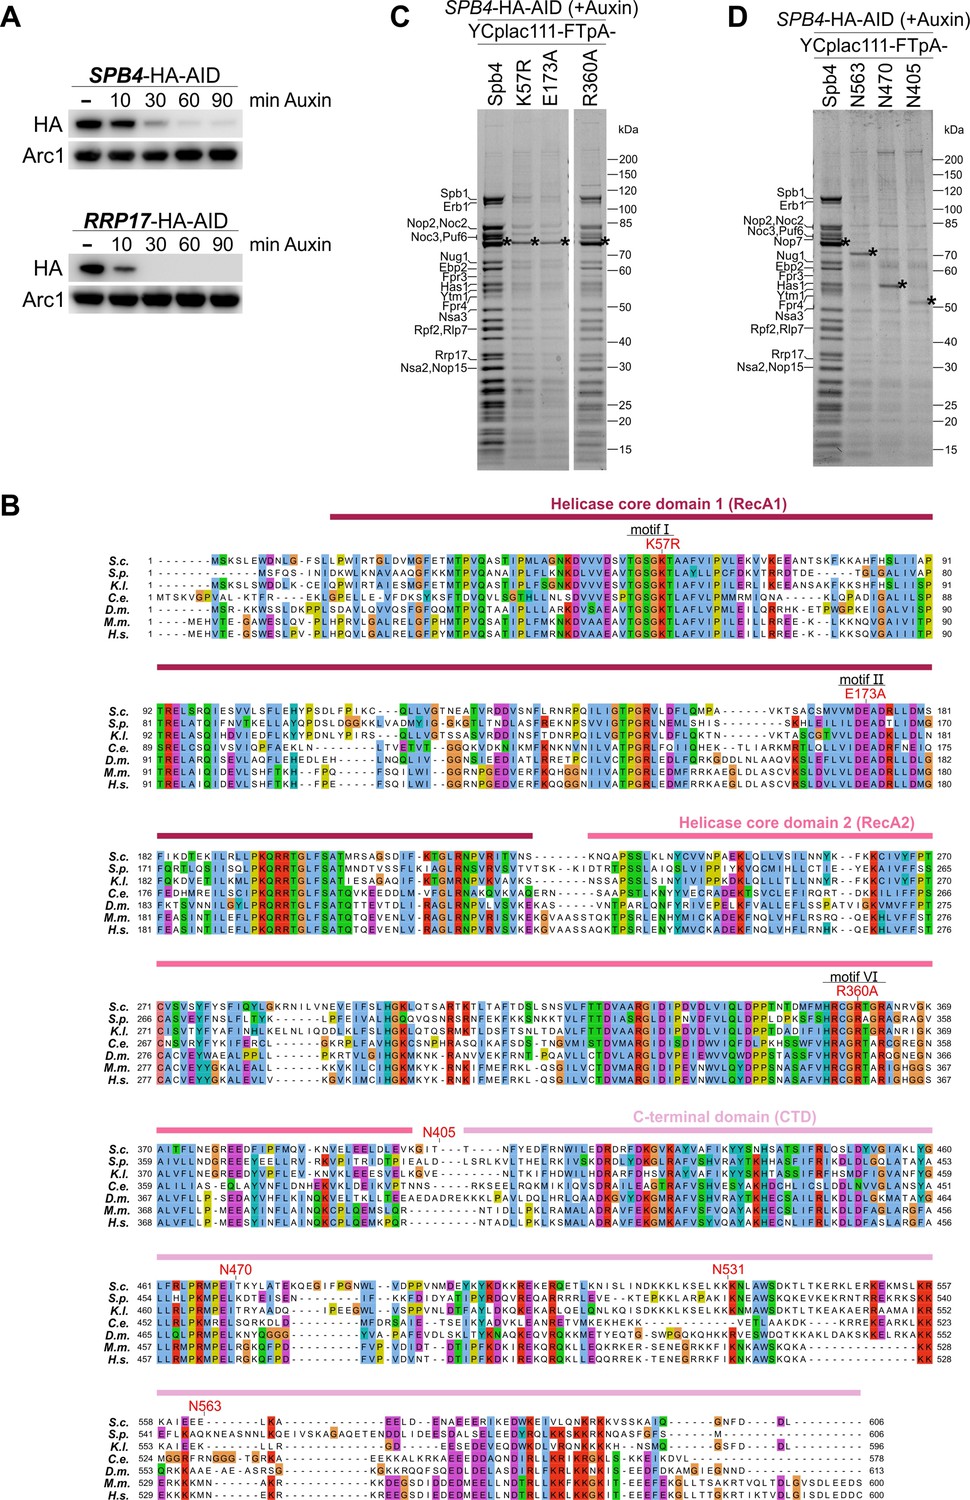
Affinity purifications using Spb4 mutants as bait protein.
(A) Spb4-HA-AID and Rrp17-HA-AID are efficiently degraded in the presence of auxin. Logarithmically growing SPB4-HA-AID and RRP17-HA-AID cells were treated with 0.5 mM auxin and the level of Spb4-HA-AID and Rrp17-HA-AID protein degradation was assessed over 90 min by western blot analysis of whole-cell lysates using an anti-HA antibody. Equal sample loading was controlled by western blot analysis using an anti-Arc1 antibody. (B) Multiple sequence alignment of Spb4 orthologues. The Spb4 protein sequences from Saccharomyces cerevisiae (S.c.), Schizosaccharomyces pombe (S.p.), Kluyveromyces lactis (K.l.), Caenorhabditis elegans (C.e.), Drosophila melanogaster (D.m.), Mus musculus (M.m.), and Homo sapiens (H.s.) were aligned with Clustal omega and illustrated with Jalview. Point mutations introduced in catalytic helicase motifs and C-terminal truncation mutants are indicated. (C, D) Efficient pre-60S affinity purification via Spb4 is impaired in catalytic helicase mutants and C-terminal truncation mutants. Indicated plasmid-borne wild-type and mutant Spb4 variants fused to a C-terminal FTpA tag were affinity purified from cells upon auxin-induced depletion of chromosomal SPB4-HA-AID. Final eluates were analysed by SDS-PAGE and Coomassie staining.
-
Figure 1—figure supplement 1—source data 1
Unedited and uncropped Coomassie-stained gels and western blots shown in Figure 1—figure supplement 1.
Dashed boxes in the PDF indicate the respective areas shown in the figure.
- https://cdn.elifesciences.org/articles/84877/elife-84877-fig1-figsupp1-data1-v3.zip
Figure 2
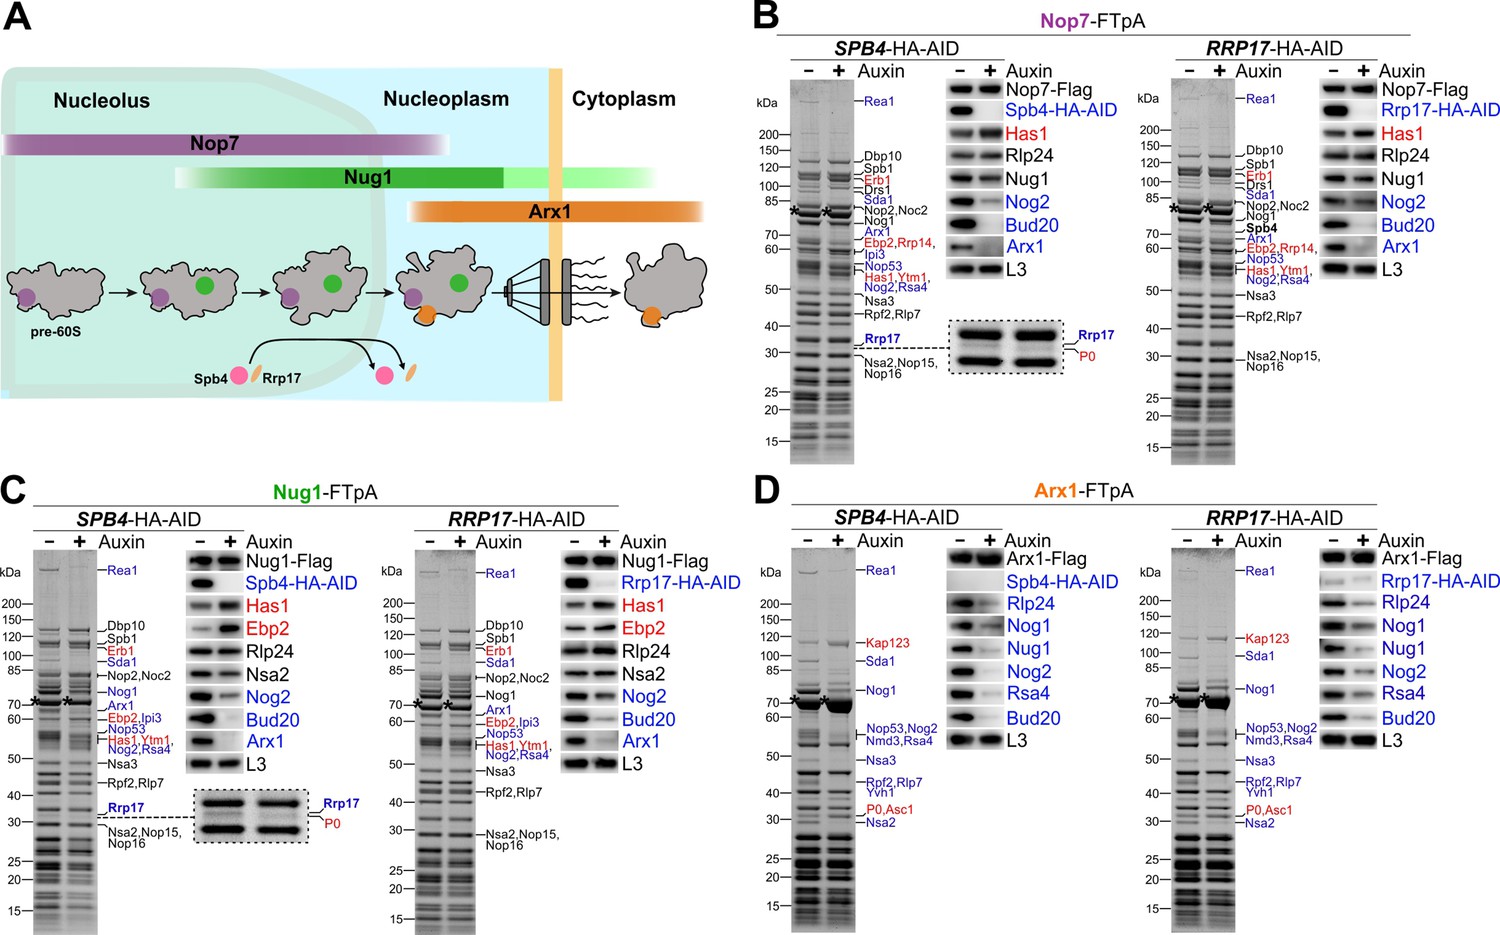
Spb4 and Rrp17 depletion arrests pre-60S maturation at a late nucleolar stage.
(A) Colour-coded bait proteins selected for affinity purifications are associated with distinct maturation intermediates along the 60S biogenesis pathway in the nucleolus, nucleoplasm, and cytoplasm: Nop7 (violet), Nug1 (green), and Arx1 (orange). The proposed assembly/disassembly stage of Spb4 and Rrp17 is indicated. (B–D) Nop7-FTpA, Nug1-FTpA, and Arx1-FTpA were affinity purified from cells in the presence of Spb4-HA-AID or Rrp17-HA-AID (-Auxin) or upon their auxin-induced proteasomal degradation (+Auxin). Final eluates were analysed by SDS-PAGE and Coomassie staining (left panels) or western blotting using indicated antibodies (right panels). Depicted Coomassie-stained protein bands were identified by mass spectrometry. Bait proteins are marked with an asterisk. Protein bands with increased or decreased intensity in the depleted samples are indicated in red and blue, respectively. For a better visualization, the area of the Coomassie-stained gels of the Nop7 and Nug1 eluates to which Rrp17 migrates is enlarged (B and C, left panels; note that the additional protein band appearing in the Spb4-HA-AID-depleted samples was identified as ribosomal protein P0).
-
Figure 2—source data 1
Unedited and uncropped Coomassie-stained gels and western blots shown in Figure 2B.
Dashed boxes in the PDF indicate the respective areas shown in the figure.
- https://cdn.elifesciences.org/articles/84877/elife-84877-fig2-data1-v3.zip
-
Figure 2—source data 2
Unedited and uncropped Coomassie-stained gels and western blots shown in Figure 2C.
Dashed boxes in the PDF indicate the respective areas shown in the figure.
- https://cdn.elifesciences.org/articles/84877/elife-84877-fig2-data2-v3.zip
-
Figure 2—source data 3
Unedited and uncropped Coomassie-stained gels and western blots shown in Figure 2D.
Dashed boxes in the PDF indicate the respective areas shown in the figure.
- https://cdn.elifesciences.org/articles/84877/elife-84877-fig2-data3-v3.zip
Figure 3 with 6 supplements

Cryo-EM structure of the nucleolar state E pre-60S subunit.
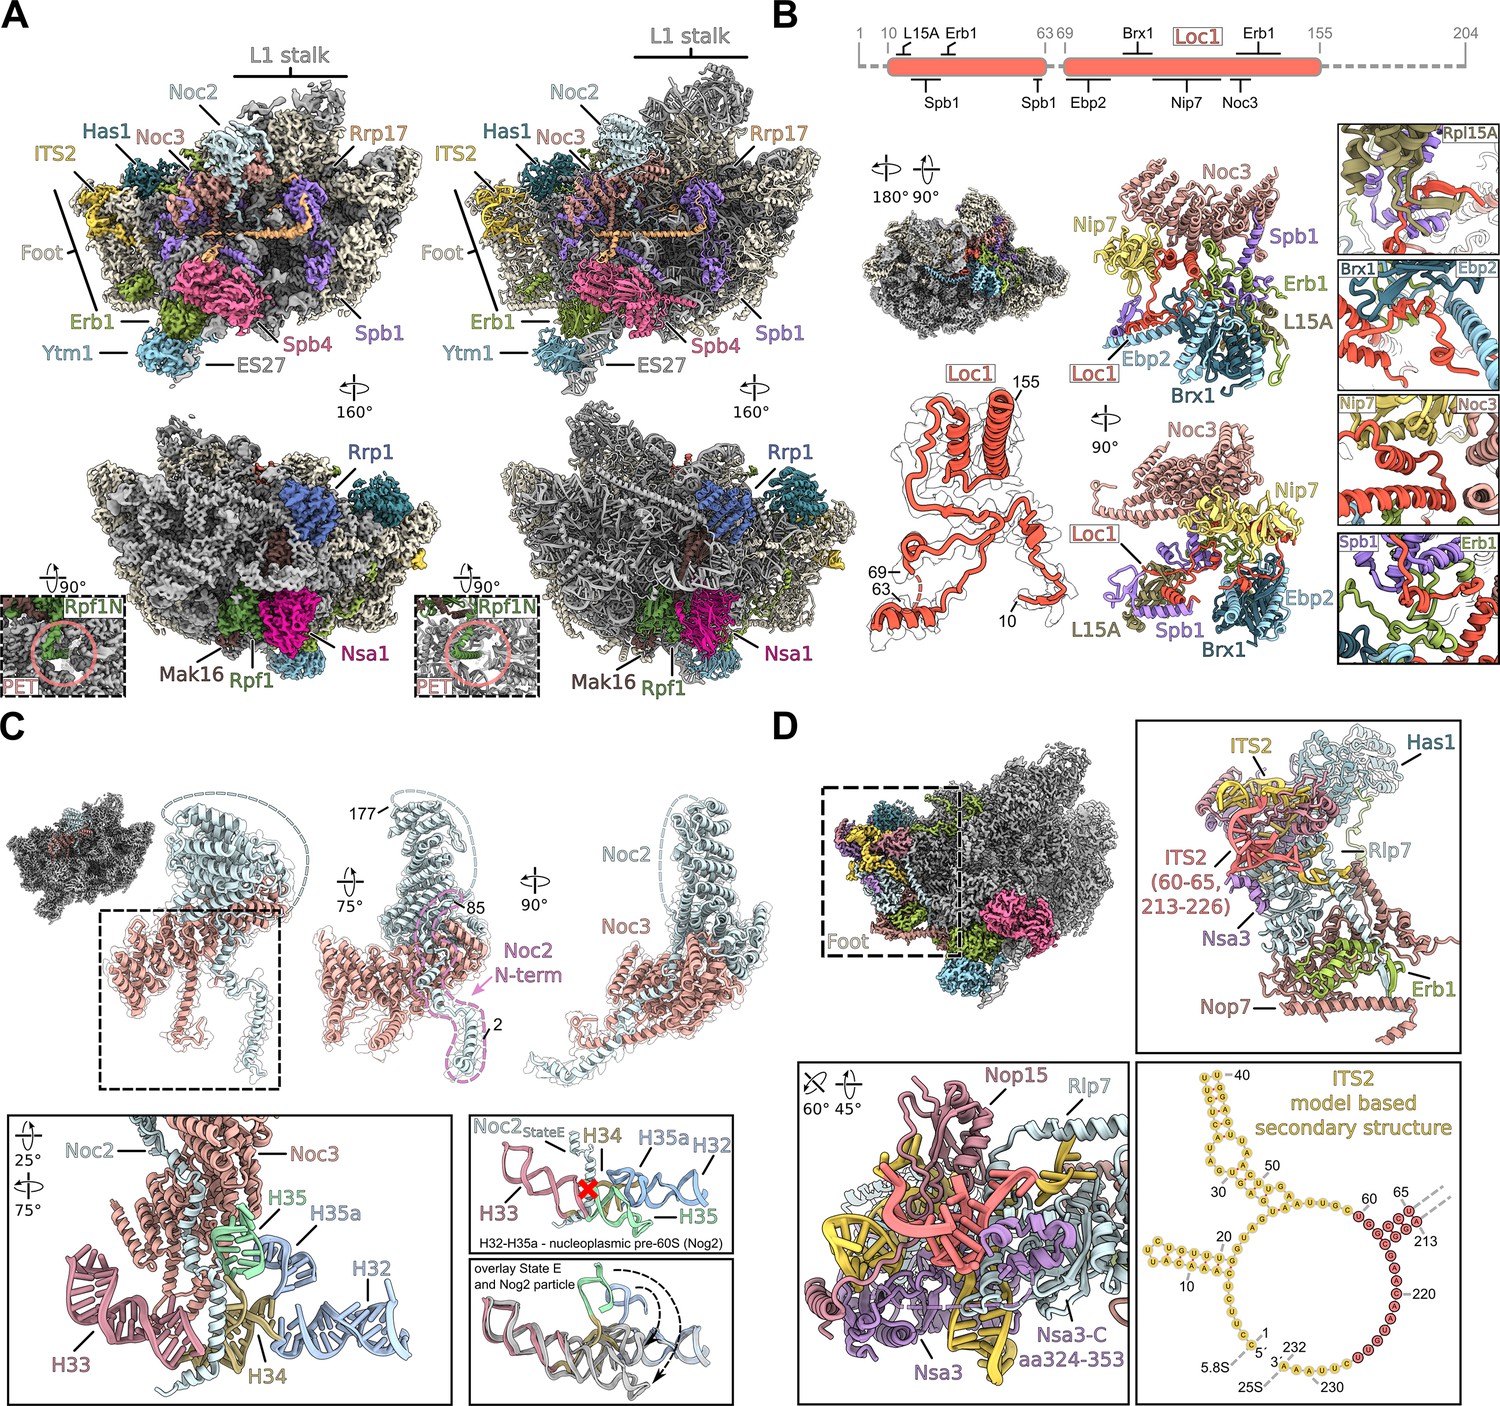
(A, B) Cryo-EM density and model in two orientations, ribosome biogenesis factors relevant to the study are coloured and labelled. Ribosomal proteins and rRNA are shown in grey and additional biogenesis factors in beige. (C) Cryo-EM model-based secondary structure of H62, H63, and H63a of the rRNA in the nucleolar state E, the nucleoplasmic Nog2 particle (PDB-3jct) and mature ribosomes (PDB-6tb3) as comparison. Nucleotides interacting with Spb4 and the intercalating Trp536 of Spb4 are indicated. (D–M) Magnified regions focussing on Spb1, Spb4, and Rrp17. (D) The Spb1-MTD interacting with the N-terminus of Rrp17. (E, F) Spb1-MTD interacting with the A loop H92. The positioned Gm2922 and S-adenosyl homocysteine (SAH) are labelled and the segmented densities for H92 and SAH are shown. (F) The N-terminus (highlighted in red) of the Spb1-MTD clamps around H92 and helps positioning G2922. (G) Interaction of the Rrp17 C-terminus with H64 and the Spb1-MTD. (H) Ytm1 and Erb1 in contact with H63 and ES27. Insertions of Ytm1 (between ß16-ß17) and Erb1 (between ß8-ß9) are coloured in light blue and light green, respectively. The segmented density for ES27 and H63 is shown. (I) Overview of Spb4 bound to the state E pre-60S subunit. The RecA domains (RecA1, RecA2) and the C-terminal domain (CTD) are coloured and labelled. (J–L) Interaction of Spb4 with Rrp17 (J) and the immature H62/H63/H63a rRNA (K, L). (M) The Spb4 helicase core in complex with ADP. Residues mutated in this study are labelled and the segmented density for ADP is shown.
Figure 3—figure supplement 1
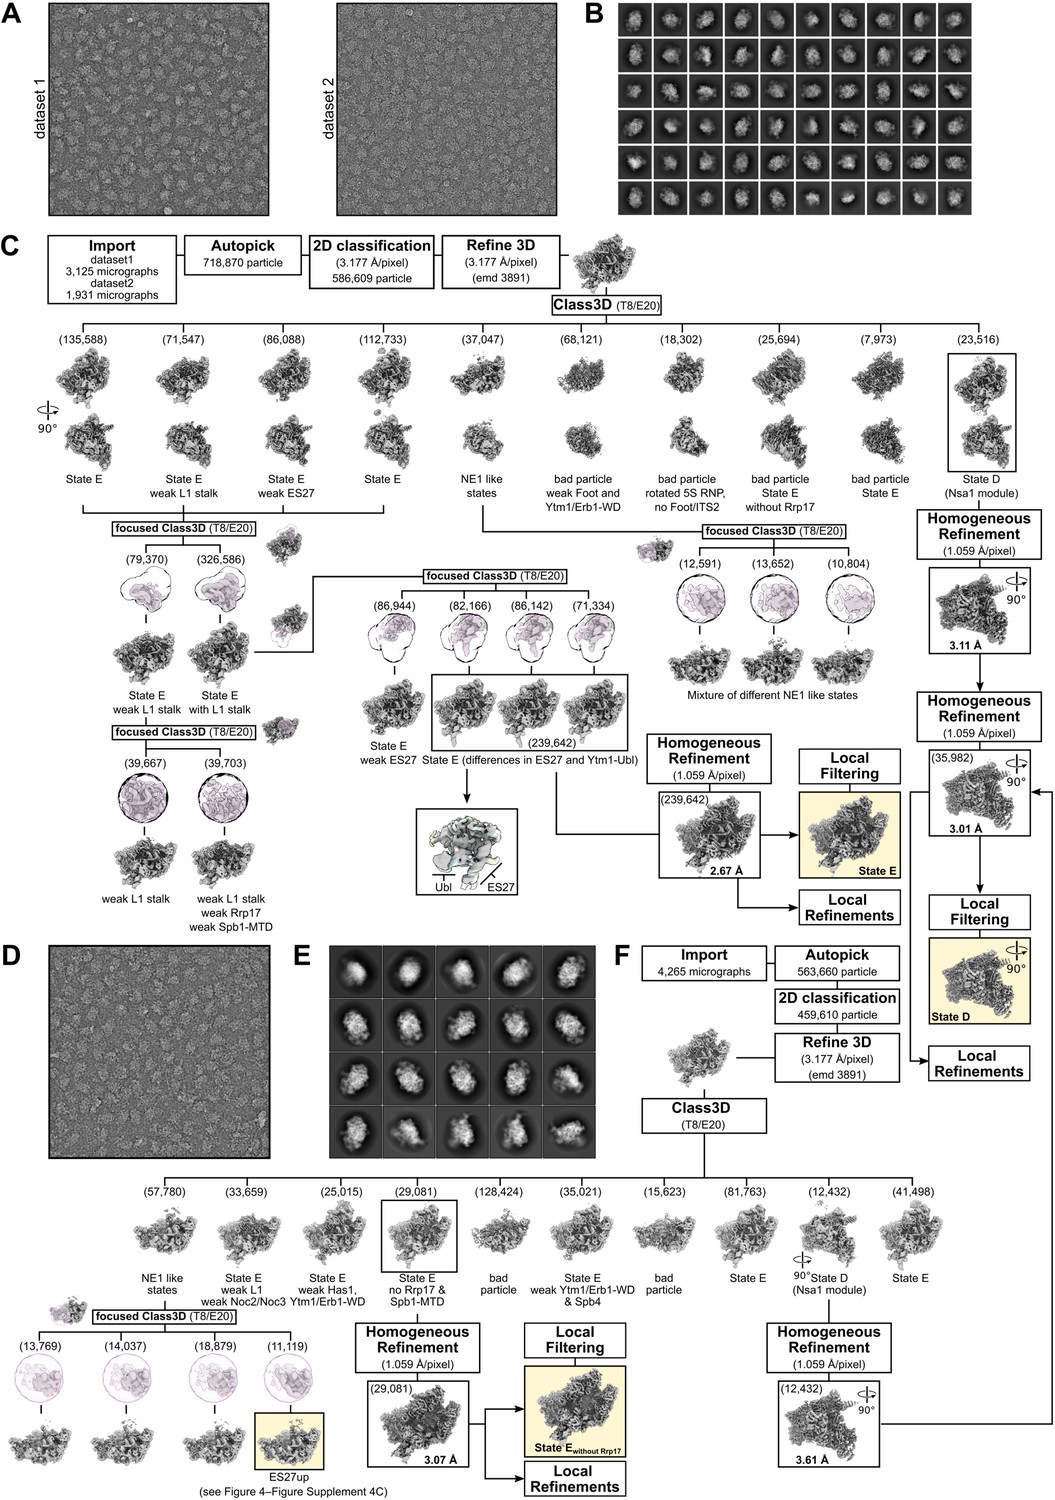
Cryo-electron microscopy data processing scheme.
(A, B) Representative micrographs and 2D class averages of the two datasets used for processing of the Spb4-FTpA sample and determination of the state E structure. (C) Sorting scheme of the Spb4 sample. Final classes are indicated. (D–F) Representative micrograph (D), 2D classes (E), and processing scheme (F) of the sample used for determination of the state E-like structure without Rrp17/Spb1-MTD. Particles for state D from (C) and (F) were combined to increase the resolution of the final state D map. Particles of the NE1-like state with the ES27 rRNA in an upward conformation (F) were combined with an identical class described in Figure 4—figure supplement 4C. Final cryo-EM volumes are highlighted and shown with their respective resolution.
Figure 3—figure supplement 2
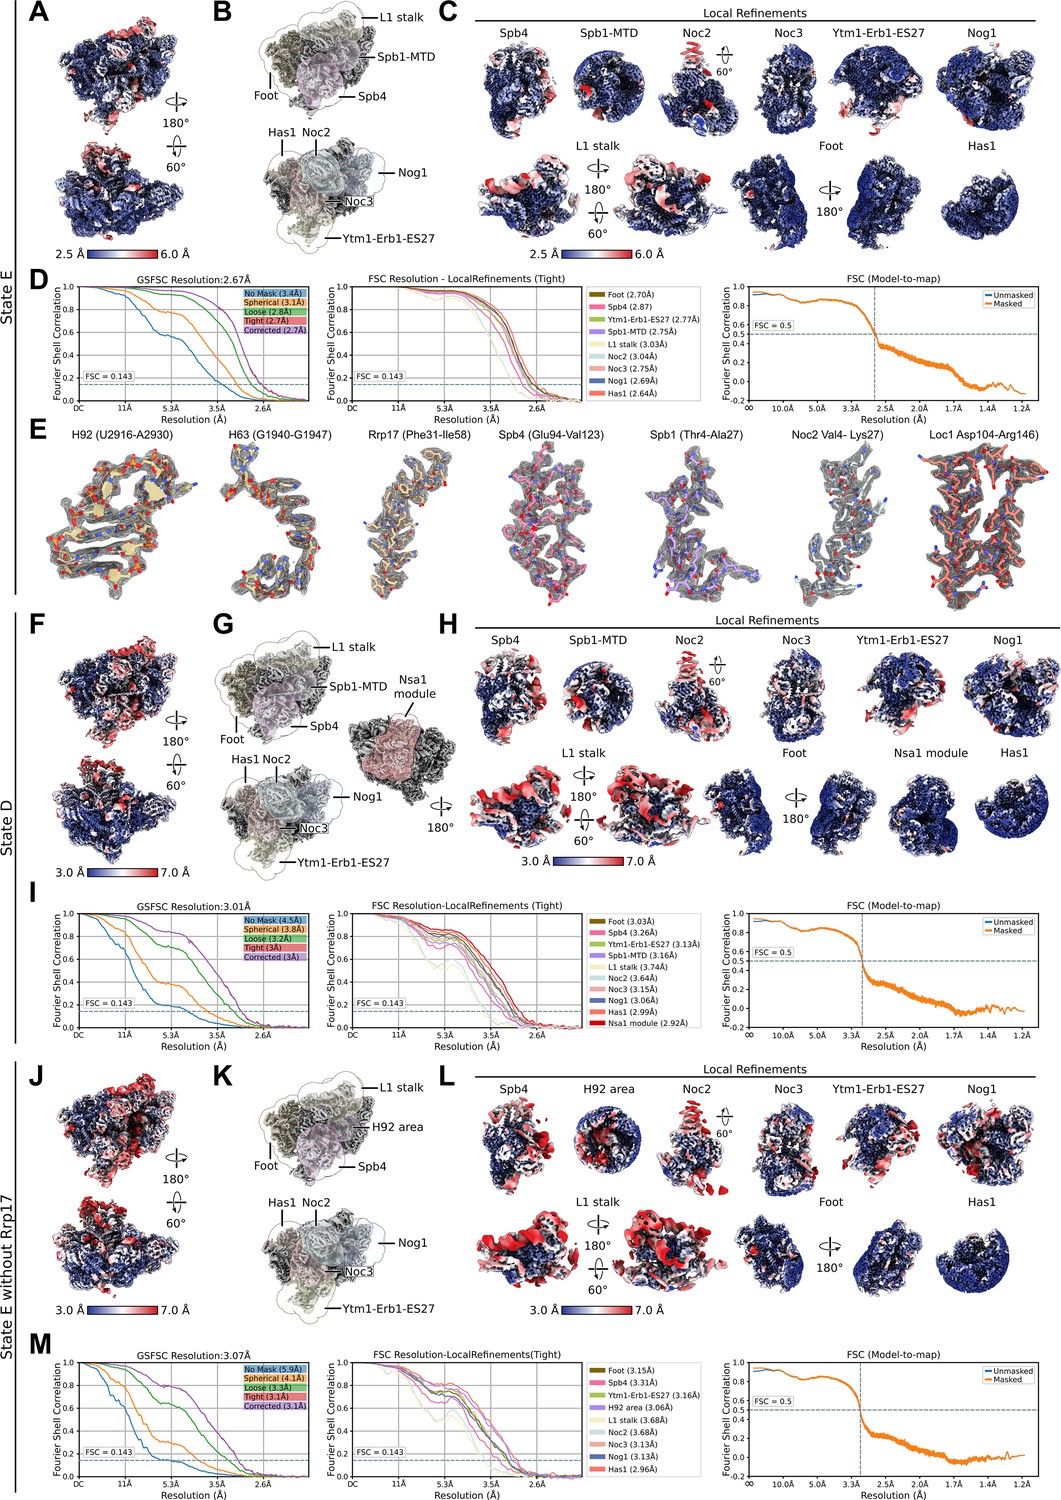
Local resolution distribution and Fourier shell correlation (FSC) curves for state E, state D, and state E lacking Rrp17.
Shown are data for state E (A–E), state D (F–I), and the state E without Rrp17 (J–M). (A, F, J) Consensus cryo-EM map of state E, state D, and the state E lacking Rrp17 coloured according to local resolution. (B, G, K) The different consensus cryo-EM maps and masks used for the local refinements. (C, H, L) Local refinements coloured according to local resolution. (D, I, M) FSC of the consensus map (left), local refined maps (middle), and the model-to-map-FSC curves (right). (E) Segmented densities shown as mesh and corresponding models of individual parts of the nucleolar state E particle.
Figure 3—figure supplement 3
Structural details of nucleolar pre-60S states D/E.
(A) Cryo-EM density (left panels) and model (right panels) of the nucleolar pre-60S state D containing the Nsa1 module (Nsa1–Rpf1–Mak16–Rrp1). Close-up views show the N-terminus of Rpf1 entering the polypeptide exit tunnel (PET). (B) The Loc1 interaction network. Schematic representation of the Loc1 interactions, unmodelled regions of Loc1 are shown as dashed lines (upper panel). Cryo-EM density of the state E class with the highlighted Loc1 interaction network and the molecular model and segmented density of Loc1 (left panels). Interaction network of the intrinsic Loc1 in two orientations. Only interacting regions and domains of the interacting factors are shown for simplicity (middle panels). Magnified regions of selected interactions between Loc1 and interacting proteins (right panels). (C) The Noc2–Noc3 complex shown in three orientations (upper panels). The Noc2 N-terminus (aa 2–85) is highlighted and the unmodelled middle part (aa 86–176) is indicated as dashed line. Interaction of the Noc2 N-terminus with rRNA H35, H32-H35 (nt 802–941) within state E is shown in different colours in the lower left panel. The lower right panels compare the orientation of H32-H35 in the nucleoplasmic Nog2 particle and the nucleolar state E. The sterical clash between the nucleoplasmic rRNA (Nog2 particle) and the Noc2 N-terminus (state E) is indicated showing that Noc2 release is required for H35 and H35a maturation. The H32-H35a rRNA of the Nog2 state (grey) is superimposed with the H32-H35a rRNA within state E (coloured). The rearrangements of H35 and H35a are indicated by arrows. (D) Cryo-EM map of the state E focussing on the ITS2-foot area. Magnifications of the foot-ITS2 region in different orientation are shown, and the new modelled region of the ITS2 (nt 60–65 and nt 213–226) is indicated in red. Secondary structure of the ITS2 based on the state E model (lower right panel).
Figure 3—figure supplement 4

Structural details of Spb1 and Spb4.
(A) Interaction network of Spb1 with biogenesis factors and ribosomal proteins identified in this study. A schematic overview of Spb1 with its various interaction partners is shown. Unmodelled parts are shown as dashed line (upper panel). Spb1 is shown as cartoon representation, and the state E subunit is shown as cryo-EM density. Interacting proteins identified in this study are coloured and labelled (lower left panel). Magnified regions showing selected interactions of Spb1 with Rpl25, Rpl30, Rpl34A, and Noc3 are shown (lower right). (B) The Spb1-MTD interacting with the A loop H92 (left panel). Close-ups of SAH and the methylated target Gm2922 in two orientations. Surrounding nucleotides including Um2921 are labelled (middle and right panel). The segmented densities for SAH and H92 are shown and the 2′-O-methylations of Gm2922 and Um2921 are highlighted. (C) Model of Spb4 interacting with the immature rRNA H62 and H63 (upper left panel) and surface views of Spb4 coloured by its electrostatic potential and in complex with H62-H63 are shown in different orientations. (D) The RecA domains of Spb4 are in a closed conformation in state D/E. Comparison of the Spb4 helicase core model with superimposed models of DDX19 in an open conformation bound to ADP (PDB: 3EWS) and in the closed conformation bound to ATP-analogue (ADPNP) and target RNA (PDB: 3G0H). The DDX19 models were fitted to the RecA1 domain of Spb4. The CTD of Spb4, the N-terminus of DDX19 as well as nucleotides and target RNAs are omitted for clarity. (E) Close-up of the nucleotide binding pocket within the Spb4 RecA1 domain. The model and the transparent cryo-EM density are shown and the models of ADP and Mg2+ are labelled (left panel). Models of different RNA helicases were rigid body fitted into the Spb4 (state E) density and are shown in grey. Different bound nucleotides and Mg2+ are labelled. The models of the human DDX19 in complex with ADP (PDB: 3EWS) and ADPNP (PDB: 3G0H), the S. cerevisiae Dbp5 L327V bound to ADP BeF3 and the Vasa helicase E339Q mutant from B. mori bound to ADP and Pi were used for comparison.
Figure 3—figure supplement 5
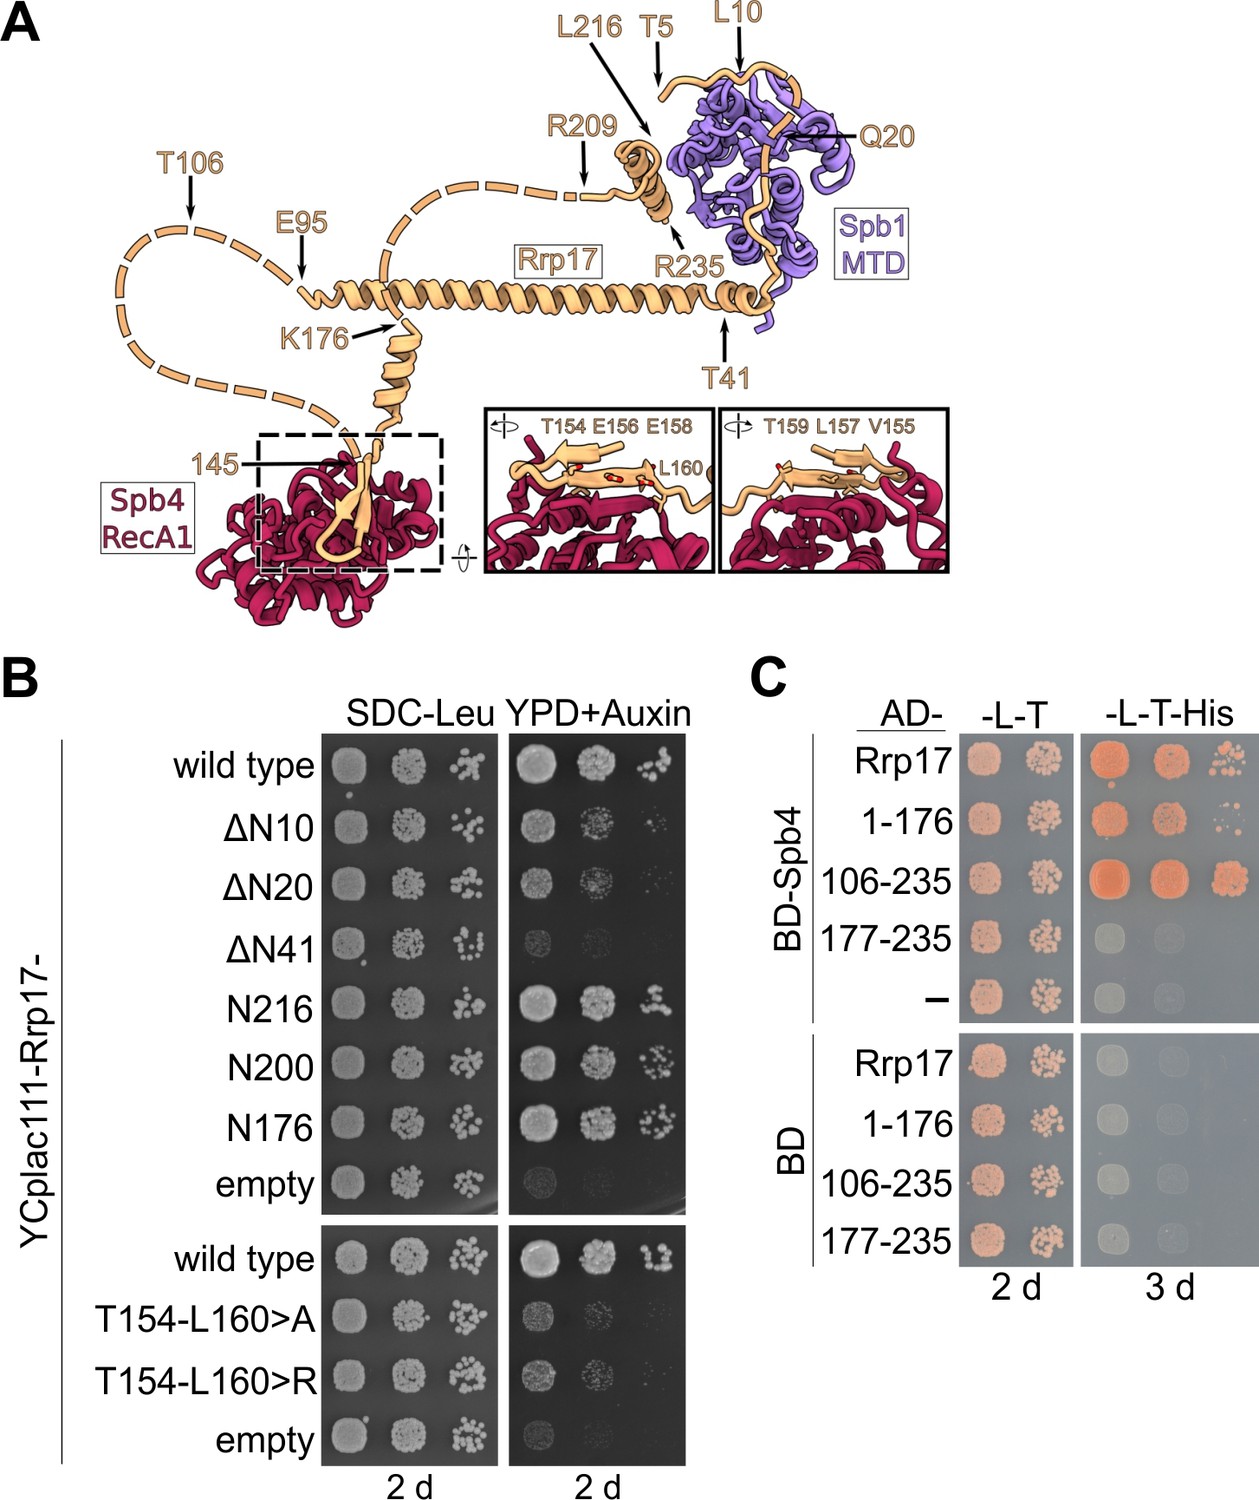
Importance of the Spb4–Rrp17 β-sheet augmentation for cell growth and protein–protein interaction.
(A) Rrp17 in contact with the Spb1-MTD and Spb4-RecA1 domains in state E pre-60S subunits. Truncations and mutations of Rrp17 used for growth complementation and Y2H studies (B and C) are indicated. (B) An RRP17-HA-AID strain was transformed with plasmids harbouring wild-type RRP17 or the indicated rrp17 mutant alleles. Transformants were spotted in tenfold serial dilutions on SDC-Leu plates or YPD plates containing 2 mM auxin (YPD + Auxin) and growth monitored after incubation for 2 d at 30°C. (C) Spb4 fused to the Gal4 DNA-binding domain (BD) and indicated Rrp17 constructs fused to the Gal4 activation domain (AD) were transformed into the PJ69-4A yeast two-hybrid strain. Cells were spotted in ten-fold serial dilutions on SDC-Leu-Trp (-L-T) and SDC-Leu-Trp-His (-L-T-His; growth on this medium indicates a yeast two-hybrid interaction) plates and growth was monitored after incubation at 30°C for 2 and 3 d, respectively.
Figure 3—figure supplement 6

Cryo-EM structure of the state preceding state E lacking Rrp17 and the Spb1-MTD.
(A, B) Coloured map (A) and model (B) of the state E like state lacking Rrp17 and the N-terminal MTD domain of Spb1. Relevant factors are coloured and labelled. (C) Coloured cryo-EM density of the state lacking Rrp17 focussing on the Spb4 RecA1 region (upper panel) and the region where the Spb1-MTD domain binds in state E (lower panel). The models of Rrp17, the Spb1-MTD, and rRNA H64 of the state E were overlaid.
Figure 4 with 6 supplements
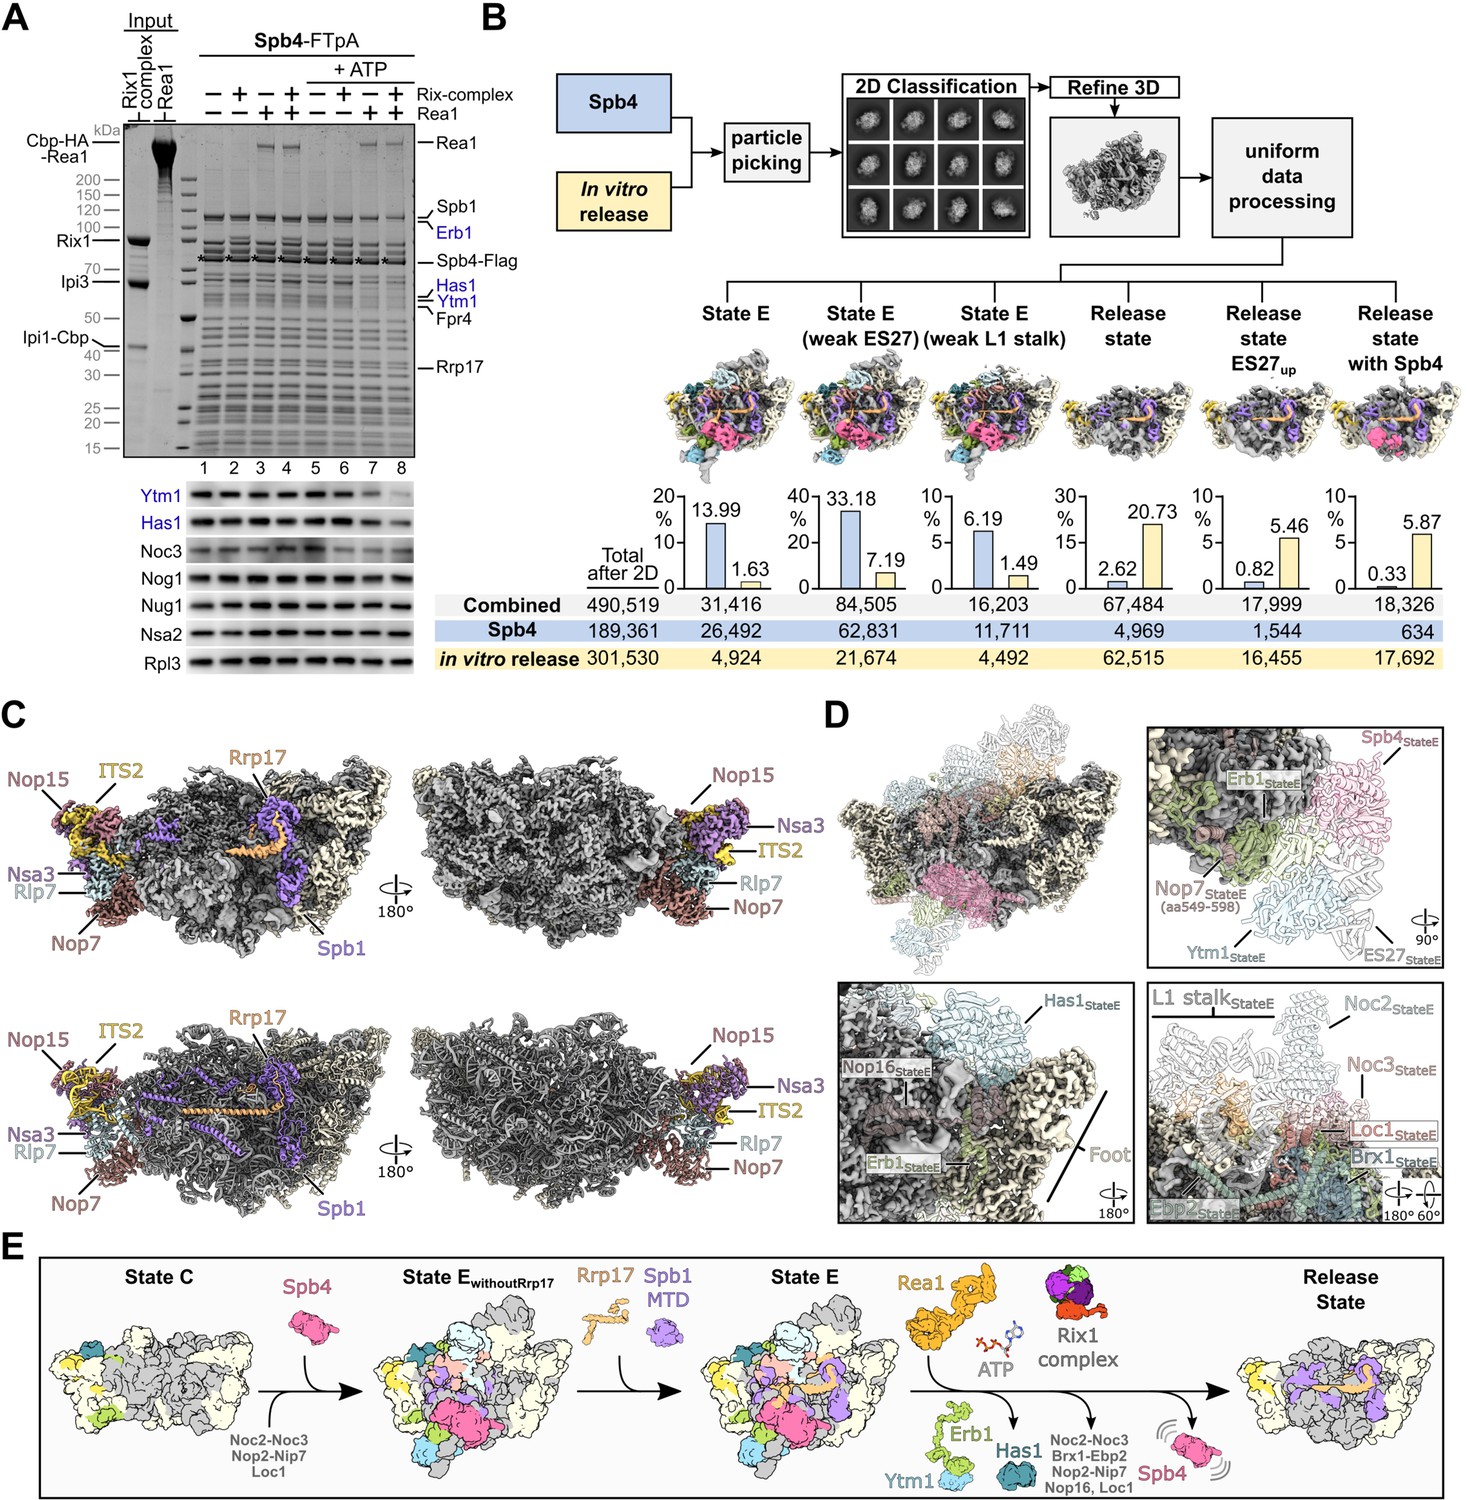
Rea1-dependent remodelling induced on isolated Spb4 particles in vitro.
(A) Rea1 releases the Ytm1–Erb1 subcomplex together with RNA helicase Has1 from pre-60S particles. TEV-eluates of pre-60S particles isolated via Spb4-FTpA were as indicated incubated with purified Rea1, Rix1-complex (Rix12–Ipi32–Ipi1) and/or 3 mM ATP for 45 min at room temperature. Still bound material was re-isolated via Spb4-Flag by incubation with anti-Flag agarose beads and eluted with Flag peptide. Final eluates were analysed by SDS-PAGE and Coomassie staining (upper panel) or western blotting using the indicated antibodies (lower panel). The Spb4-Flag bait protein is marked with an asterisk and the released assembly factors Ytm1, Erb1, and Has1 are indicated in blue (B) Single-particle cryo-EM analyses of Spb4 control and in vitro matured pre-60S samples. Micrographs of the untreated Spb4 control and the in vitro release samples (corresponding to lanes 1 and 8 in (A), respectively) were combined for data processing. After reference free particle picking and 2D classification, the combined dataset was processed and six final classes are shown (maps are 3 x binned and coloured according to the colour scheme in Figure 3). The diagrams indicate the percentage of particles from the Spb4 and in vitro release dataset corresponding to the individual cryo-EM reconstruction. Combined particle numbers of each class as well as the particle numbers of the individual datasets (Spb4 control and in vitro release) are shown underneath. (C) Cryo-EM map (upper panels) and model (lower panel) of the main release state. Spb1, Rrp17 and the foot factors are coloured and labelled and additional biogenesis factors are highlighted in beige. (D) Overview and magnified regions of the release state cryo-EM volume with ribosomal proteins and rRNA coloured in grey and biogenesis factors and ITS2 RNA coloured in beige. Superposition of transparent molecular models from the preceding state E indicating factors and rRNA which are destabilised/released in the release state class. (E) Model summarising the results of this study. Spb4 is assembled at a late nucleolar stage and remains attached in a helicase-core closed conformation upon ATP hydrolysis. Rrp17 is incorporated at state E, at which also the Spb1-MTD gets positioned for methylation of G2922. Rea1-dependent release of Ytm1–Erb1 facilitates large-scale remodelling of the particle and transition to the NE1-like release state.
-
Figure 4—source data 1
Unedited and uncropped Coomassie-stained gels and western blots shown in Figure 4A.
Dashed boxes in the PDF indicate the respective areas shown in the figure.
- https://cdn.elifesciences.org/articles/84877/elife-84877-fig4-data1-v3.zip
Figure 4—figure supplement 1

In vitro maturation assays utilizing distinct substrate particles.
(A) Rea1-dependent remodelling cannot be induced on Ytm1-derived pre-60S particles. TEV-eluates of pre-60S particles isolated via TAP-HA-Ytm1 were as indicated incubated with purified Rea1, Rix1-complex (Rix12–Ipi32–Ipi1) and/or 3 mM ATP for 45 min at room temperature. Still bound material was re-isolated via Rpl3-Flag by incubation with anti-Flag agarose beads and eluted with Flag peptide. Final eluates were analysed by SDS-PAGE and Coomassie staining (upper panel) or western blotting using an anti-HA antibody to detect Ytm1 (lower panel). (B) Ytm1–Erb1 and Has1 are released from Spb4 R360A-derived mutant particles. Plasmid-borne FTpA tagged wild-type and R360A mutant Spb4 proteins were isolated from cells upon auxin-induced depletion of chromosomal SPB4-HA-AID. TEV eluates were incubated with Rea1, Rix1-complex and/or 3 mM ATP as described above and re-isolated via Spb4-Flag. Final eluates were analysed by SDS-PAGE and Coomassie staining (upper panel) or western blotting with the indicated antibodies (lower panel). (C) TEV-eluates of pre-60S particles isolated via Rrp17-FTpA were incubated with Rea1, Rix1-complex and/or 3 mM ATP as described above and re-isolated via Rrp17-Flag. Final eluates were analysed by SDS-PAGE and Coomassie staining (upper panel) or western blotting with the indicated antibodies (lower panel). Released proteins are indicated in blue. The bait proteins are marked with an asterisk. (D) A HAS1-HA-AID strain was transformed with plasmids harbouring wild-type HAS1 or the has1 K92A allele (upper panel) and a SPB4-HA-AID strain was transformed with plasmids harbouring indicated spb4 alleles (lower panel). Transformants were spotted in tenfold serial dilution on YPD plates with or without auxin and growth assessed after incubation at 30°C for 2 d.
-
Figure 4—figure supplement 1—source data 1
Unedited and uncropped Coomassie-stained gels and western blots shown in Figure 4—figure supplement 1.
Dashed boxes in the PDF indicate the respective areas shown in the figure.
- https://cdn.elifesciences.org/articles/84877/elife-84877-fig4-figsupp1-data1-v3.zip
Figure 4—figure supplement 2
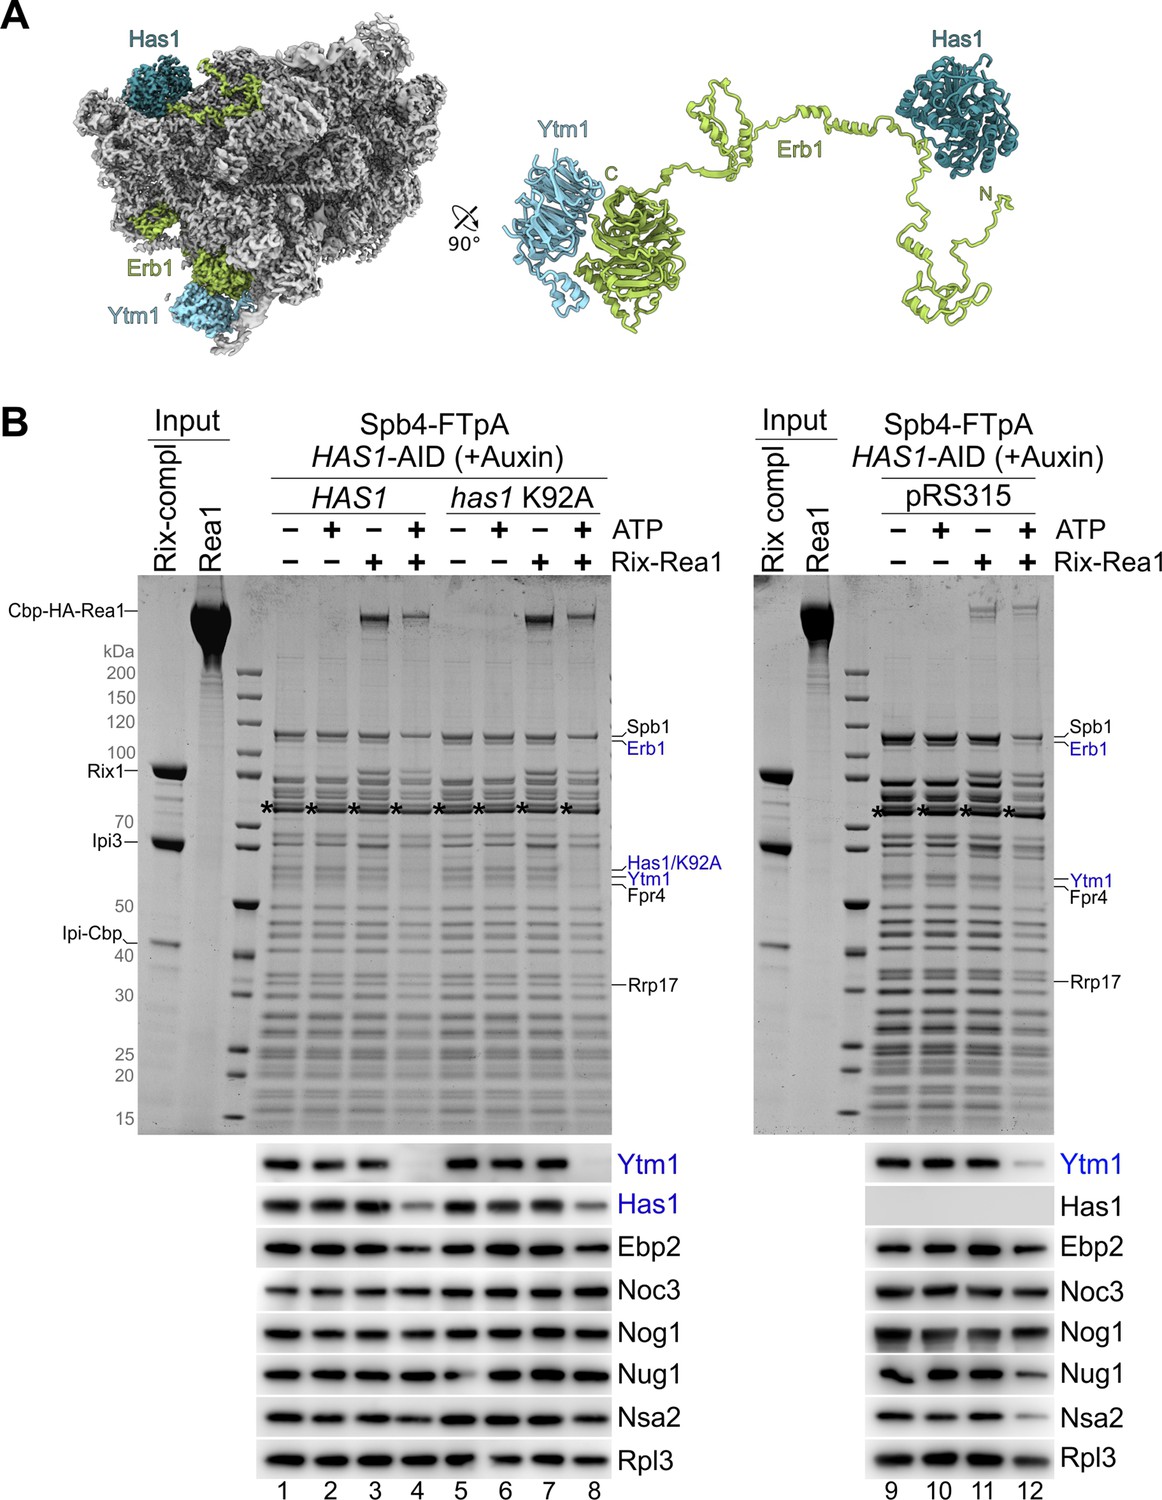
Catalytically inactive Has1 K92A protein is dislodged from Spb4 particles upon Ytm1–Erb1 release.
(A) Cryo-EM reconstruction of the nucleolar state E pre-60S particle showing the contact between Has1 and the long unstructured Erb1 N-terminal tail. Ytm1 (light blue), Erb1 (green), and Has1 (blue) are displayed bound to the pre-60S particle (grey) as coloured cryo-EM map (left panel) or enlarged as cartoon representation (right panel). (B) Spb4-FTpA particles were isolated upon HAS1-HA-AID depletion from cells expressing wild-type HAS1 or a has1 K92A Walker A mutant (left panel) or in absence of plasmid-borne HAS1 (right panel). Spb4 TEV eluates were as indicated incubated with purified Rea1, Rix1-complex (Rix12–Ipi32–Ipi1) and/or 3 mM ATP for 45 min at room temperature. Still bound material was re-isolated via Spb4-Flag by incubation with anti-Flag agarose beads and eluted with Flag peptide. Final eluates were analysed by SDS-PAGE and Coomassie staining (upper panels) or western blotting using the indicated antibodies (lower panels). The released proteins are indicated in blue.
-
Figure 4—figure supplement 2—source data 1
Unedited and uncropped Coomassie-stained gels and western blots shown in Figure 4—figure supplement 2.
Dashed boxes in the PDF indicate the respective areas shown in the figure.
- https://cdn.elifesciences.org/articles/84877/elife-84877-fig4-figsupp2-data1-v3.zip
Figure 4—figure supplement 3
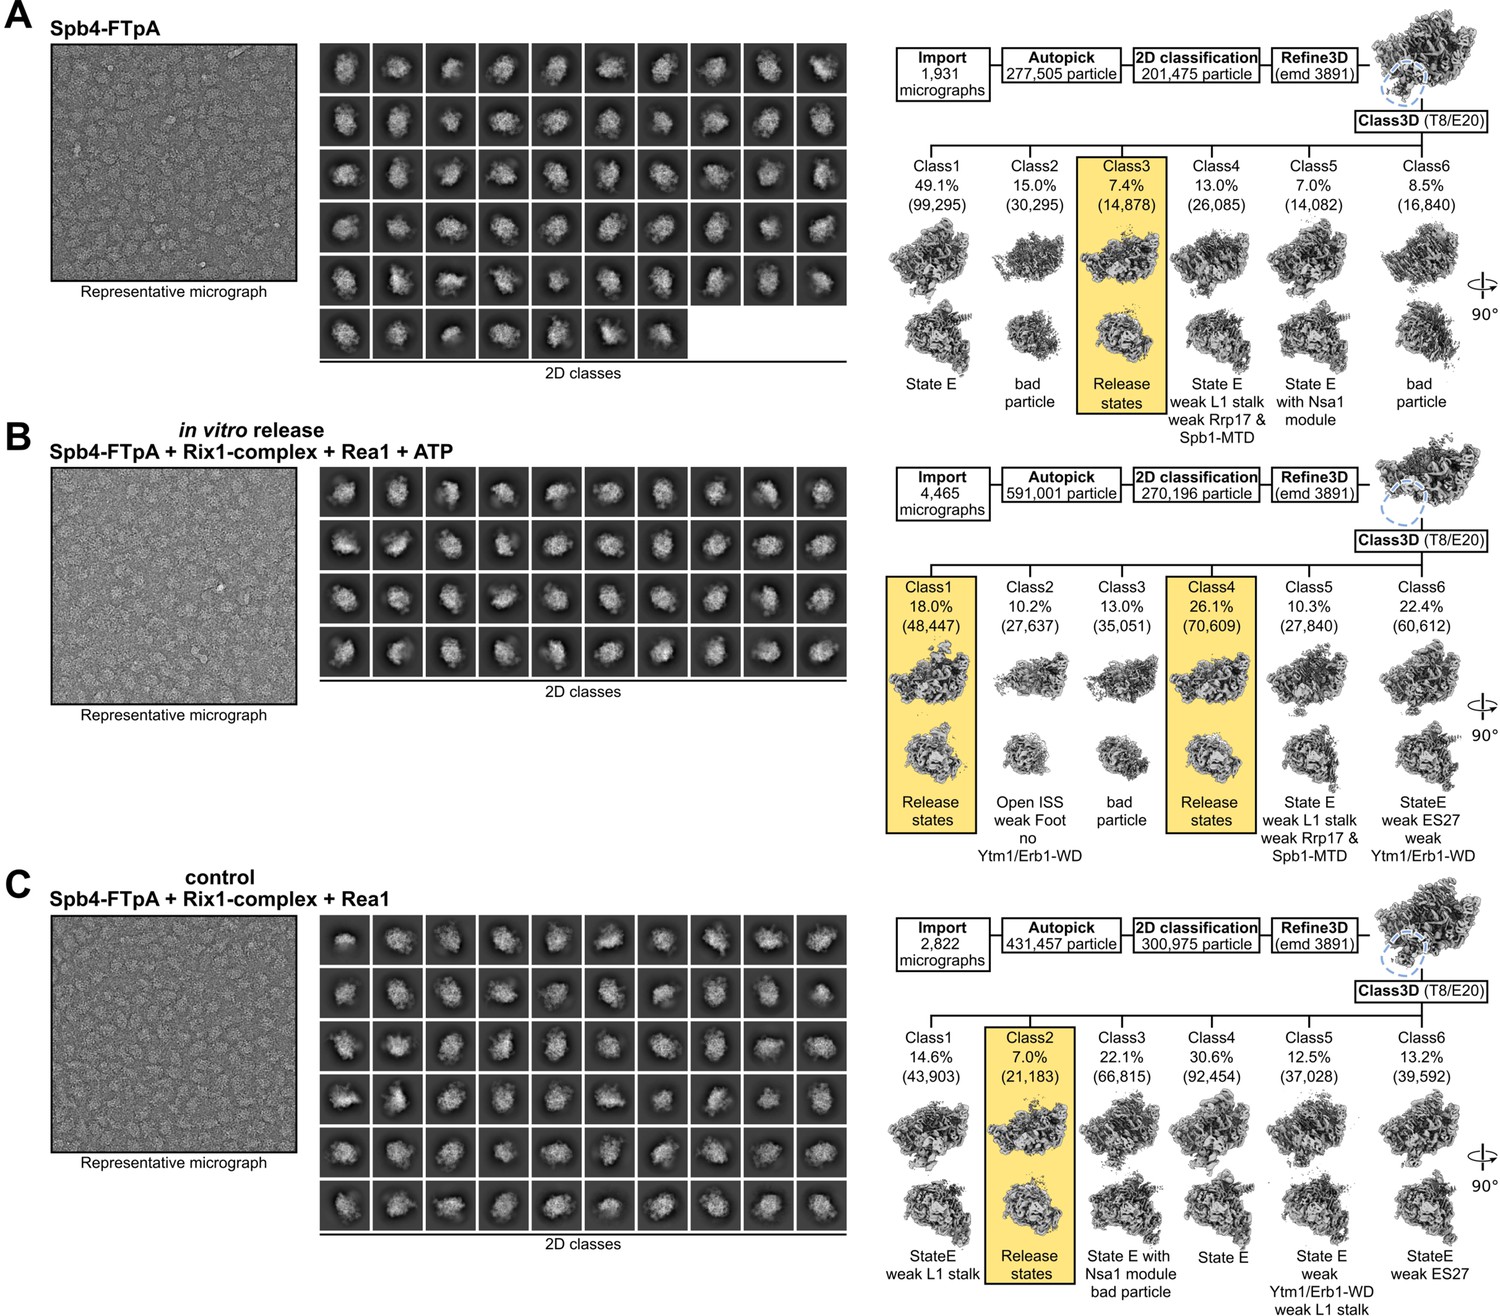
Comparison of Spb4, in vitro release, and control samples.
Processing schemes for the (A) Spb4-FTpA sample, (B) the in vitro release sample (Spb4-FTpA+Rix1 complex + Rea1 and ATP), and (C) the control sample (Spb4-FTpA+Rix1 complex + Rea1 but lacking ATP). The left and middle panels show representative micrographs and 2D class averages, respectively. The right panels show the initial processing schemes. After the initial refinement (Refine3D), density for the Ytm1-WD and Erb1-WD complex is clearly visible in the Spb4 and control samples but absent in the in vitro release sample (indicated with blue dashed lines). Subsequent 3D classification for each dataset is shown and the percentage and particle numbers (in brackets) are shown. The release state classes of each dataset are highlighted.
Figure 4—figure supplement 4

Sorting scheme of the combined Spb4 and in vitro release datasets.
Representative micrographs of each dataset (A) and combined particle averages after 2D classification (B). (C) Sorting scheme of the combined dataset. Particle numbers of the combined and the individual dataset of each class are shown. Final volumes are highlighted and shown with their respective resolution. In case of the release state ES27up volume, particles from an identical class (see Figure 3—figure supplement 1F) were added to increase the resolution.
Figure 4—figure supplement 5

Local resolution and Fourier shell correlation (FSC) curves of the observed release states.
Data for the release state (A–D), the release state – ES27up (E–H), the release state with Spb4 (I–L) and the NE1 state containing Nop53 (M–P) are depicted. Consensus cryo-EM maps coloured according to the local resolution (A, E, I, M), the different consensus cryo-EM maps superimposed with masks used for the local refinements (B, F, J, N) and the different local refinements coloured according to the local resolution (C, G, K, O) are displayed. The FSC curves for the consensus map (left) and the local refined maps (D, H, L, P) as well as the model-to-map-FSC curve for the release state (D) are shown.
Figure 4—figure supplement 6
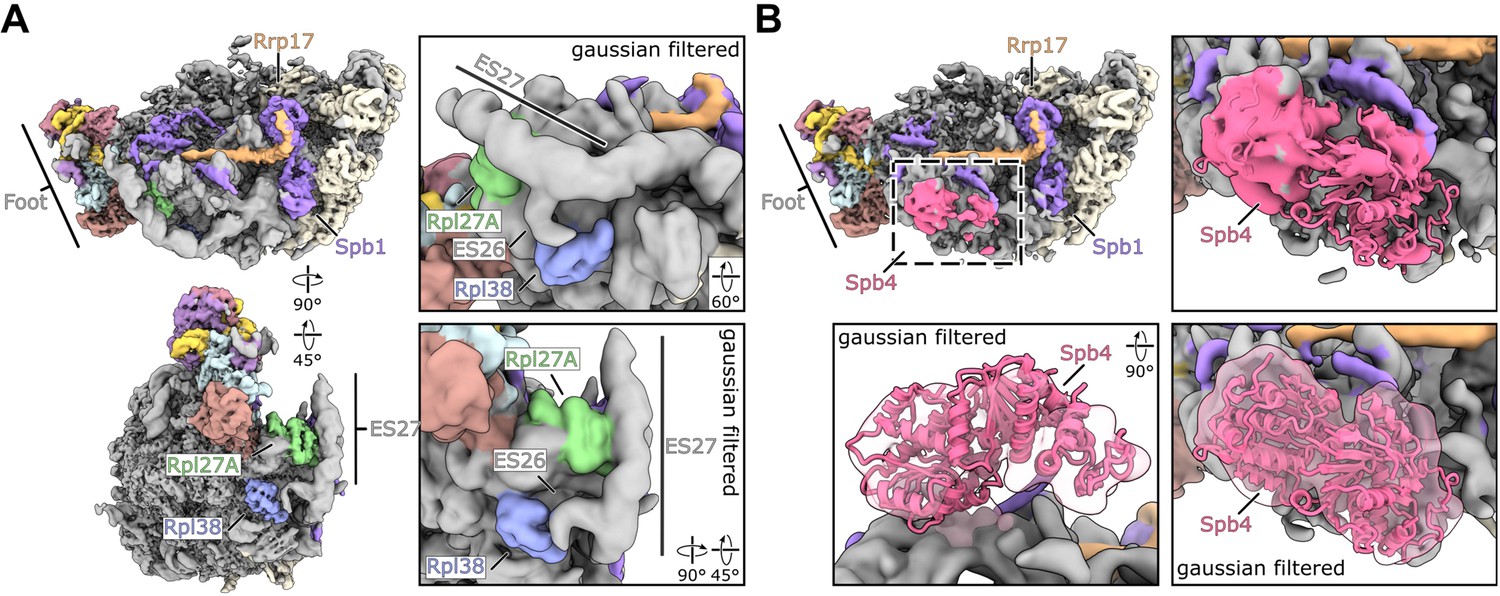
Cryo-EM maps of the release state with ES27up and the release state containing Spb4.
(A) Coloured cryo-EM map of the release state with ES27 in an upward conformation shown in two orientations (left panels). Gaussian filtered map focussing on contact sites between Rpl27A-ES27 and Rpl38-ES26 (right panels). (B) Cryo-EM map overview of the Spb4 containing release state and close-up views focussing on the Spb4 density. Gaussian filtered maps are indicated. The model of the Spb4 helicase core (aa 2–398) was rigid body fitted into the density.
Additional files
-
Supplementary file 1
Saccharomyces cerevisiae strains used in this study.
- https://cdn.elifesciences.org/articles/84877/elife-84877-supp1-v3.docx
-
Supplementary file 2
Plasmids used in this study.
- https://cdn.elifesciences.org/articles/84877/elife-84877-supp2-v3.docx
-
Supplementary file 3
Data collection and refinement statistics.
- https://cdn.elifesciences.org/articles/84877/elife-84877-supp3-v3.docx
-
MDAR checklist
- https://cdn.elifesciences.org/articles/84877/elife-84877-mdarchecklist1-v3.docx
Download links
A two-part list of links to download the article, or parts of the article, in various formats.
Downloads (link to download the article as PDF)
Open citations (links to open the citations from this article in various online reference manager services)
Cite this article (links to download the citations from this article in formats compatible with various reference manager tools)
Concurrent remodelling of nucleolar 60S subunit precursors by the Rea1 ATPase and Spb4 RNA helicase
eLife 12:e84877.
https://doi.org/10.7554/eLife.84877


