Statistical modeling based on structured surveys of Australian native possum excreta harboring Mycobacterium ulcerans predicts Buruli ulcer occurrence in humans
- Department of Microbiology and Immunology, Doherty Institute for Infection and Immunity, University of Melbourne, Australia
- Bacterial Phylogenomics Group, Institut Pasteur du Cambodge, Cambodia
- Department of Biology, Millersville University, United States
- Health and Biosecurity, Commonwealth Scientific and Industrial Research Organisation, Australia
- Victorian Infectious Diseases Reference Laboratory, Doherty Institute for Infection and Immunity, Australia
- Health Protection branch, Department of Health, Australia
- North Eastern Public Health Unit (NEPHU), Austin Health, Australia
- School of Ecosystem and Forest Sciences, University of Melbourne, Australia
- Telethon Kids Institute, Perth Children’s Hospital, Australia
- Curtin School of Population Health, Curtin University, Australia
- Melbourne School of Population and Global Health, University of Melbourne, Australia
Figures
Figure 1 with 3 supplements
Overview of the Mornington Peninsula M. ulcerans DNA concentrations in IS2404 positive excreta stratified by sampling season and possum species.
Box plots depict the median, the 25th (lower hinge), and the 75th percentiles (upper hinge) of real-time PCR Ct (IS2404) values for each category. The whiskers extend from the Inter-Quartile Range (IQR) hinges to the largest value no further than 1.5 * IQR from the hinges. The null hypothesis (no difference between Ct (IS2404) means) was rejected for p<0.05 and assessed using an unpaired t-test while assuming equal variance (checked with an F-test). ‘Summer’ n=111, ‘Winter’ n=199, ‘Brushtail’ n=8, ‘Ringtail’ n=302’.
Figure 1—figure supplement 1
Geography of the Mornington Peninsula and Geelong.
Panel A, B, C: zoomed inset maps at successively smaller scales are used to establish the location of the western tip of the Mornington Peninsula (Panel D) and Geelong (Panel E) in Australia. Panel D, E: land use categories of 2011 census mesh blocks as detailed in the legend. The GPS coordinates of all sample points visited during the study are rendered as black squares. The mesh block outlines of the suburb of Belmont are rendered in blue (Panel E).
Figure 1—figure supplement 2
A set of screenshots demonstrating electronic data collection on the Open Data Kit (ODK) Collect Android app running on a survey phone.
Figure 1—figure supplement 3
Schematic 96-well plate stack of all experimental controls used during 30 separate extraction and real-time PCR runs.
DNA extraction negative controls were included randomly at a frequency of 5–10% per extraction batch of samples and processed blinded. Additionally, every real-time PCR run included a no-template control (NTC) and a positive (M. ulcerans gDNA) real-time PCR control.
Figure 2 with 1 supplement
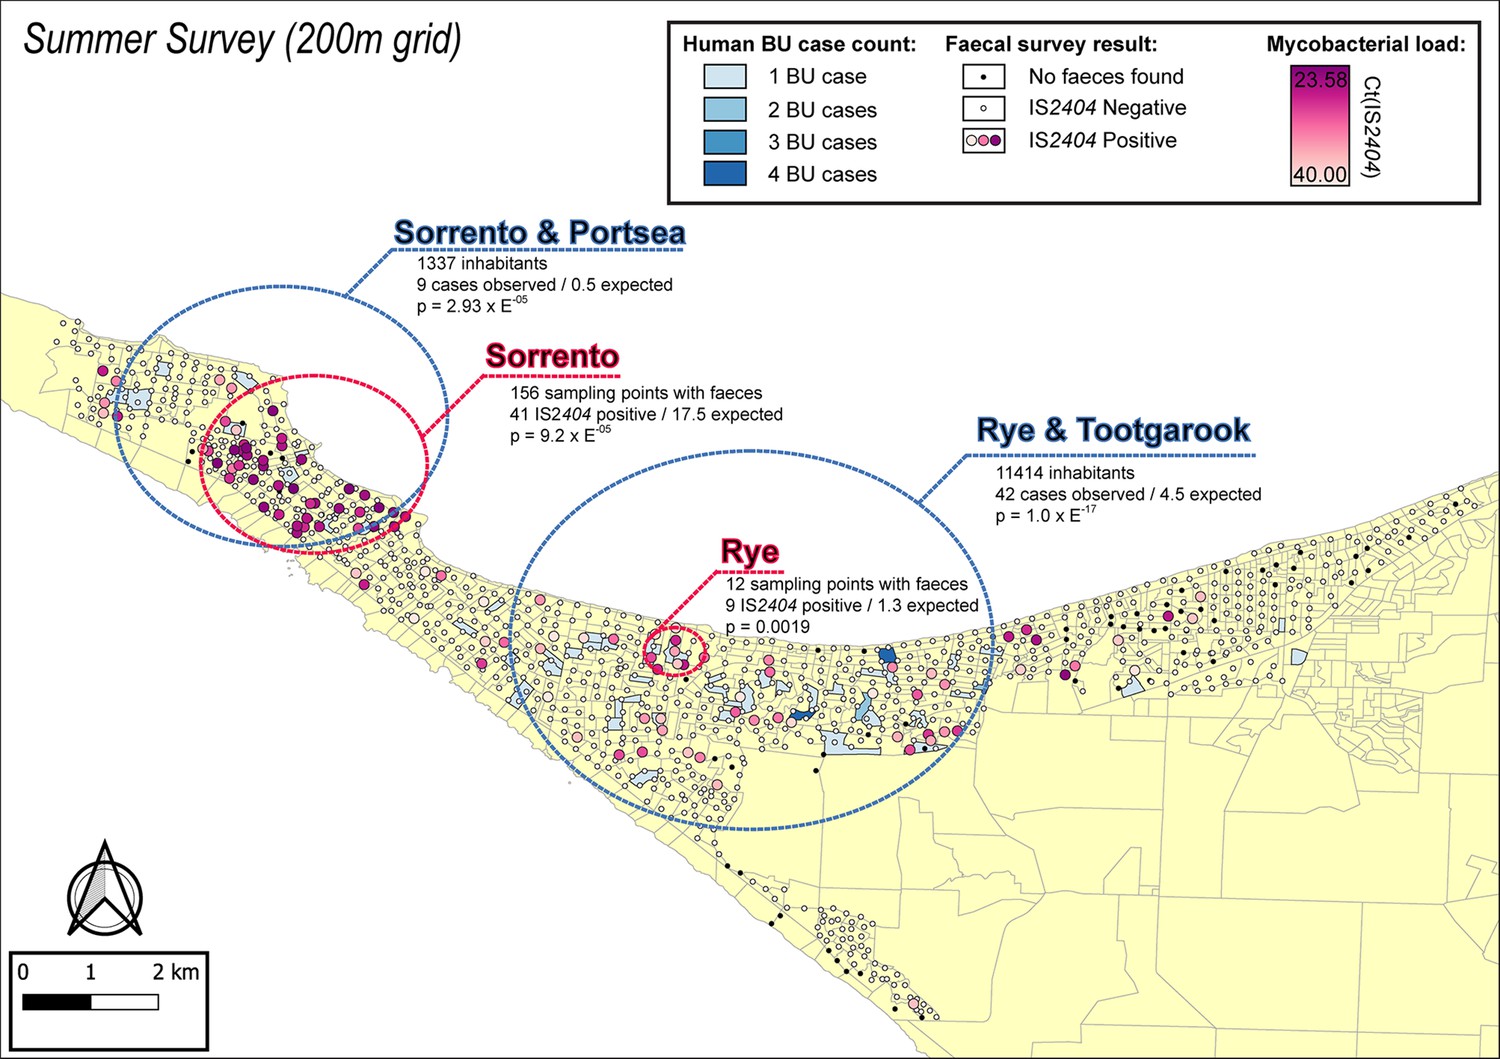
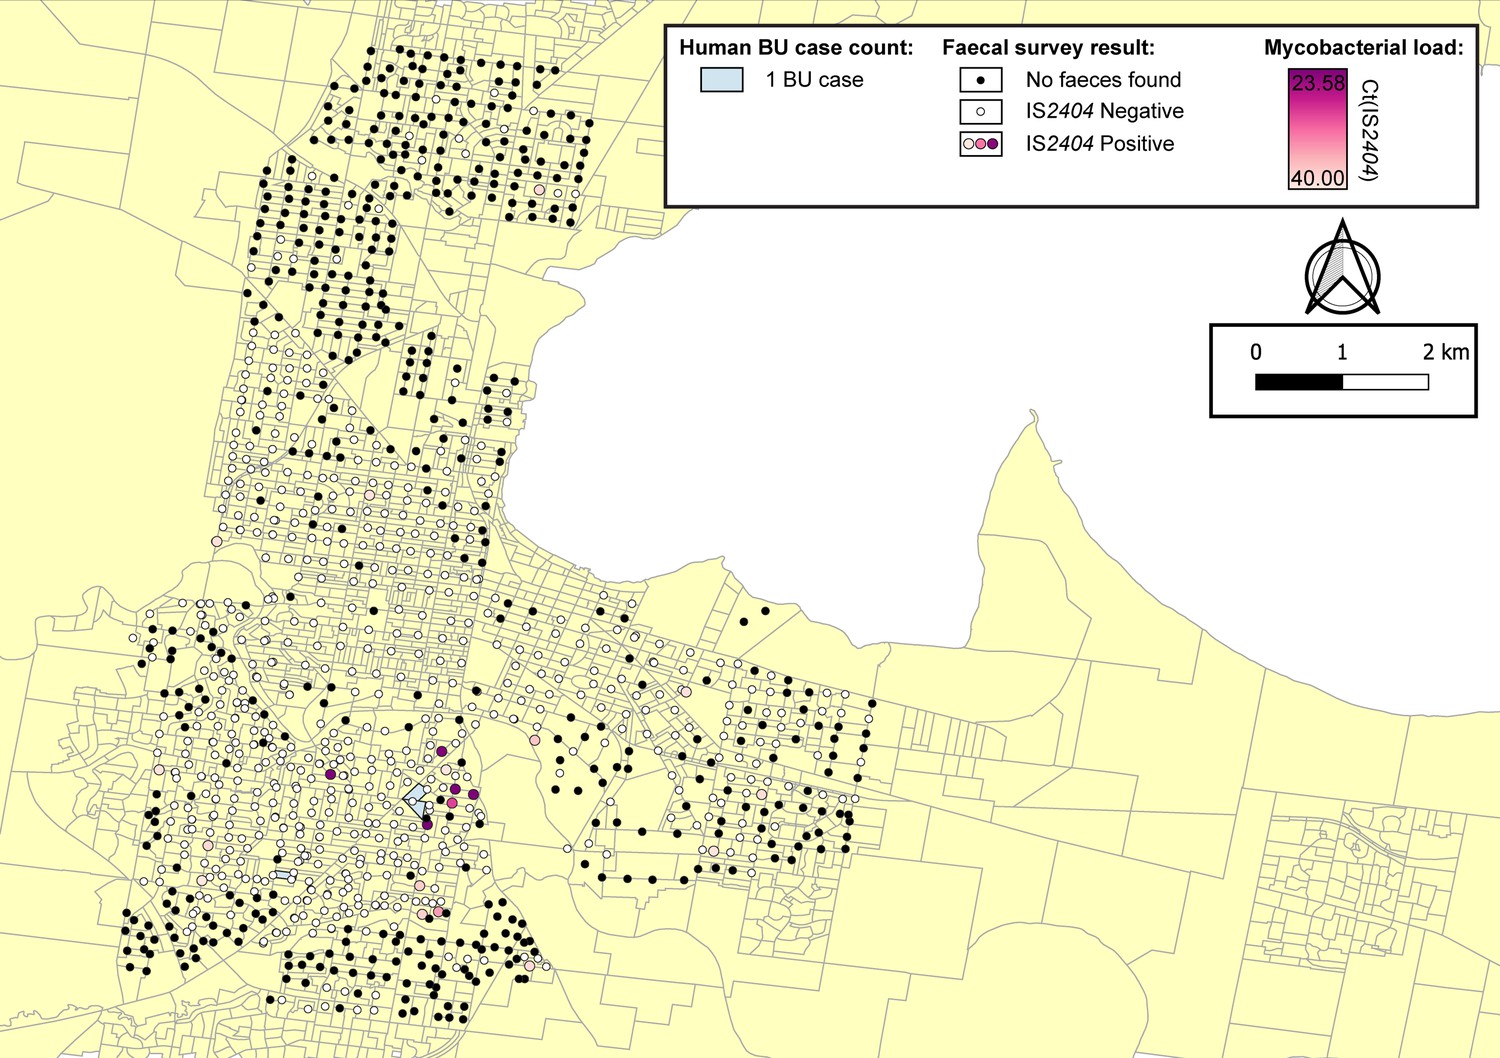
Geographical surveillance of M. ulcerans in the Mornington Peninsula during the southern hemisphere’s summer.
The distribution of points where possum excreta was sampled along a 200 m grid pattern is presented alongside with IS2404 molecular screening results. The pink to purple color gradient visualizes inferred mycobacterial loads in analyzed excreta as estimated from IS2404 cycle thresholds. The dashed red circles represent significant (p<0.005) non-random clustering of IS2404 positive possum excreta identified with spatial scan statistics. All Buruli ulcer (BU) patients notified to the Department of Health (DH) with an inferred exposure time that overlapped with the excreta survey organized during summer are tabulated here by mesh block. A gradient is used to illustrate BU case counts per mesh block. The dashed blue circles represent geographical areas with higher rates of BU than would be expected if the risk of contracting BU was evenly distributed across the Peninsula.
Figure 2—figure supplement 1
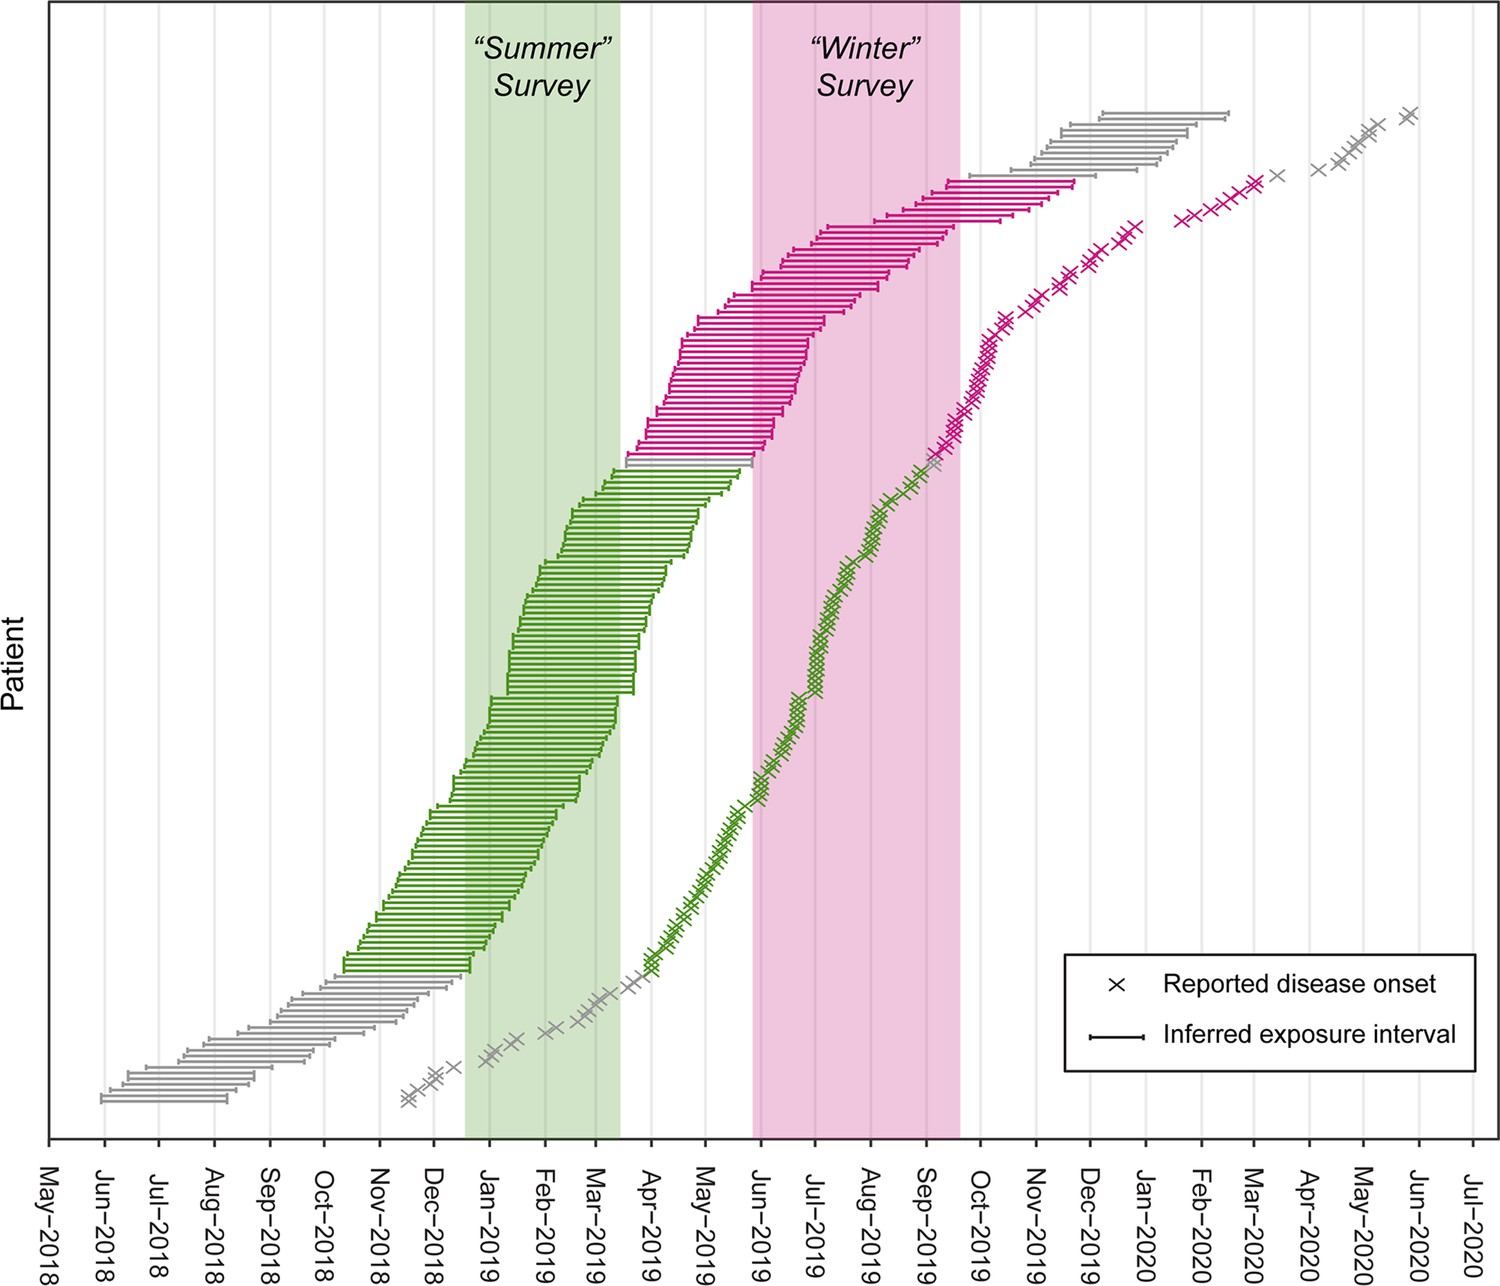
Selection of two populations of Buruli ulcer (BU) patients with exposure intervals that aligned with the excreta possum surveys organized during the southern hemispheres’ summer and winter.
The two populations comprise BU patients notified to the Victorian Department of Health (DH) who resided in or visited the Mornington Peninsula and had not reported recent (<12 months) contact with any other known BU endemic areas in the state. The reported onset of disease was used to infer the exposure interval during which patients were likely infected based on the mean incubation period of BU in Victoria of 143 days (IQR 101–171) (Loftus et al., 2018).
Figure 3 with 1 supplement

Geographical surveillance of M. ulcerans in the Mornington Peninsula during the southern hemisphere’s winter.
The locations where the standardized roadside collection of possum excreta was organized are illustrated alongside with IS2404 molecular screening results. The winter survey was performed along a 200 m grid pattern although three limited regions were additionally sampled at higher resolution along a 50 m grid (detailed in panel B). All Buruli ulcer (BU) patients notified to the Department of Health (DH) with an inferred exposure time that overlapped with the excreta survey organized during winter are tabulated here by mesh block. The dashed circles represent geographical areas with higher rates of IS2404-positive possum excreta (red) or BU disease in humans (blue).
Figure 3—figure supplement 1
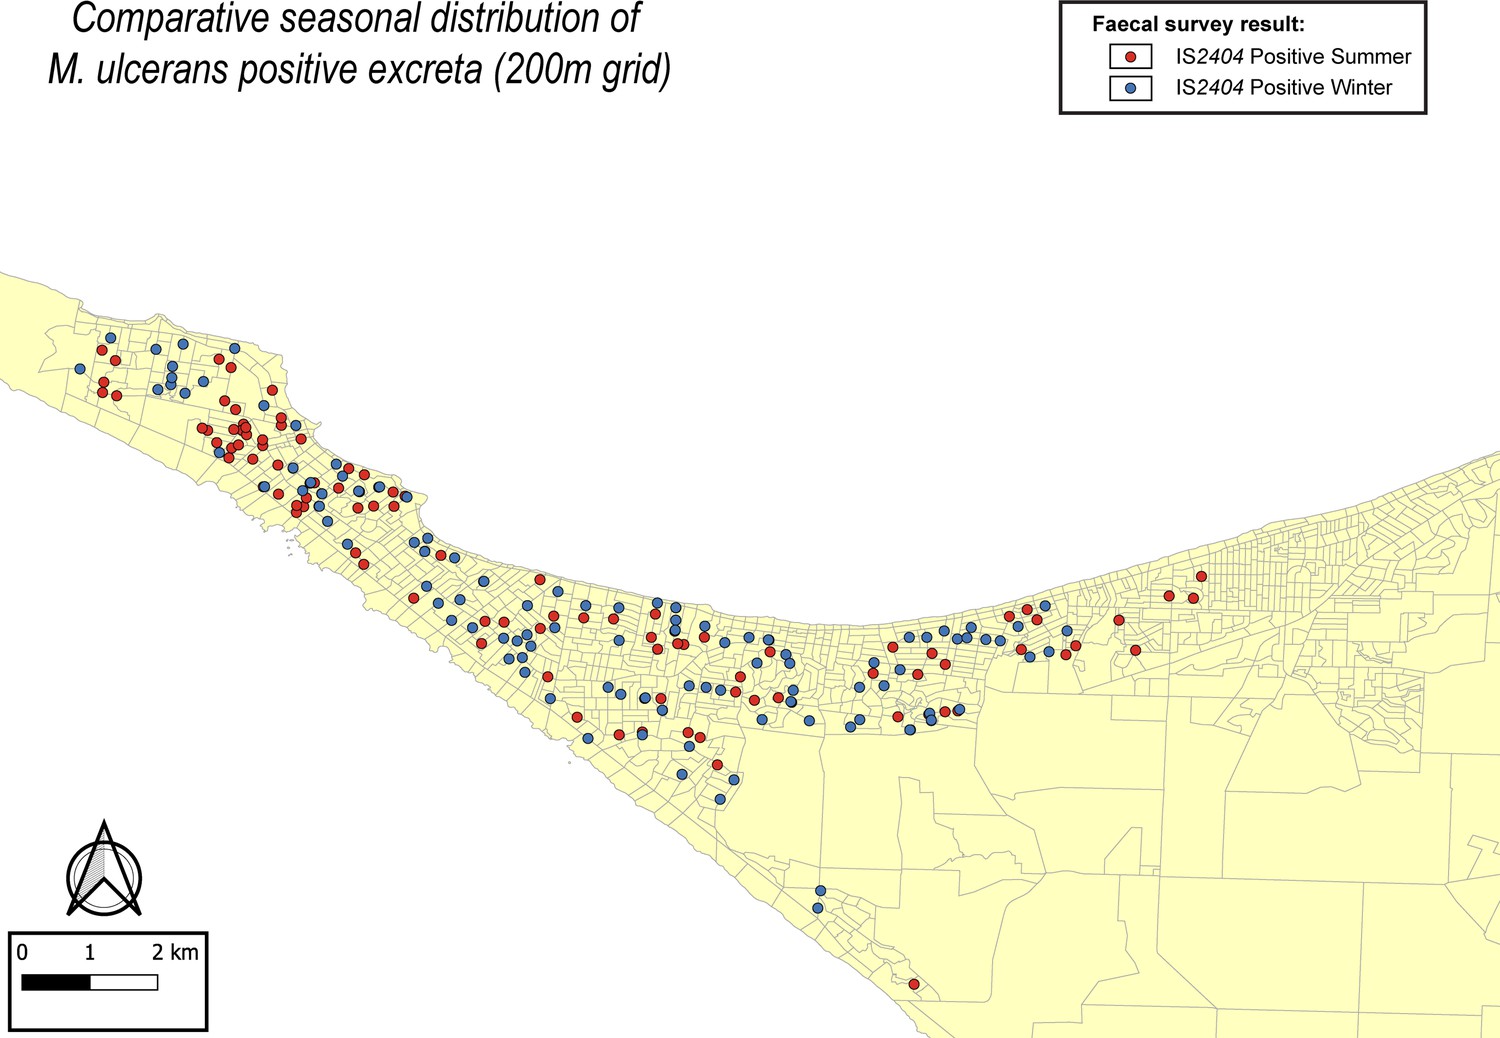
Comparative seasonal distribution of M. ulcerans in the Mornington Peninsula during the southern hemisphere’s summer and winter.
The distribution of points where IS2404 positive possum excreta was sampled along the 200 m sampling grid pattern is presented.
Figure 4 with 1 supplement
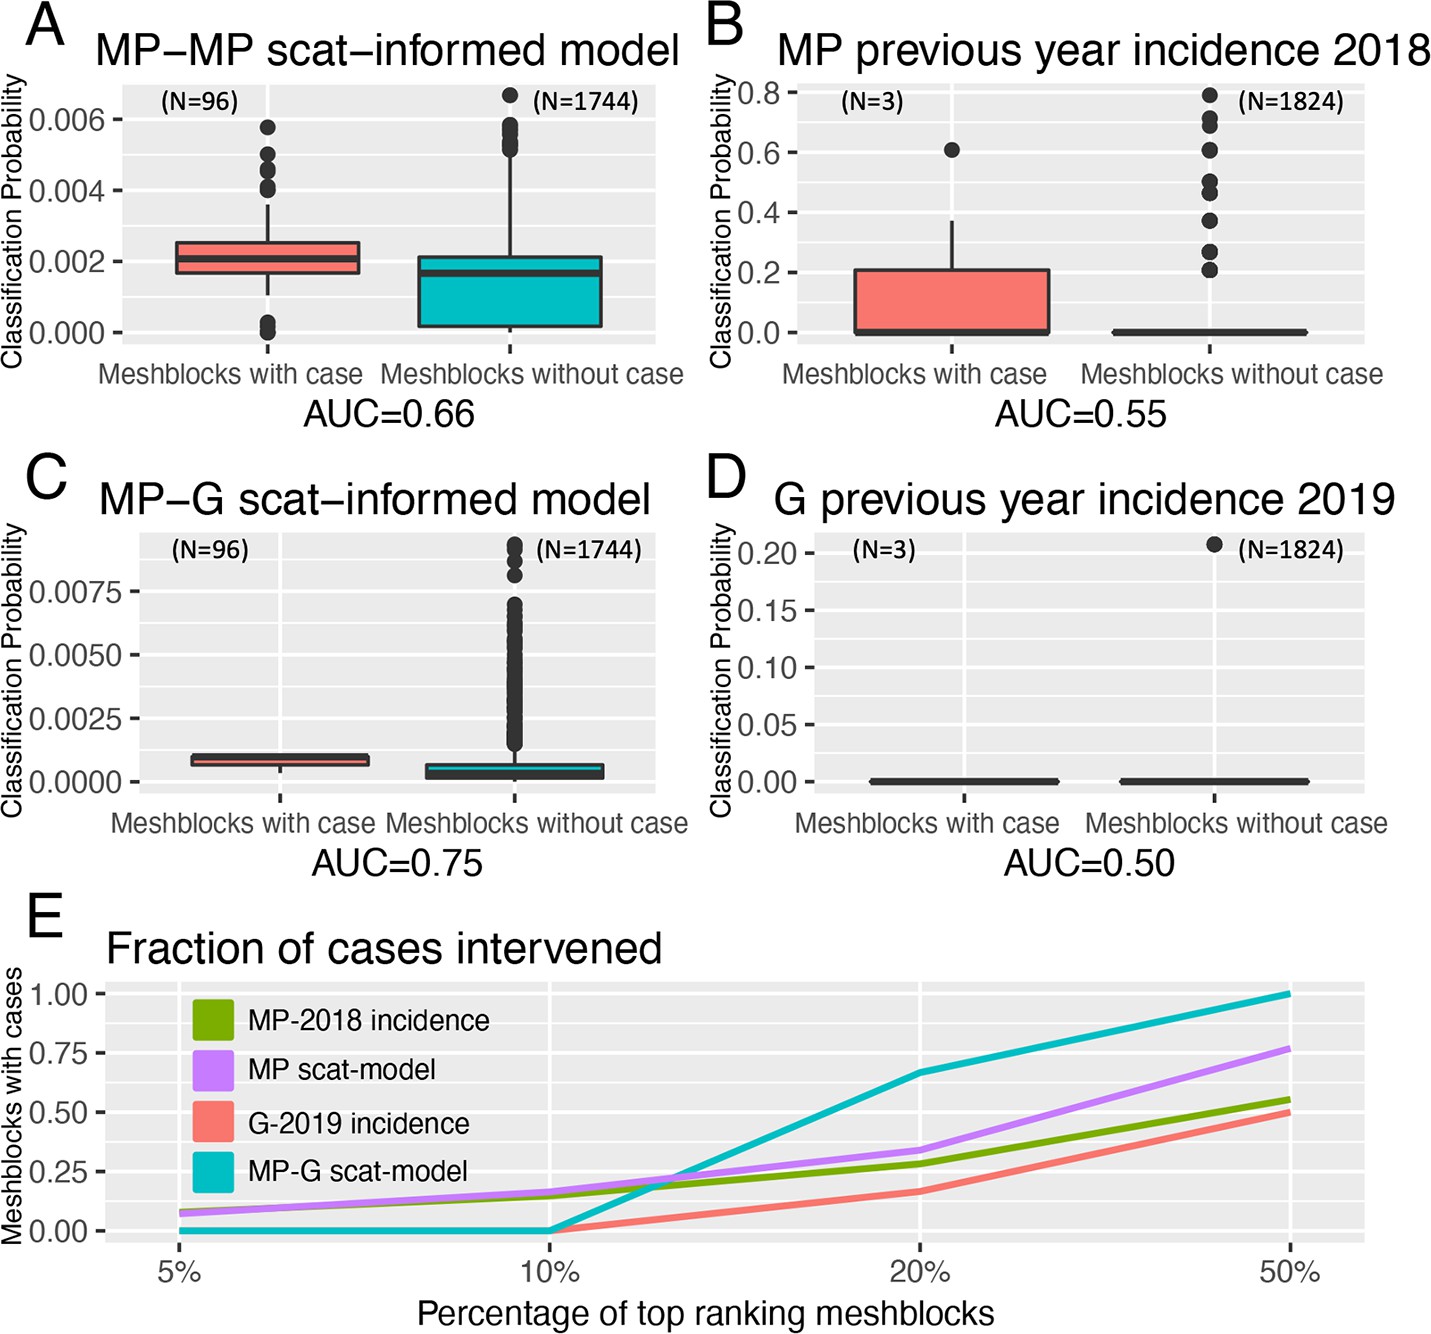
Statistical modeling approaches to prospectively predict the likelihood that a mesh block will contain a Buruli ulcer (BU) case.
Mornington Peninsula and Geelong have been abbreviated as (MP) and (G), respectively. All paired boxplots show the predicted probabilities for mesh blocks with a case (red) and mesh blocks without a case (blue) and the area-under-the-curve (AUC) value below each graph. (A) Paired boxplot of the Mornington Peninsula excreta-informed model. (B) Paired boxplot of the Mornington Peninsula excreta-informed model when predicting on the Geelong data. (C) Paired boxplot of the Mornington Peninsula previous year’s incidence (2018) null model. (D) Paired boxplot of the Geelong previous year’s incidence (2019) null model. All paired boxplots show the median and interquartile range (E) Ranked performance of all predictive models. Ranking cutoff intervals included the top 5%, 10%, 20%, and 50% of mesh blocks, ordered by their declining predicted class probabilities.
Figure 4—figure supplement 1
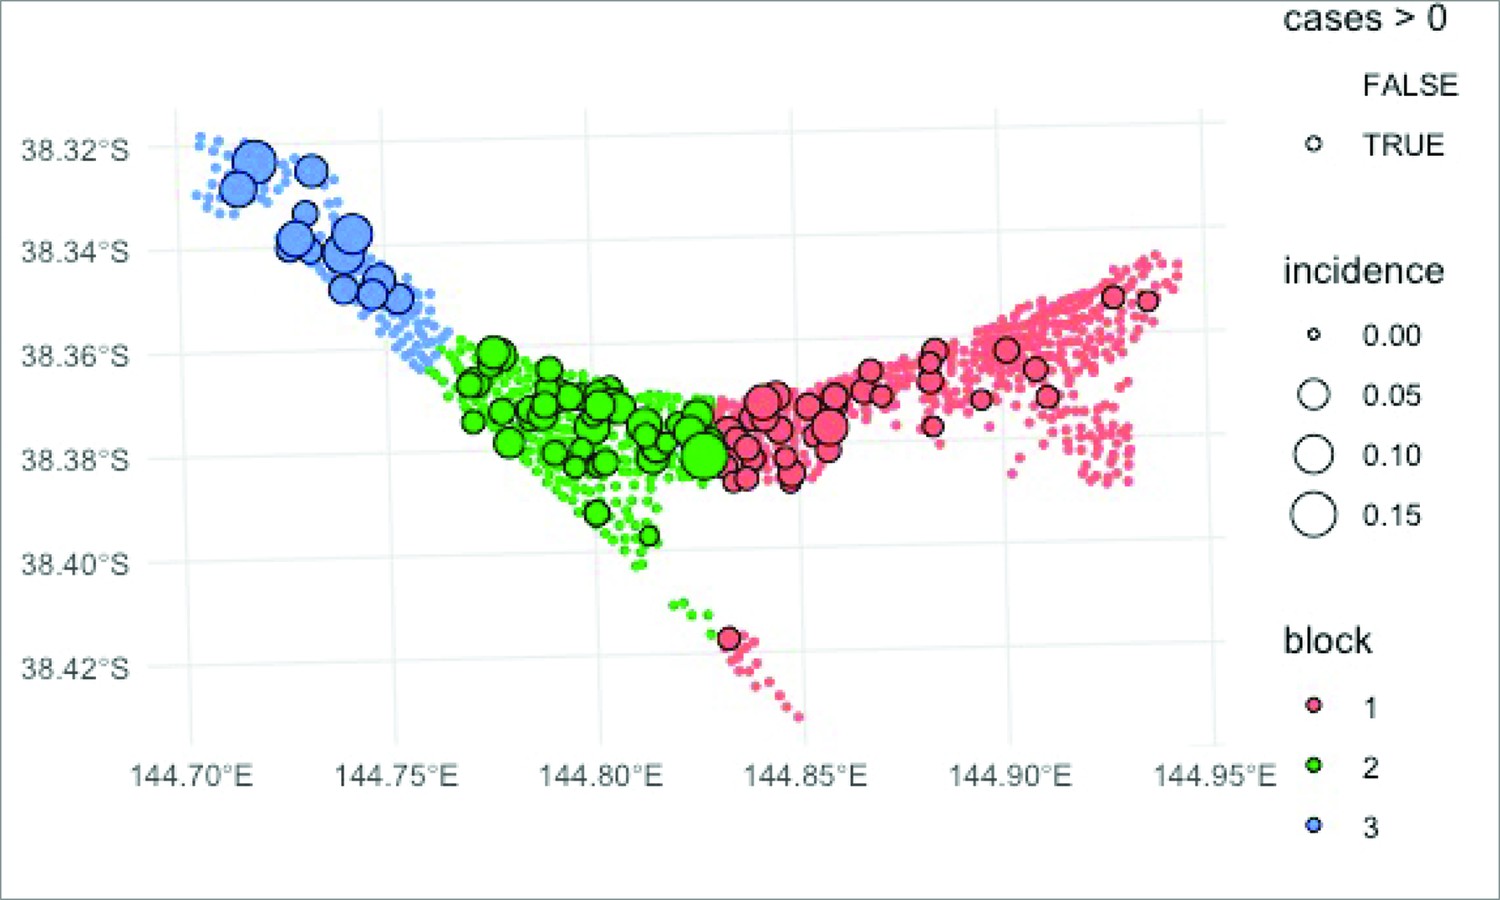
Spatial block cross-validation approach.
The mesh block dataset was split into three spatially contiguous regions, shown in blue, green, and red. The statistical model was fitted on each 2/3 of the data from two regions to predict the probability of observing one or more Buruli ulcer (BU) cases in the remaining 1/3 of the data from the third region. This approach was used to validate the predictive ability of the statistical model using the excreta survey data from the Mornington Peninsula region.
Figure 5 with 1 supplement
Geographical surveillance of M. ulcerans in the Geelong region.
The distribution of points where possum excreta was sampled along a 200 m grid pattern is presented alongside with IS2404 molecular screening results. The pink to purple color gradient visualizes inferred mycobacterial loads in analyzed excreta as estimated from IS2404 real-time PCR results. All BU patients were notified to the Department of Health (DH) with an inferred exposure time that overlapped with the Geelong excreta survey organized between January 16, 2020 and April 28, 2020 tabulated here by mesh block. M. ulcerans DNA was detected by IS2404 real-time PCR in 21 of the 661 (3.2%) excreta specimens (Table 4). As observed with the Mornington Peninsula survey, Ringtail possum excreta was more frequently found than Brushtail possum excreta but the proportion IS2404-positive was not significantly different (p=1, Fisher’s exact test) (Table 4).
Figure 5—figure supplement 1
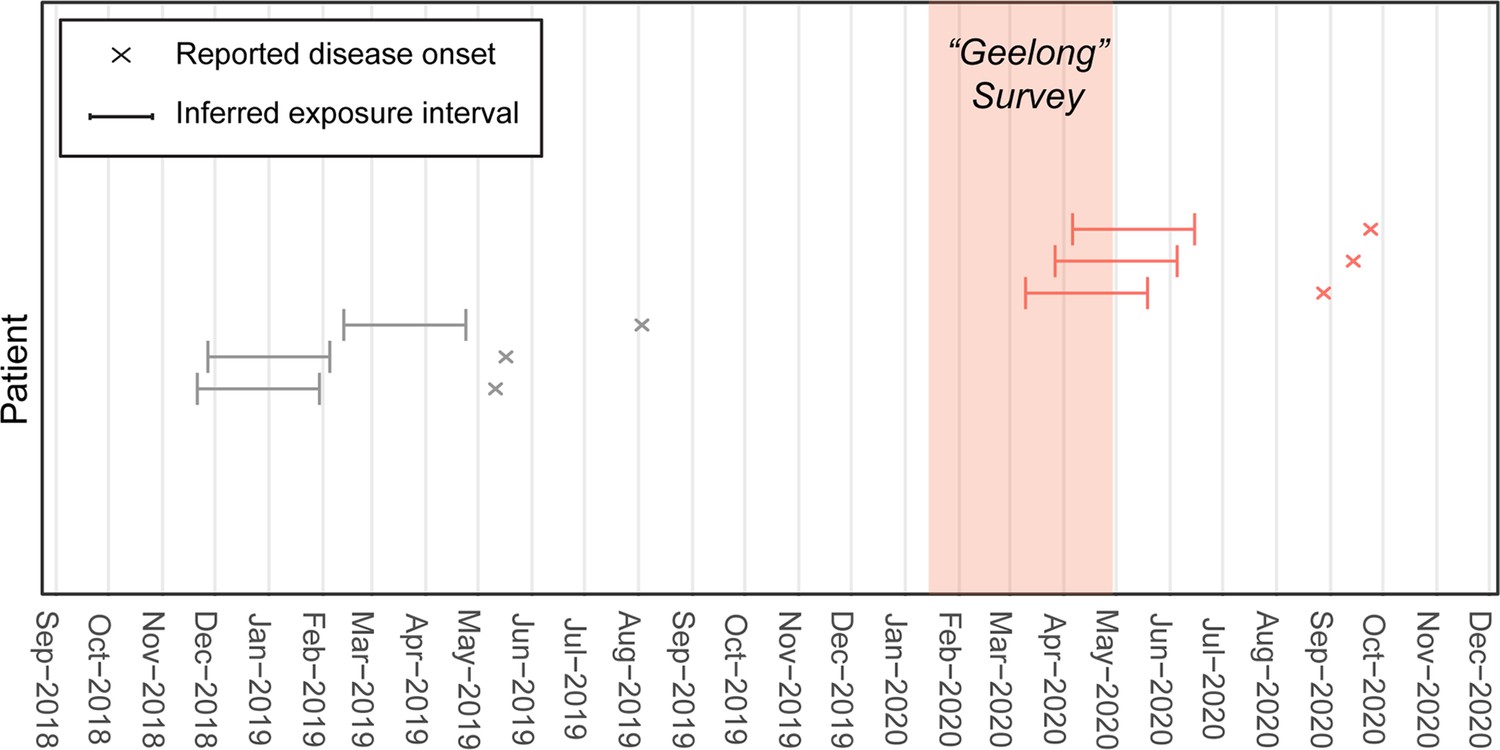
Population of Buruli ulcer (BU) patients with exposure intervals that aligned with the Geelong excreta possum survey organized between January 16 and April 28, 2020.
The population comprises BU patients notified to the Victorian Department of Health (DH) who resided in or visited the Geelong area and had not reported recent (<12 months) contact with any other known BU endemic areas in the state. The reported onset of disease was used to infer the exposure interval during which patients were likely infected based on the mean incubation period of BU in Victoria of 143 days (IQR 101–171) (Loftus et al., 2018).
Figure 6
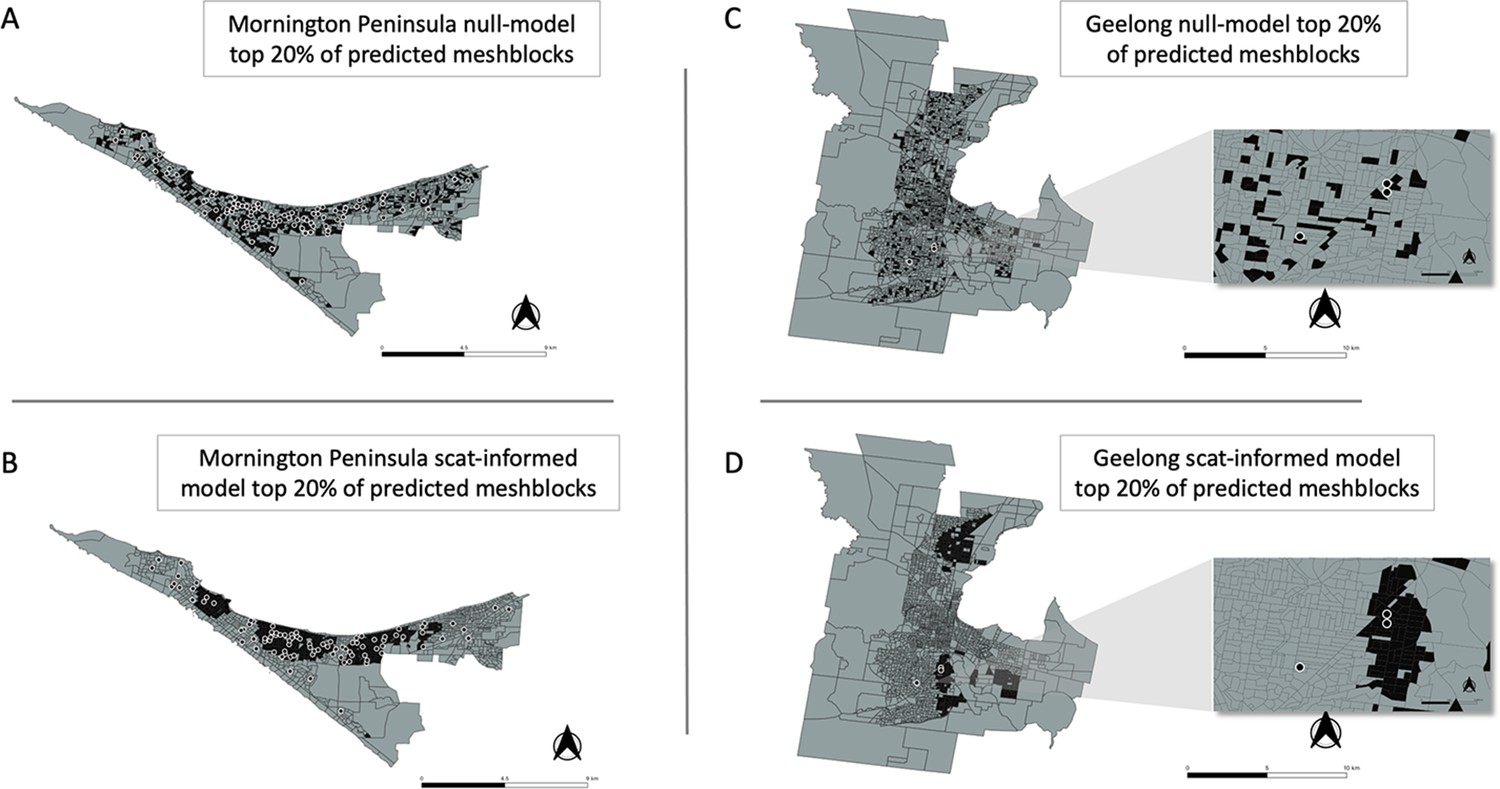
Geographical distribution of the top 20% of probability-ranked mesh blocks for all excreta-informed and null models.
Black indicates mesh blocks in the top 20% of probability-ranked results while grey indicates mesh blocks in the bottom 80%. Black circles with white borders indicate location of confirmed BU cases that occurred within the transmission window following the excreta sampling. (A) Mornington Peninsula null-model top 20% mesh block predictions. (B) Mornington Peninsula excreta-informed model top 20% mesh block predictions. (C) Geelong null-model top 20% mesh block predictions. (D) Geelong excreta-informed model top 20% mesh block predictions. Insets show zoom-in of mesh blocks where Buruli ulcer (BU) cases occurred.
Tables
Table 1
Overview of the Mornington Peninsula excreta surveys across two seasons and M. ulcerans IS2404 PCR screening results.
| Season | Possum species | No. of samples positive | No. of samples tested | Positivity rate | Sites with no excreta found |
|---|---|---|---|---|---|
| Summer | 111 | 987 | 11% | 58 | |
| Ringtail possum | 110 | 947 | 13% | ||
| Brushtail possum | 1 | 40 | 3% | ||
| Winter | 199 | 1,295 | 15% | 62 | |
| Ringtail possum | 192 | 1,237 | 16% | ||
| Brushtail possum | 7 | 58 | 12% |
Table 2
Details of geographical clusters with high rates of IS2404-positive possum excreta identified in SaTScan.
LLR = Log-Likelihood Ratio.
| Survey | Approx. location | Cluster radius | # sampling locations | # IS2404 POS samples observed | # IS2404 POS samples expected | LLR | p-value |
|---|---|---|---|---|---|---|---|
| Summer | Sorrento | 1.7 km | 156 | 41 | 17.5 | 17.052 | 9.20E-05 |
| Summer | Rye | 0.4 km | 13 | 9 | 1.3 | 13.583 | 1.90E-03 |
| Winter | Rye | 0.6 km | 148 | 53 | 22.7 | 21.800 | 1.27E-06 |
Table 3
Details of geographical clusters with high Buruli ulcer (BU) incidence identified in SaTScan.
MB = mesh block, LLR = Log-Likelihood Ratio.
| Survey | Approx. location | Cluster radius | # MB centroids | Cluster census population | BU cases observed | BU cases expected | LLR | p-value |
|---|---|---|---|---|---|---|---|---|
| Summer | Sorrento & Portsea | 2.4 km | 140 | 1,337 | 9 | 0.5 | 17.749 | 2.94E-05 |
| Summer | Rye & Tootgarook | 3.6 km | 408 | 11,414 | 42 | 4.5 | 75.087 | 1.00E-17 |
| Winter | Rye & Tootgarook | 3.6 km | 383 | 11,038 | 20 | 2.7 | 28.770 | 3.05E-09 |
Table 4
Geelong excreta survey results summary.
| Dates | Possum species | No. of samples positive | No. of samples tested | Positivity rate | Sites with no excreta found |
|---|---|---|---|---|---|
| January- April 2020 | 21 | 661 | 3% | 467 | |
| Ringtail possum | 19 | 577 | 3% | ||
| Brushtail possum | 2 | 84 | 2% |
Additional files
-
MDAR checklist
- https://cdn.elifesciences.org/articles/84983/elife-84983-mdarchecklist1-v2.docx
-
Supplementary file 1
Impact on model performance by expanding the exposure window.
- https://cdn.elifesciences.org/articles/84983/elife-84983-supp1-v2.docx
Download links
A two-part list of links to download the article, or parts of the article, in various formats.
Downloads (link to download the article as PDF)
Open citations (links to open the citations from this article in various online reference manager services)
Cite this article (links to download the citations from this article in formats compatible with various reference manager tools)
Statistical modeling based on structured surveys of Australian native possum excreta harboring Mycobacterium ulcerans predicts Buruli ulcer occurrence in humans
eLife 12:e84983.
https://doi.org/10.7554/eLife.84983


