Nitrogenase resurrection and the evolution of a singular enzymatic mechanism
- Department of Bacteriology, University of Wisconsin–Madison, United States
- Department of Chemistry and Biochemistry, Utah State University, United States
Figures
Figure 1
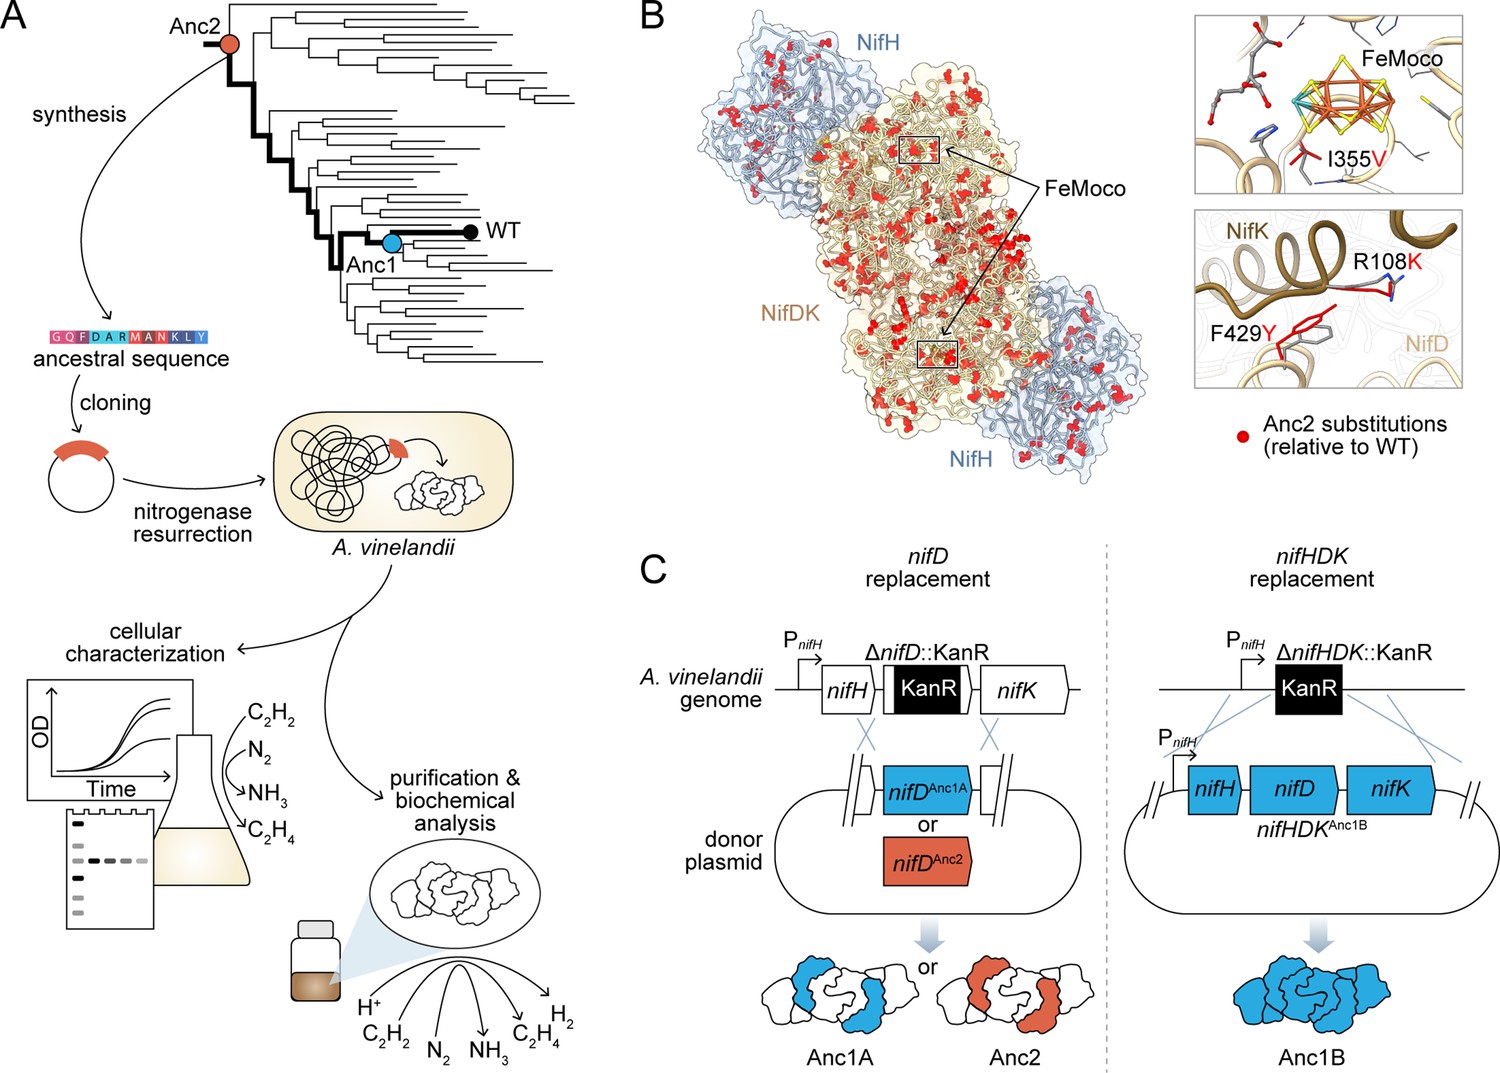
Engineering strategy for ancestral nitrogenase resurrection.
(A) Experimental pipeline for nitrogenase resurrection in A. vinelandii and subsequent characterization, as described in the main text. (B) Structural overview of ancestral nitrogenases reconstructed in this study. Homology models (template PDB 1M34) of Anc1B NifH and NifDK proteins are shown with ancestral substitutions (relative to WT) highlighted in red. Select substitutions at relatively conserved sites in proximity to FeMoco (NifD, I355V) and the NifD:NifK interface (NifD, F429Y; NifK, R108K) are displayed in the insets. (C) Parallel genome engineering strategies were executed in this study, involving both ancestral replacement of only nifD (Anc1A and Anc2) and replacement of nifHDK (Anc1B). ‘PnifH’: nifH promoter, ‘KanR’: kanamycin resistance cassette. *Anc1A and Anc1B were each reconstructed from equivalent nodes of alternate phylogenies (see Materials and methods).
Figure 2 with 3 supplements

Phylogenetic and genomic context of resurrected ancestral nitrogenases.
(A) Maximum-likelihood phylogenetic tree from which ancestral nitrogenases were inferred. Extant nodes are colored by microbial host taxonomic diversity. Red box highlights the clade targeted in this study and depicted in (B). Tree shown was used to infer Anc1A and Anc2 sequences (an alternate tree was used for Anc1B inference; see Materials and methods). (B) nif gene cluster complexity within the targeted nitrogenase clade. Presence and absence of each nif gene are indicated by gray and white colors, respectively. Because some homologs for phylogenetic analysis were obtained from organisms lacking fully assembled genomes, the absence of accessory nif genes may result from missing genomic information. (C) Amino acid sequence identity matrix of nitrogenase protein subunits harbored by WT and engineered A. vinelandii strains. (D) Extant and ancestral nitrogenase protein sequence space visualized by machine-learning embeddings, with the resulting dimensionality reduced to two-dimensional space. UMAP dimension axes are in arbitrary units. The field demarcated by dashed lines in the left plot is expanded on the right plot.
Figure 2—figure supplement 1
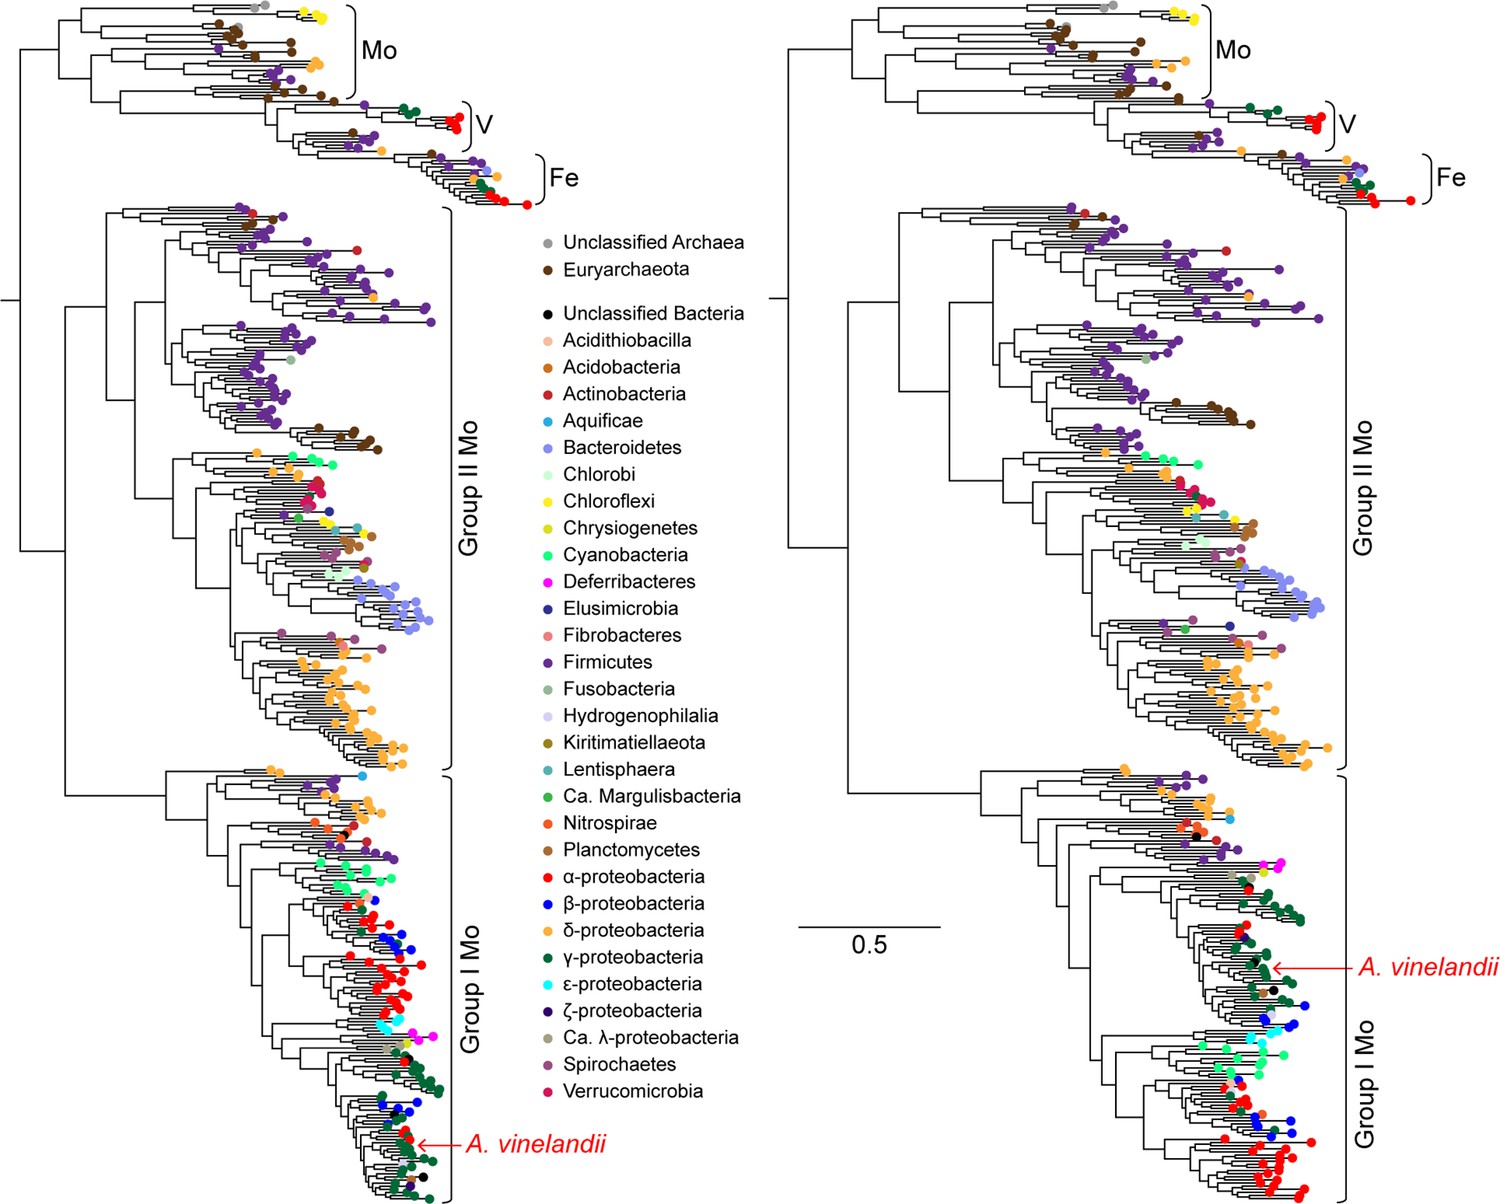
Maximum-likelihood phylogenies built from nitrogenase NifHDK homologs.
Anc1A and Anc2 sequences were inferred from the left tree, and the Anc1B sequence was inferred from the right tree (targeting an equivalent node to Anc1A). Both trees were reconstructed from the same extant sequence dataset (see Materials and methods for a description of phylogenetic reconstruction and ancestral sequence inference methods). Branch length scale indicates amino acid substitutions per site and applies to both trees.
Figure 2—figure supplement 2
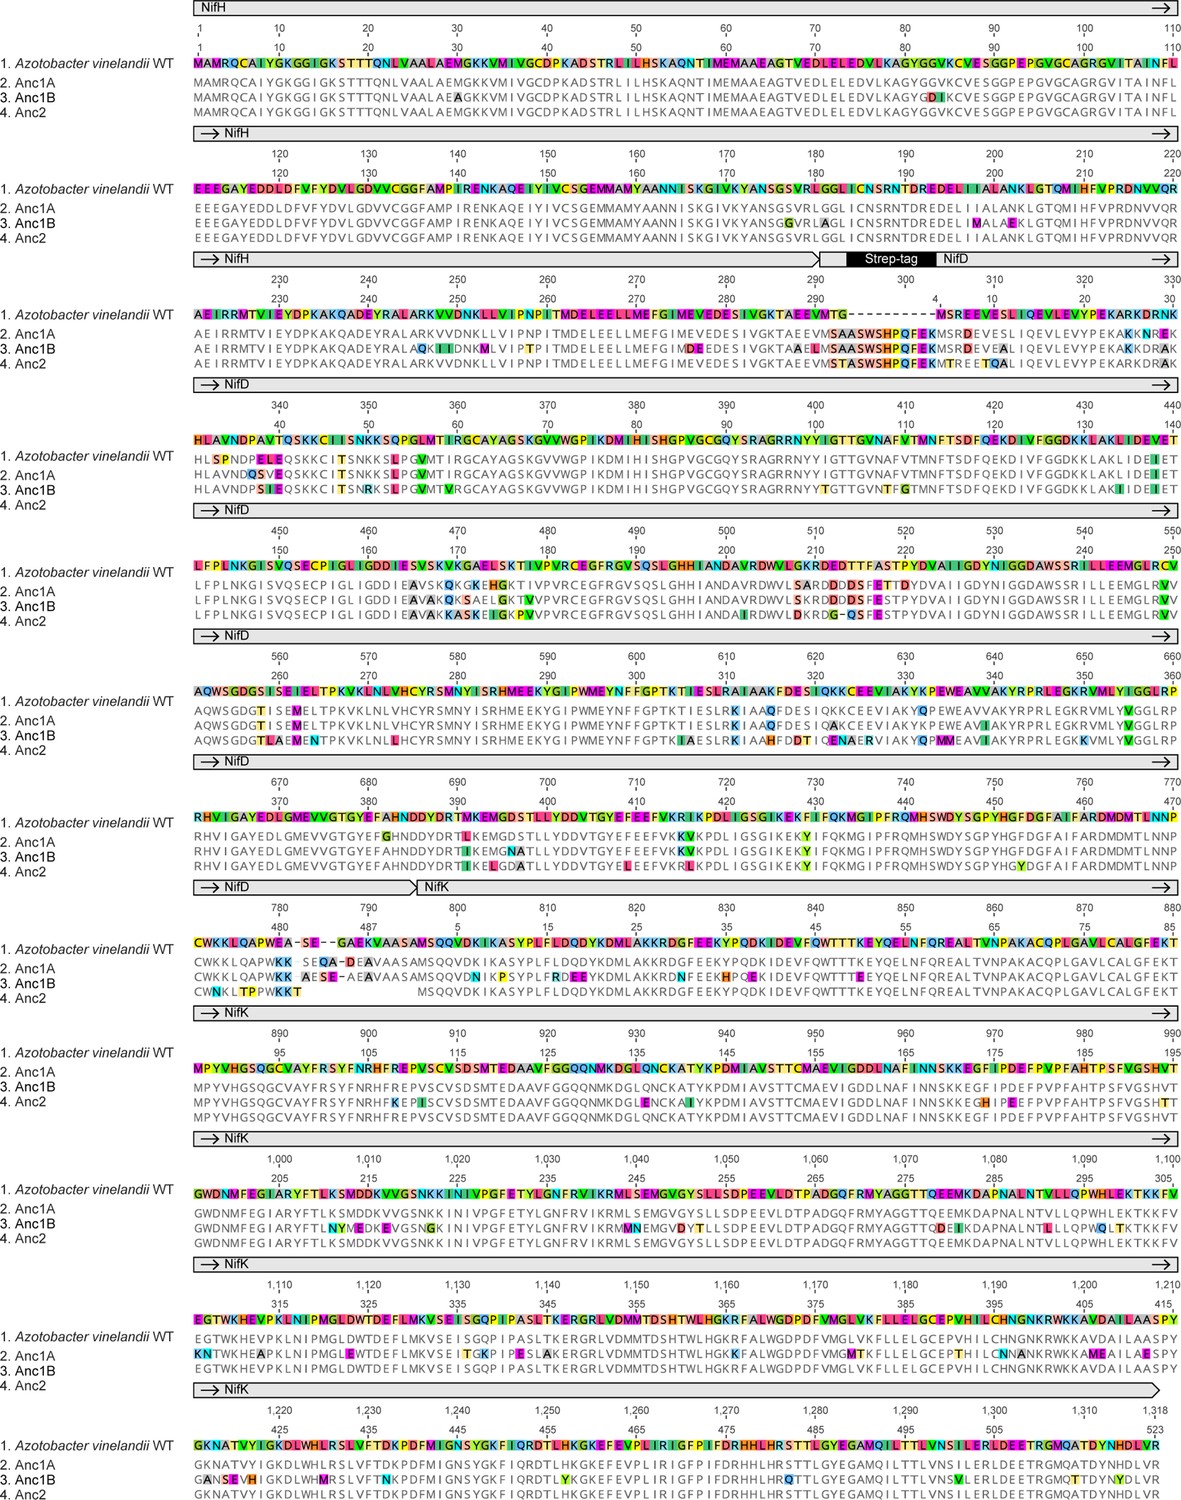
Alignment of WT and ancestral NifHDK nitrogenase proteins.
Figure 2—figure supplement 3
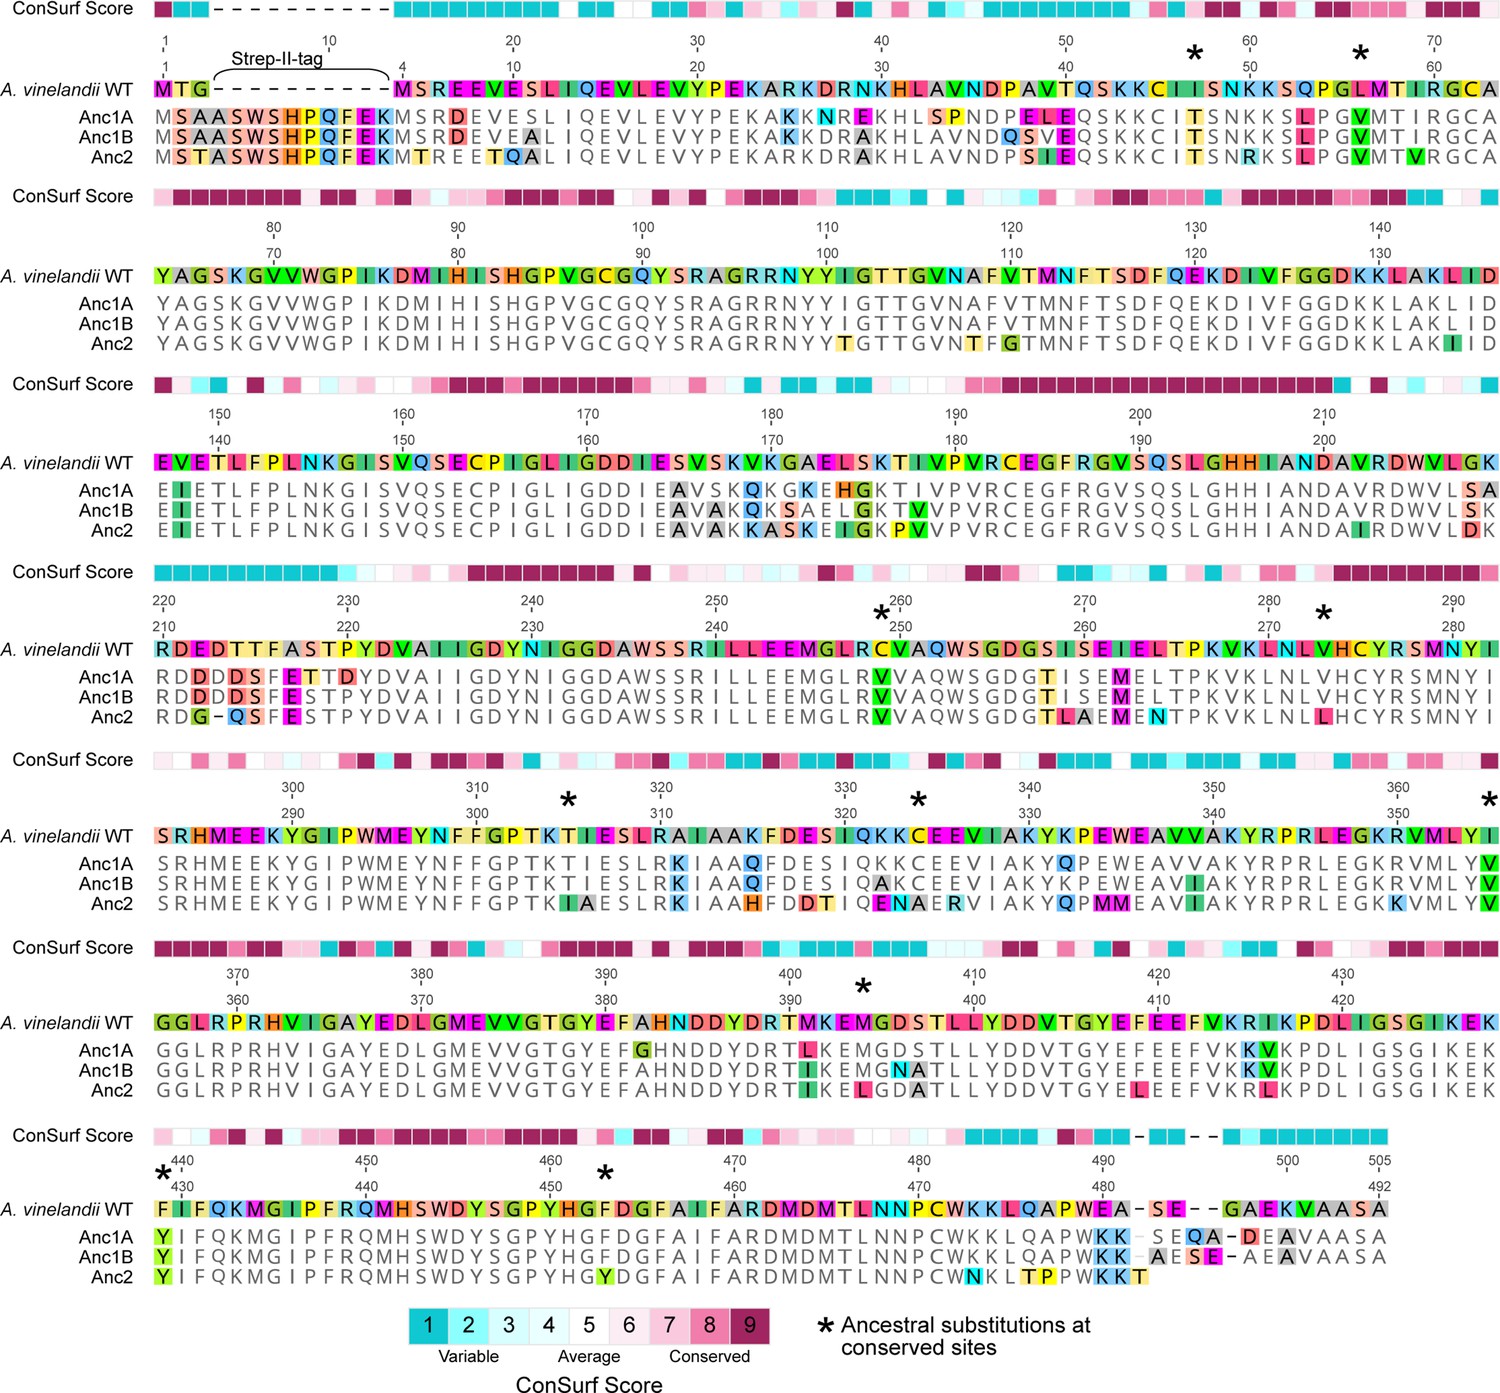
WT and ancestral NifD alignment with sitewise ConSurf conservation scores (see Materials and Methods).
Conserved sites are defined by a ConSurf conservation score >7.
Figure 3

Cellular-level characterization of ancestral nitrogenase activity and expression.
(A) Diazotrophic growth curves of A. vinelandii strains measured by the optical density at 600 nm (‘OD600’). A smoothed curve is shown alongside individual data points obtained from five biological replicates per strain. The non-diazotrophic DJ2278 (ΔnifD) strain was used as a negative control. (B) Mean doubling and midpoint times of A. vinelandii strains, calculated from data in (A). (C) In vivo acetylene (C2H2) reduction rates quantified by the production of ethylene (C2H4). Bars represent the mean of biological replicates (n=3) per strain. (D) Immunodetection and protein quantification of Strep-II-tagged WT (‘WT-Strep,’ strain DJ2102) and ancestral NifD. Top gel image shows Strep-II-tagged NifD proteins detected by anti-Strep antibody and bottom gel image shows total protein stain. Plot displays relative immunodetected NifD signal intensity normalized to total protein intensity and expressed relative to WT. Bars in the plot represent the mean of biological replicates (n=3) per strain. (B–D) Error bars indicate ±1 SD and asterisks indicate p<.01 (one-way ANOVA, post-hoc Tukey HSD) compared to WT or WT-Strep.
-
Figure 3—source data 1
Source Excel file for diazotrophic growth curve data and statistical analyses.
- https://cdn.elifesciences.org/articles/85003/elife-85003-fig3-data1-v2.xlsx
-
Figure 3—source data 2
Source Excel file for in vivo acetylene reduction assay data and statistical analyses.
- https://cdn.elifesciences.org/articles/85003/elife-85003-fig3-data2-v2.xlsx
-
Figure 3—source data 3
Source Excel file for NifD protein densitometry data and statistical analyses.
- https://cdn.elifesciences.org/articles/85003/elife-85003-fig3-data3-v2.xlsx
-
Figure 3—source data 4
Zip archive of Western blot image data (total protein stain, all strains, replicate 1), containing labeled and unlabeled image files.
- https://cdn.elifesciences.org/articles/85003/elife-85003-fig3-data4-v2.zip
-
Figure 3—source data 5
Zip archive of Western blot image data (all strains, replicate 1), containing labeled and unlabeled image files.
- https://cdn.elifesciences.org/articles/85003/elife-85003-fig3-data5-v2.zip
-
Figure 3—source data 6
Zip archive of Western blot image data (total protein stain, all strains, replicate 2), containing labeled and unlabeled image files.
- https://cdn.elifesciences.org/articles/85003/elife-85003-fig3-data6-v2.zip
-
Figure 3—source data 7
Zip archive of Western blot image data (all strains, replicate 2), containing labeled and unlabeled image files.
- https://cdn.elifesciences.org/articles/85003/elife-85003-fig3-data7-v2.zip
-
Figure 3—source data 8
Zip archive of Western blot image data (total protein stain, all strains, replicate 3), containing labeled and unlabeled image files.
- https://cdn.elifesciences.org/articles/85003/elife-85003-fig3-data8-v2.zip
-
Figure 3—source data 9
Zip archive of Western blot image data (all strains, replicate 3), containing labeled and unlabeled image files.
- https://cdn.elifesciences.org/articles/85003/elife-85003-fig3-data9-v2.zip
Figure 4 with 1 supplement
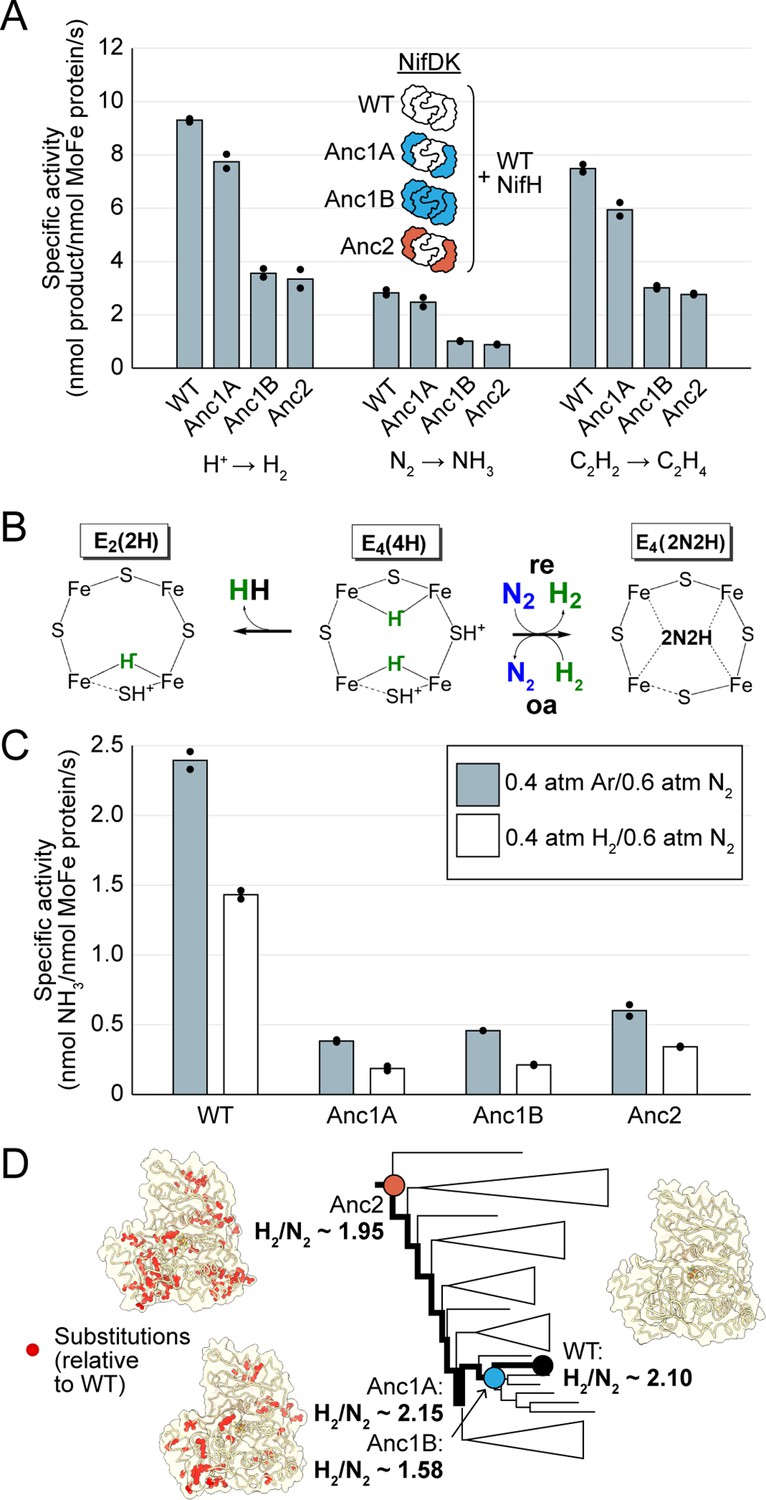
In vitro analyses of ancestral nitrogenase activity profiles and mechanism.
All measurements were obtained from assays using purified NifDK assayed with WT NifH. (A) Specific activities were measured for H+, N2, and C2H2 substrates. (B) Partial schematic of the reductive-elimination N2-reduction mechanism of nitrogenase is shown above, centering on the N2-binding E4(4 H) state of FeMoco (see main text for discussion) (Harris et al., 2019). (C) Inhibition of N2 reduction by H2, evidencing the mechanism illustrated in (B). (D) Catalytic efficiencies of ancestral nitrogenases, described by the ratio of formed H2 to reduced N2 (H2/N2), mapped across the targeted phylogenetic clade. NifD homology models (PDB 1M34 template) are displayed with ancestral substitutions highlighted in red. (A,C) Bars represent the mean of independent experiments (n=2) with individual data points shown as black circles.
-
Figure 4—source data 1
Source Excel file for nitrogenase in vitro activity data.
- https://cdn.elifesciences.org/articles/85003/elife-85003-fig4-data1-v2.xlsx
-
Figure 4—source data 2
Source Excel file for nitrogenase in vitro H2 inhibition data.
- https://cdn.elifesciences.org/articles/85003/elife-85003-fig4-data2-v2.xlsx
Figure 4—figure supplement 1

SDS-PAGE of purified WT and ancestral NifDK proteins.
*NifD and NifK were not separately resolved for Anc2 and Anc1B. Qualitative assessment of band density suggests both subunits migrate together. The presence of both NifD and NifK is inferred based on the observed N2 reduction activity of these fractions together with WT NifH (see Figure 4).
-
Figure 4—figure supplement 1—source data 1
Zip archive of SDS-PAGE image data, containing labeled and unlabeled image files.
- https://cdn.elifesciences.org/articles/85003/elife-85003-fig4-figsupp1-data1-v2.zip
Tables
Key resources table
| Reagent type (species) or resource | Designation | Source or reference | Identifiers | Additional information |
|---|---|---|---|---|
| strain, strain background (A. vinelandii) | DJ | DOI:10.1128/JB.00504–09 | n/a | Dennis Dean, Virginia Tech; Wild-type (WT); Nif+ |
| genetic reagent (A. vinelandii) | DJ2102 | DOI:10.1016/bs.mie.2018.10.007 | n/a | Dennis Dean, Virginia Tech; Strep-tagged WT NifD; Nif+ |
| genetic reagent (A. vinelandii) | DJ2278 | Other | n/a | Dennis Dean, Virginia Tech; ΔnifD::KanR; Nif- |
| genetic reagent (A. vinelandii) | DJ884 | Other | n/a | Dennis Dean, Virginia Tech; nifDR187I mutant; Nif+(slow); overexpresses NifH |
| genetic reagent (A. vinelandii) | AK022 | This paper | n/a | ΔnifHDK::KanR; Nif- |
| genetic reagent (A. vinelandii) | AK013 | This paper | n/a | ‘Anc1A’; ΔnifD::nifDAnc1A; Nif+ |
| genetic reagent (A. vinelandii) | AK023 | This paper | n/a | ‘Anc1B’; ΔnifHDK::nifHDKAnc1B; Nif+ |
| genetic reagent (A. vinelandii) | AK014 | This paper | n/a | ‘Anc2’; ΔnifD::nifDAnc2; Nif+ |
| antibody | StrepMAB-Classic (Mouse monoclonal) | IBA Lifesciences | Cat# 2-1507-001, RRID: AB_513133 | WB (1:5000) |
| recombinant DNA reagent | pAG25 | This paper | n/a | KanR cassette (APH(3’)-I gene)+400 bp nifHDK flanking homology regions, synthesized into XbaI/KpnI sites in pUC19; used to construct strain AK022 from DJ |
| recombinant DNA reagent | pAG13 | This paper | n/a | nifDAnc1A + 400-bp nifD flanking homology regions, synthesized into XbaI/KpnI sites in pUC19; used to construct strain Anc1A from AK022 |
| recombinant DNA reagent | pAG19 | This paper | n/a | nifHDKAnc1B + 400-bp nifHDK flanking homology regions, synthesized into XbaI/KpnI sites in pUC19; used to construct strain Anc1B from AK022 |
| recombinant DNA reagent | pAG14 | This paper | n/a | nifDAnc2 +400 bp nifD flanking homology regions, synthesized into XbaI/KpnI sites in pUC19; used to construct strain Anc2 from AK022 |
| sequence-based reagent | 306_nifH_F | This paper | PCR primers | GCCGAACGTTCAAGTGGAAA |
| sequence-based reagent | 307_nifH_R | This paper | PCR primers | AGAGCCAATCTGCCCTGTC |
| sequence-based reagent | 308_nifD_F | This paper | PCR primers | CACCCGTTACCCGCATATGA |
| sequence-based reagent | 309_nifD_R | This paper | PCR primers | ACTCATCTGTGAACGGCGTT |
| sequence-based reagent | 310_nifK_F | This paper | PCR primers | GCTAACGCCGTTCACAGATG |
| sequence-based reagent | 311_nifK_R | This paper | PCR primers | TCAGTTGGCCTTCGTCGTTG |
| software, algorithm | MAFFT | MAFFT | RRID:SCR_011811 | |
| software, algorithm | trimAl | trimAl | RRID:SCR_017334 | |
| software, algorithm | IQ-TREE | IQ-TREE | RRID:SCR_017254 | |
| software, algorithm | RAxML | RAxML | RRID:SCR_006086 | |
| software, algorithm | PAML | PAML | RRID:SCR_014932 | |
| software, algorithm | MODELLER | MODELLER | RRID:SCR_008395 | |
| software, algorithm | ChimeraX | ChimeraX | RRID:SCR_015872 | |
| software, algorithm | Growthcurver | Growthcurver | n/a | R package |
Additional files
-
Supplementary file 1
Supplementary phylogenetic and genomic engineering information.
(a) Sequence characteristics of ancestral nitrogenase subunits. (b) Host taxa of nitrogenase and outgroup dark-operative protochlorophyllide oxidoreductase homologs included for phylogenetic analysis. (c) Strains and plasmids used in this study. (d) Primers used in this study.
- https://cdn.elifesciences.org/articles/85003/elife-85003-supp1-v2.docx
-
MDAR checklist
- https://cdn.elifesciences.org/articles/85003/elife-85003-mdarchecklist1-v2.pdf
Download links
A two-part list of links to download the article, or parts of the article, in various formats.
Downloads (link to download the article as PDF)
Open citations (links to open the citations from this article in various online reference manager services)
Cite this article (links to download the citations from this article in formats compatible with various reference manager tools)
Nitrogenase resurrection and the evolution of a singular enzymatic mechanism
eLife 12:e85003.
https://doi.org/10.7554/eLife.85003


