Fluorescein-based sensors to purify human α-cells for functional and transcriptomic analyses
- Islet Cell and Regenerative Biology, Joslin Diabetes Center, United States
- Department of Medicine, Beth Israel Deaconess Medical Center, Harvard Medical School, United States
- Harvard Stem Cell Institute, Harvard Medical School, United States
- Chemical Biology and Therapeutics Science Program, Broad Institute of MIT and Harvard, United States
- Divisions of Renal Medicine and Engineering, Brigham and Women’s Hospital, United States
Figures
Figure 1 with 1 supplement
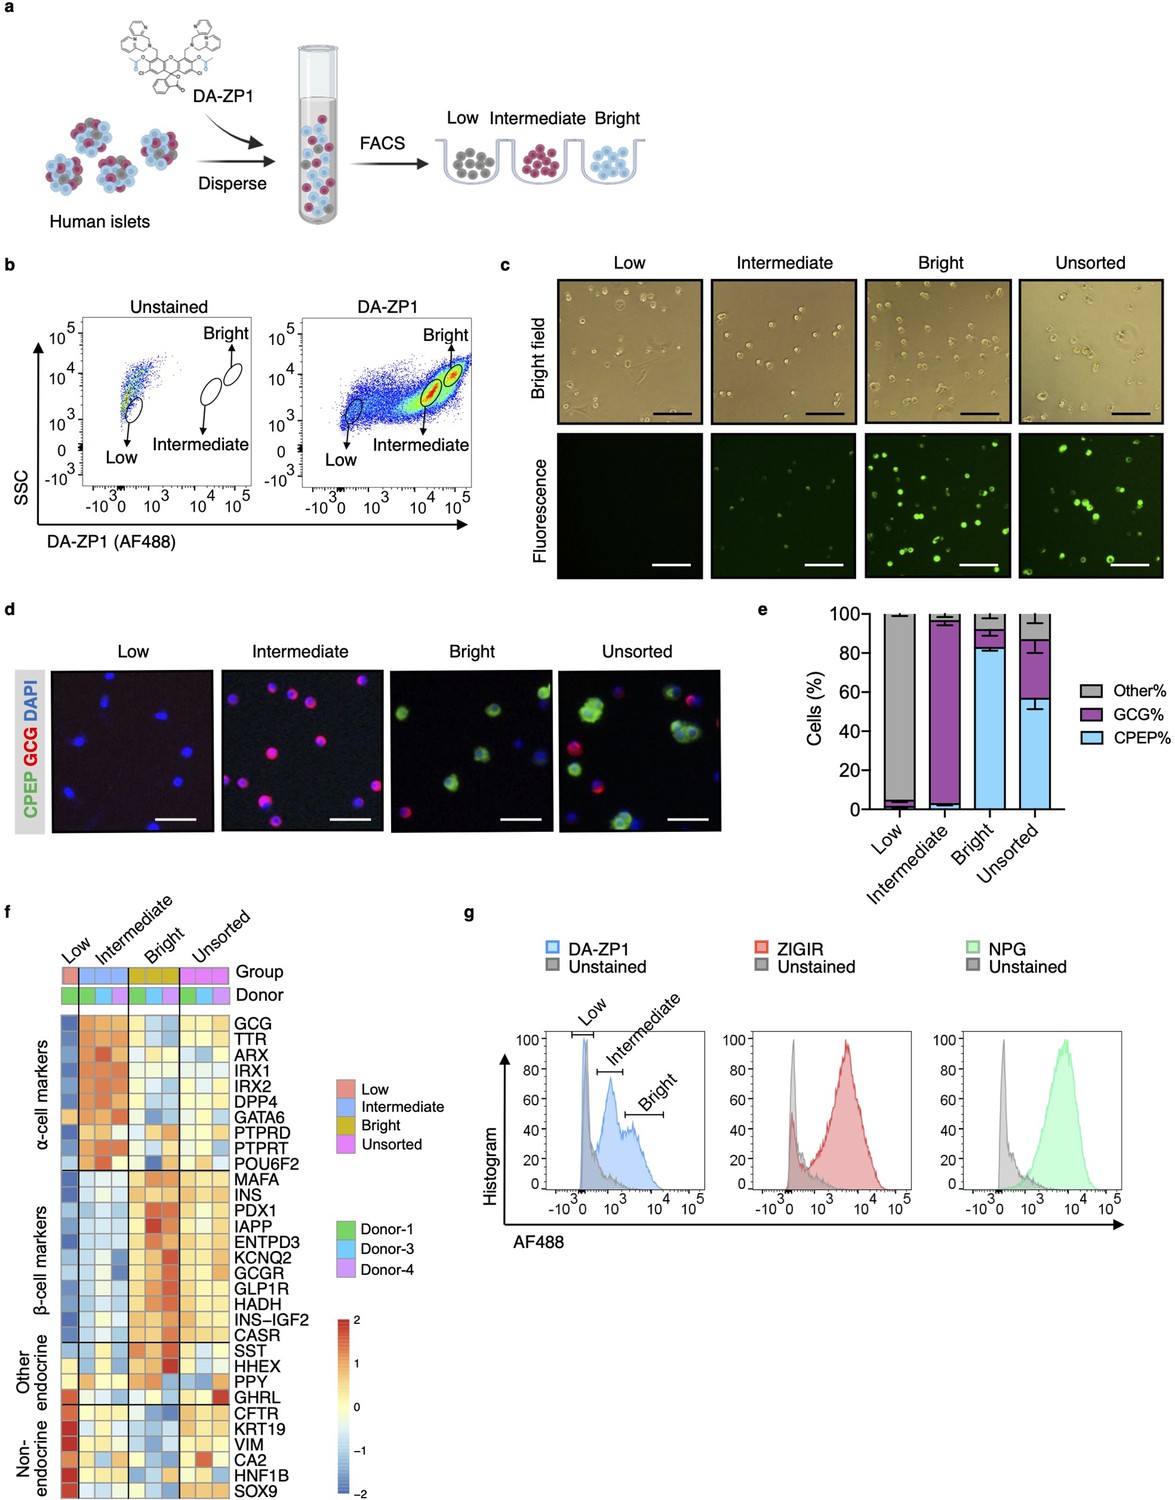
Isolation of live human pancreatic α-cells after staining with diacetylated Zinpyr1 (DA-ZP1) by fluorescence activated cell sorting (FACS).
(a) Experimental outline. (b) Representative FACS plot showing three cell populations with low, intermediate, or bright fluorescence. The plot represents the data collected from Donor-1 islets. Unstained (left) vs DA-ZP1-treated (right) human islets. Gating strategy and the data collected from the other donors (n=4) are given in Figure 1—figure supplement 1. (c) The DA-ZP1 derived green fluorescence is maintained in the next day of sorting in the sorted islet cells. The cells were plated in Matrigel-coated flat-bottom plates. Scale bar, 100 μm. See also Figure 1—figure supplement 1. (d) Representative images of human islet cells after FACS showing C-peptide (green) and glucagon (red) expressing islet cells. Nuclei were stained with DAPI (blue). Scale bar, 50 μm. (e) Quantification of percentage of CPEP+, GCG+, and other cells (CPEP- GCG-) in each cell population. Data are presented as mean values ± s.e.m. n=3 donors. (f) Heatmap showing expression of genes in different cell subsets. n=3 donors. (g) Comparison of other zinc-based dyes with DA-ZP1 by FACS.
Figure 1—figure supplement 1

Gating strategy for isolation of live human pancreatic α-cells.
(a) Starting cell population was determined by SSC-A/FSC-A gating. Single human islet cells were gated according to FSC-A/FSC-W gating. Treatment of the single cells with diacetylated Zinpyr1 (DA-ZP1) resulted in three cell populations with different fluorescence intensity (low, intermediate, and bright). n=5 human islet donors. Donor information is given in Supplementary file 9. (b) Number of live cells collected by fluorescence activated cell sorting (FACS) using 15,000 islet equivalent determined by trypan blue staining. (c) The DA-ZP1 derived green fluorescence is maintained in the next day of sorting in the sorted islet cells. Scale bar, 100 μm.
-
Figure 1—figure supplement 1—source data 1
Number of live cells collected by FACS using 15,000 islet equivalents (IEQs) determined by trypan blue staining.
- https://cdn.elifesciences.org/articles/85056/elife-85056-fig1-figsupp1-data1-v3.xlsx
Figure 2 with 1 supplement
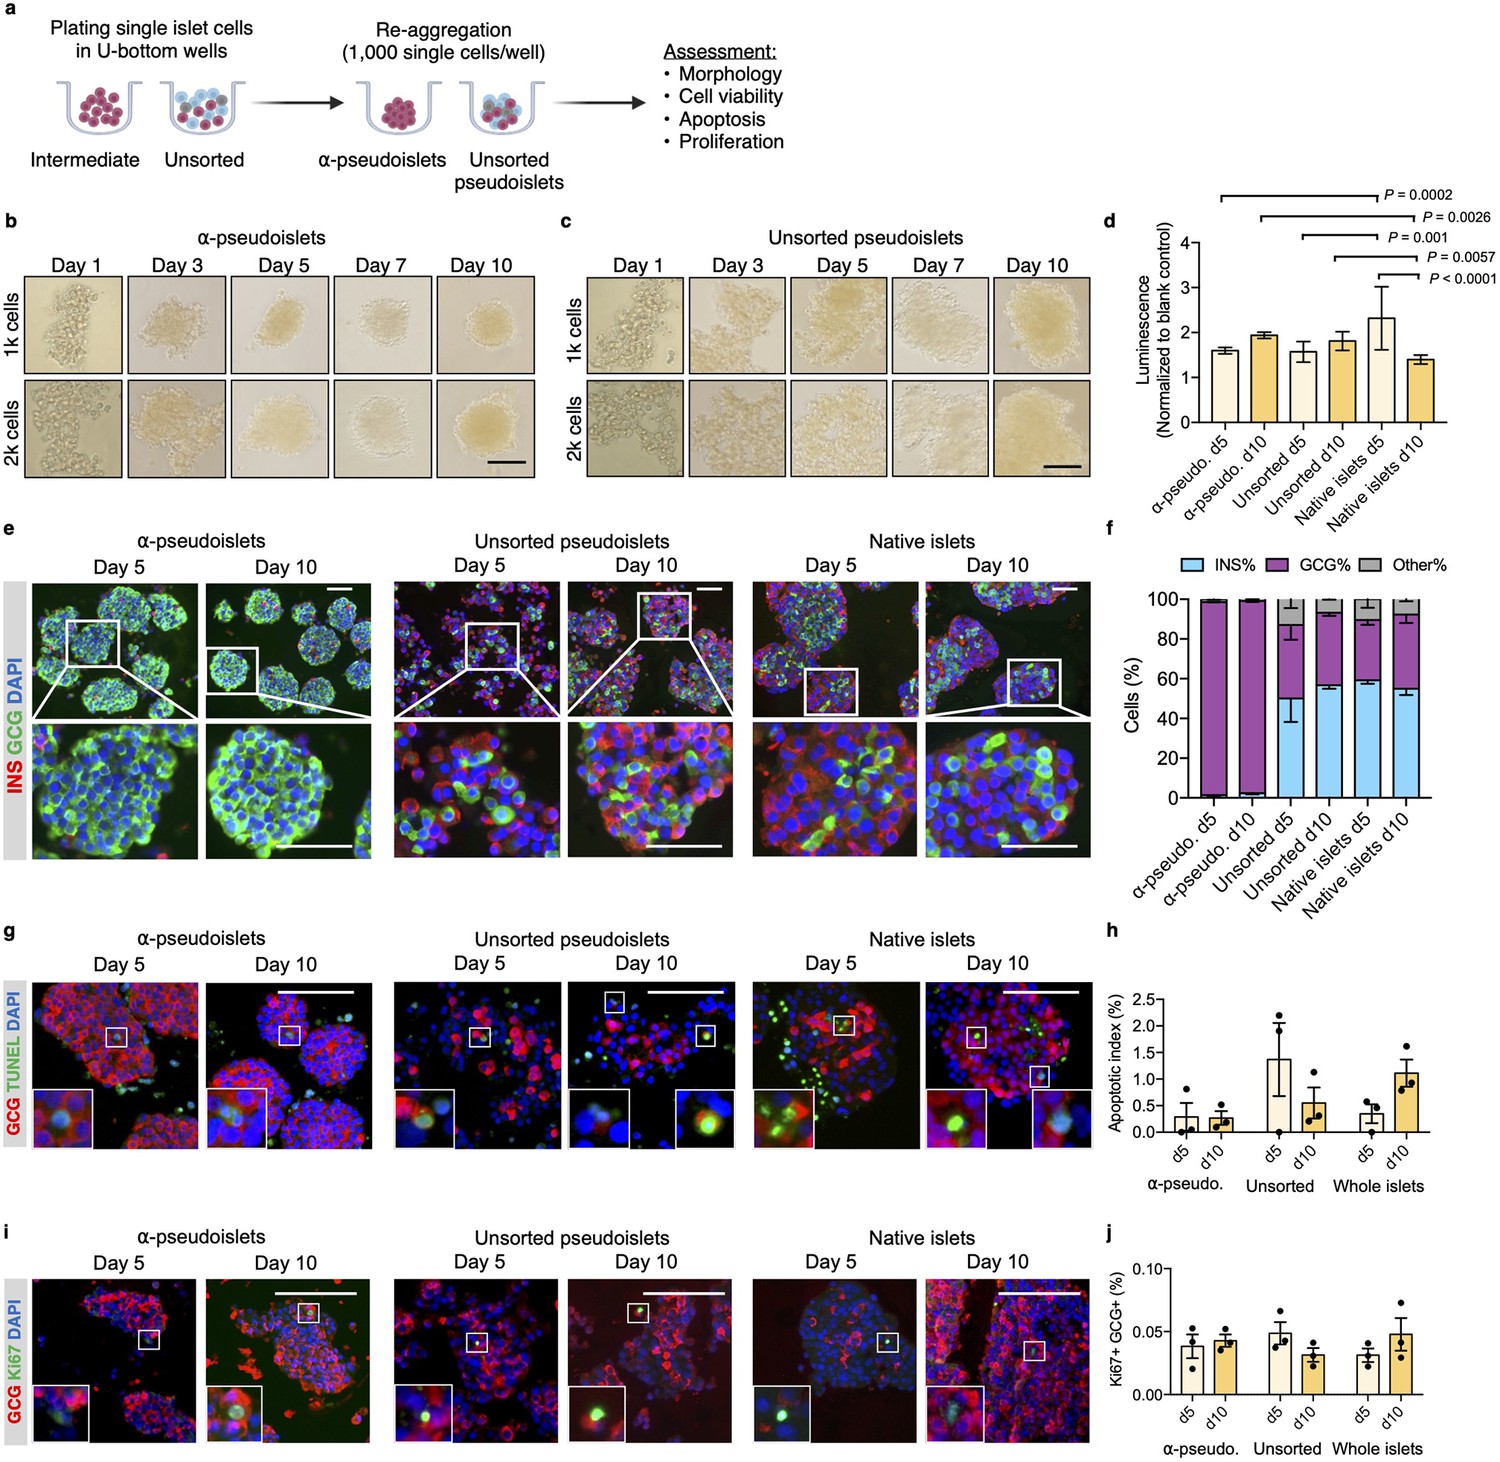
α-Pseudoislets are viable and able to proliferate in vitro post-sorting.
(a) The single islet cells were seeded in round-bottom wells (1k cells per well) after sorting to allow re-aggregation. (b, c) Bright-field images of intermediate (sorted α-cells) (b) and unsorted pseudoislets (c) post-sorting. 1k (top panel) or 2k (bottom panel) single cells were seeded per well. Scale bar, 100 μm. See also Figure 2—figure supplement 1. (d) Cell viability was quantified by luminescence reflecting intracellular ATP levels on days 5 and 10 following fluorescence activated cell sorting (FACS). Fold-change relative to blank control. n=7–9 replicates using islet cells from two donors. (e) Representative immunostaining images of α-pseudoislets, unsorted pseudoislets, and native islets on days 5 and day 10 showing INS (red), GCG (green). Nuclei stained with DAPI are blue. For top and bottom images, scale bar, 100 μm. (f) Percentage of INS+, GCG+, and other (INS-GCG-) islet cells. n=3 donors. (g) Representative immunostaining images of α-pseudoislets, unsorted pseudoislets, and native islets on day 5 and day 10 showing GCG (red), TUNEL (green). Nuclei stained with DAPI are blue. Scale bar, 100 μm. Boxes show apoptotic α-cells. (h) Percentage of TUNEL+GCG+ cells. n=3 donors. (i) Representative immunostaining images of α-pseudoislets, unsorted pseudoislets, and native islets on day 5 and day 10 showing GCG (red), Ki67 (green). Nuclei stained with DAPI are blue. Scale bar, 50 μm. Boxes show proliferating α-cells. (j) Percentage of Ki67+GCG+ cells. n=3 donors. Data are presented as mean values ± s.e.m (b–j). n=3 donors. Two-way ANOVA followed by Sidak’s multiple comparison test (d, h, j).
Figure 2—figure supplement 1

α-Pseudoislets tended to form tighter clusters.
Bright-field images of α-pseudoislets (a) and unsorted pseudoislets (b) 5 days post-sorting. 1k (top panel) or 2k (bottom panel) single cells were seeded per well. Scale bar, 100 μm. n=3 biological replicates using islet cells from a single donor (a, b).
Figure 3
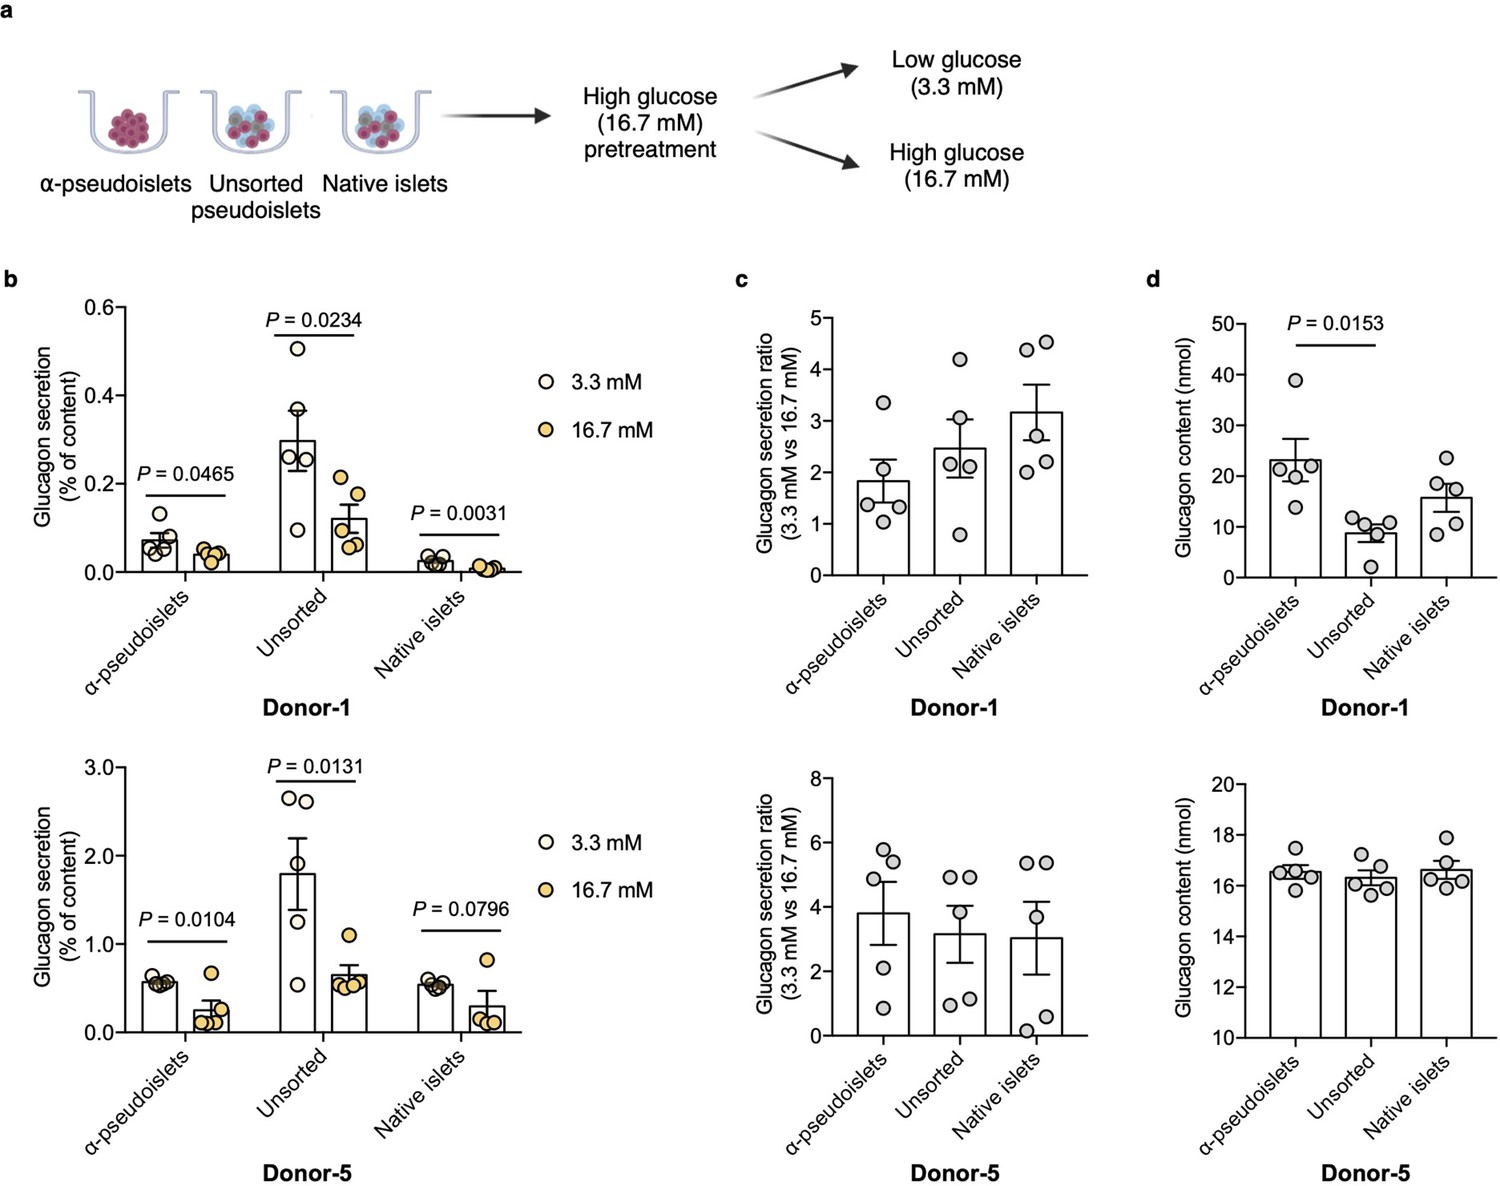
Glucagon secretion in response to glucose challenge.
(a) α-Pseudoislets, unsorted pseudoislets, or native islets were preincubated in Krebs-Ringer bicarbonate (KRB) buffer with 16.7 mM glucose followed by the incubation in KRB buffer with 3.3 mM glucose and 16.7 mM glucose on day 5 post-sorting. (b) Glucagon secretion in response to glucose challenge (3.3 mM vs 16.7 mM). One-tailed Student’s t-test. (c) Ratio of glucagon released by each groups of cells at 16.7 mM glucose versus that at 3.3 mM glucose. (d) Glucagon content measured in each well containing ~8000 cells (eight α-pseudoislets, eight unsorted pseudoislets, and eight native islets). Data are presented as mean values ± s.e.m. (b–d). n=5 replicates using islet cells from two donors (b–d). One-way ANOVA corrected for Tukey applied to (c, d).
Figure 4 with 1 supplement
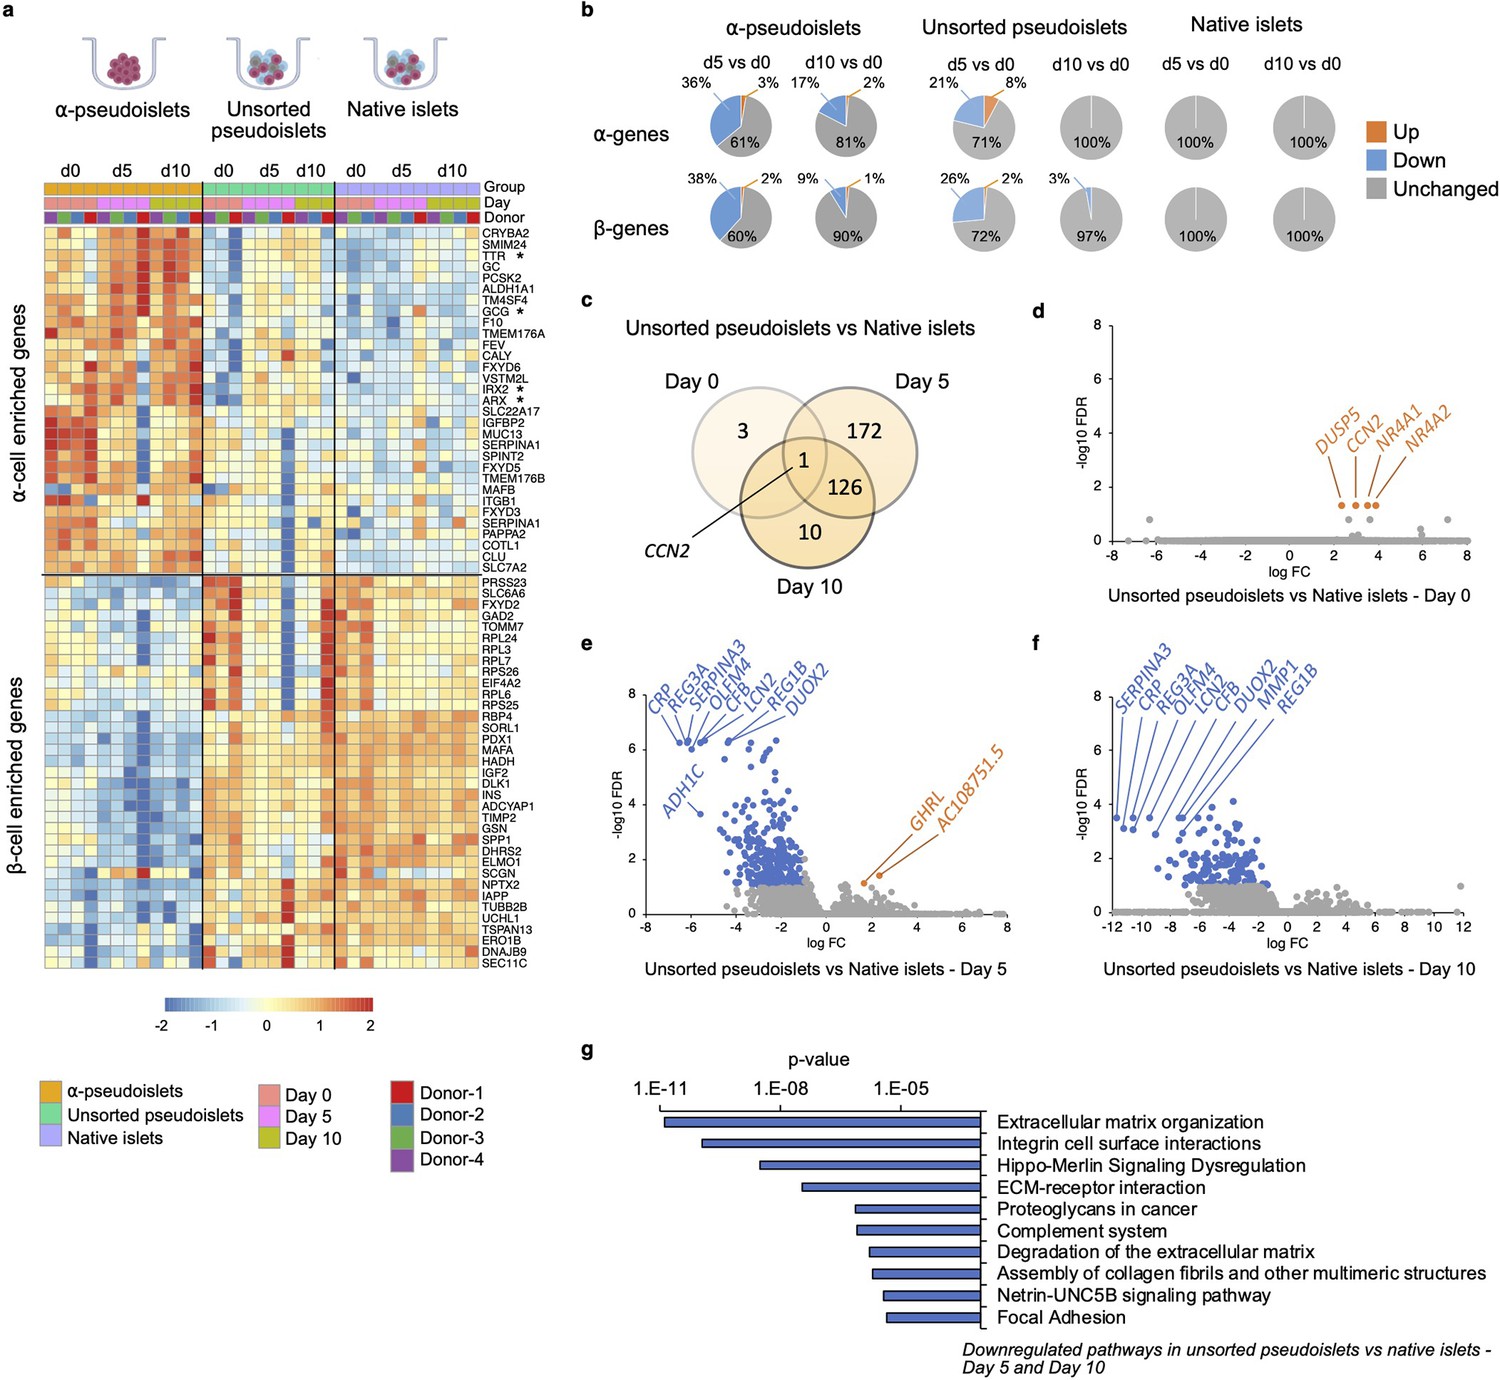
Changes in gene expression levels driven by dissociation and re-aggregation of human islet cells.
(a) Heatmap showing expression levels of α-cell enriched and β-cell enriched genes in α-pseudoislets, unsorted pseudoislets, and native islets on days 0, 5, and 10. Asterisks show genes associated with α-cell identity and function (GCG, ARX, IRX2, TTR). (b) Pie charts showing percentage of α-cell enriched (top panel) and β-cell enriched (bottom panel) genes that alter in α-pseudoislets, unsorted pseudoislets, and native islets on day 5 or day 10 compared to day 0. See also Figure 4—figure supplement 1. (c) Transcriptome of unsorted pseudoislets was compared with native islets on days 0, 5, 10. Venn diagram shows number of differentially expressed genes (DEGs) between unsorted pseudoislets and native islets on different days. (d–f) Volcano plots showing genes downregulated (blue) or upregulated (orange) significantly (FC < –2 or FC > 2, respectively, FDR < 0.1) on day 0 (d), day 5 (e), and day 10 (f). Gray shows non-significant genes with FDR > 0.1 and –2 < FC < 2. (g) Top 10 pathways downregulated in unsorted pseudoislets on day 5 and day 10 compared to native islets. n=4 donors; α-pseudoislets d0, d5, d10, unsorted pseudoislets d5, native islets d5, d10, and n=3 donors; unsorted pseudoislets d0, d10, native islets d0 (a–g).
Figure 4—figure supplement 1
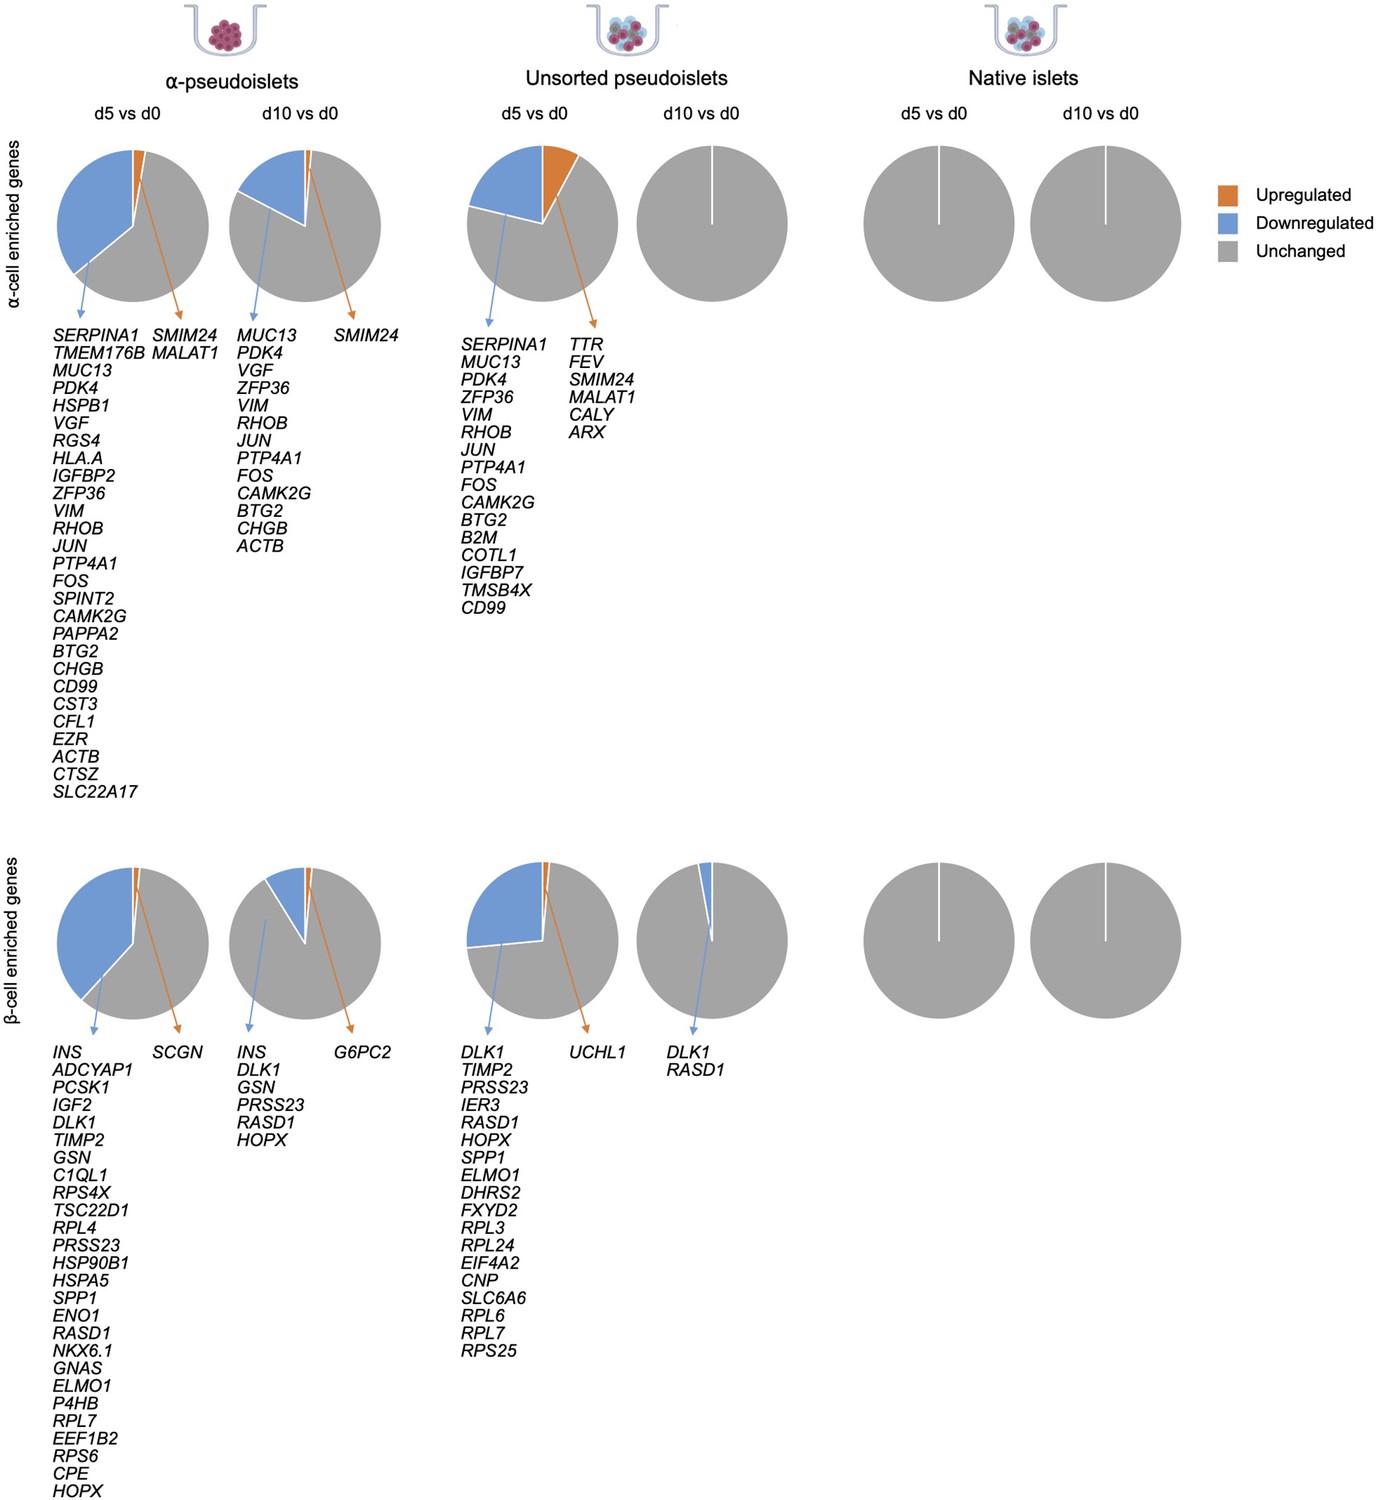
Changes in expression levels of α-cell enriched and β-cell enriched genes in α-pseudoislets, unsorted pseudoislets, and native islets on days 0, 5, 10.
Pie charts show percentage of genes altered on day 5 or 10 compared to day 0 (FDR < 0.1; FC > 2 upregulated or FC < –2 downregulated). n=4; α-pseudoislets d0, d5, d10, unsorted pseudoislets d5, native islets d5, d10, and n=3; unsorted pseudoislets d0, d10, native islets d0.
Figure 5
Time-dependent changes in transcriptome of α-pseudoislets.
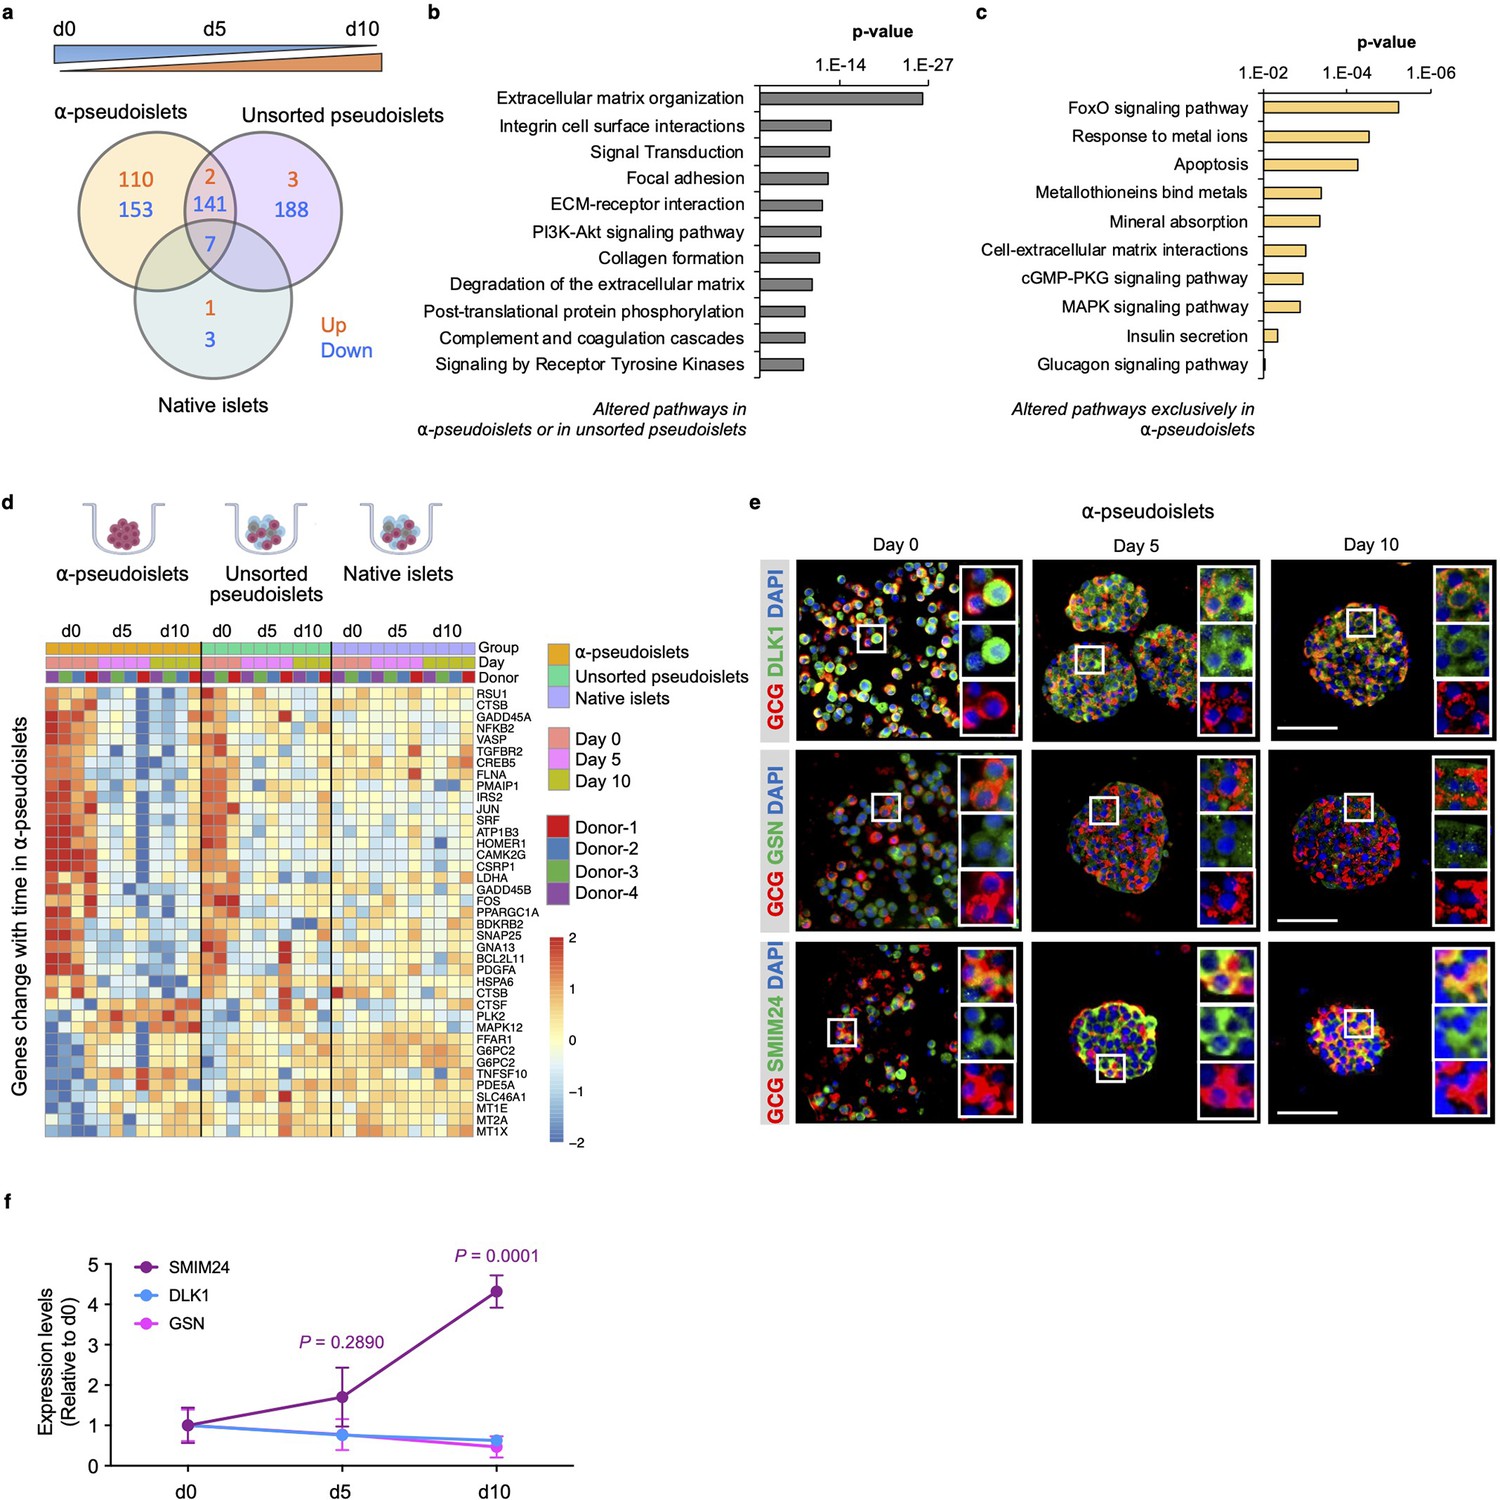
(a) Venn diagram shows number of genes that progressively up- or downregulated in α-pseudoislets, unsorted pseudoislets, and native islets in culture over the period from day 0 to day 5 to day 10. (b, c) Pathway analysis showing altered pathways in α-pseudoislets or in unsorted pseudoislets except native islets (b), and altered pathways only in α-pseudoislets with time (c). (d) Heatmap showing expression levels of genes significantly change with time only in α-pseudoislets. n=4 donors; α-pseudoislets d0, d5, d10, unsorted pseudoislets d5, native islets d5, d10, and n=3 donors; unsorted pseudoislets d0, d10, native islets d0 (a–d). (e) Representative immunostaining images of α-pseudoislets on day 0, 5, and 10 showing GCG (red), DLK1, GSN, and SMIM24 (green). Nuclei stained with DAPI are blue. Scale bar, 50 μm. (f) Expression level of each protein in α-pseudoislets on days 0, 5, 10. Data are presented as mean values ± s.e.m. Two-way ANOVA followed by Dunnett’s multiple comparison test compared to d0. n=3 donors (e, f).
Tables
Key resources table
| Reagent type (species) or resource | Designation | Source or reference | Identifiers | Additional information |
|---|---|---|---|---|
| Antibody | Anti-C-peptide (Rat monoclonal) | Developmental Studies Hybridoma Bank | Cat# GN-ID4, RRID: AB_2255626 | IF (1:200) |
| Antibody | Anti-Ki67 (Mouse monoclonal) | BD Biosciences | Cat# BD550609, RRID: AB_393778 | IF (1:100) |
| Antibody | Anti-Insulin (Guinea Pig polyclonal) | Abcam | Cat# ab7842, RRID: AB_306130 | IF (1:400) |
| Antibody | Anti-Glucagon (Mouse monoclonal) | MilliporeSigma | Cat# G2654, RRID: AB_259852 | IF (1:10,000) |
| Antibody | Anti-Glucagon (Rabbit monoclonal) | Abcam | Cat# ab92517, RRID: AB_10561971 | IF (1:5000) |
| Antibody | Anti-DLK1 (Rabbit polyclonal) | Abcam | Cat# ab21682, RRID: AB_731965 | IF (1:1000) |
| Antibody | Anti-GSN (Rabbit polyclonal) | MilliporeSigma | Cat# HPA054026, RRID: AB_2682347 | IF (1:50) |
| Antibody | Anti-SMIM24 (Rabbit polyclonal) | MilliporeSigma | Cat# HPA045046, RRID: AB_10964444 | IF (1:50) |
| Antibody | Anti-Guinea Pig AF594 (Donkey polyclonal) | Jackson ImmunoResearch | Cat# 706-586-148, RRID: AB_2340475 | IF (1:400) |
| Antibody | Anti-Rat AF488 (Donkey polyclonal) | Jackson ImmunoResearch | Cat# 712-546-153, RRID: AB_2340686 | IF (1:400) |
| Antibody | Anti-Mouse AF594 (Donkey polyclonal) | Jackson ImmunoResearch | Cat# 715-586-150, RRID: AB_2340857 | IF (1:400) |
| Antibody | Anti-Mouse AF488 (Donkey polyclonal) | Jackson ImmunoResearch | Cat# 715-545-150, RRID: AB_2340846 | IF (1:400) |
| Antibody | Anti-Rabbit AF594 (Donkey polyclonal) | Jackson ImmunoResearch | Cat# 711-586-152, RRID: AB_2340622 | IF (1:400) |
| Antibody | Anti-Rabbit AF488 (Donkey polyclonal) | Jackson ImmunoResearch | Cat# 711-545-152, RRID: AB_2313584 | IF (1:400) |
| Biological sample (Homo sapiens) | Primary human pancreatic islets | Integrated Islet Distribution Program (IIDP), Prodo Laboratories Inc, ADI Islet Core | http://iidp.coh.org; RRID: SCR_014387, https://prodolabs.com/ | Freshly isolated |
| Chemical compound | DA-ZP1 | Laboratory of Amit Choudhary | Broad Institute of MIT and Harvard | |
| Chemical compound | ZIGIR | Laboratory of Wen-hong Li | University of Texas, Dallas | |
| Chemical compound | NPG | Thermo | N7991 | |
| Other | DAPI, dilactate | Sigma | D9564 | IF (1:6600) |
| Other | Miami Media #1A | Cellgro | 98-021-CV | Islet cell culture |
| Other | TrypLE | Thermo Fisher Scientific | 12604-013 | Islet cell dissociation |
| Other | FBS | Thermo Fisher Scientific | 10437028 | Islet cell dissociation |
| Other | DPBS | Thermo Fisher Scientific | 14190250 | Islet cell dissociation |
| Other | D-Glucose | Sigma-Aldrich | G8769 | Glucagon secretion assay |
| Other | FFA-BSA | Sigma-Aldrich | 3117057001 | Glucagon secretion assay |
| Other | DMSO | Sigma-Aldrich | D2650-100 | FACS |
| Other | Penicillin-streptomycin | Corning | 30-002-Cl | Islet cell culture |
| Other | 4% PFA | Wako | 163-20145 | Embedding islets in agar |
| Other | Antibody diluent | Abcam | Ab64211 | IF |
| Other | Low melting agarose | Scientific Laboratory Supplies | NAT1030 | Embedding islets in agar |
| Other | TRIzol reagent | Invitrogen | 15596026 | RNA isolation |
| Commercial assay or kit | Glucagon ELISA kit | Mercodia | 10-1271-01 | |
| Commercial assay or kit | MycoAlert Mycoplasma Test Kit | Lonza | LT07-318 | |
| Commercial assay or kit | CellTiter-Glo Luminescent Cell Viability Assay Kit | Promega | G7570 | |
| Commercial assay or kit | ApopTag Peroxidase In Situ Apoptosis Detection Kit | MilliporeSigma | S7100: RRID:AB_2661855 | |
| Commercial assay or kit | QIAGEN RNeasy micro kit | QIAGEN | 74004 | |
| Software, algorithm | Prism v.7.0 | GraphPad Software | http://www.graphpad.com; RRID: SCR_002798 | |
| Software, algorithm | Flowjo-v10 | FlowJo Software | http://www.flowjo.com; RRID: SCR_008520 | |
| Software, algorithm | ImageJ | ImageJ Software | https://imagej.net: RRID:SCR_003070 | |
| Software, algorithm | R version 4.1.0 | R Software | https://www.r-project.org/ |
Additional files
-
Supplementary file 1
Single-cell RNA-sequencing (scRNA-seq) analysis of GSE84133 dataset revealed genes that are differentially expressed between islet α-cells and β-cells.
- https://cdn.elifesciences.org/articles/85056/elife-85056-supp1-v3.xlsx
-
Supplementary file 2
Changes in expression levels of α-cell enriched and β-cell enriched genes in sorted α-cells on day 0.
- https://cdn.elifesciences.org/articles/85056/elife-85056-supp2-v3.xlsx
-
Supplementary file 3
Changes in expression levels of α-cell enriched and β-cell enriched genes in α-pseudoislets, unsorted pseudoislets, and native islets on day 5 and day 10 vs day 0.
- https://cdn.elifesciences.org/articles/85056/elife-85056-supp3-v3.xlsx
-
Supplementary file 4
Differentially expressed genes between unsorted pseudoislets versus native islets with fold change >2 and <–2 (log2 FC >1 and <–1) and false discovery rate (FDR)<0.1.
- https://cdn.elifesciences.org/articles/85056/elife-85056-supp4-v3.xlsx
-
Supplementary file 5
Pathway analysis of commonly downregulated genes on days 5 and 10 in the unsorted pseudoislets compared to native islets.
- https://cdn.elifesciences.org/articles/85056/elife-85056-supp5-v3.xlsx
-
Supplementary file 6
Progressively up- or downregulated genes over the period from day 0 to day 10.
- https://cdn.elifesciences.org/articles/85056/elife-85056-supp6-v3.xlsx
-
Supplementary file 7
Altered pathways in α-pseudoislets and unsorted pseudoislets except native islets with time.
- https://cdn.elifesciences.org/articles/85056/elife-85056-supp7-v3.xlsx
-
Supplementary file 8
Altered pathways exclusively in α-pseudoislets with time.
- https://cdn.elifesciences.org/articles/85056/elife-85056-supp8-v3.xlsx
-
Supplementary file 9
Donor information.
- https://cdn.elifesciences.org/articles/85056/elife-85056-supp9-v3.xlsx
-
MDAR checklist
- https://cdn.elifesciences.org/articles/85056/elife-85056-mdarchecklist1-v3.docx
Download links
A two-part list of links to download the article, or parts of the article, in various formats.
Downloads (link to download the article as PDF)
Open citations (links to open the citations from this article in various online reference manager services)
Cite this article (links to download the citations from this article in formats compatible with various reference manager tools)
Fluorescein-based sensors to purify human α-cells for functional and transcriptomic analyses
eLife 12:e85056.
https://doi.org/10.7554/eLife.85056


