Ventral striatum dopamine release encodes unique properties of visual stimuli in mice
- Rasopathy Program, Division of Experimental Hematology and Cancer Biology, Department of Pediatrics, Cincinnati Children’s Hospital Medical Center, United States
- Department of Pediatrics, University of Cincinnati College of Medicine, United States
- Neuroscience Graduate Program, University of Cincinnati College of Medicine, United States
- The Visual Systems Group, Abrahamson Pediatric Eye Institute, Cincinnati Children's Hospital Medical Center, United States
- Science of Light Center, Cincinnati Children's Hospital Medical Center, United States
- Department of Ophthalmology, University of Cincinnati College of Medicine, United States
Figures
Figure 1 with 1 supplement
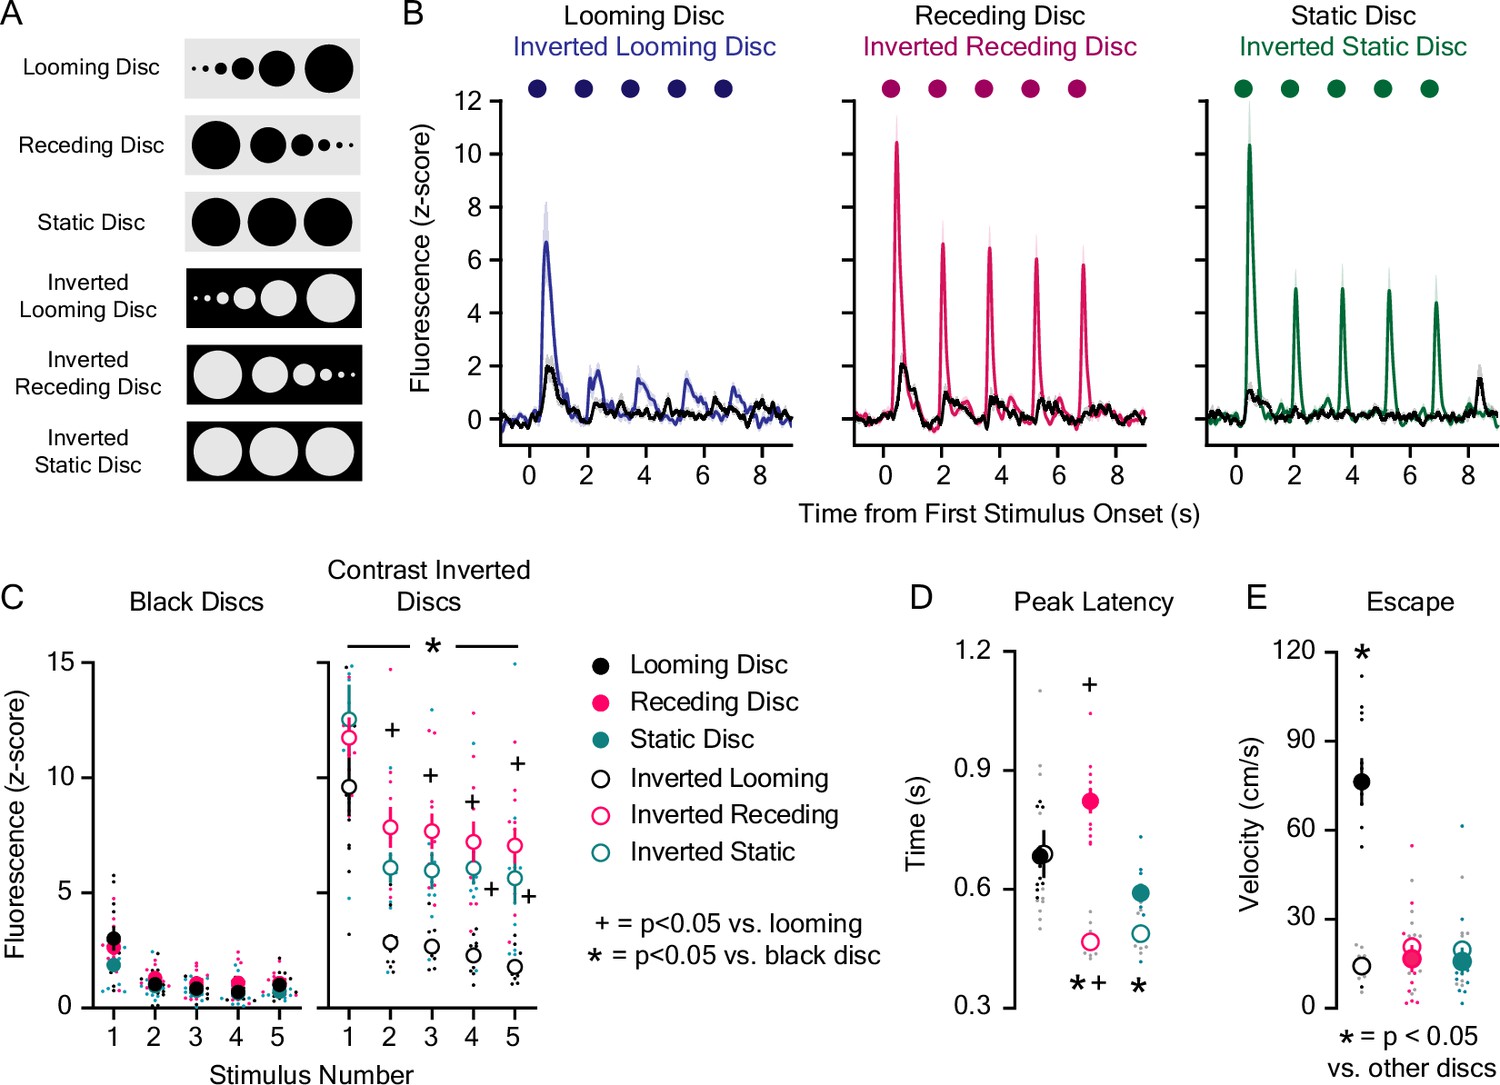
Lateral NAc (LNAc) dopaminergic encoding of visual threats.
(A) Fluorescent dopamine signals were recorded during the presentation of black or contrast-inverted looming and control discs. (B) Average dLight1 response to trains of five black or contrast inverted discs ± standard error of the mean (SEM). (C) The dLight1 response to black or inverted discs was dependent on disc color/background, disc type (static vs. looming vs. receding), and stimulus number (n=11; 3-way repeated measures ANOVA; F8,240 = 2.02, pdisc background x disc type x stimulus number = 0.045; F1,240 = 143.92, pbackground <0.001; F2,240 = 150.32, pdisc type <0.001; F4,240 = 192.64, pstimulus number <0.001). Bonferroni post hoc tests revealed that contrast inverted discs evoked more dopamine than black discs. Contrast inverted looming discs evoked less dopamine than inverted static and receding discs after the first presentation. (D) dLight1 transient peak latency was dependent on disc color/background and disc type (n=11; 2-way repeated measures ANOVA; F2,20 = 64.78, pdisc background x disc type <0.001; F1,20 = 25.69, pbackground <0.001; F2,20 = 7.58, pdisc type = 0.01). Bonferroni post hoc tests showed that contrast inverted static and receding discs evoked transients with shorter latency compared to black discs. Additionally, transients evoked by contrast inverted receding discs had shorter latency than contrast inverted looming discs. (E) Escape velocity following overhead disc presentation was dependent on disc color/background and disc type (n=12; 2-way repeated measures ANOVA; F2,22 = 49.28, pdisc background x disc type <0.001; F1,22 = 18.38, pbackground = 0.001; F2,22 = 28.89, pdisc type <0.001). Bonferroni post hoc tests showed that black looming discs induced greater escape velocity than all other overhead discs. For panels C and D, * indicates p<0.05 vs. black disc of the same type (e.g. black static disc vs. contrast inverted static disc); + indicates p<0.05 vs. looming disc of the same color (e.g. black looming vs. black receding disc). For panel E, * indicates p<0.05 vs. other overhead discs.
-
Figure 1—source data 1
Source data and associated statistical testing results for Figure 1.
- https://cdn.elifesciences.org/articles/85064/elife-85064-fig1-data1-v3.xlsx
Figure 1—figure supplement 1
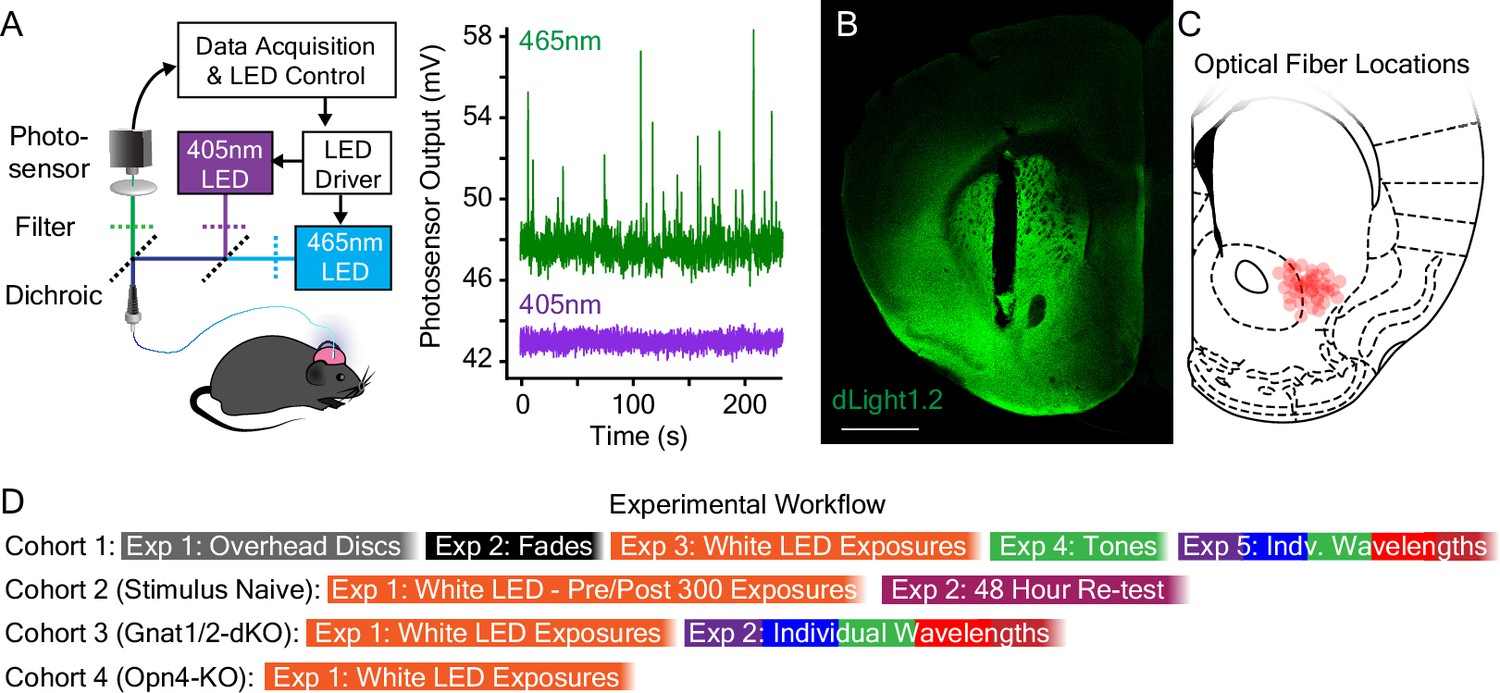
Overview of experimental setup and workflow.
(A) (Left) Fluorescent dopamine signals were recorded with a fiber photometry system that used a 465 nm light emitting diode (LED) for dLight1 sensor excitation and a 405 nm LED for isosbestic (control) excitation. (Right) Representative traces showing the raw dopamine-dependent dLight1 emission signal (465 nm excitation, green) in the lateral NAc in a freely moving mouse, as well as the isosbestic control signal (405 nm, purple) that is used to account for motion artifacts and photo-bleaching. (B) A representative confocal image showing expression of the dLight sensor (green) and the 400 μm diameter optical fiber track in the lateral NAc. Scale bar = 1 mm. (C) Approximate optical fiber tip locations for experimental mice (red circles) determined by post hoc histological analysis. (D) Schematic showing the experimental workflow for each cohort of mice.
Figure 2 with 1 supplement
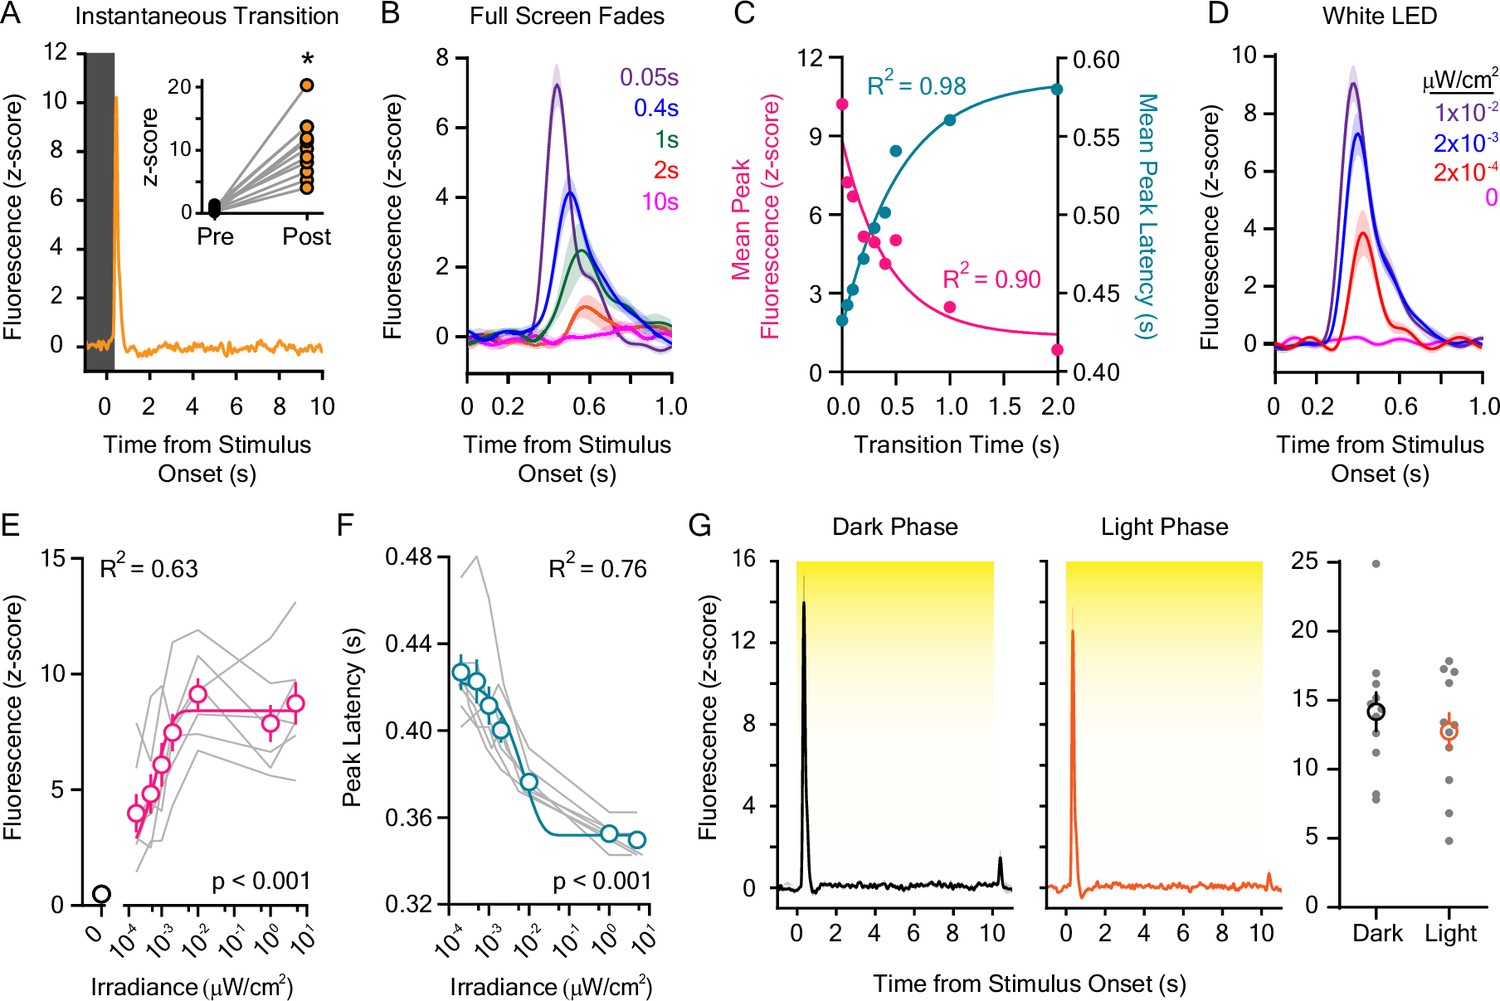
Dopaminergic responses to rapid dark-to-light transitions.
(A) Instantaneous liquid crystal display (LCD) screen transitions from dark to light-evoked rapid dopamine release at stimulus onset when compared to the pre-stimulus baseline (inset: baseline and stimulus-induced dLight1 peak values for individual mice; n=11; paired t-test; t10=7.01, p<0.001). (B) dLight1 responses to the onset of LCD screen dark-to-light transitions at different transition lengths (0.05–2.0 s) ± SEM. (C) The magnitude (pink) and latency (teal) of dopaminergic responses to dark-to-light transitions varied non-linearly depending on transition speed (peak amplitude: one-phase exponential decay, y0=8.84 z-score, plateau = 1.36 z-score, tau = 0.43 s, R2 = 0.90; peak latency: one-phase exponential association, y0=0.43 ms, plateau = 0.59 ms, tau = 0.54 s, R2 = 0.98). (D) dLight1 responses to the onset 10 s white light emitting diode (LED) stimuli across a range of irradiances (0 μW/cm2 – 0.01 μW/cm2) ± SEM. (E) The magnitude of the dopaminergic response to 10 s white LED stimuli was dependent on the stimulus irradiance (n=7; 1-way repeated measures ANOVA; F7,42 = 38.79, <0.001). Data are shown with a one-phase exponential association fit (y0=1.20 z-score, plateau = 0.84 z-score, tau = 0.00074 μW/cm2, R2 = 0.63). (F). The latency of the dopaminergic response to 10 s white LED stimuli was dependent on the stimulus irradiance (n=7; 1-way repeated measures ANOVA; F6,36 = 47.35, p<0.001). Data are shown with a one-phase exponential decay fit (y0=0.42 ms, plateau = 0.35 ms, tau = 0.0079 μW/cm2, R2 = 0.76). (G). The dopaminergic response to 5.0 μW/cm2 white light was not different (right) if measured at the beginning of the vivarium dark (left) or light (center) phase of the day-night cycle (n=11; paired t-test; t10=1.27, p=0.23). In all panels, * indicates p<0.05.
-
Figure 2—source data 1
Source data and associated statistical testing results for Figure 2.
- https://cdn.elifesciences.org/articles/85064/elife-85064-fig2-data1-v3.xlsx
Figure 2—figure supplement 1
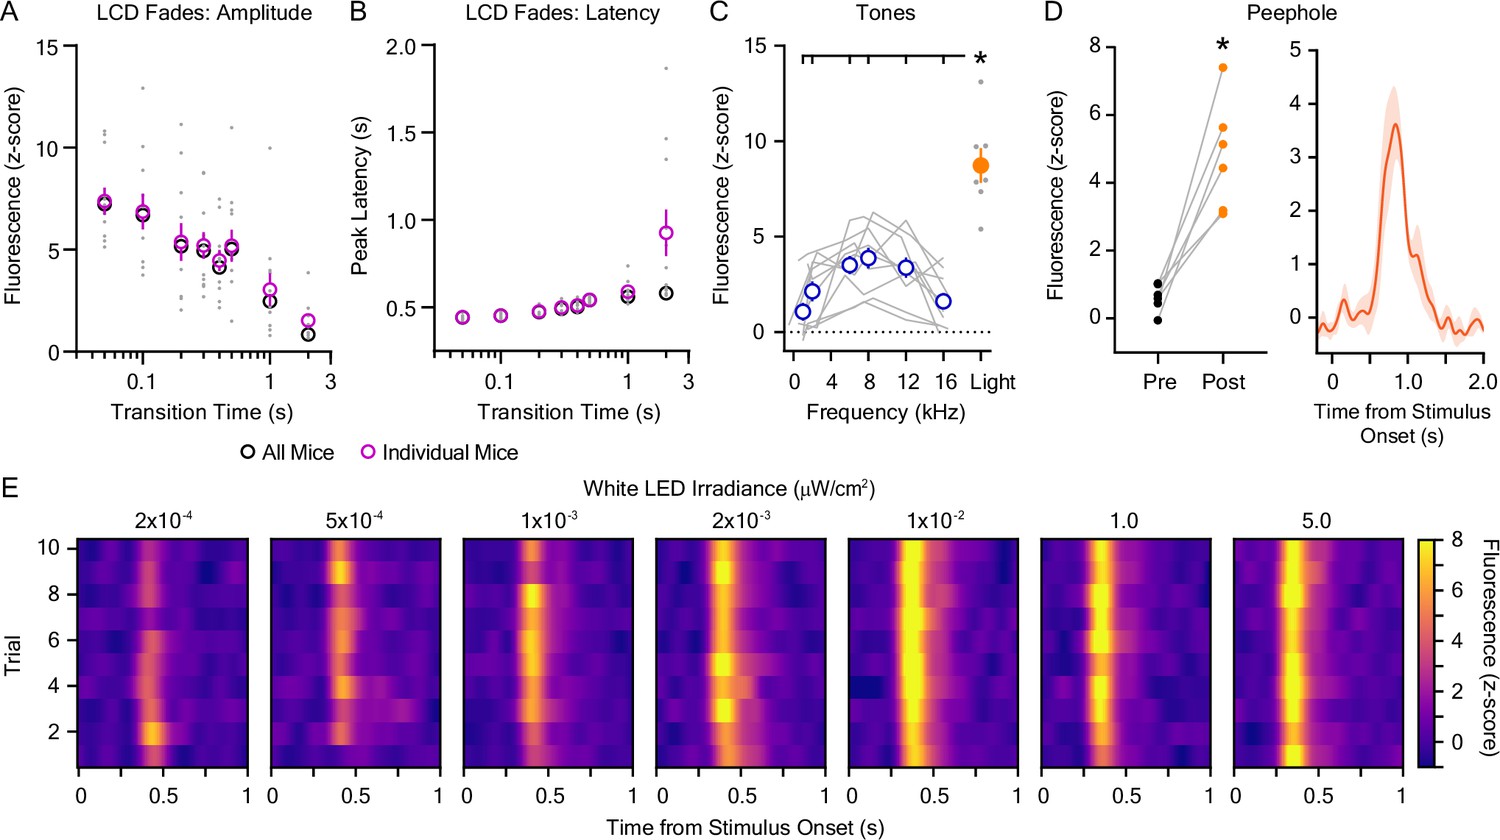
Additional data: dopaminergic responses to audiovisual stimuli.
(A) The magnitude of the dopaminergic response to dark-to-light transitions was dependent on the stimulus transition time (n=11; 1-way repeated measures ANOVA; F7,70 = 17.76, p<0.001). (B) The latency of the peak dopaminergic response to dark-to-light transitions was dependent on the stimulus transition time (n=11; 1-way repeated measures ANOVA; F7,70 = 11.03, p=0.007). In A and B, pink circles (mean ± SEM) and gray dots (individual values) represent data derived from fluorescent dLight1 traces averaged across trials for each individual mice. Shown for comparison, black circles represent data derived from fluorescence traces averaged across all mice prior to peak detection, which yielded a single value for each transition time. (C) The dopaminergic response to 80 dB tones was dependent on their frequency (n=10; 1-way repeated measures ANOVA; F5,45 = 10.11, p<0.001) and was less than the response to a 5 μW/cm2 LED light stimulus (Mixed-effects ANOVA; F=26.62, pstimulus <0.001). Bonferroni post hoc tests revealed that the dLight1 response to the light stimulus was significantly larger than all tone responses. (D) (Left) Opening the enclosure peephole evoked significant dopamine release at stimulus onset when compared to the pre-stimulus baseline (n=6; paired t-test; t5=5.72, = 0.002). (Right) Averaged dLight1 trace showing lateral NAc (LNAc) dopamine evoked by opening the peephole on the door of the behavioral testing chamber enclosure to observe mouse behavior ± SEM. The irradiance associated with this manipulation was 17 nW/cm2 measured at mouse level. (E) Trial-by-trial heat maps showing the dopaminergic response to a ten-second white light emitting diode (LED) stimulus (0.2 nW/cm2 – 5 μW/cm2) presented with a random ISI between 90 and 180 s across 10 trials. No trial-by-trial changes in the dopaminergic response to light were observed with the exception of 0.5 nW/cm2 (5 × 10⁻⁴ μW/cm2; n=7; 1-way repeated measures ANOVA; F9,54 = 3.28, p=0.03) and 1.0 μW/cm2 (n=7; 1-way repeated measures ANOVA; F9,54 = 3.43, p=0.02), in which the peak dLight1 response was lower during the first trial of testing (see the source data file for full results and post hoc tests). In all panels, * indicates p<0.05.
-
Figure 2—figure supplement 1—source data 1
Source data and associated statistical testing results for Figure 2—figure supplement 1.
- https://cdn.elifesciences.org/articles/85064/elife-85064-fig2-figsupp1-data1-v3.xlsx
Figure 3
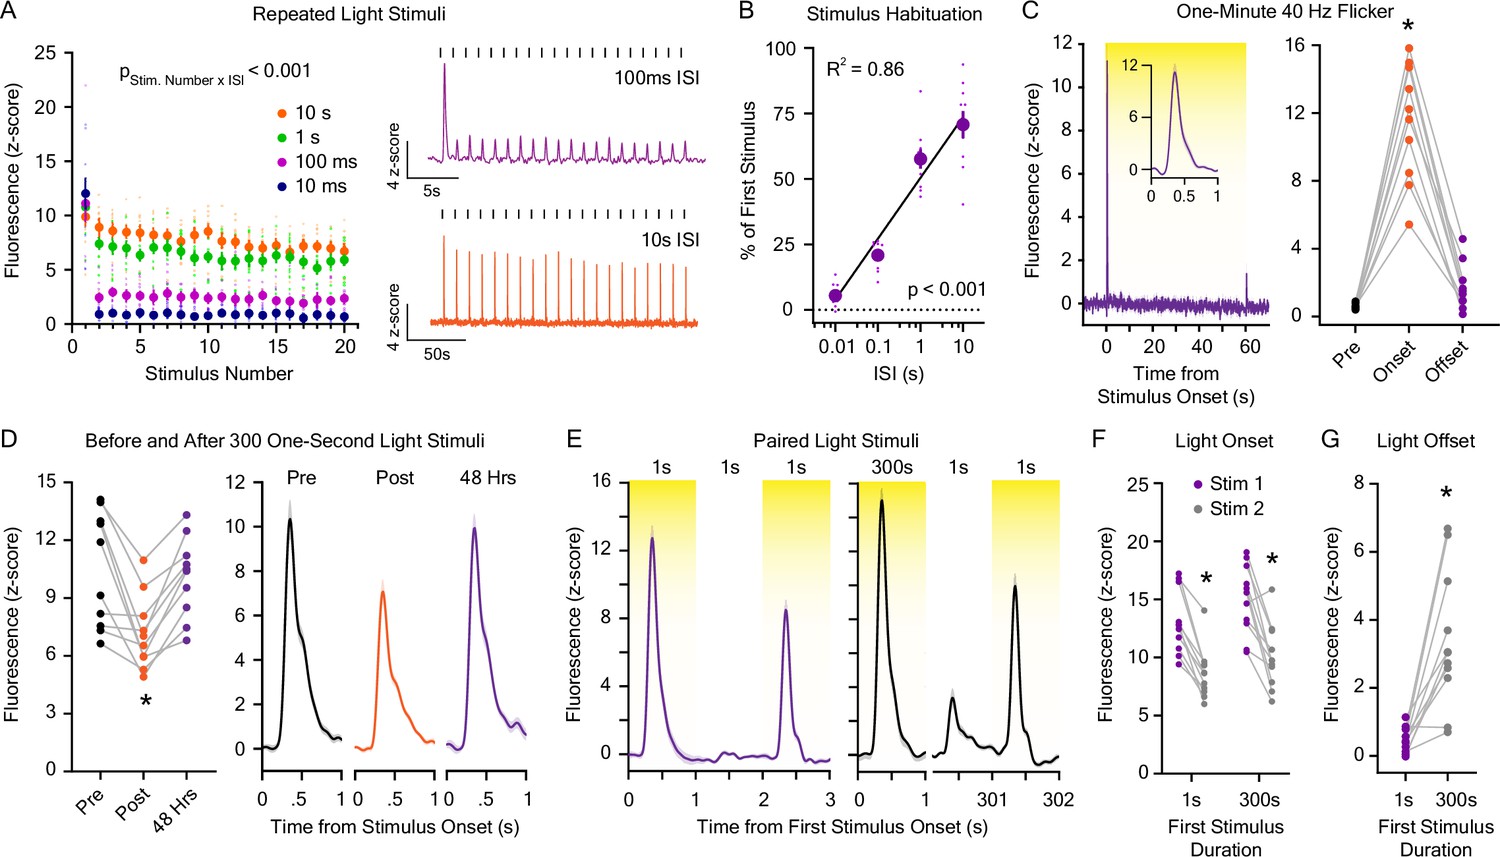
Dopaminergic responses to repeated light stimuli.
(A) (Left) Dopamine release evoked by 20 1 s white light emitting diode (LED) stimuli was reduced with repeated exposures and was dependent on the interstimulus interval (ISI; 10 ms – 10 s; n=9; 2-way repeated measures ANOVA; F57,456 = 9.54, pstimulus number x interstimulus interval <0.001; F19,456 = 72.98, pstimulus number <0.001; F3,456 = 63.91, pinterstimulus interval <0.001). (Right) Averaged dLight1 fluorescent traces showing the dopaminergic response to 20 1 s white LED light pulses with a 100 ms ISI (purple) or 10 s ISI (orange). (B) Total habituation of the peak dLight1 response to repeated stimuli (shown as the peak response to the 20th stimulus as a percentage of the 1st stimulus) is dependent on the duration of the interstimulus interval (n=9; 1-way repeated measures ANOVA; F3,24 = 104.0, p<0.001). Data are shown with a semi-log fit (y-intercept: 48.92%, slope: 22.58% s–1, R2 = 0.86). (C) (Left) Averaged dLight1 trace showing lateral NAc (LNAc) dopamine evoked by a 60 s presentation of 40 Hz white LED flicker (inset: response during the first second after stimulus onset) ± SEM. (Right) 40 Hz flicker only evoked significant dopamine release at stimulus onset (n=10; 1-way repeated measures ANOVA; F2,18 = 100.4, p<0.001). Bonferroni post hoc tests confirmed that the dLight1 peak at LED onset was greater than the baseline and offset responses, which did not differ from each other (p=0.09). (D) (Left) The dLight1 response to a 1 s white LED stimulus in stimulus-naïve mice was reduced after the presentation of 300 1 s LED stimuli with a one-second ISI but returned to baseline 48 hr later (n=10; one-way repeated measures ANOVA with Bonferroni post hoc tests; F2,18 = 12.4, p=0.002). (Right) Averaged dLight1 fluorescent traces showing the dopaminergic response to 1 s LED light pulses before (black) or after (orange) 300 1 s LED stimuli, as well as 48 hr later (purple). (E) Averaged dLight1 fluorescent traces showing the dopaminergic response to a 1 s white LED stimulus 1 s after a 1 s (left) or 300 s (right) preconditioning stimulus ± SEM. (F) The dLight1 response to a 1 s white LED test stimulus was not dependent on the length of the preconditioning stimulus (n=11; 2-way repeated measures ANOVA; F1,10 = 0.27, pinitial stimulus length x stimulus Number = 0.61; F1,10 = 3.83, pinitial stimulus length = 0.08; F1,10 = 55.10, pstimulus number <0.001). Bonferroni post hoc tests revealed that the dLight1 response to the test stimulus onset was significantly smaller than the response to the onset of the preconditioning stimulus, regardless of its duration. There was no difference between the dLight1 response to the onset of the preconditioning (p=0.11) or test stimulus (p=0.40) between experiments. (G) The dLight1 response to light offset was larger for a 300 s light stimulus compared to a 1 s light stimulus (n=11; paired t-test; t10=4.91, p<0.001). In all panels, * indicates p<0.05.
-
Figure 3—source data 1
Source data and associated statistical testing results for Figure 3.
- https://cdn.elifesciences.org/articles/85064/elife-85064-fig3-data1-v3.xlsx
Figure 4 with 1 supplement
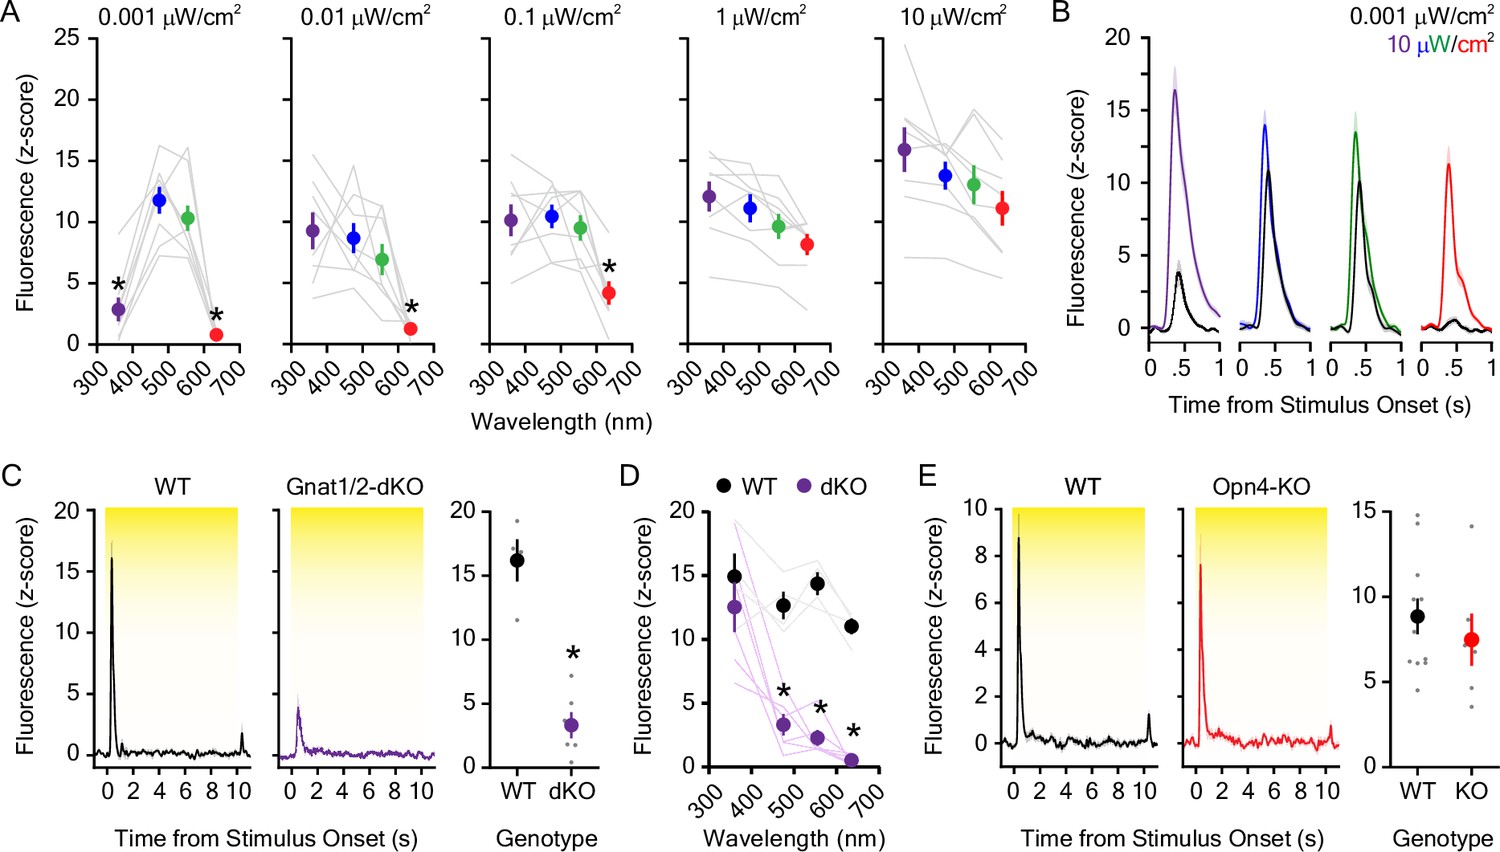
Dopaminergic responses to individual wavelengths across the visual spectrum.
(A) The dopaminergic response to UV (360 nm), blue (475 nm), green (555 nm), and red (635 nm) light emitting diode (LED) light was wavelength and irradiance-dependent (n=8; 2-way repeated measures ANOVA; F12,84 = 9.63, pwavelength x irradiance <0.001; F3,84 = 37.59, pwavelength <0.001; F4,84 = 10.08, pirradiance = 0.004). Bonferroni post hoc tests revealed that dopamine evoked by UV and the red light was smaller than blue and green wavelengths at the lowest irradiance tested (0.001 μW/cm2). The dLight1 response to the red LED was also significantly lower than blue and green LEDs at irradiances of 0.01 μW/cm2 and 0.1 μW/cm2. For comprehensive reporting of all significant post hoc tests across irradiances and wavelengths, see the full statistical testing results in the source data file that accompanies this figure. (B) Averaged dLight1 trace showing lateral NAc (LNAc) dopamine evoked by either 0.001 μW/cm2 (1 nW/cm2) or 10 μW/cm2 UV, blue, green, or red LEDs ± SEM. (C) The dopaminergic response to 5.0 μW/cm2 white light was significantly reduced in Gnat1/2 double knockout (dKO) mice relative to wildtype controls (nWT = 4, nKO = 6; unpaired t-test; t8=7.08, <0.001). (D) The reduction in the dLight1 response to 10 μW/cm2 light in Gnat1/2 dKO was wavelength dependent (two-way repeated measures ANOVA; F3,24 = 7.02, pgenotype x wavelength = 0.002; F3,24 = 17.54, pwavelength = 0.003; F1,24 = 85.80, pgenotype <0.001). Bonferroni post hoc tests revealed that the dLight1 response to blue (475 nm), green (555 nm), and red (635 nm) light was lower in Gnat1/2 mice relative to wildtype littermates. (E) The dopaminergic response to 5.0 μW/cm2 white light was not different in Opn4 (melanopsin) knockout mice relative to wildtype controls (nWT = 11, nKO = 6; unpaired t-test; t15=0.75, p=0.46).
-
Figure 4—source data 1
Source data and associated statistical testing results for Figure 4.
- https://cdn.elifesciences.org/articles/85064/elife-85064-fig4-data1-v3.xlsx
Figure 4—figure supplement 1

Dopamine responses to invidual light wavelengths in wildtype, Opn4 knockout, and Gnat1/2 double knockout mice.
(A) (Left) 100 μW/cm2 far-red (730 nm) light emitting diode (LED) light-evoked significantly greater dopamine release compared to 10 μW/cm2 light (n=8; paired t-test; t7=2.54, = 0.04). (Right) Averaged dLight1 trace showing lateral NAc (LNAc) dopamine evoked by a 100 μW/cm2 far-red LED ± SEM. (B) (Left) The latency of the peak dLight1 response to 5.0 μW/cm2 white light was significantly greater in Gnat1/2 double knockout (dKO) mice relative to wildtype controls (WT; nWT = 4, nKO = 6; unpaired t-test; t8=4.77, = 0.001). (Right) There was no difference in the latency of the peak dLight1 response to 5.0 μW/cm2 white light in Opn4 knockout mice (KO) relative to wildtype controls (WT; black; nWT = 11, nKO = 6; unpaired t-test; t15=0.16, p=0.87). (C) Averaged dLight1 trace showing LNAc dopamine evoked by 10 μW/cm2 UV (360 nm), blue (475 nm), green (555 nm), or red (635) LEDs ± SEM in wildtype (orange) or Gnat1/2-dKO (black) mice. In all panels, * indicates p<0.05.
-
Figure 4—figure supplement 1—source data 1
Source data and associated statistical testing results for Figure 4—figure supplement 1.
- https://cdn.elifesciences.org/articles/85064/elife-85064-fig4-figsupp1-data1-v3.xlsx
Videos
Video 1
Animation showing the black and contrast inverted expanding (looming), receding, and static disc stimuli.
Video 2
The behavioral response to the presentation of black looming discs on a light background when mice entered the threat zone of a rectangular arena.
Video 3
The behavioral response to the illumination of a spotlight when mice entered the target zone of a rectangular arena.
Tables
Key resources table
| Reagent type (species) or resource | Designation | Source or reference | Identifiers | Additional information |
|---|---|---|---|---|
| Recombinant DNA reagent | pAAV-hSyn-dLight1.2 | Addgene | Cat#: 111068 RRID:Addgene_111068 | Produced by Addgene in the AAV5 serotype |
| Software, Algorithm | Python 3.8 | Python Software Foundation | RRID:SCR_008394 | |
| Software, Algorithm | Fiber Photometry Trace Processing | Tucker-Davis Technologies | https://www.tdt.com/docs/sdk/offline-data-analysis/offline-data-python/FibPhoEpocAveraging/ | |
| Software, Algorithm | Bonsai 2.6.3 | Bonsai Foundation CIC | RRID:SCR_017218 | |
| Software, Algorithm | Looming Visual Stimulus Generation | Austen Fisher, Robinson Lab | https://github.com/jelliottrobinson/BonsaiLoomStim | |
| Software, Algorithm | ABET II Software for Operant Control | Lafayette Instrument Company | Model 89501 | |
| Software, Algorithm | Ethovision XT 17 | Noldus Information Technology | RRID:SCR_000441 | |
| Software, Algorithm | GraphPad Prism 9 | GraphPad Software, Inc | RRID:SCR_002798 | |
| Software, Algorithm | Data Science Workbench 14.0.0.15 | TIBCO Software, Inc | RRID:SCR_014213 | |
| Other | Mono Fiber-Optic Cannula | Doric Lenses, Inc | Cat#: MFC_400/430–0.66_6 mm_MF1.25_FLT | OD: 400 μm, Length: 6 mm |
| Other | Mono Fiber-Optic Patch Cable | Doric Lenses, Inc | Cat#: MFP_400/430/1100–0.57_1 m_FCM-MF1.25_LAF, Doric Lenses Inc | OD: 400 μm, Length: 1 m |
Additional files
Download links
A two-part list of links to download the article, or parts of the article, in various formats.
Downloads (link to download the article as PDF)
Open citations (links to open the citations from this article in various online reference manager services)
Cite this article (links to download the citations from this article in formats compatible with various reference manager tools)
Ventral striatum dopamine release encodes unique properties of visual stimuli in mice
eLife 12:e85064.
https://doi.org/10.7554/eLife.85064


