Integrated transcriptome and proteome analysis reveals posttranscriptional regulation of ribosomal genes in human brain organoids
- Institute of Molecular Biotechnology of the Austrian Academy of Sciences (IMBA), Vienna BioCenter (VBC), Austria
- Gregor Mendel Institute, Vienna Biocenter, Austria
- Department of Neurology, Medical University of Vienna, Austria
Figures
Figure 1 with 7 supplements
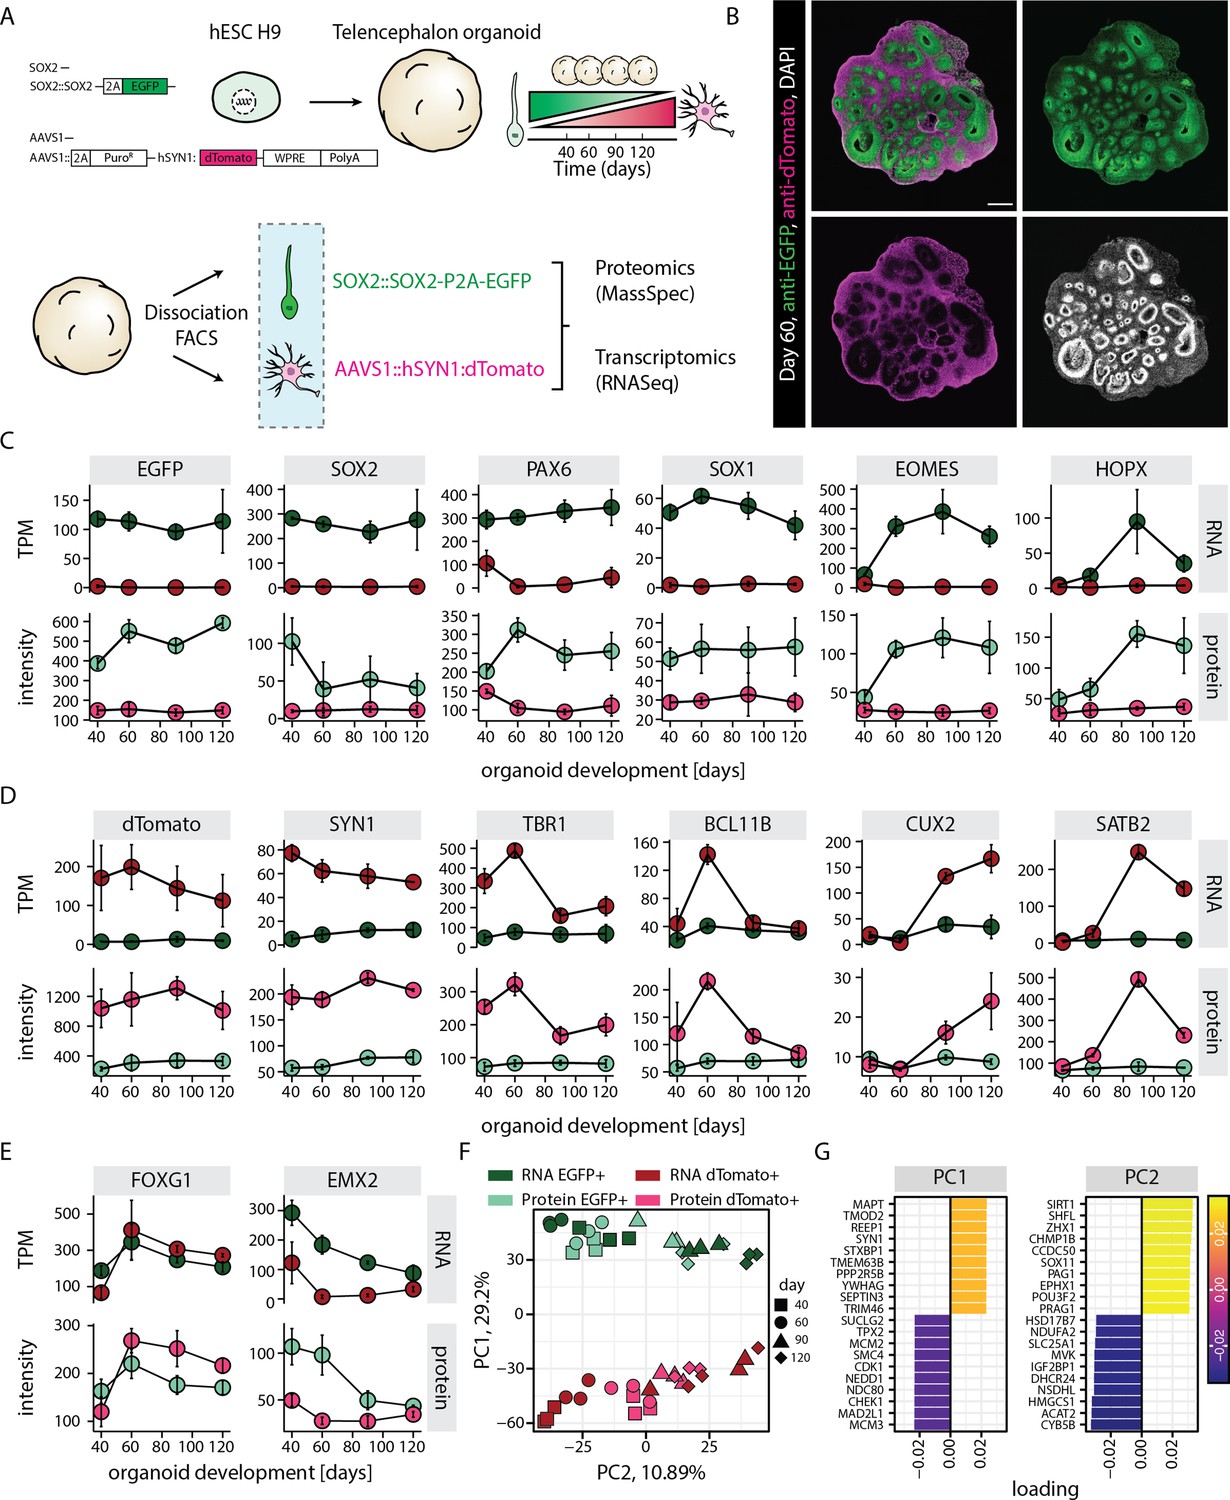
RNA-protein multiomics of progenitors and neurons in human brain organoids.
(A) Schematic representation of the experimental design. A dual reporter line was generated in H9 human embryonic stem cell (hESC) background. Cells from brain organoids grown using this reporter line were sorted and collected by fluorescent activated cell sorting (FACS) in EGFP and dTomato positive fractions. Gene expression of the sorted cell populations were analyzed by RNA-seq and Mass-spec. (B) Confocal scan of a dual reporter organoid cryosection (day 60) stained with anti-EGFP, anti-dTomato antibodies, and DAPI. Scale bar = 500 µm. (C,D,E) Plots showing RNA (top) and protein (bottom) abundance of key progenitor-specific markers (C), neuronal markers (D), and dorsal telencephalic fate markers (E) in SOX2::EGFP+ (green) and hSYN1::dTomato+ positive (red) cells at different stages of organoid development. RNA abundance is measured as transcript per million (TPM). (F,G) Principal component analysis of z-score normalized integrated transcriptome and proteome of progenitors (EGFP+, green) and neurons (dTomato+, red) at different stages of organoid development with (G) loading scores for PC1 and PC2 top contributing genes.
-
Figure 1—source data 1
RNA-seq gene expression results.
- https://cdn.elifesciences.org/articles/85135/elife-85135-fig1-data1-v1.xlsx
-
Figure 1—source data 2
Mass spectrometry protein expression results.
- https://cdn.elifesciences.org/articles/85135/elife-85135-fig1-data2-v1.xlsx
-
Figure 1—source data 3
Combined RNA and protein gene expression results and module assignment of genes.
- https://cdn.elifesciences.org/articles/85135/elife-85135-fig1-data3-v1.xlsx
Figure 1—figure supplement 1
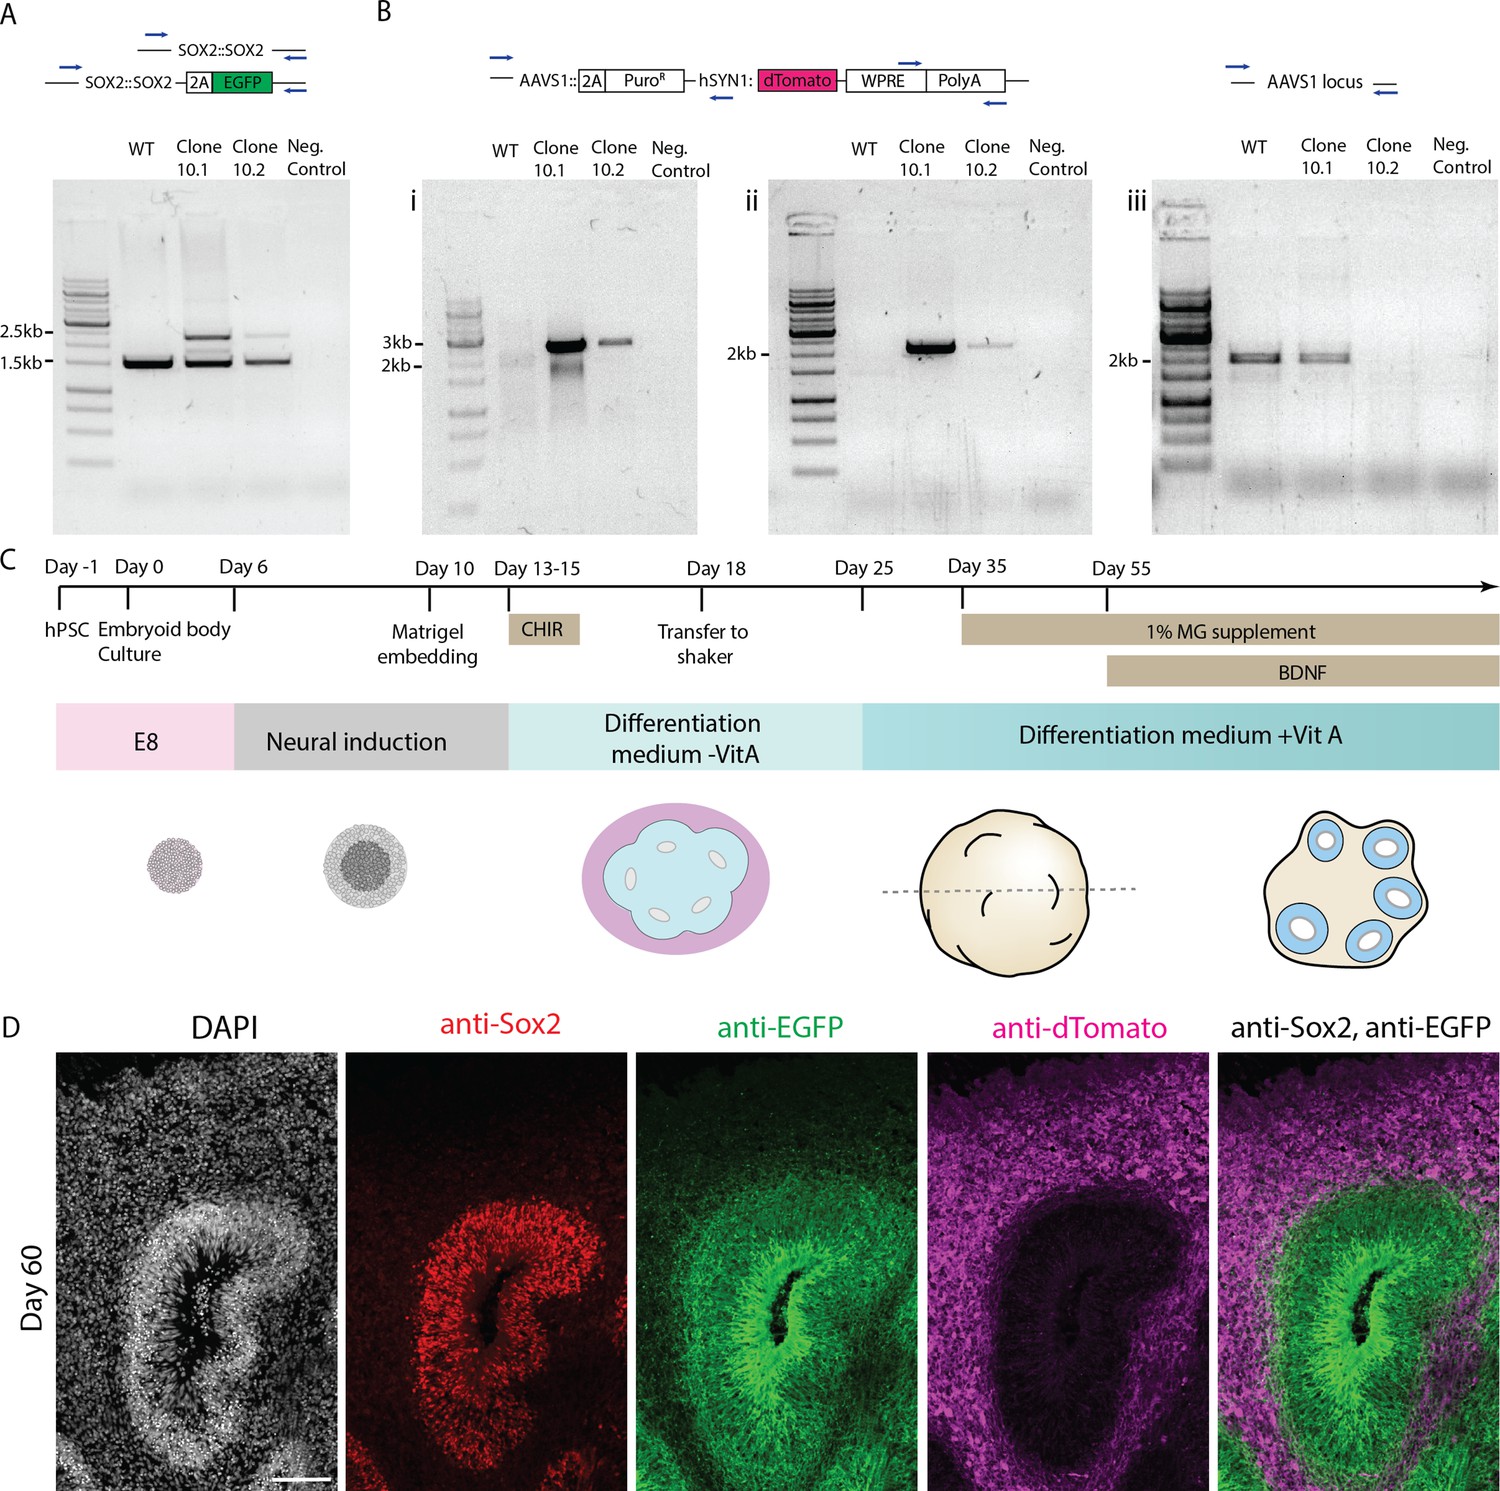
Generation of a dual reporter human embryonic stem cell (hESC) line to differentially label neural progenitors and neurons.
(A) Results of genotyping PCR for H9 WT hESCs, dual reporter H9 hESC clones and negative control samples to test integration of the P2A-EGFP fragment in the SOX2 genomic locus. Integration of EGFP leads to the ~2.5 kb band. Unedited SOX2 genomic locus is marked by the ~1.5 kb band. (B) Results of genotyping PCRs for H9 WT hESCs, dual reporter H9 hESC clones, and negative control samples to test integration of the hSYN1:dTomato-WPRE-polyA transgene into the AAVS1 locus. PCRs (i) and (ii) test the presence of the transgene. For PCR (iii) a 2 kb band indicates an unedited AAVS1 locus and thus reports the zygosity of AAVS1 locus after transgene insertion. (C) Schematic representation of the organoid culture protocol used in this study. (D) Confocal scan of 40-day-old dual reporter organoid section immunostained with anti-SOX2, anti-EGFP, and anti-dTomato antibodies. The image shows a typical ventricular zone and surrounding neuronal zone in the organoid tissue. Scale bar = 100 µm.
-
Figure 1—figure supplement 1—source data 1
Original unlabelled files (.scn and .tif) of gel picture for PCR confirming insertion of SOX2-P2A-EGFP casette (see Figure 1—figure supplement 1A) and Puro-hSyn1::dTomato-WPRE-pA casette (see Figure 1—figure supplement 2Bii).
- https://cdn.elifesciences.org/articles/85135/elife-85135-fig1-figsupp1-data1-v1.zip
-
Figure 1—figure supplement 1—source data 2
Labelled file of gel picture for PCR confirming insertion of SOX2-P2A-EGFP casette (see Figure 1—figure supplement 1A) and Puro-hSyn1::dTomato-WPRE-pA casette (see Figure 1—figure supplement 2Bii).
- https://cdn.elifesciences.org/articles/85135/elife-85135-fig1-figsupp1-data2-v1.zip
-
Figure 1—figure supplement 1—source data 3
Original unlabelled files (.scn and .tif) of gel picture for PCR confirming insertion of Puro-hSyn1::dTomato-WPRE-pA casette (see Figure 1—figure supplement 2Bi).
- https://cdn.elifesciences.org/articles/85135/elife-85135-fig1-figsupp1-data3-v1.zip
-
Figure 1—figure supplement 1—source data 4
Labelled file of gel picture for PCR confirming insertion of Puro-hSyn1::dTomato-WPRE-pA casette (see Figure 1—figure supplement 2Bi).
- https://cdn.elifesciences.org/articles/85135/elife-85135-fig1-figsupp1-data4-v1.zip
-
Figure 1—figure supplement 1—source data 5
Original unlabelled files (.scn and .tif) of gel picture for PCR confirming insertion in AAVS1 locus (see Figure 1—figure supplement 2Biii).
- https://cdn.elifesciences.org/articles/85135/elife-85135-fig1-figsupp1-data5-v1.zip
-
Figure 1—figure supplement 1—source data 6
Labelled file of gel picture for PCR confirming insertion in AAVS1 locus (see Figure 1—figure supplement 2Biii).
- https://cdn.elifesciences.org/articles/85135/elife-85135-fig1-figsupp1-data6-v1.zip
Figure 1—figure supplement 2
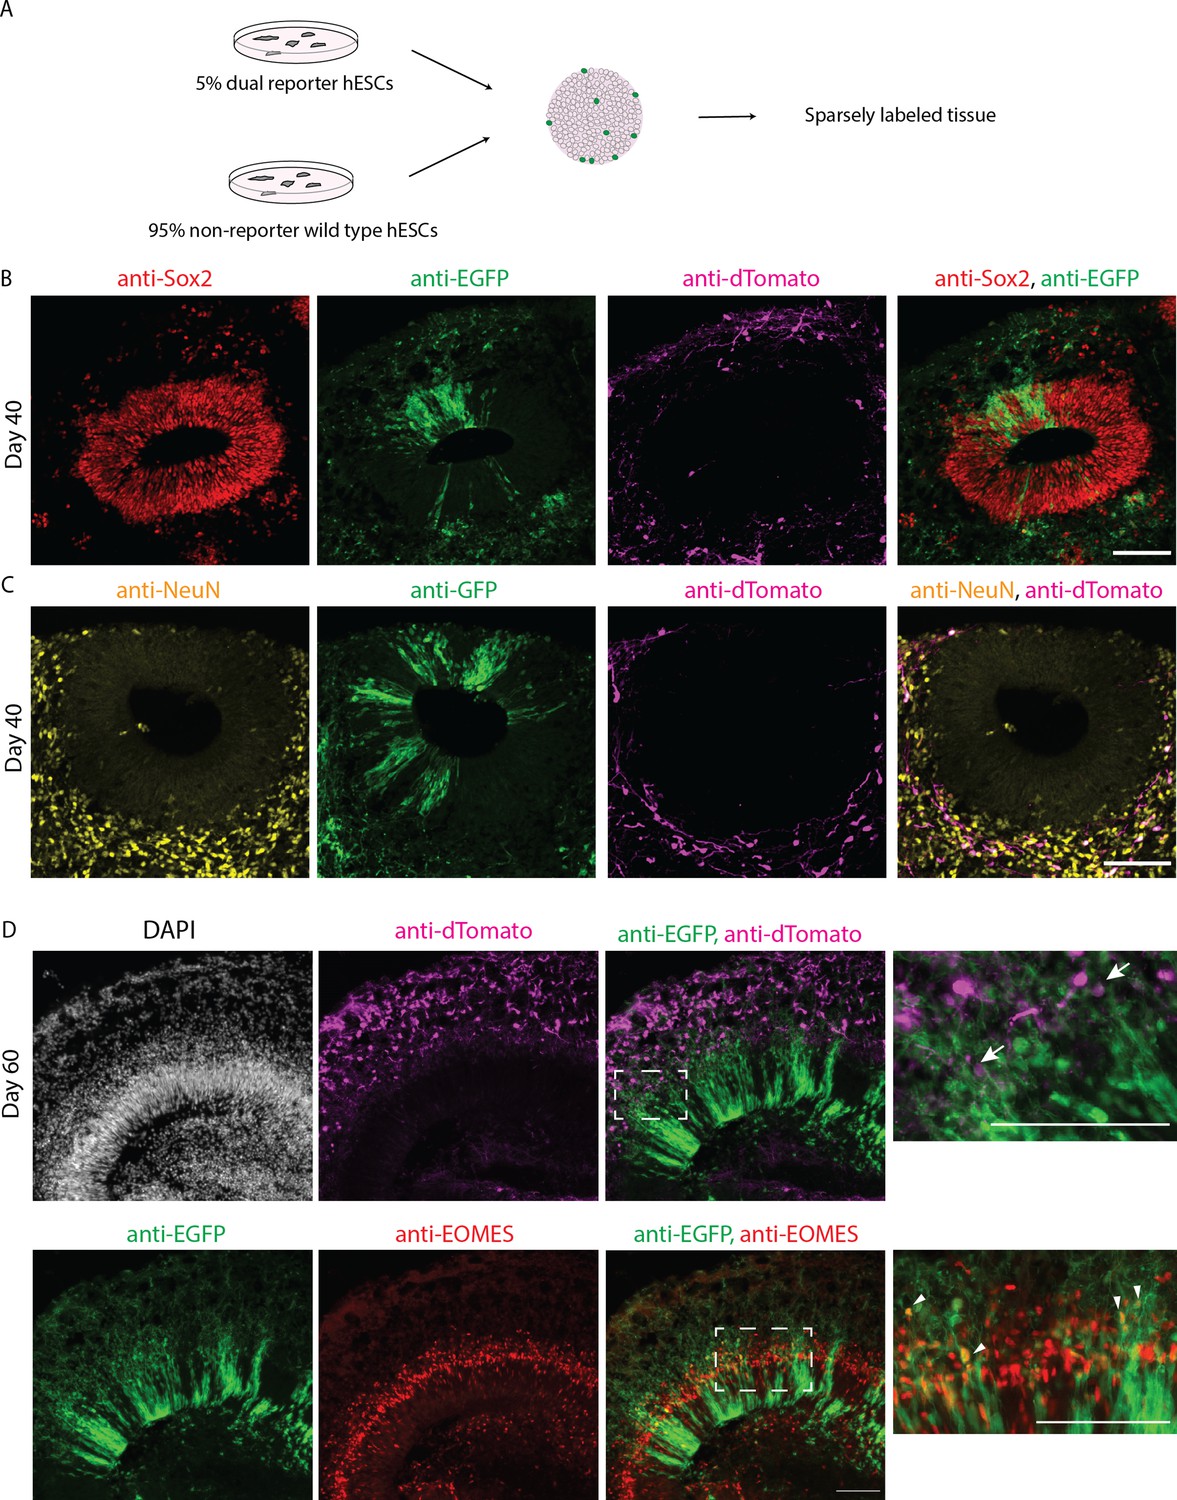
Characterization of the dual reporter using sparse labeling strategy.
(A) Schematic representation of sparse labeling in organoid culture using 95% unlabeled control H9 human embryonic stem cells (hESCs) and 5% dual reporter hESCs for embryoid body formation. (B,C) Confocal scan of 40-day-old sparsely labeled organoid sections immunostained with anti-SOX2 (B), anti-NeuN (C), anti-EGFP, and anti-dTomato antibodies. (D) Confocal scan of 60-day-old sparsely labeled organoid sections immunostained with anti-EOMES (BD), anti-EGFP, and anti-dTomato antibodies. Zoomed-in images of the boxed areas are shown on the right. White arrows point at EGFP+ and dTomato+ double positive cells. White triangles point at EOMES and EGFP+ positive cells. The images show a typical ventricular zone and surrounding neuronal zone in the organoid tissue. Scale bar = 100 µm.
Figure 1—figure supplement 3
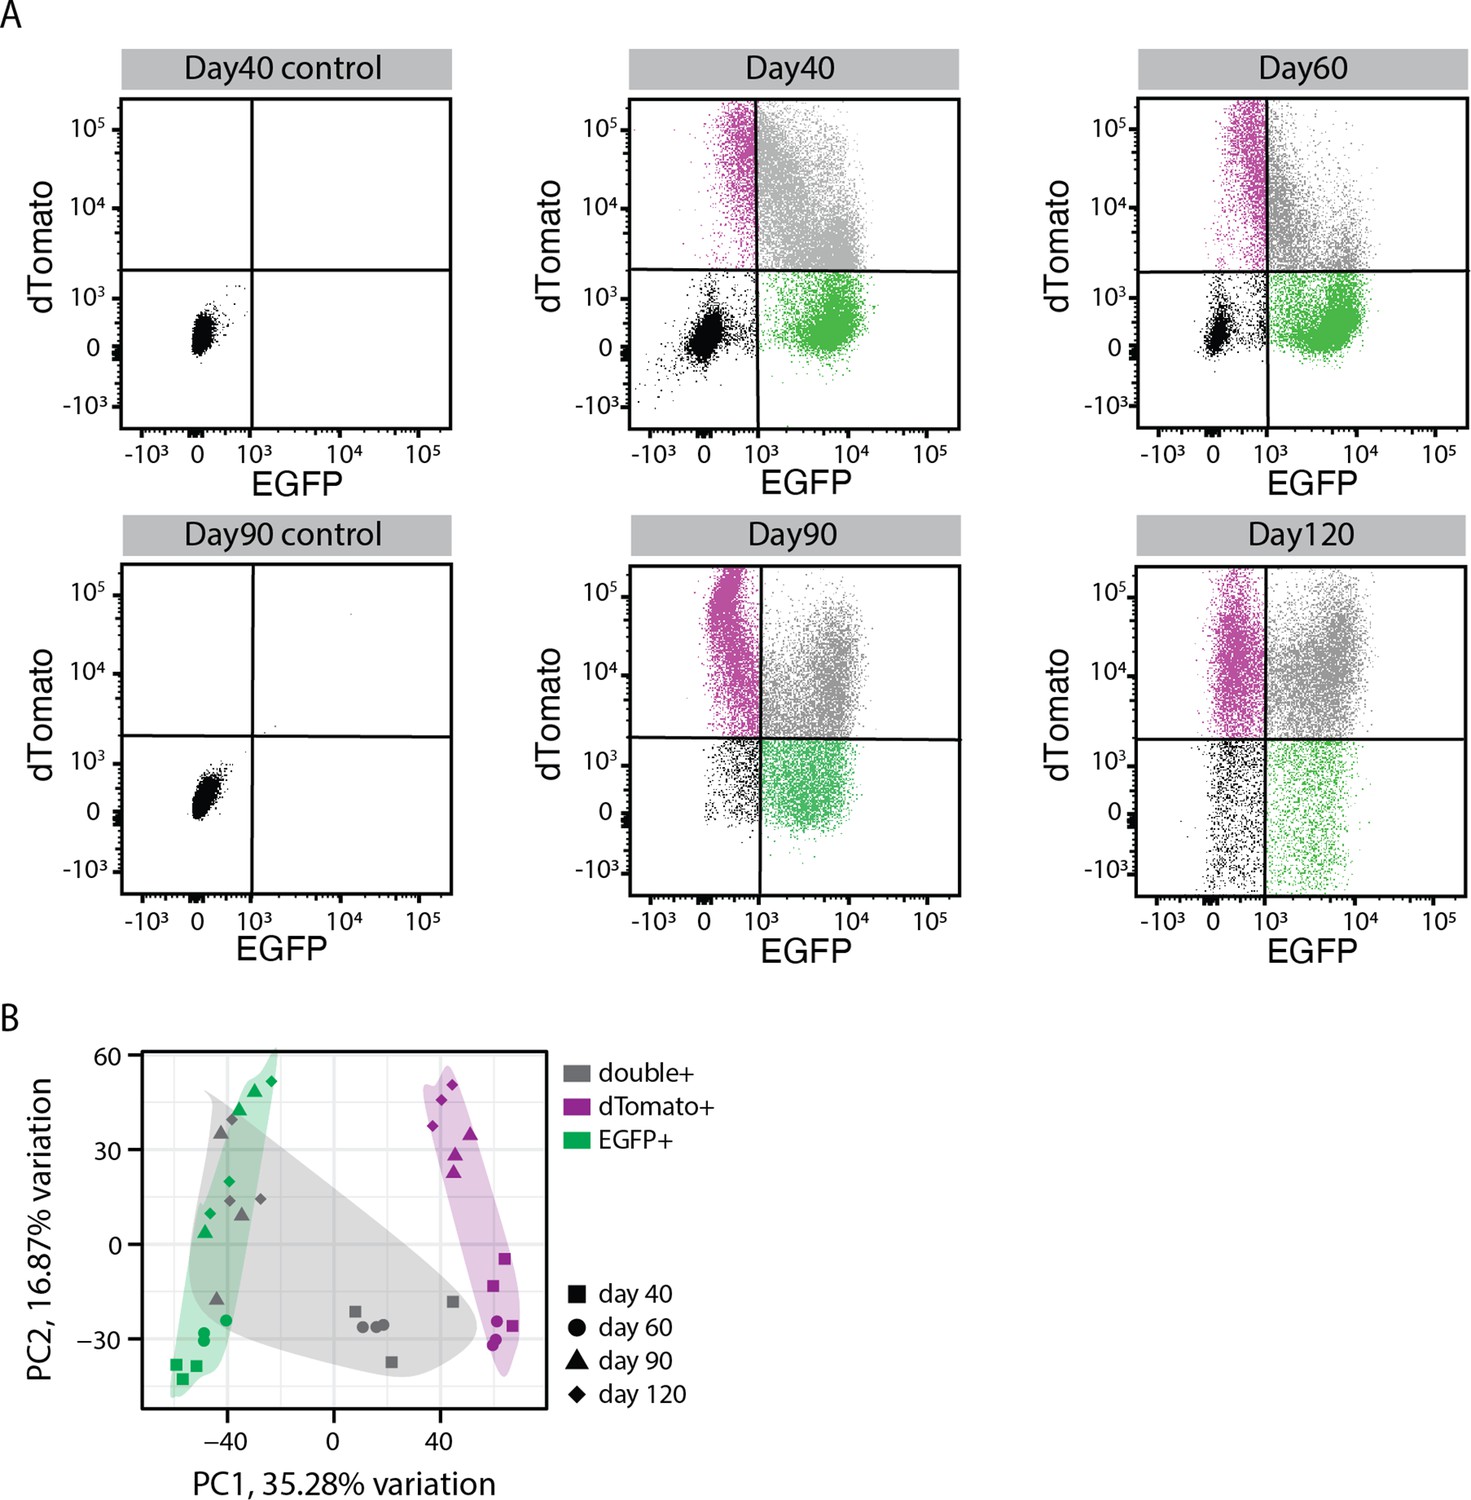
Fluorescent activated cell sorting (FACS) from the dual reporter organoids.
(A) Gating criteria for FACS to sort different cell populations from dual reporter organoids at different organoid development stages. Negative (black), EGFP+ (green), dTomato+ (magenta), EGFP/dTomato double+ (gray) cells. (B) Principal component analysis of transcriptome for sorted EGFP+ (green), dTomato+ (magenta), EGFP/dTomato double+ (gray) cells at 40, 60, 90, and 120 days of organoid development.
Figure 1—figure supplement 4
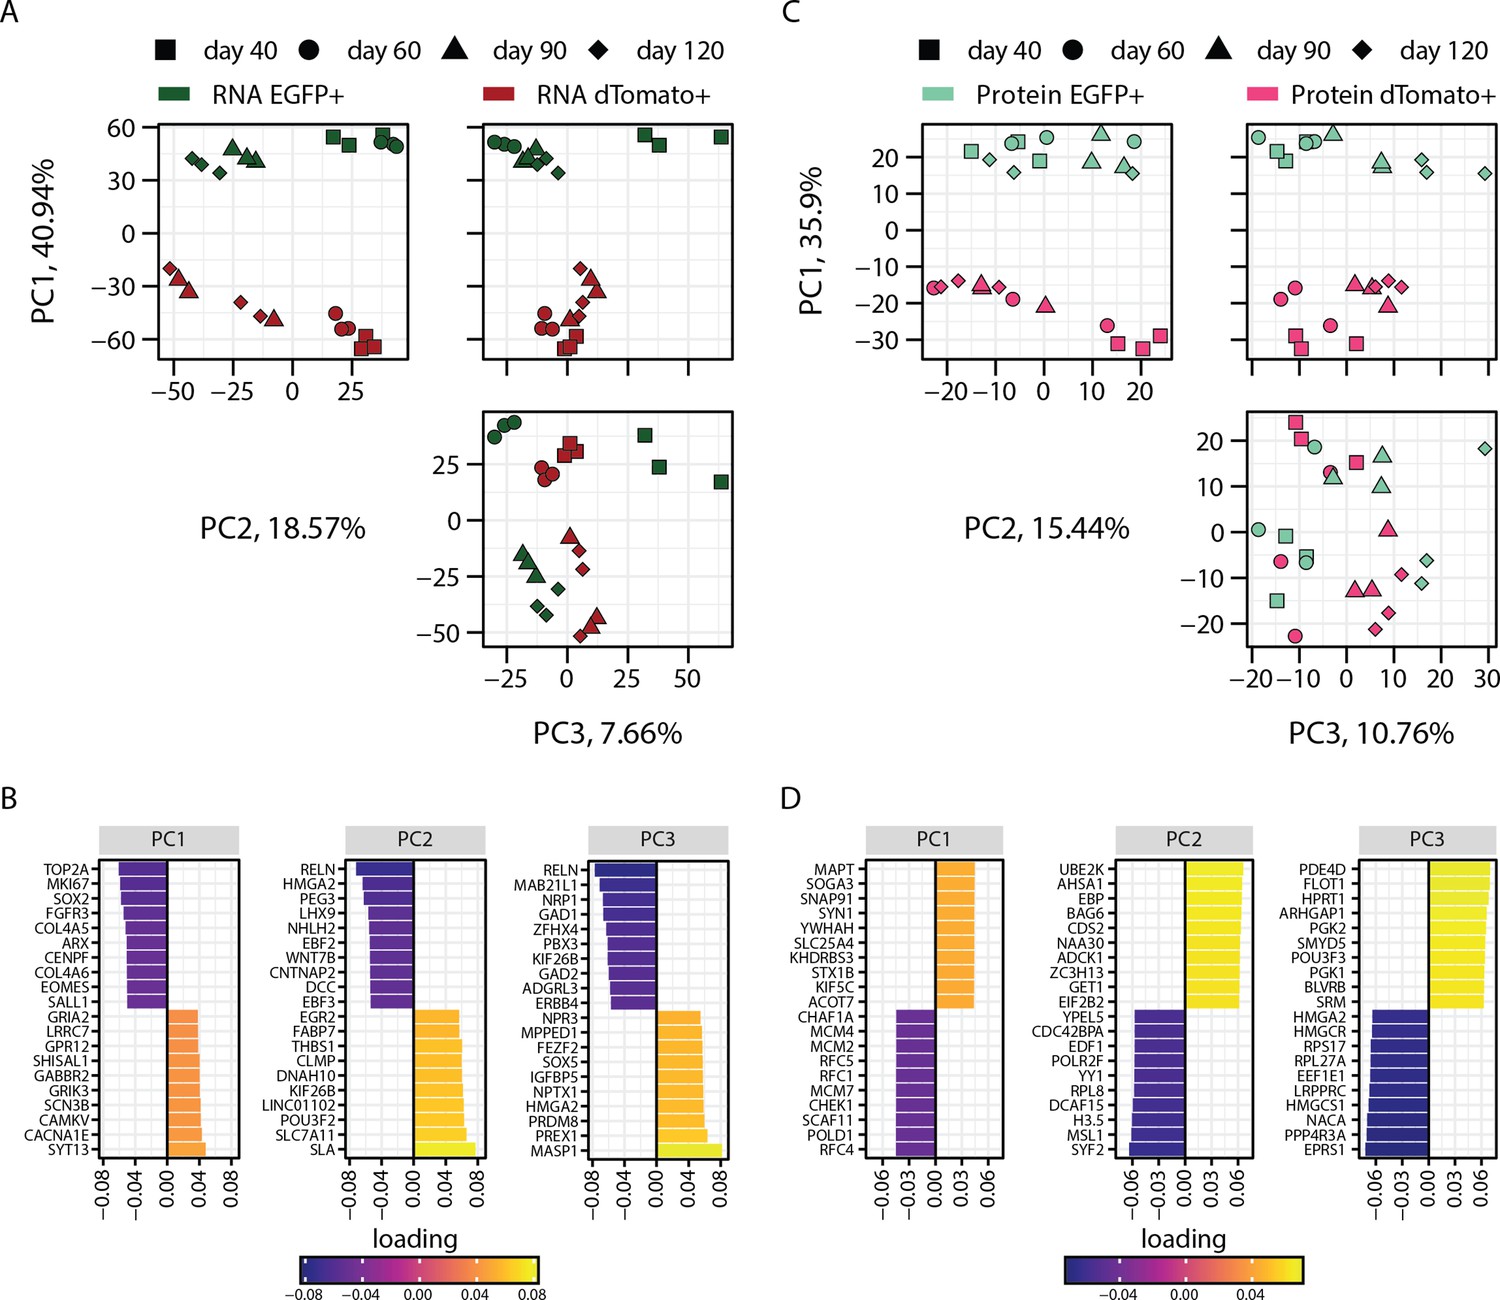
Principal component analysis (PCA) of transcriptome and proteome of progenitors and neurons sorted from dual reporter organoids.
(A) PCA of transcriptome of EGFP+ (dark green) and dTomato+ (red) cells at 40, 60, 90, and 120 days of organoid development (B) with loading scores for PC1, PC2, and PC3 showing top contributing genes. (C) PCA of proteome of EGFP+ (light green) and dTomato+ (magenta) cells at 40, 60, 90, and 120 days of organoid development with (D) loading scores for PC1, PC2, and PC3 showing top contributing genes.
Figure 1—figure supplement 5
Characterization of cell populations fluorescent activated cell sorted from the dual reporter organoids.
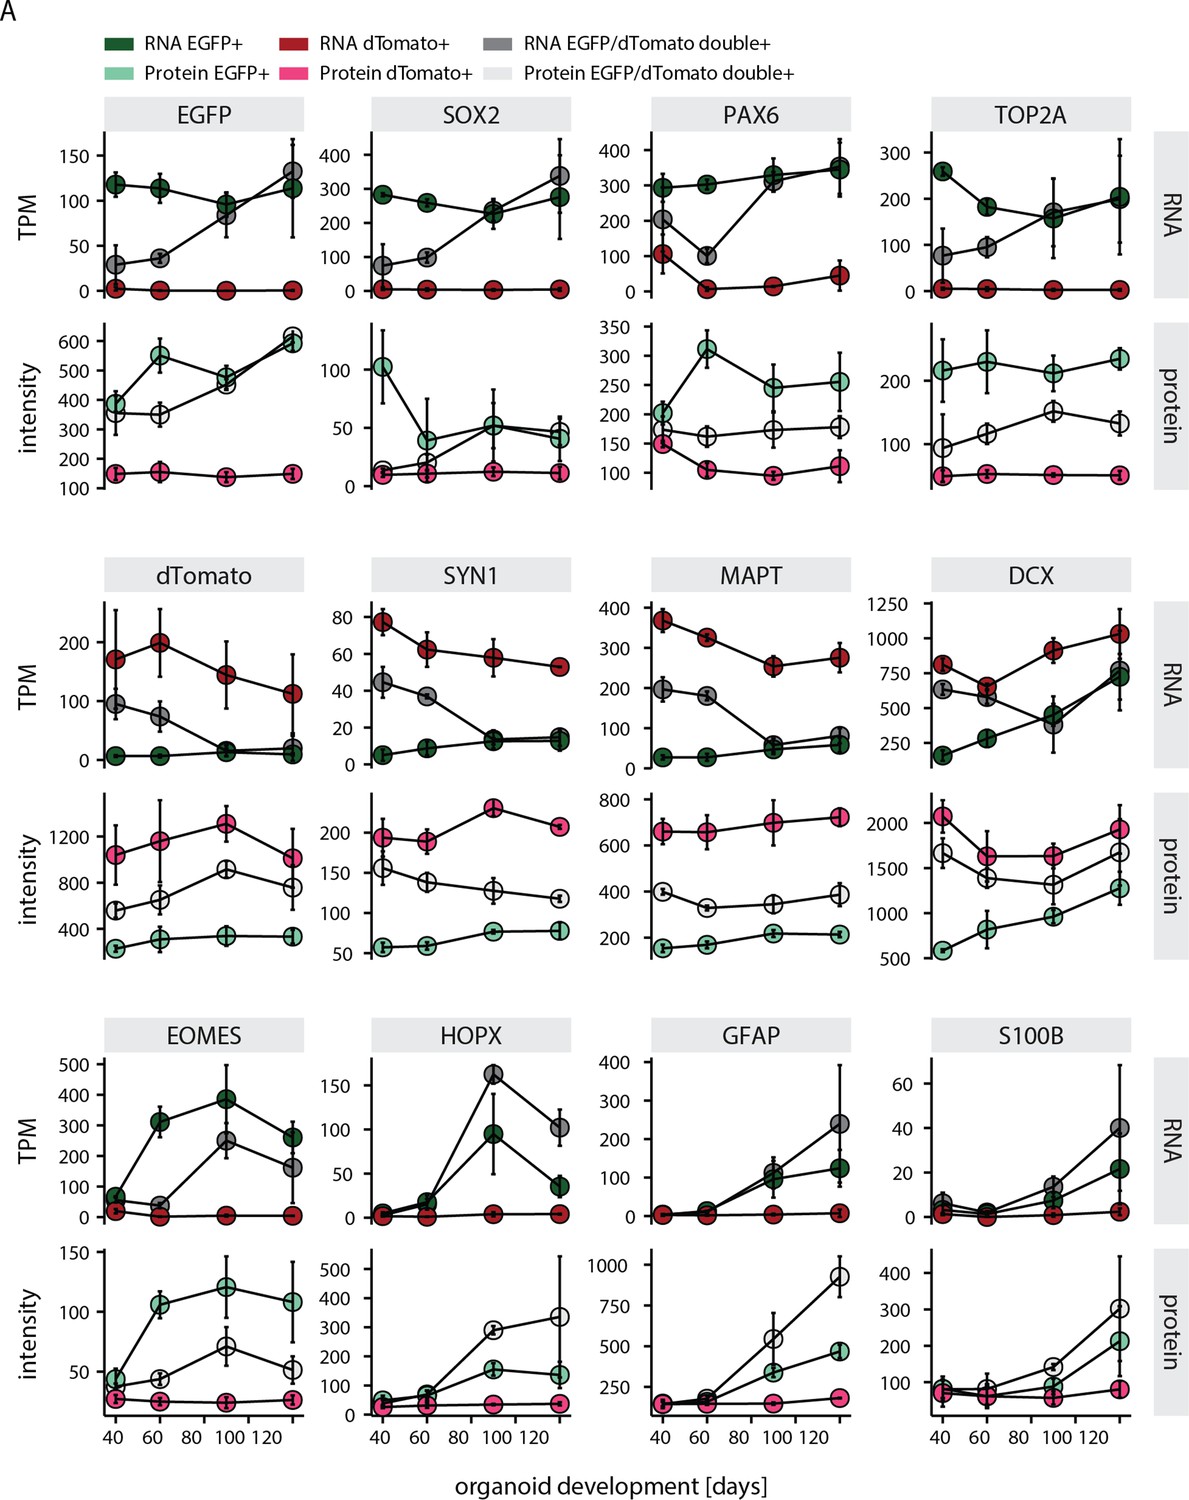
(A) Plots showing RNA (top) and protein (bottom) abundance of key neurodevelopmental markers in EGFP+ (green), dTomato+ positive (red) and EGFP+, dTomato+ double positive (gray) cells at different stages of organoid development. RNA abundance is measured as transcript per million (TPM).
Figure 1—figure supplement 6
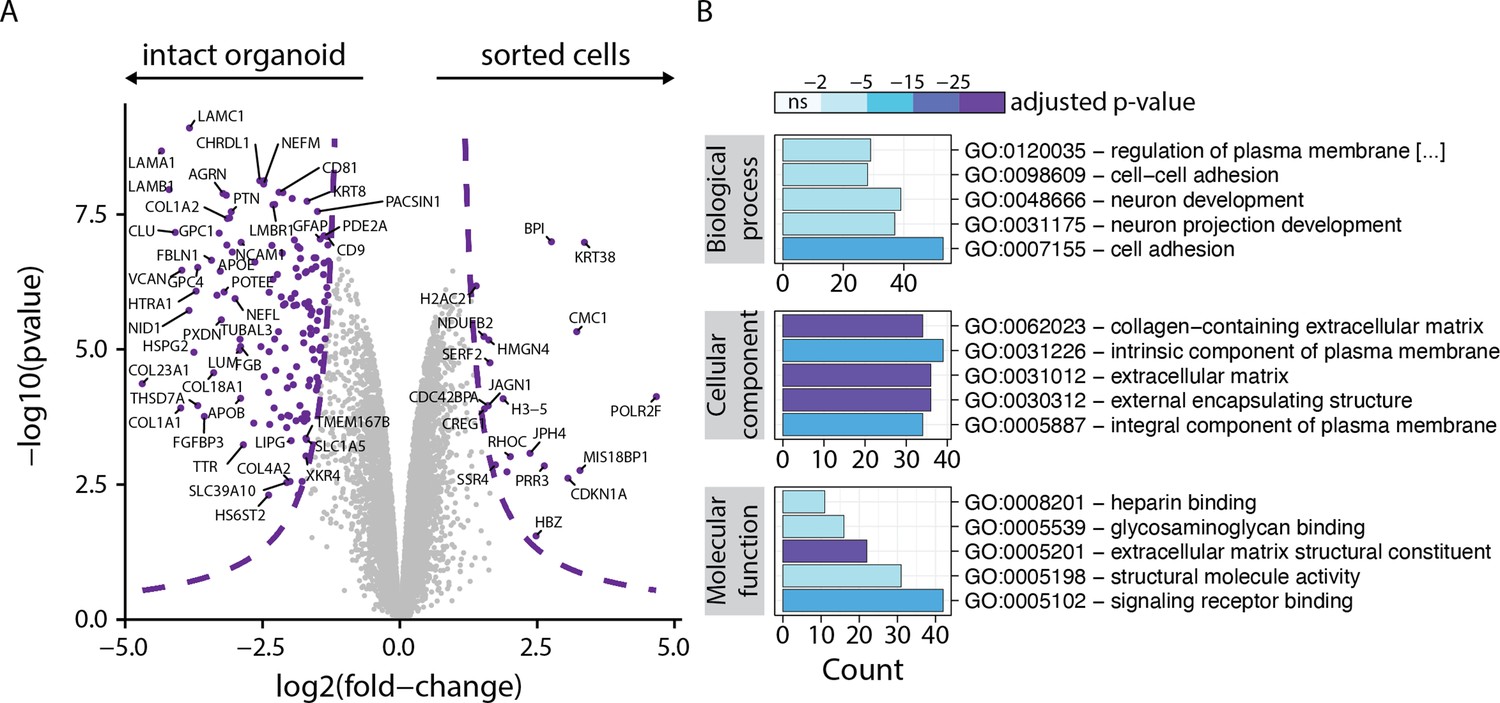
Comparison of proteome of intact organoids and cells sorted using the dual reporter strategy.
(A) Volcano plot of protein fold change between intact organoids and sorted cells versus negative logarithmized p-values. Threshold line at 1% FDR is indicated; 140 proteins are enriched in intact organoids and 20 in the sorted cells. (B) Enrichment analysis for significant proteins for gene ontology biological process (BP), cellular component (CC) and molecular function. Bar fill colors show binned adjusted p-values.
Figure 1—figure supplement 7
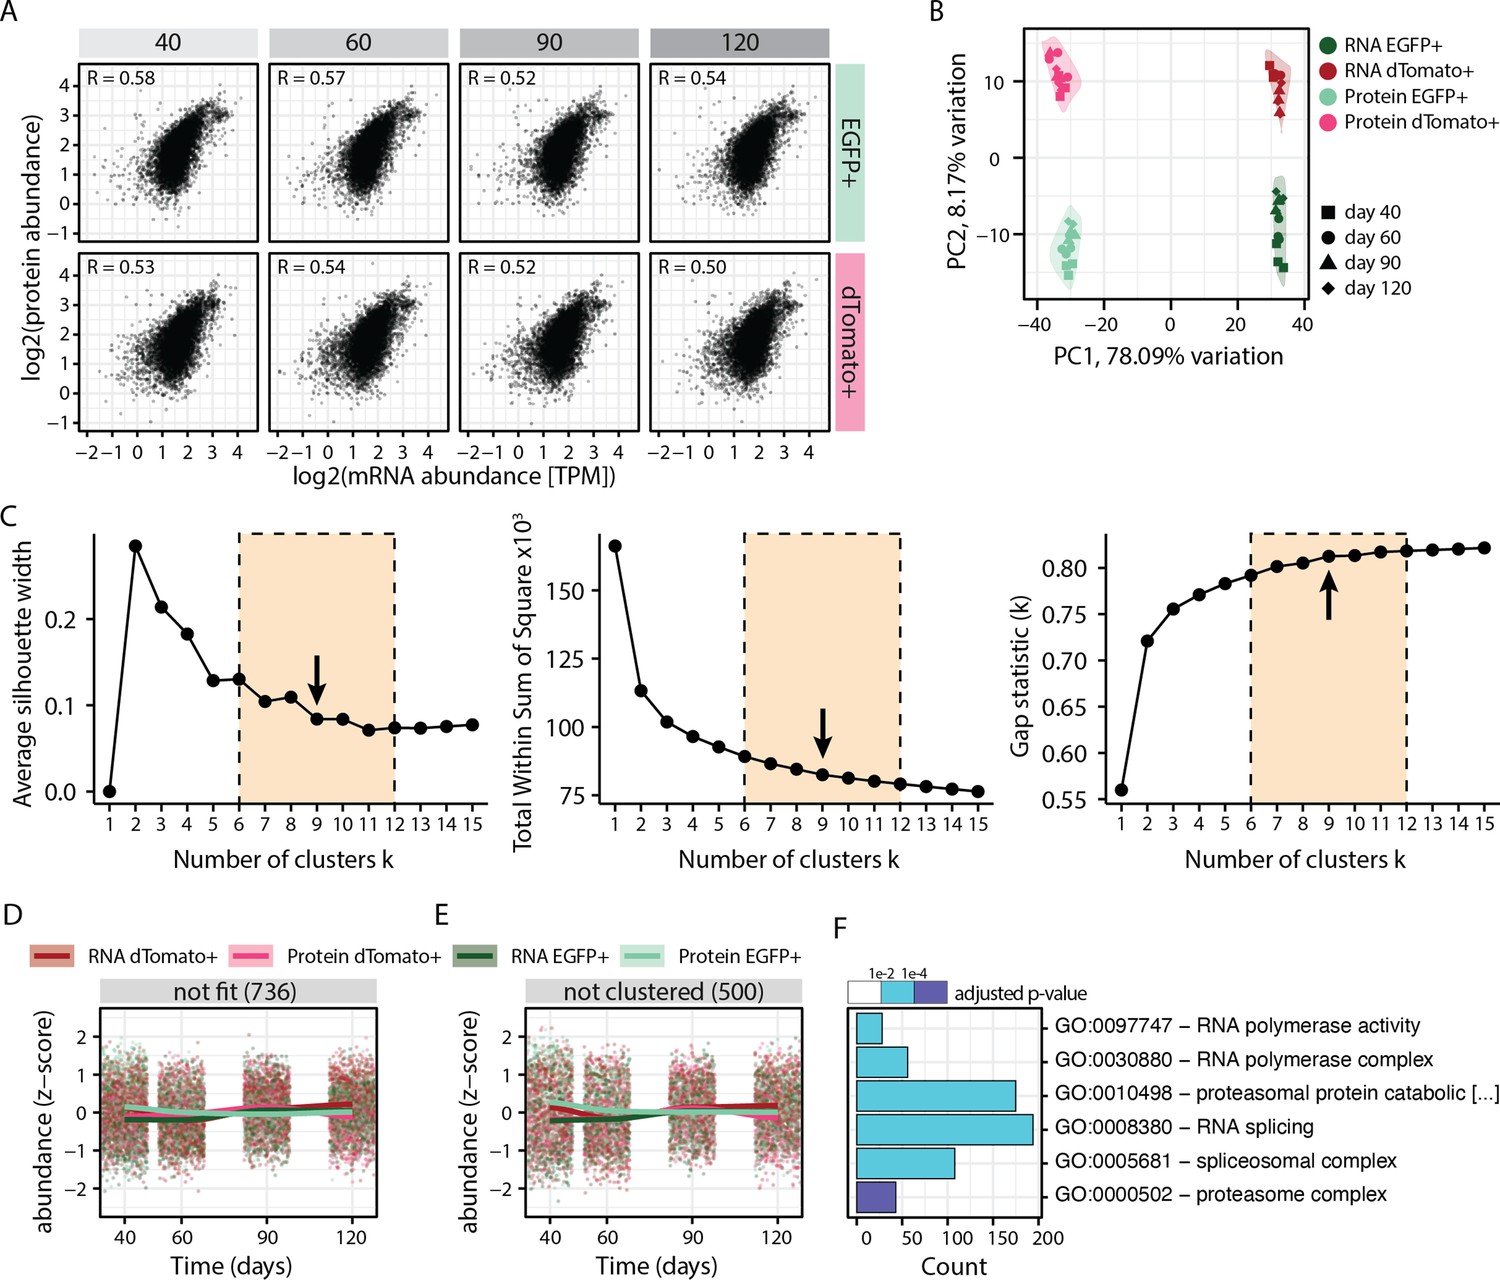
Integration and clustering of the RNA-protein multiomics data.
(A) Plots showing correlation between protein and RNA abundance in progenitors (EGFP+, green) and neurons (dTomato+, red) at different stages of organoid development. (B) Principal component analysis of transcriptome and proteome of progenitors (EGFP+, green) and neurons (dTomato+, red) at different stages of organoid development before z-score normalization. (C) Optimal number of clusters were estimated for z-score normalized data using the ‘average silhouette width’, ‘total within sum of square’, and ‘gap statistics’ methods. Six to twelve clusters were manually evaluated with regards to their biologically meaningfulness and a subjective decision made to separate the data into nine modules. (D,E) Z-score normalized RNA and protein abundance in progenitors (EGFP+, green) and neurons (dTomato+, red) at different stages of organoid development for genes for which the first regression fit failed (D) and 500 randomly sampled genes that were not clustered into any module (E). For each dataset, each dot displays the relative abundance of one gene and a trendline was fit through all data points. (F) Enrichment analysis for gene ontology (GO) for genes with no regression fit and unclustered genes. Shown are six selected GO terms and the number of genes (x-axis) belonging to the respective GO term. Bar fill colors show binned adjusted p-values.
Figure 2 with 2 supplements
Clustering of genes based on relative RNA-protein expression patterns in progenitors and neurons in human brain organoids.
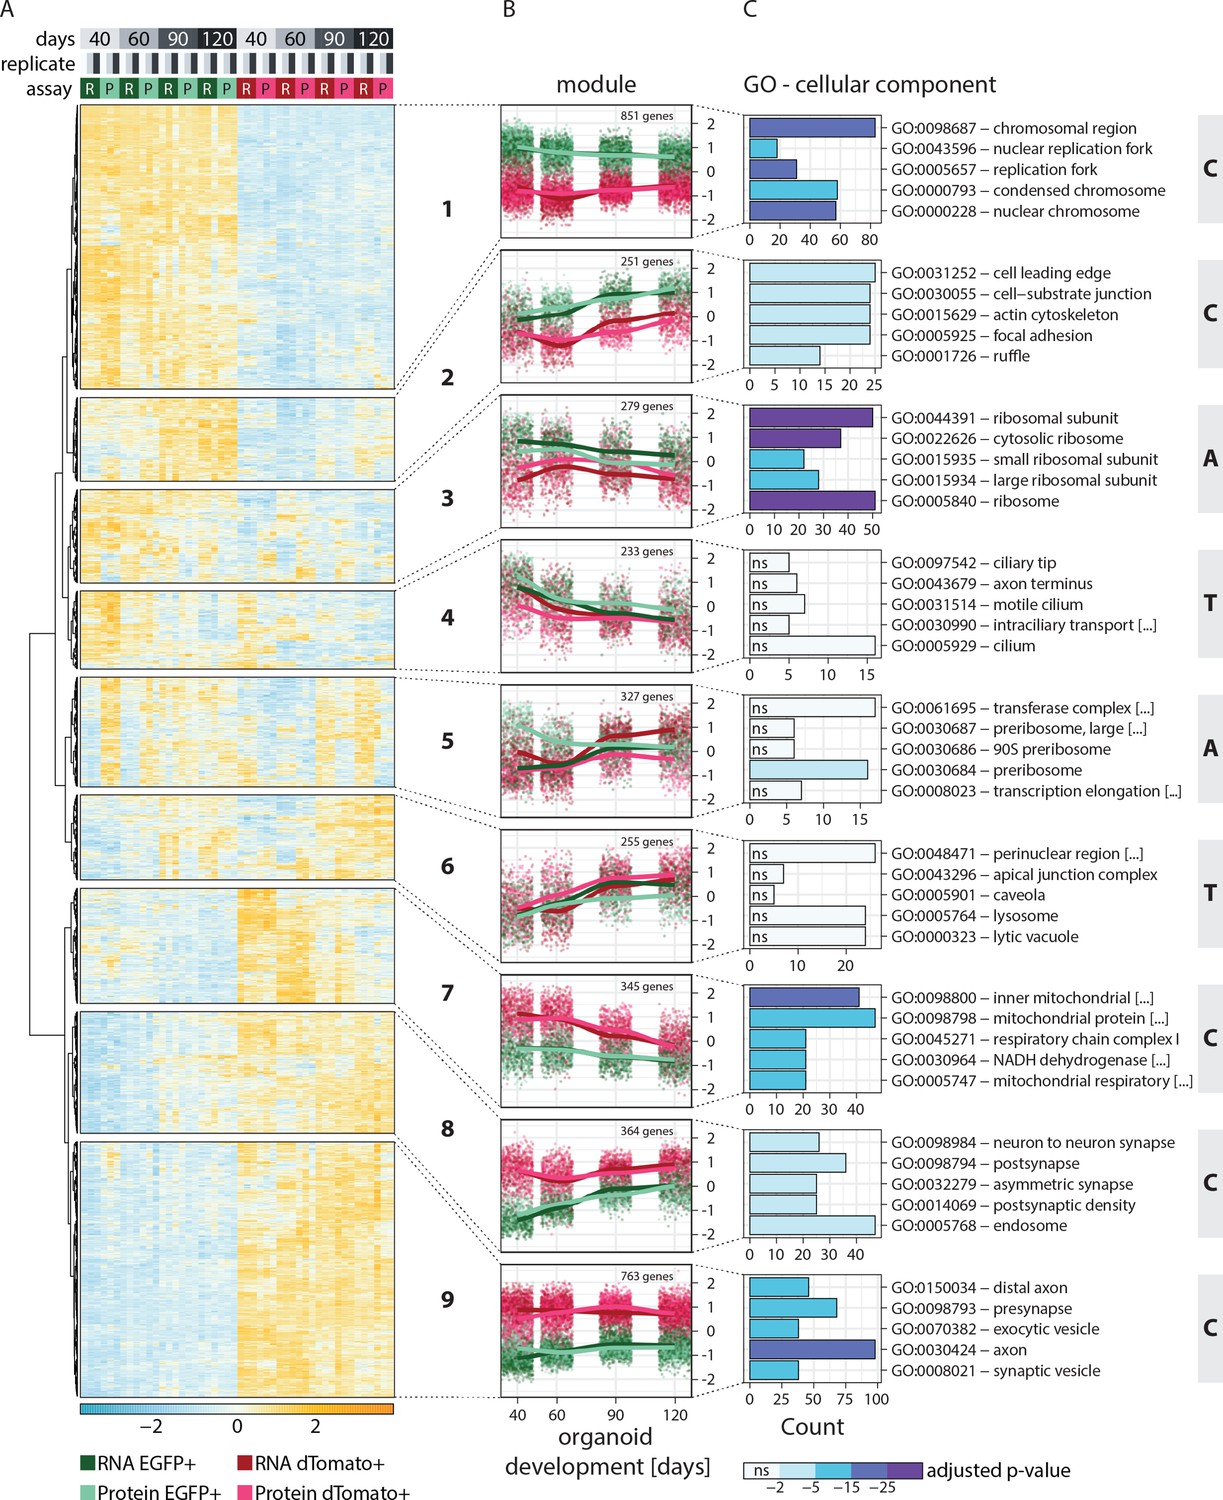
(A) Heatmap showing clustering results for the nine gene expression modules. Z-score normalized abundance of RNA (R) and protein (P) in progenitors (EGFP+, green) and neurons (dTomato+, red) at different stages of organoid development. (B) Z-score normalized RNA and protein abundance in progenitors (EGFP+, green) and neurons (dTomato+, red) at different stages of organoid development for the nine modules. For each dataset, each dot displays the relative abundance of one gene and a trendline was fit through all data points. (C) Enrichment analysis for gene ontology (GO) cellular component (CC) for genes in the nine modules. Shown are the top five enriched terms per module and the number of genes (x-axis) belonging to the respective GO term. Bar fill colors show binned adjusted p-values and not significant (ns) terms are indicated. Modules are categorized according to their global expression pattern: cell class-specific expression (‘C’ modules), temporal expression (‘T’ modules), and ambiguous expression (‘A’ modules).
Figure 2—figure supplement 1
Gene ontology (GO) analysis of gene expression modules.
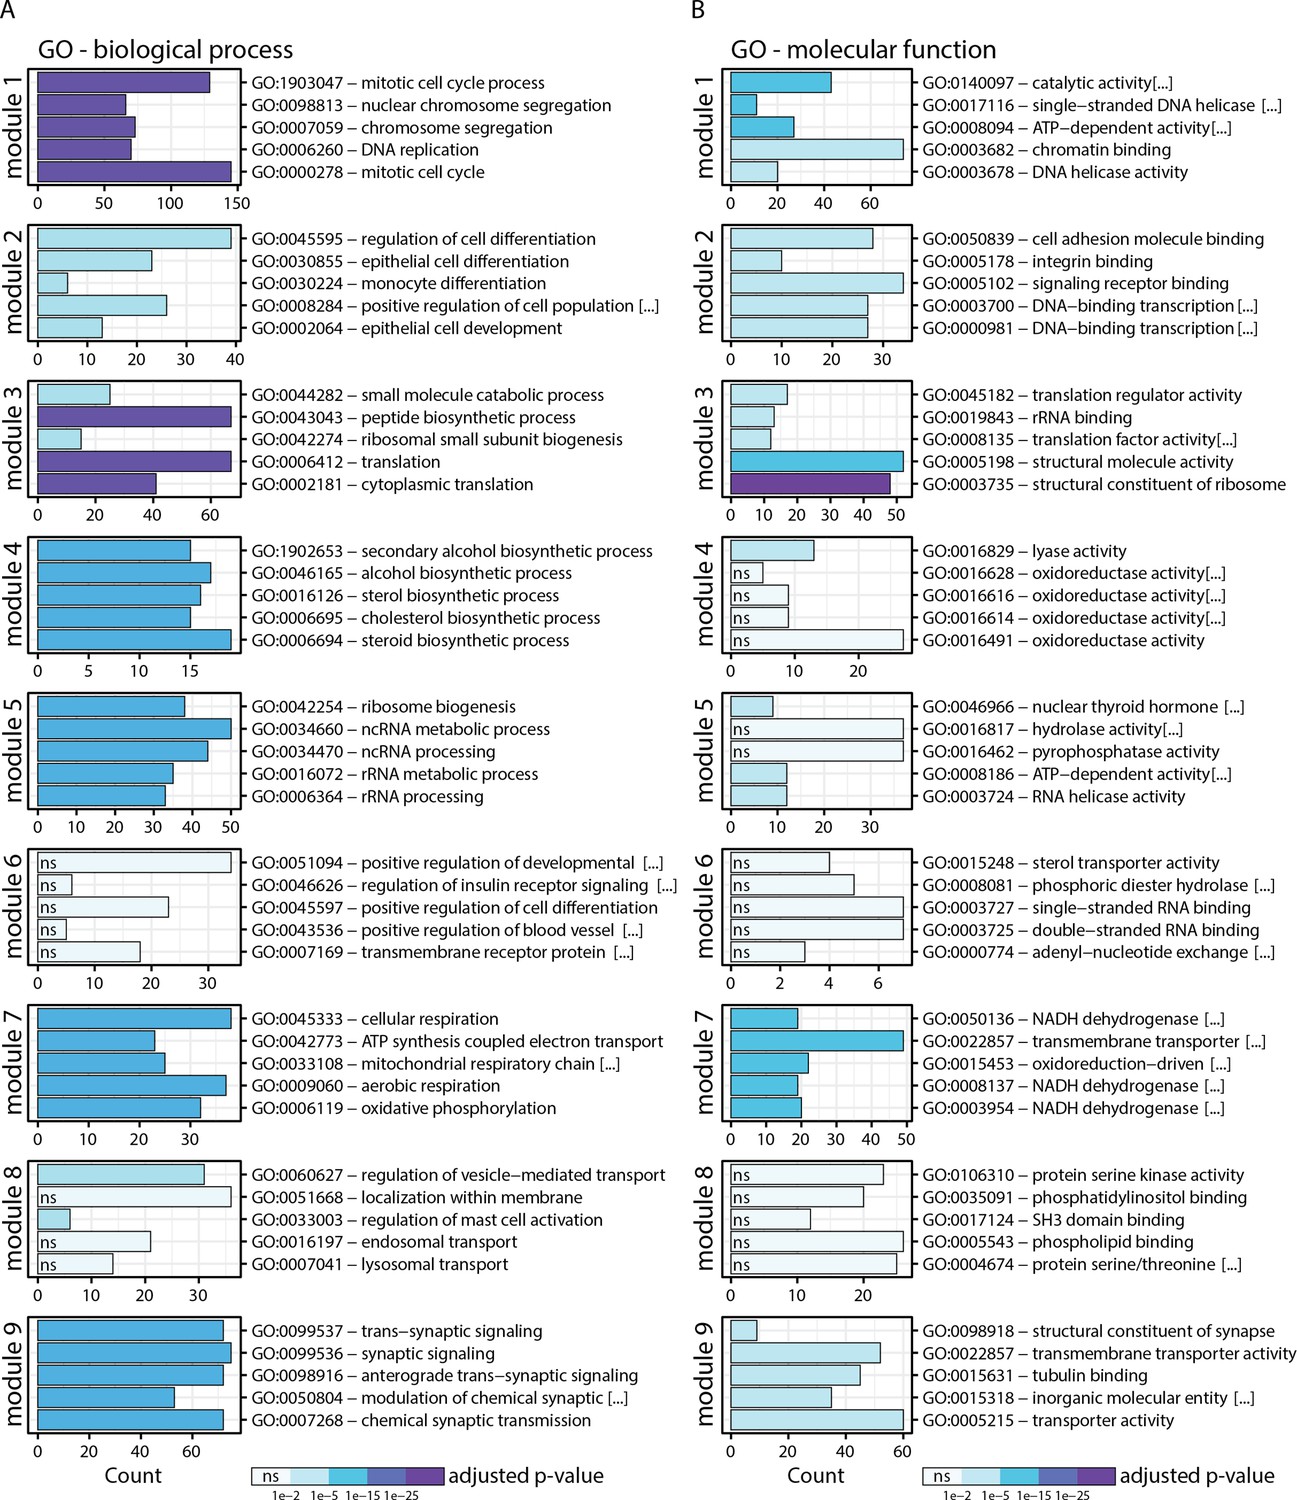
(A,B) Enrichment analysis of genes in the nine modules for (A) GO biological process (BP) and (B) GO molecular function (MF). Shown are the top five enriched terms per module and the number of genes (x-axis) belonging to the respective GO term. Bar fill colors show binned adjusted p-values.
Figure 2—figure supplement 2
Analysis of gene expression modules and correlation between relative RNA-protein abundance.
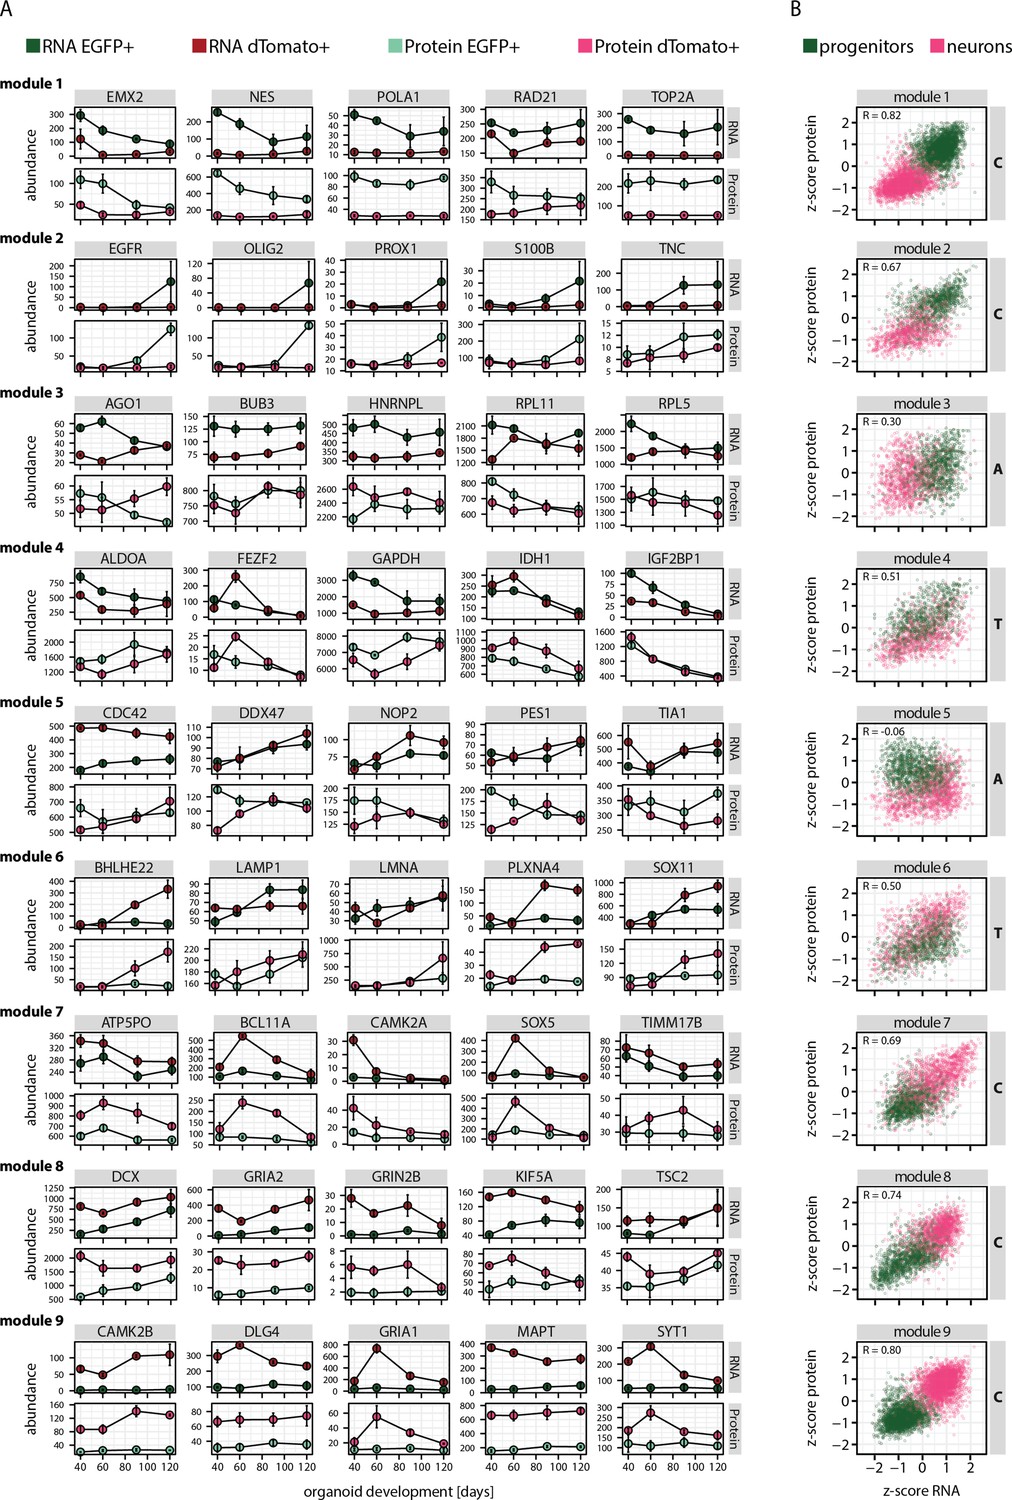
(A) Absolute RNA (transcript per million [TPM]) and protein (intensity) expression in progenitors (EGFP+, green) and neurons (dTomato+, red) of five manually selected member genes per module. (B) Plots showing module-wise correlation between relative abundance (z-score) of RNA and protein in progenitors (green) and neurons (red).
Figure 3 with 1 supplement
Analysis of module-specific RNA regulatory features.
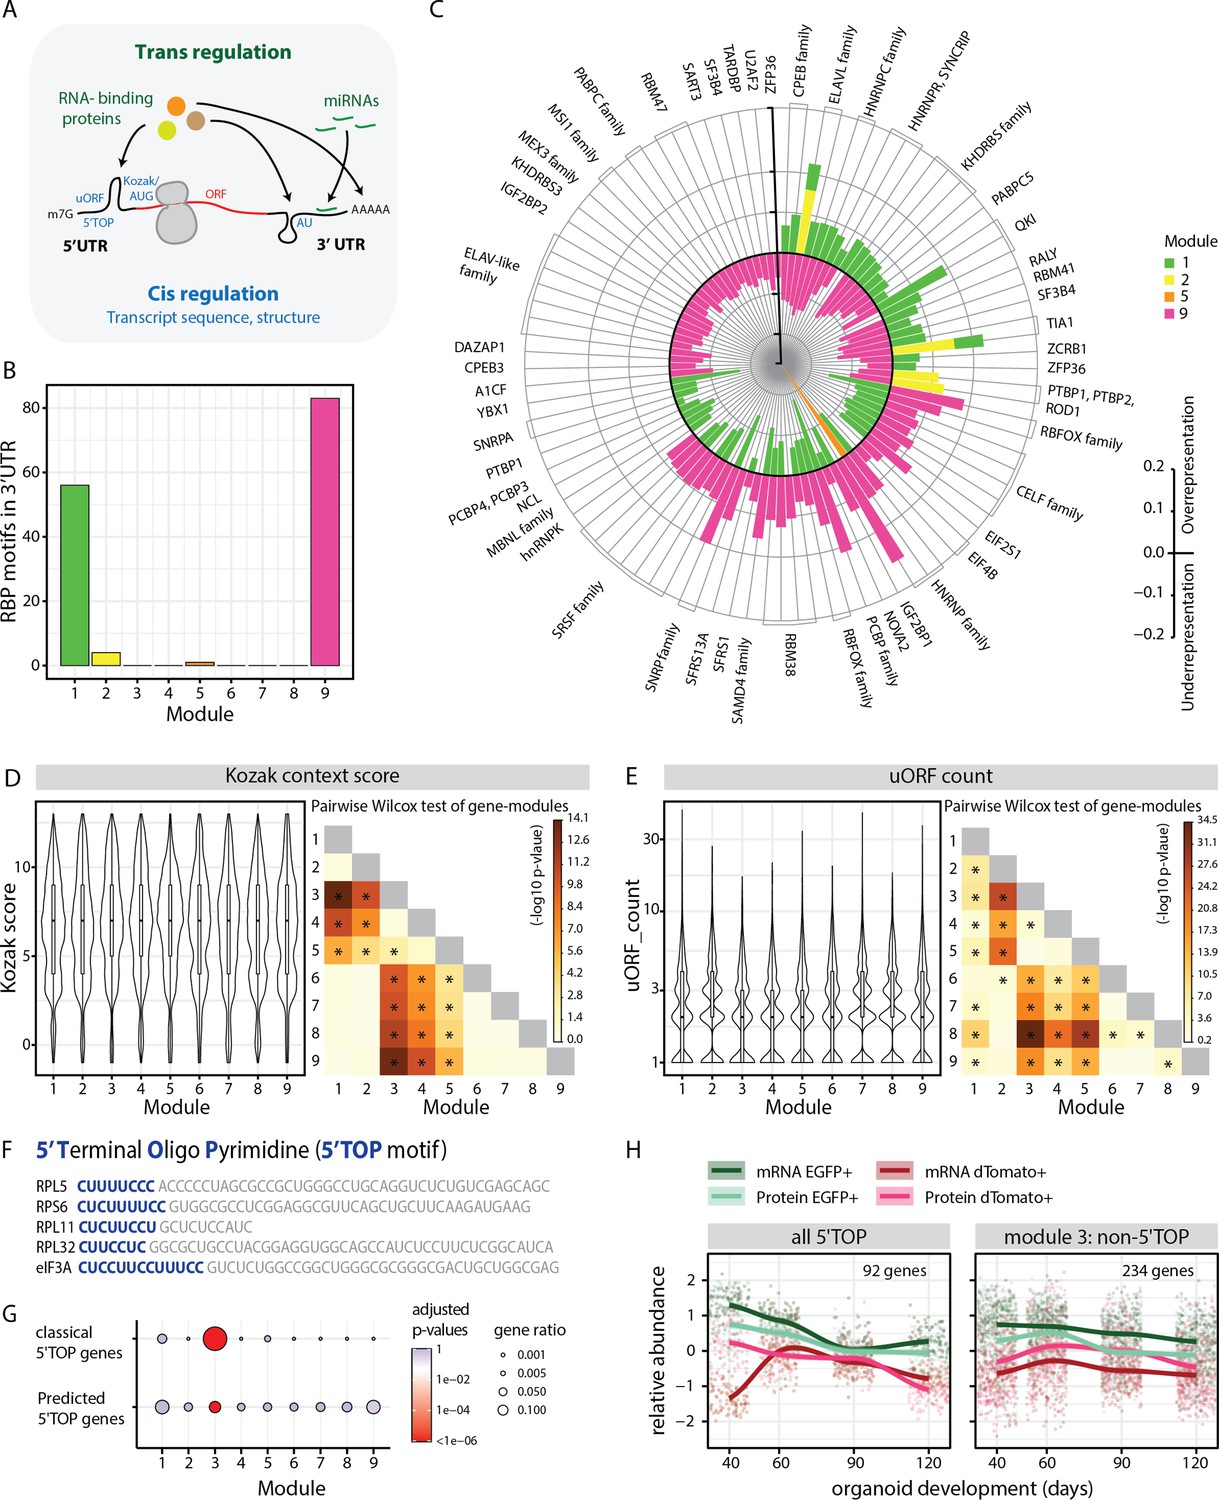
(A) Schematic showing trans-regulation of mRNA translation by RBPs and miRNAs and cis-regulation by mRNA sequence features and secondary structure. (B) Barplot showing number of RBP motifs with significant over/underrepresentation in the 3’UTRs of genes for each module. Significance threshold: adjusted p-value <0.05. (C) Circular barplot showing RBP motifs that are significantly over/underrepresented in modules in (B). Black circle marks zero position. Positive values outside the black circle indicate overrepresentation. Negative values inside the black circle indicate underrepresentation. RBPs for specific motifs are mentioned on the circular axis ticks. Bars are colored according to the module. (D,E) Violin plots of module-wise distribution of Kozak context scores (D) and number of uORFs (E) for transcripts of member genes. Inner boxplots mark median Kozak context scores and interquartile range (IQR). Whiskers extend to 1.5× IQR. The heatmap on the right shows the -log10 p-value of the pairwise Wilcoxon test of gene modules. Significant comparisons are marked by an asterisk (p<0.01). (F) 5’ terminal sequences of five selected 5' terminal oligopyrimidine (5’TOP) transcripts. Pyrimidine-rich 5’TOP sequences are highlighted in blue. (G) Dot plot showing overrepresentation analysis of 5’TOP genes across the nine modules. Significance threshold: adjusted p-value < 0.05. Gene lists refer to classical 5’TOP genes (Philippe et al., 2020) and predicted 5’TOP mRNAs (Yamashita et al., 2008; Figure 3—source data 3). (H) Z-score normalized relative abundance of transcripts and proteins in progenitors and neurons of all 5’TOP genes and of module 3 excluding 5’TOP genes.
-
Figure 3—source data 1
RNA-binding protein motifs in the 3' and 5'UTRs of module genes.
- https://cdn.elifesciences.org/articles/85135/elife-85135-fig3-data1-v1.xlsx
-
Figure 3—source data 2
Transcript feature analysis for the modules.
- https://cdn.elifesciences.org/articles/85135/elife-85135-fig3-data2-v1.xlsx
-
Figure 3—source data 3
Classical and predicted 5'TOP genes.
- https://cdn.elifesciences.org/articles/85135/elife-85135-fig3-data3-v1.xlsx
Figure 3—figure supplement 1
Analysis of module-specific trans- and cis-regulatory features.
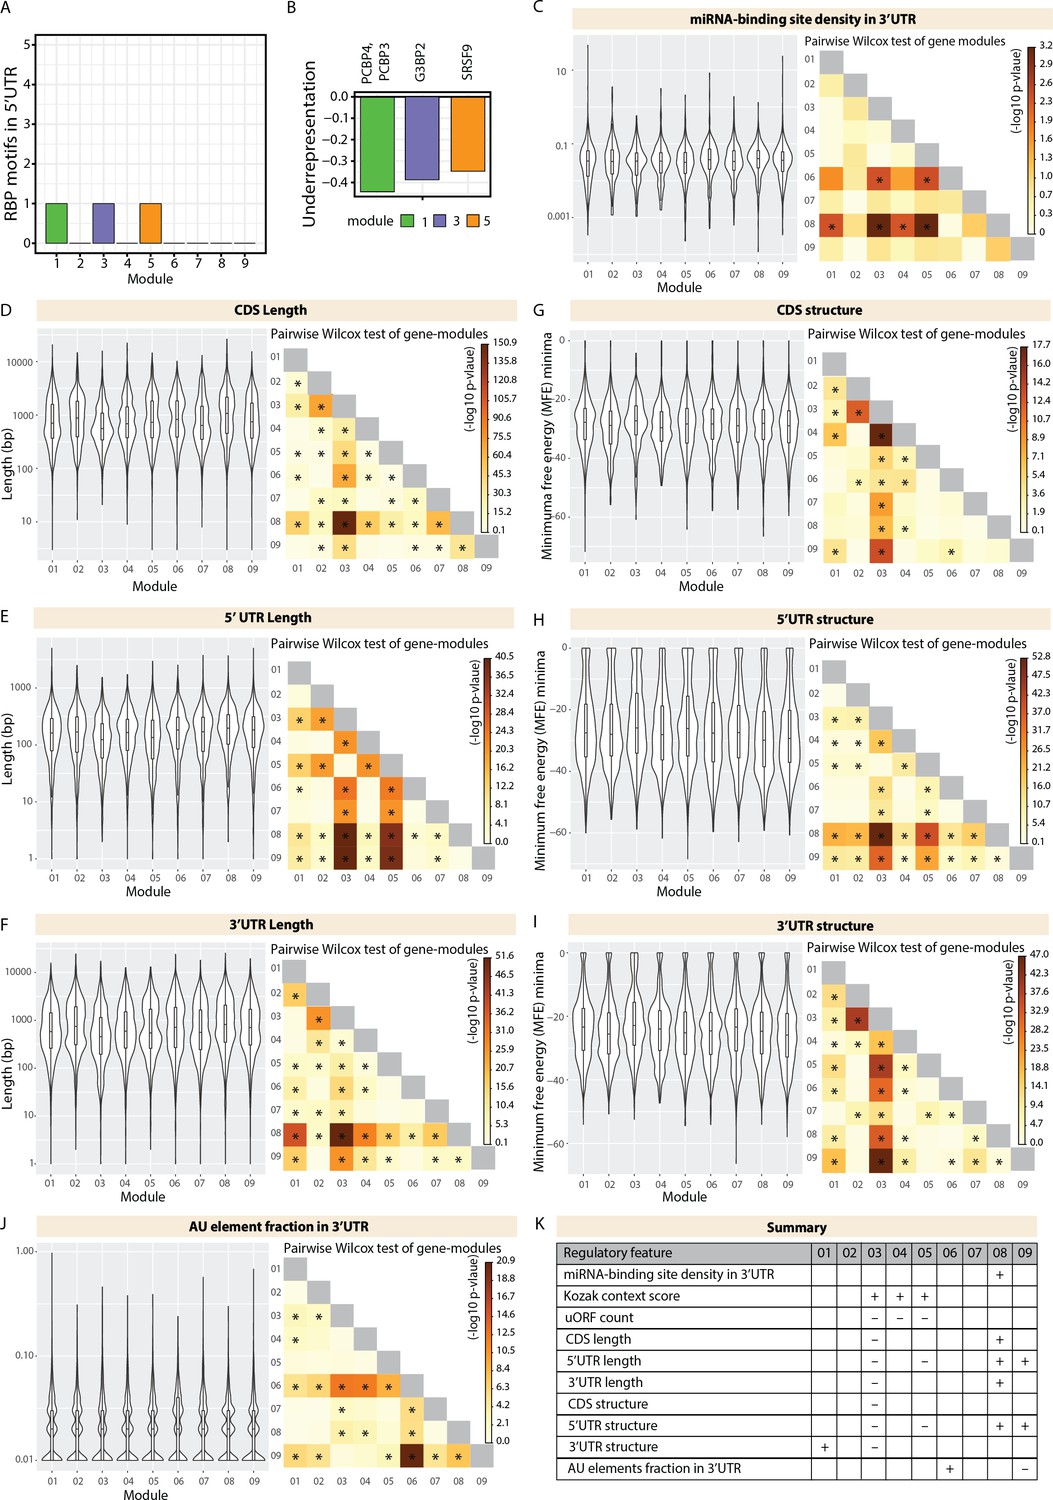
(A) Barplot showing number of RBP motifs with significant over/under representation in 5’UTR of member genes of each gene module. Significance threshold: adjusted p-value <0.05. (B) Barplot showing enrichment of RBP motifs that are significantly over/underrepresented in specific modules in (A). Black line marks zero position. Negative values indicate underrepresentation. RBPs for specific motifs are mentioned in the axis ticks. Bars are colored according to the module. (C) Violin plots of module-wise distribution of miRNA-binding site density for transcripts of member genes. (D,E,F) Violin plots of module-wise distribution of length of (D) coding sequences, (E) 5’UTRs, and (E) 3’UTRs for transcripts of member genes. (G,H,I) Violin plots of module-wise distribution of minimum free energy minima of (G) coding sequences, (H) 5’UTRs, and (I) 3’UTRs for transcripts of member genes. (J) Violin plots of module-wise distribution of adenylate/uridylate (AU) element fraction in the 3’UTRs for transcripts of member genes. For all violin plots (C–J), inner boxplots mark median scores and interquartile range (IQR). Whiskers extend to 1.5× IQR. The heatmap on the right shows the -log10 p-value of the pairwise Wilcoxon test of gene modules. Significant comparisons are marked by an asterisk (p<0.01). (K) Summary table highlighting the cis-regulatory transcript features for the gene expression modules. (+) indicates a significantly higher contribution. (-) indicates a significantly lower contribution.
Figure 4 with 6 supplements
Translation of 5' terminal oligopyrimidine (5'TOP) mRNAs is partially inhibited in early progenitors compared to early born neurons.
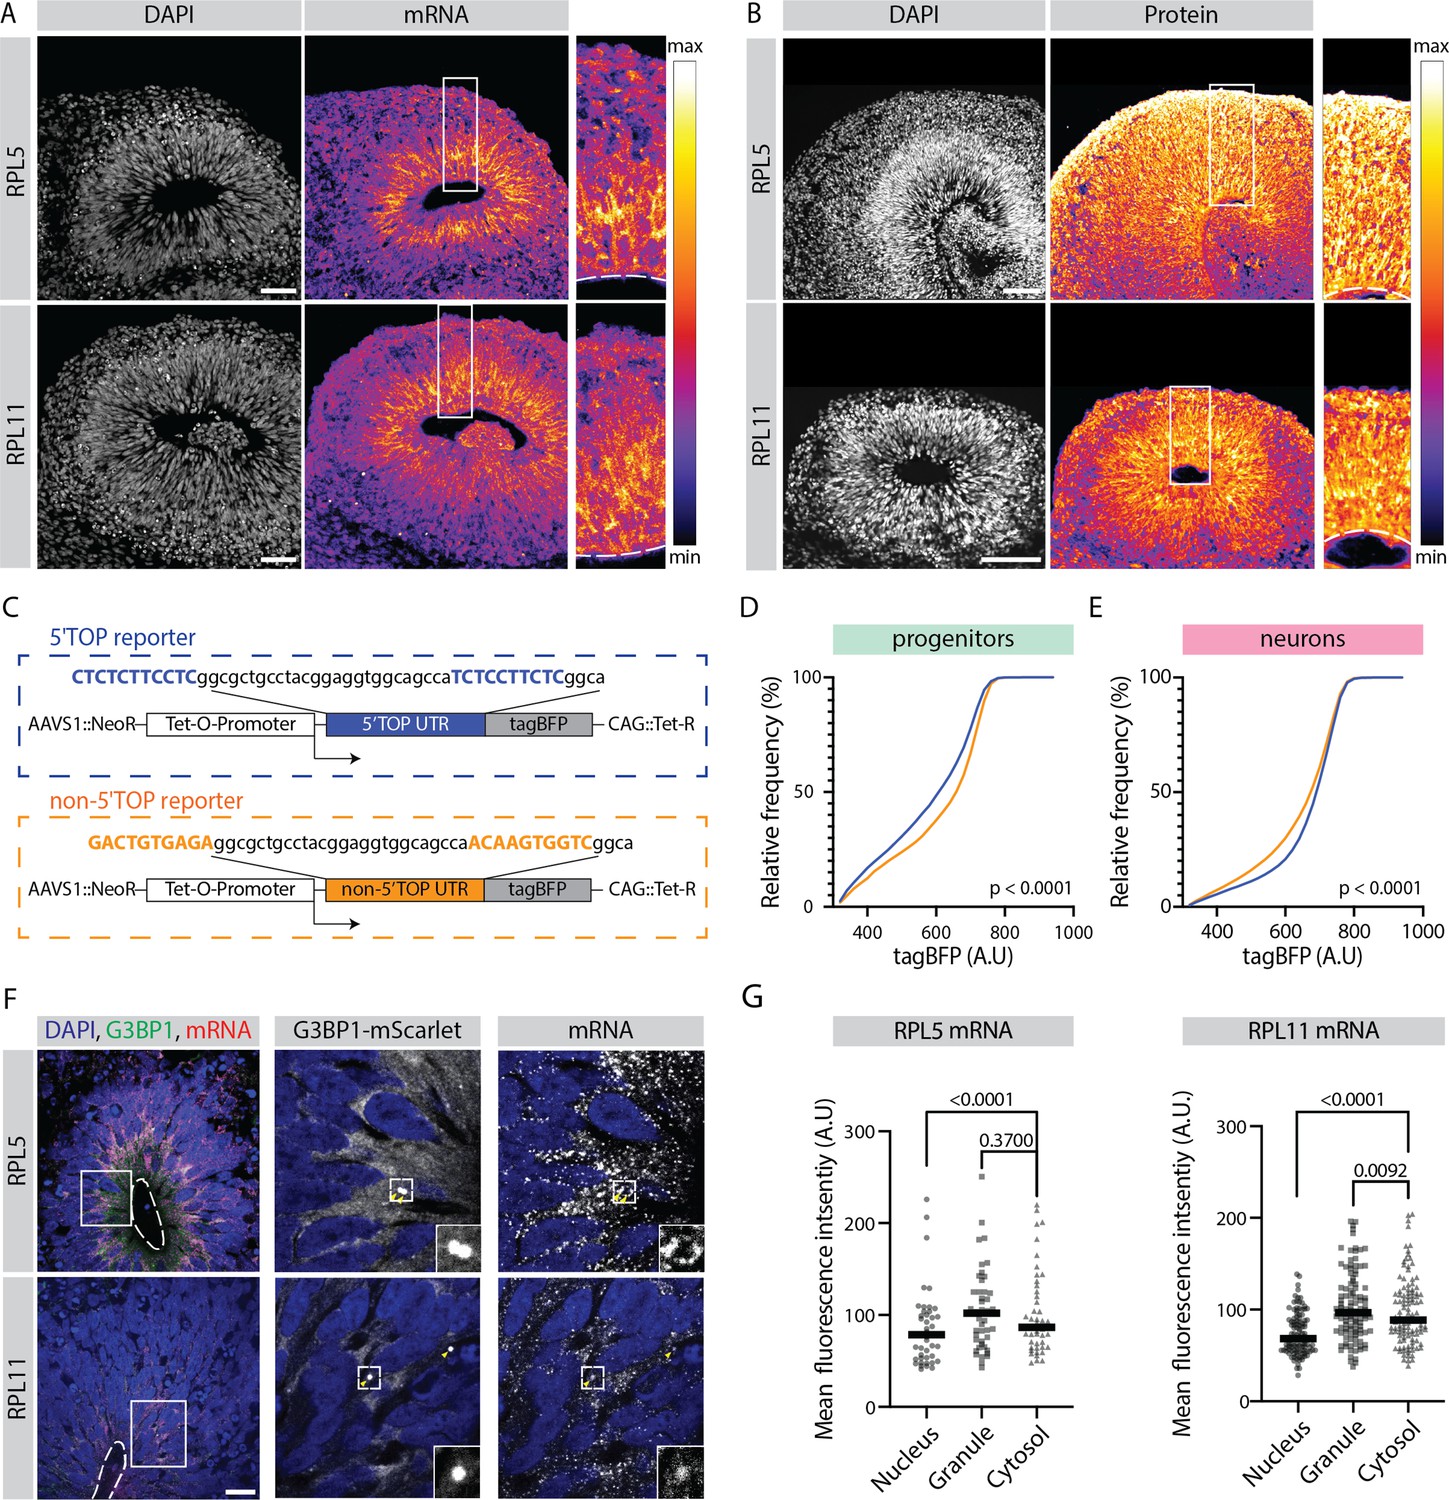
(A) RNA-FISH for the 5’TOP transcripts RPL5 and RPL11 in 40-day-old organoids (H9 background). Images show a typical ventricular zone (VZ)-like structure in the brain organoid with a zoomed-in image of the boxed area on the right. Dotted line marks the apical side of VZ. Scale bar = 50 µm. (B) Immunostaining for the 5’TOP proteins RPL5 and RPL11 in 40-day-old organoids (H9 background). Images show a typical VZ-like structure in the brain organoid with a zoomed-in image of the boxed area on the right. Dotted line marks the apical side of VZ. Scale bar = 50 µm. (C) Schematic representation of the dox-inducible 5’TOP (blue) and non-5’TOP (orange) tagBFP reporter constructs. (D,E) Representative cumulative distribution of reporter tagBFP levels in neural progenitors (D) and in neurons at day 40 (E) from 5’TOP reporter (blue) and non-5’TOP reporter (orange). (F) Confocal scan of a typical VZ-like structure in a 40-day-old organoid (H9 background) expressing G3BP1-mScarlet stained for RPL5 and RPL11 transcripts by RNA-FISH. Zoomed-in image of the inlay shows G3BP1 granules pointed by yellow arrows. Dotted line marks the apical side of VZ. Scale bar = 20 µm. (G) Quantification of RPL5 and RPL11 RNA-FISH signal intensities in the nucleus, G3BP1-positive granules and cytosol of progenitors in the VZ. p-Value of Mann-Whitney test. Each dot represents a cell. (Number of cells analyzed: RPL5: n=45; RPL11: n=34.)
Figure 4—figure supplement 1
Relative protein yield of 5' terminal oligopyrimidine (5’TOP) mRNAs is lower in early progenitors compared to early born neurons.
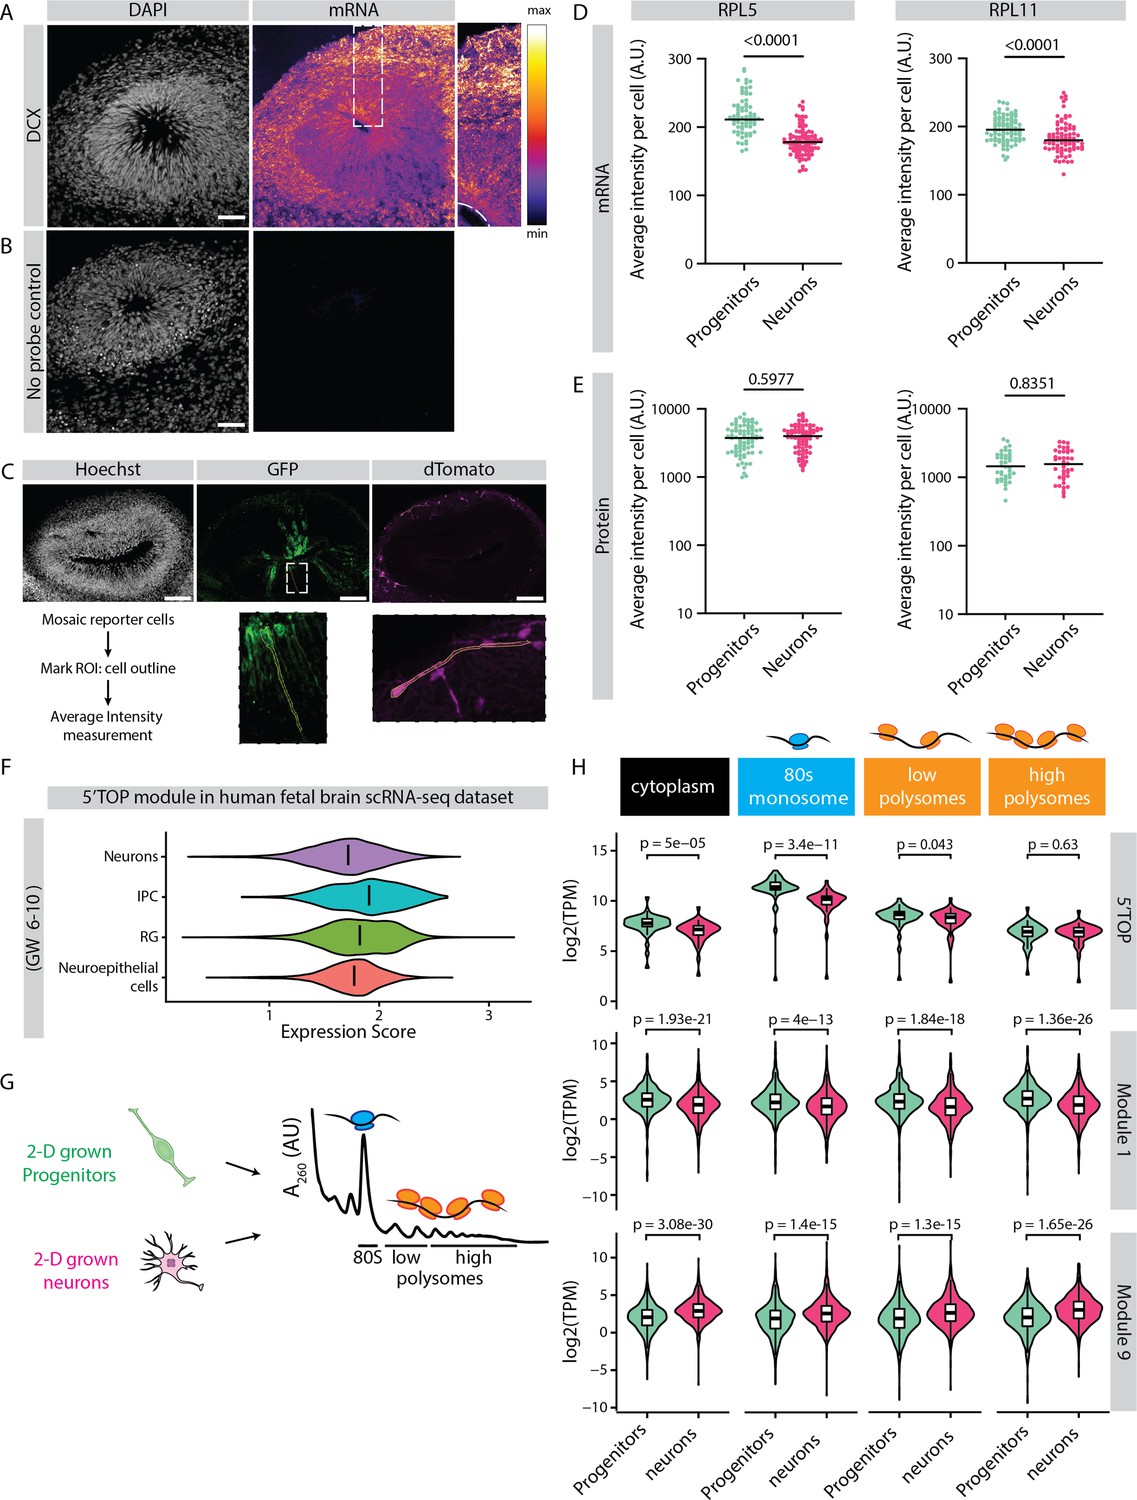
(A,B) RNA-FISH for (A) DCX transcripts and (B) no probe control in 40-day-old organoids (H9 background). Image shows a typical ventricular zone (VZ)-like structure in the brain organoid with a zoomed-in image of the boxed area on the right. Dotted line marks the apical side of the VZ. Scale bar = 50 µm. (C) Schematic representation of cell outlines of mosaic reporter cells marked as regions of interest (ROI) for intensity measurements. (D,E) Average intensities of RPL5 and RPL11 transcripts (D) and protein (E) measured per cell. Each dot represents a cell. Black line marks the median. p-Value of Mann-Whitney test is indicated. (F) Expression score of 5’TOP genes in distinct cell clusters from scRNA-seq data of fetal tissues of gestation weeks 6–10 (Eze et al., 2021). (G) Schematic representation and analysis of polysome profiling of 2D grown progenitors and neurons performed by Blair et al., 2017. (H) Plot represents RNA abundance of genes across different polysome fractions from progenitors and neurons. All 5’TOP genes and genes from modules 1 and 9 are plotted. Inner boxplots mark median and interquartile range (IQR). Whiskers extend to 1.5x IQR. Data from Blair et al., 2017. p-Values of Wilcoxon test are shown.
Figure 4—figure supplement 2
Doxycycline (Dox)-inducible 5' terminal oligopyrimidine (5’TOP)-reporter hPSC lines.
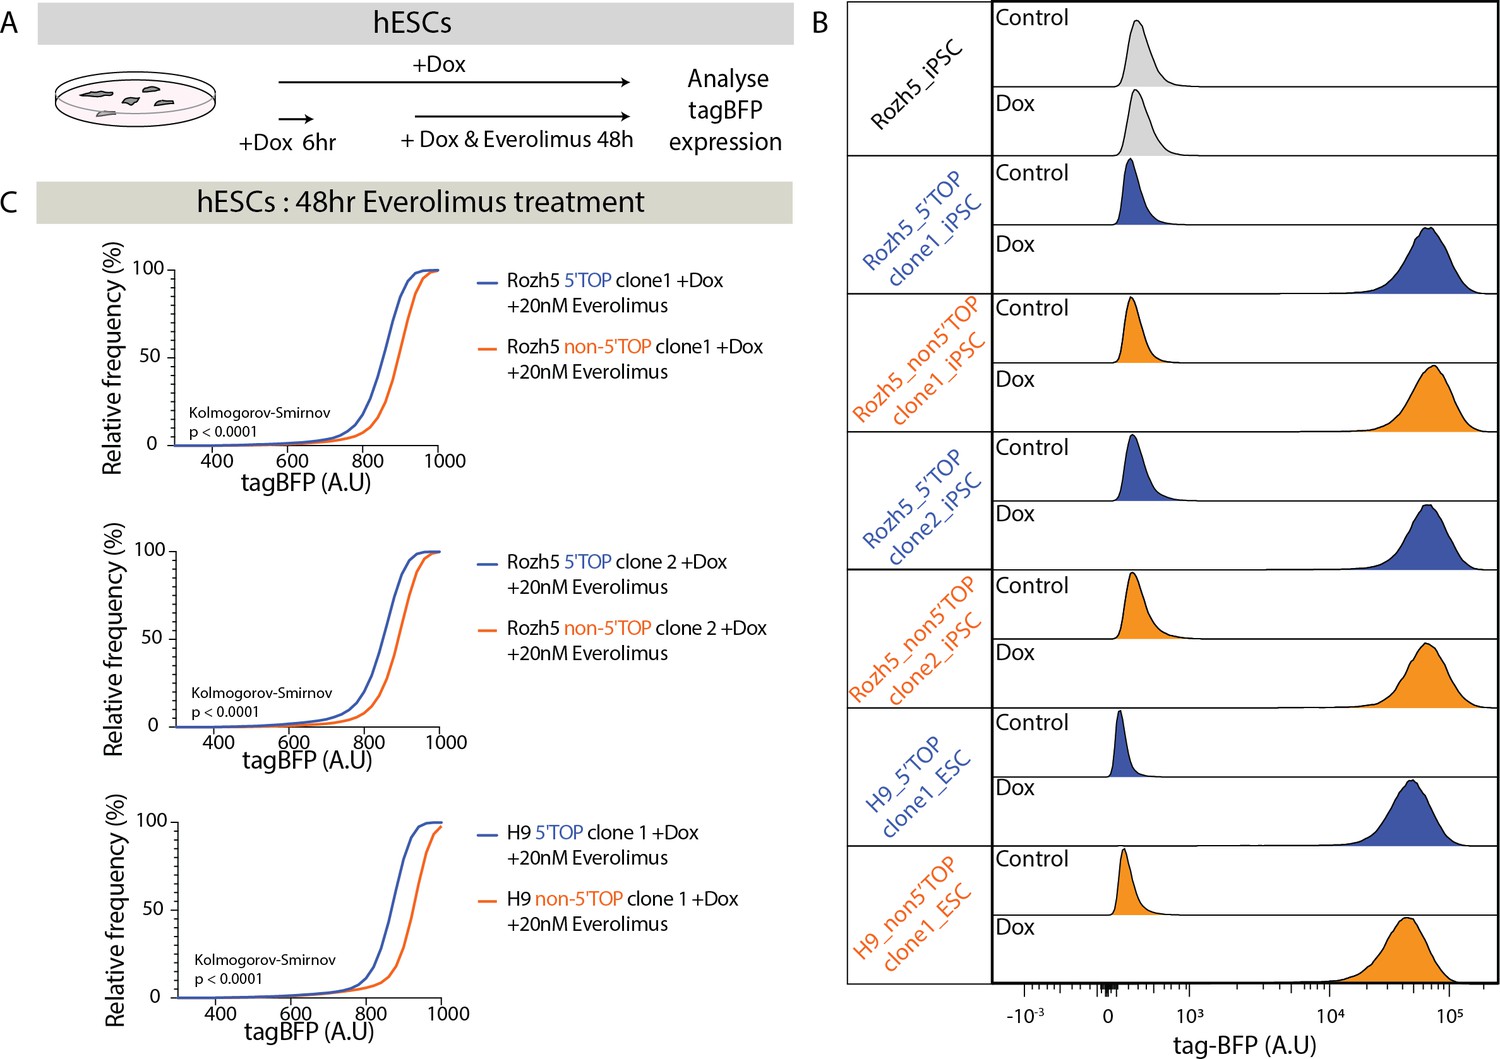
(A) Schematic representation of the Dox-inducible reporter assay in hPSCs. (B) Flow cytometry analysis of tagBFP expression in hPSCs carrying 5’TOP (blue) and non-5’TOP (orange) sequences in 5’UTR of the reporter construct. Parental cell line without reporter transgene (gray). Untreated control hPSCs and hPSCs treated with Dox for 48 hr were analyzed for multiple clones. (C) Cumulative distribution of reporter tagBFP levels in Dox-induced 5’TOP (blue) and non-5’TOP (orange) reporter hPSC pairs treated with 20 nM everolimus.
Figure 4—figure supplement 3
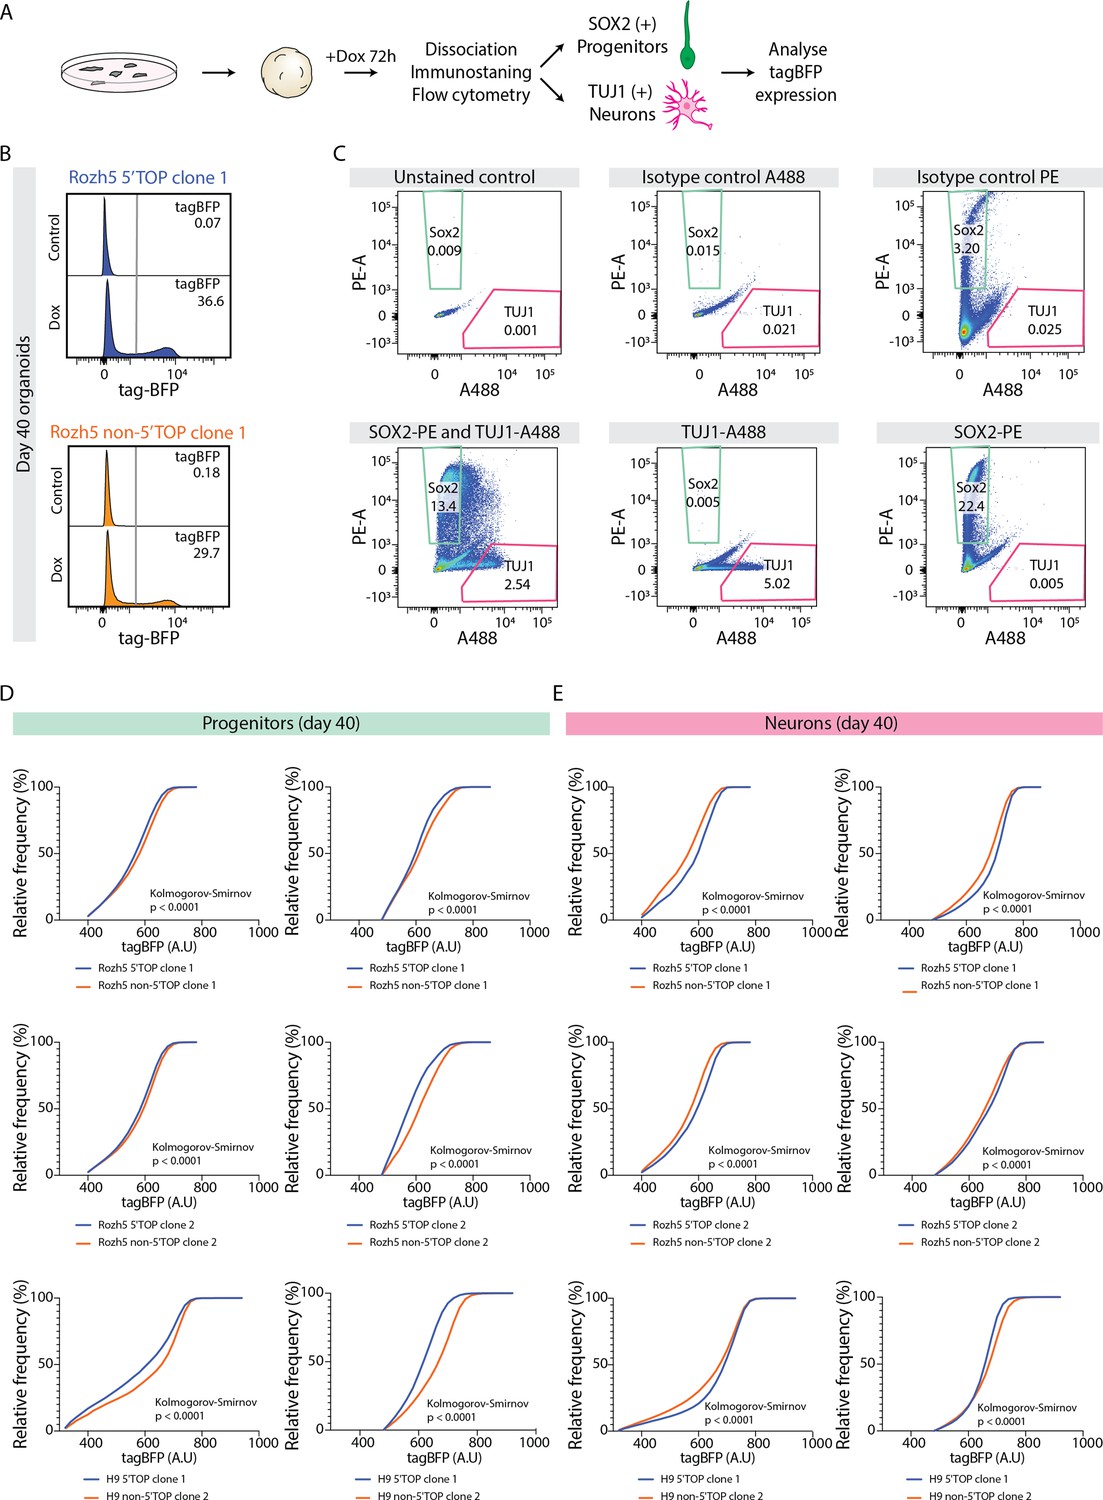
5' Terminal oligopyrimidine (5’TOP) reporter assay in 40-day-old brain organoids.
(A) Schematic representation of the doxycycline (Dox)-inducible reporter assay. hPSCs carrying 5’TOP (blue) and non-5’TOP (orange) sequences in 5’UTR of tagBFP were used to grow brain organoids. Dox-treated 40-day-old organoids were dissociated and cells stained for SOX2 and TUJ1 to measure tag-BFP levels in progenitors and neurons, respectively. (B) Representative image of flow cytometry analysis of tagBFP expression in untreated control organoids and 40-day-old organoids after 72 hr Dox treatment. Cells carrying 5’TOP (blue) and non-5’TOP (orange) sequences in 5’UTR of tagBFP are depicted. Percentage of single cells expressing tagBFP according to the gating parameters is indicated. (C) Flow cytometry analysis of cells from 40-day-old organoids immunostained with anti-SOX2-PE and anti-TUJ1-A488 antibodies. Panel includes isotype control antibody staining controls used to evaluate the staining and to define gating parameters. Cells stained with SOX2 (green box), TUJ1 (red box) were defined as shown in the figure. (D,E) Cumulative distribution of reporter tagBFP levels in (D) progenitors (SOX2) and (E) neurons (TUJ1) dissociated from Dox-treated 40-day-old organoids. Each graph represents a separate experiment with a 5’TOP (blue) and non-5’TOP (orange) reporter pair. Statistical significance was calculated using the non-parametric Kolmogorov-Smirnov test.
Figure 4—figure supplement 4
Early ventricular radial glia exhibit stress granule-like structures.
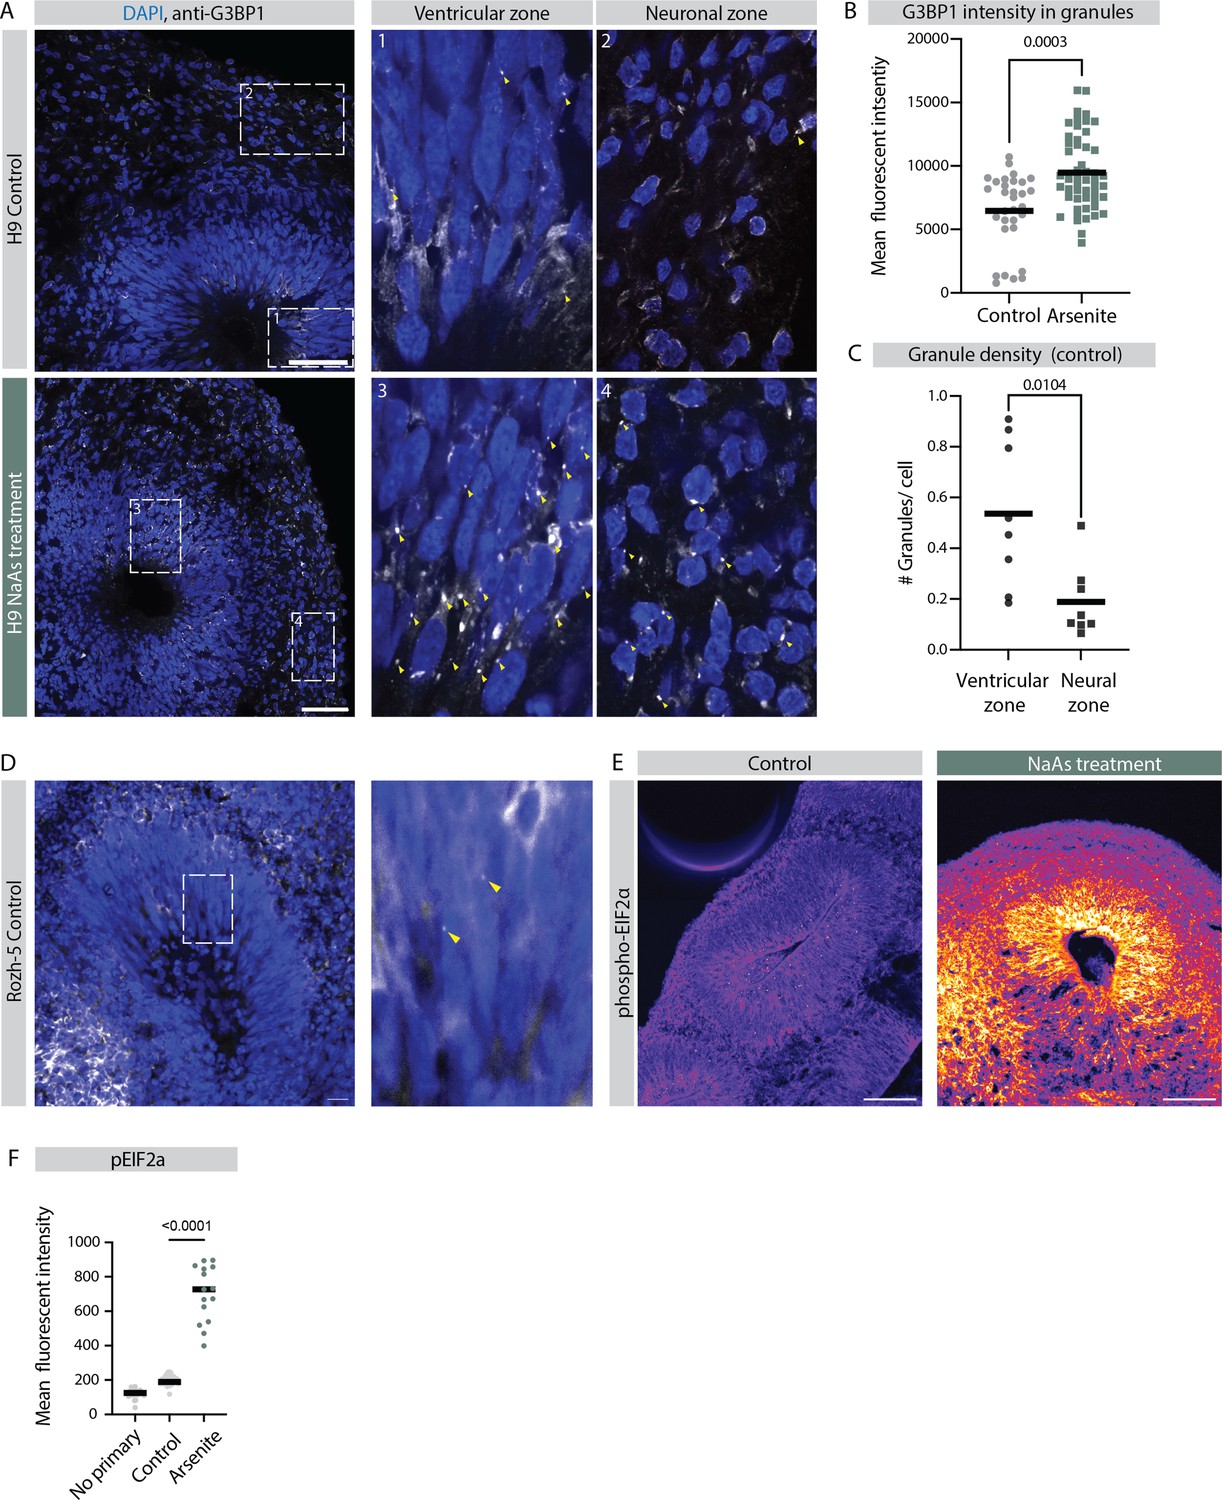
(A) Confocal scan of ventricular zone (VZ) in control and sodium arsenite-treated organoids (H9 background) stained with anti-G3BP1 antibody and DAPI. Zoomed-in image of the inlay shows G3BP1 granules marked by yellow arrows in VZ and neuronal zones. Scale bar = 50 µm. (B) Quantification of G3BP1 signal intensity in the granules observed in the control and sodium arsenite-treated organoids. p-Value statistic of t-test. Each dot represents a granule. (Number of organoids analyzed, control: n=3; NaAs: n=4; number of granules analyzed: control: n=31; NaAs: n=51.) (C) Quantification of average number of G3BP1 granules per cell in VZ and neuronal zone of 40-day-old control organoids. p-Value statistic of t-test. Each dot represents an area from an organoid. Quantification performed in three organoids with total field of views: n=8 and number of cells counted: NPCs: n=829; neurons: n=804. (D) Confocal scan of VZ in a control organoid (Rozh-5 background) stained with anti-G3BP1 antibody and DAPI. Zoomed-in image of the inlay shows G3BP1 granules marked by yellow arrows in VZ. Scale bar = 20 µm. (E) Confocal scan of VZ in a control and sodium arsenite-treated organoids (H9 background) stained with anti-phoshoEIF2a antibody. Scale bar = 100 µm. (F) Quantification of average fluorescent intensity of phoshoEIF2a in the VZs of control and sodium arsenite-treated organoids and control organoids stained only with secondary antibody (no primary) (H9 background). Error bars mark standard deviation. p-Value Mann-Whitney test is shown. Each dot represents a VZ (for no primary, n=28; for control, n=28; for NaAs treated, n=18). Data from two batches of organoid differentiation.
Figure 4—figure supplement 5
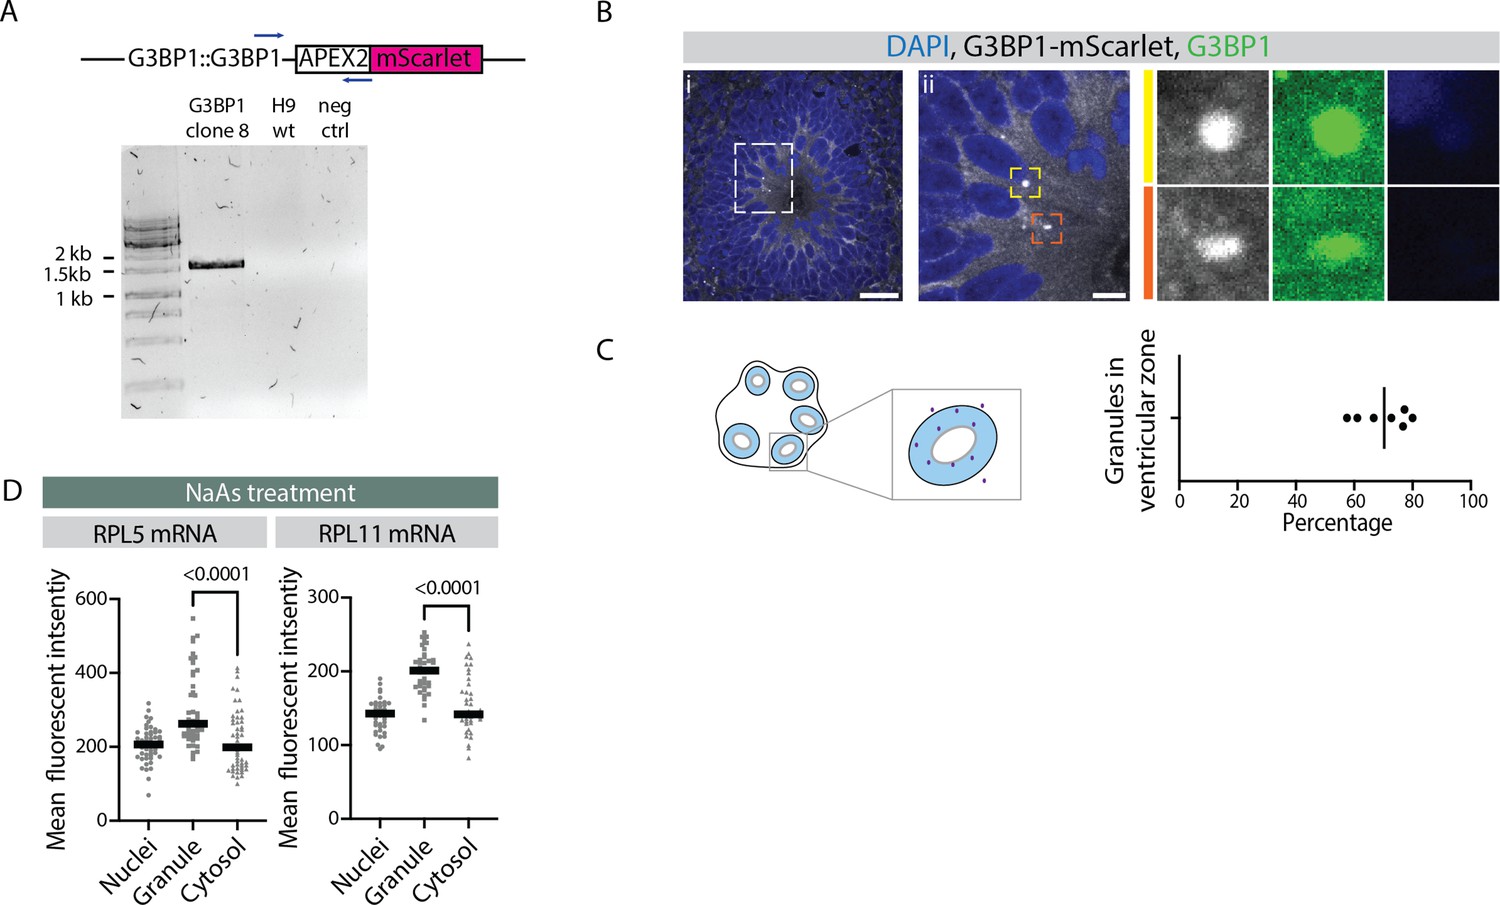
Stress granule-like structures in early ventricular radial glia of G3BP1-mScarlet report line organoids.
(A) Results of genotyping PCR to check insertion of the G3BP1-mScarlet transgene in the G3BP1 locus. Samples include G3BP1 reporter human embryonic stem cells (hESCs), control H9 hEScs, and negative control. (B) Confocal scan of ventricular zone (VZ) in a 40-day-old G3BP1-mScarlet organoid stained with anti-G3BP1 antibody and DAPI. Zoomed-in images of the inlay show granules in VZ marked by mScarlet (gray) and G3BP1 (green). Scale bars = 20 µm (i), 5 µm (ii). (C) Quantification of percentage of total G3BP1 granules observed in a field that are located in the VZ region. Schematic on the left shows G3BP1 granules in the tissue and quantification strategy. (D) Quantification of RPL5 and RPL11 RNA-FISH signal intensities in the nucleus, G3BP1-positive granules and the cytosol of progenitors in the VZ of sodium arsenite-treated organoids. The p-values of Mann-Whitney tests are shown. Each dot represents a cell. (Number of granules analyzed: RPL5: n=51; RPL11: n=111.)
-
Figure 4—figure supplement 5—source data 1
Genotyping PCR of G3BP1-mScarlet cell line.
- https://cdn.elifesciences.org/articles/85135/elife-85135-fig4-figsupp5-data1-v1.zip
Figure 4—figure supplement 6
Analysis of relative mRNA stability.
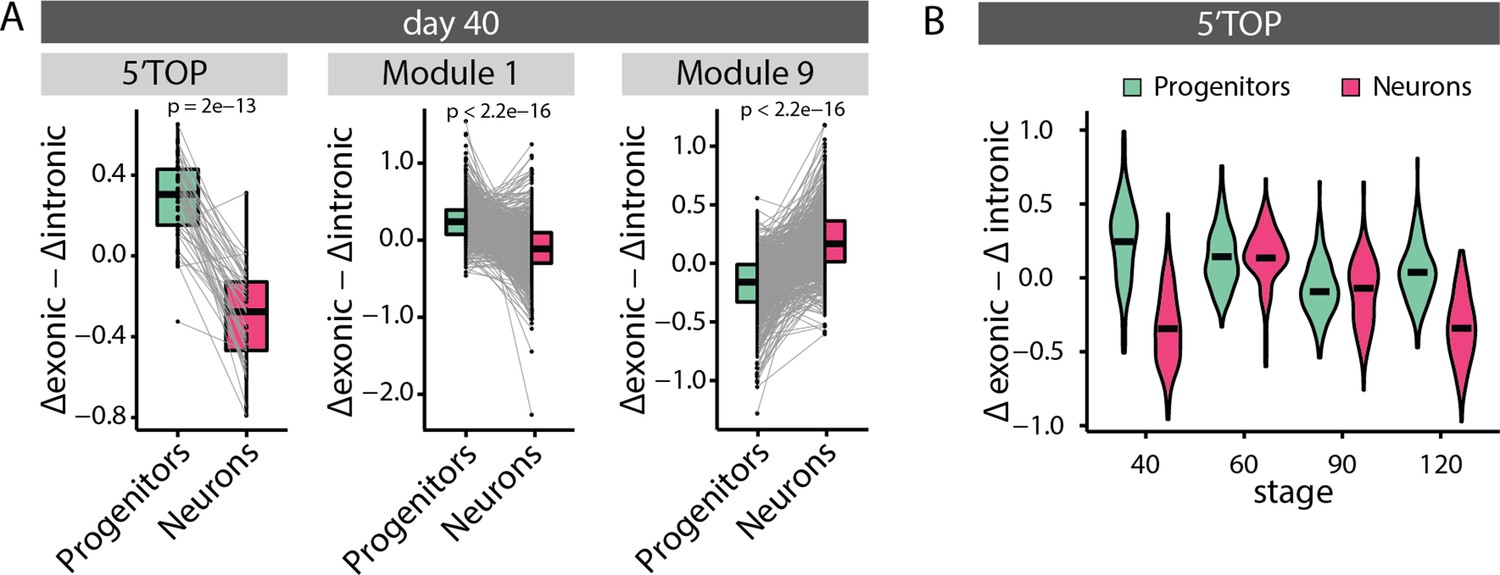
(A) Paired relative stability of mRNAs in progenitors and neurons of 40-day-old organoids measured by estimating exonic versus intronic reads from the RNA-seq data. Black dash marks the mean relative stability. Results are shown for all classical 5' terminal oligopyrimidine (5’TOP) genes and genes in modules 1 and 9. Boxplots mark median and interquartile range. Whiskers extend to 1.5x IQR. The p-values of the Wilcoxon test are shown. (B) Relative stability of mRNAs of classical 5’TOP genes in progenitors and neurons at different stages of organoid development. Black dash marks the mean relative stability.
-
Figure 4—figure supplement 6—source data 1
Relative RNA stability.
- https://cdn.elifesciences.org/articles/85135/elife-85135-fig4-figsupp6-data1-v1.xlsx
Figure 5 with 4 supplements
mTOR overactivation causes increased translation of 5' terminal oligopyrimidine (5’TOP) transcripts leading to precocious differentiation.
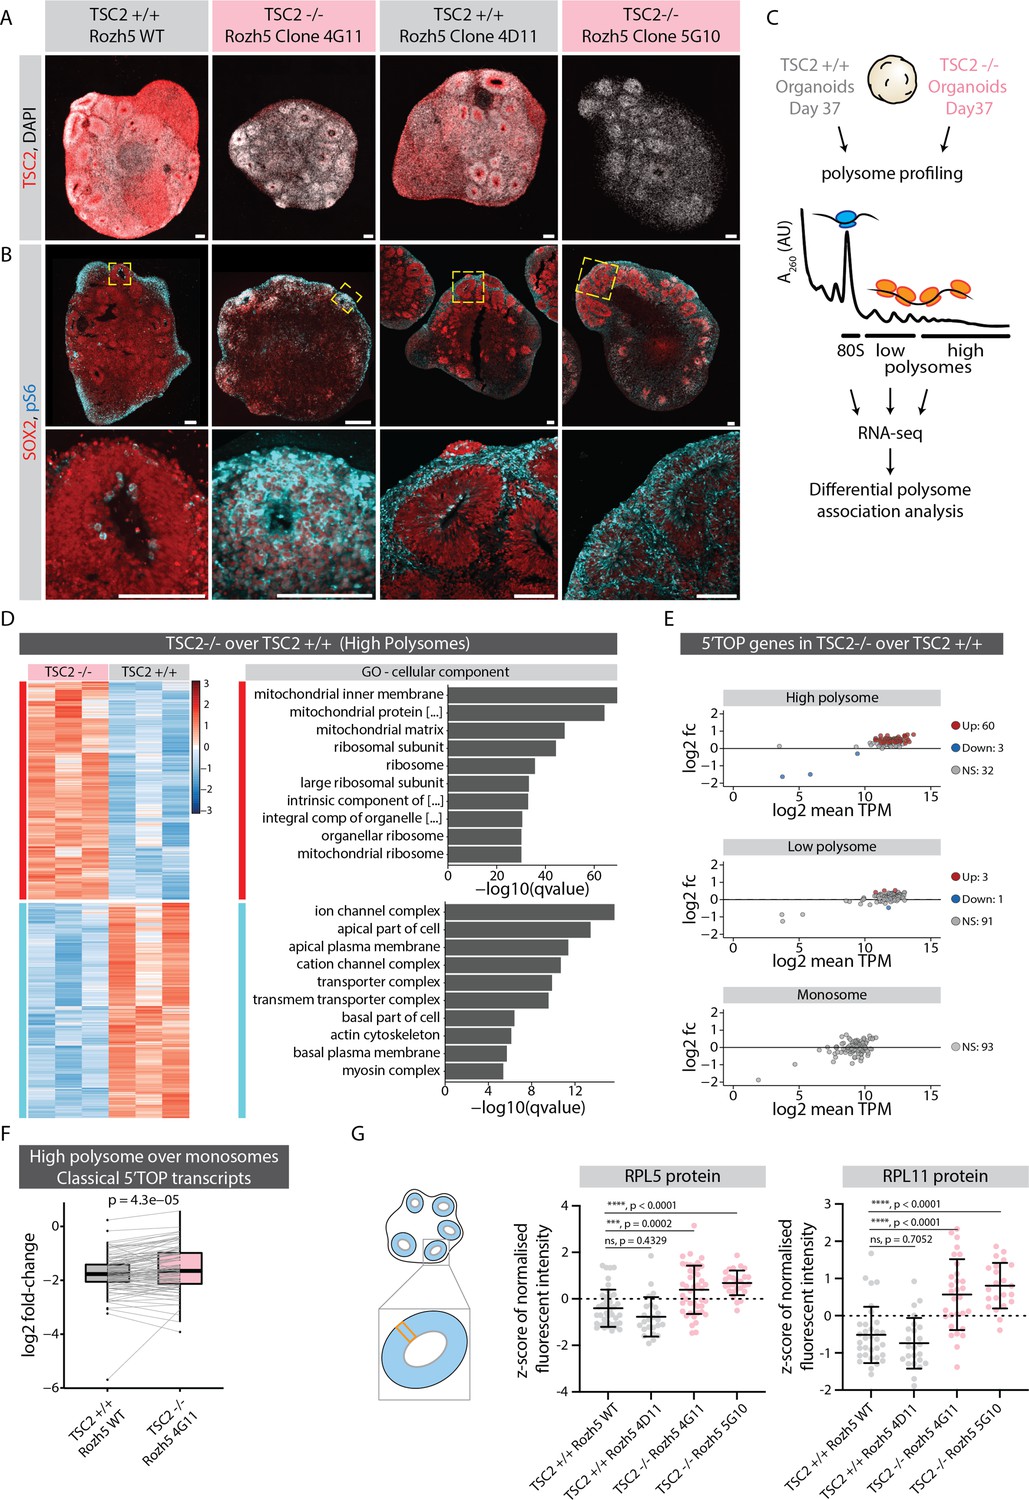
(A) Immunostaining of 40-day-old TSC2+/+ and TSC2-/- organoid sections (Rozh-5 background) with anti-TSC2 antibody. Scale bar = 100 µm. (B) Immunostaining of 40-day-old TSC2+/+ and TSC2-/- organoid sections (Rozh-5 background) stained with anti-pS6 and anti-SOX2 antibodies. Zoomed-in image of the inlay on the bottom. Scale bar = 100 µm. (C) Schematic representation of polysome profiling of 37-day-old TSC2+/+ and TSC2-/- organoids (Rozh-5 background) followed by RNA-seq and differential polysome association analysis of 80S monosome, low-polysome and high-polysome fractions. Data was generated from three batches of organoid differentiation for Rozh-5 WT and Rozh-5 TSC2-/- 4G11 clones. (D) Heatmap of hierarchical clustering of genes differentially associated with high-polysome fractions of TSC2+/+ and TSC2-/- organoids (left). Top 10 most significant cellular component gene ontology (GO) terms for TSC2-/- enriched differentially associated genes (DAGs) and TSC2+/+ enriched DAGs (right). (E) MA plot of 5’TOP genes for high-polysome, low-polysome and monosome fractions shows log2 fold change of TSC2-/- over TSC2+/+ versus log2 mean transcript per million (TPM) (expression levels). Significant genes (threshold: log2 fold change = 1, FDR = 0.1) are color coded. (F) Log2 fold change of classical 5’TOP genes associated with high-polysome fractions over monosome fractions of TSC2+/+ and TSC2-/- organoids. Boxplots mark median and interquartile range (IQR. Whiskers extend to 1.5x IQR). p-Value of paired t-test. (G) Quantification of mean z-score normalized fluorescent intensity of RPL5 and RPL11 proteins in the ventricular zones (VZs) of TSC2+/+ and TSC2-/- organoids (Rozh-5 background). Error bars mark standard deviation. p-Values of unpaired t-test are shown. Each dot represents a VZ. Data from three batches of organoid differentiation for each clone. Schematic on the left shows a typical regions of interest (ROI) analyzed for a VZ.
-
Figure 5—source data 1
Differential gene association analysis from polysome profiling results.
- https://cdn.elifesciences.org/articles/85135/elife-85135-fig5-data1-v1.xlsx
Figure 5—figure supplement 1
Analysis and perturbation of mTOR activity.
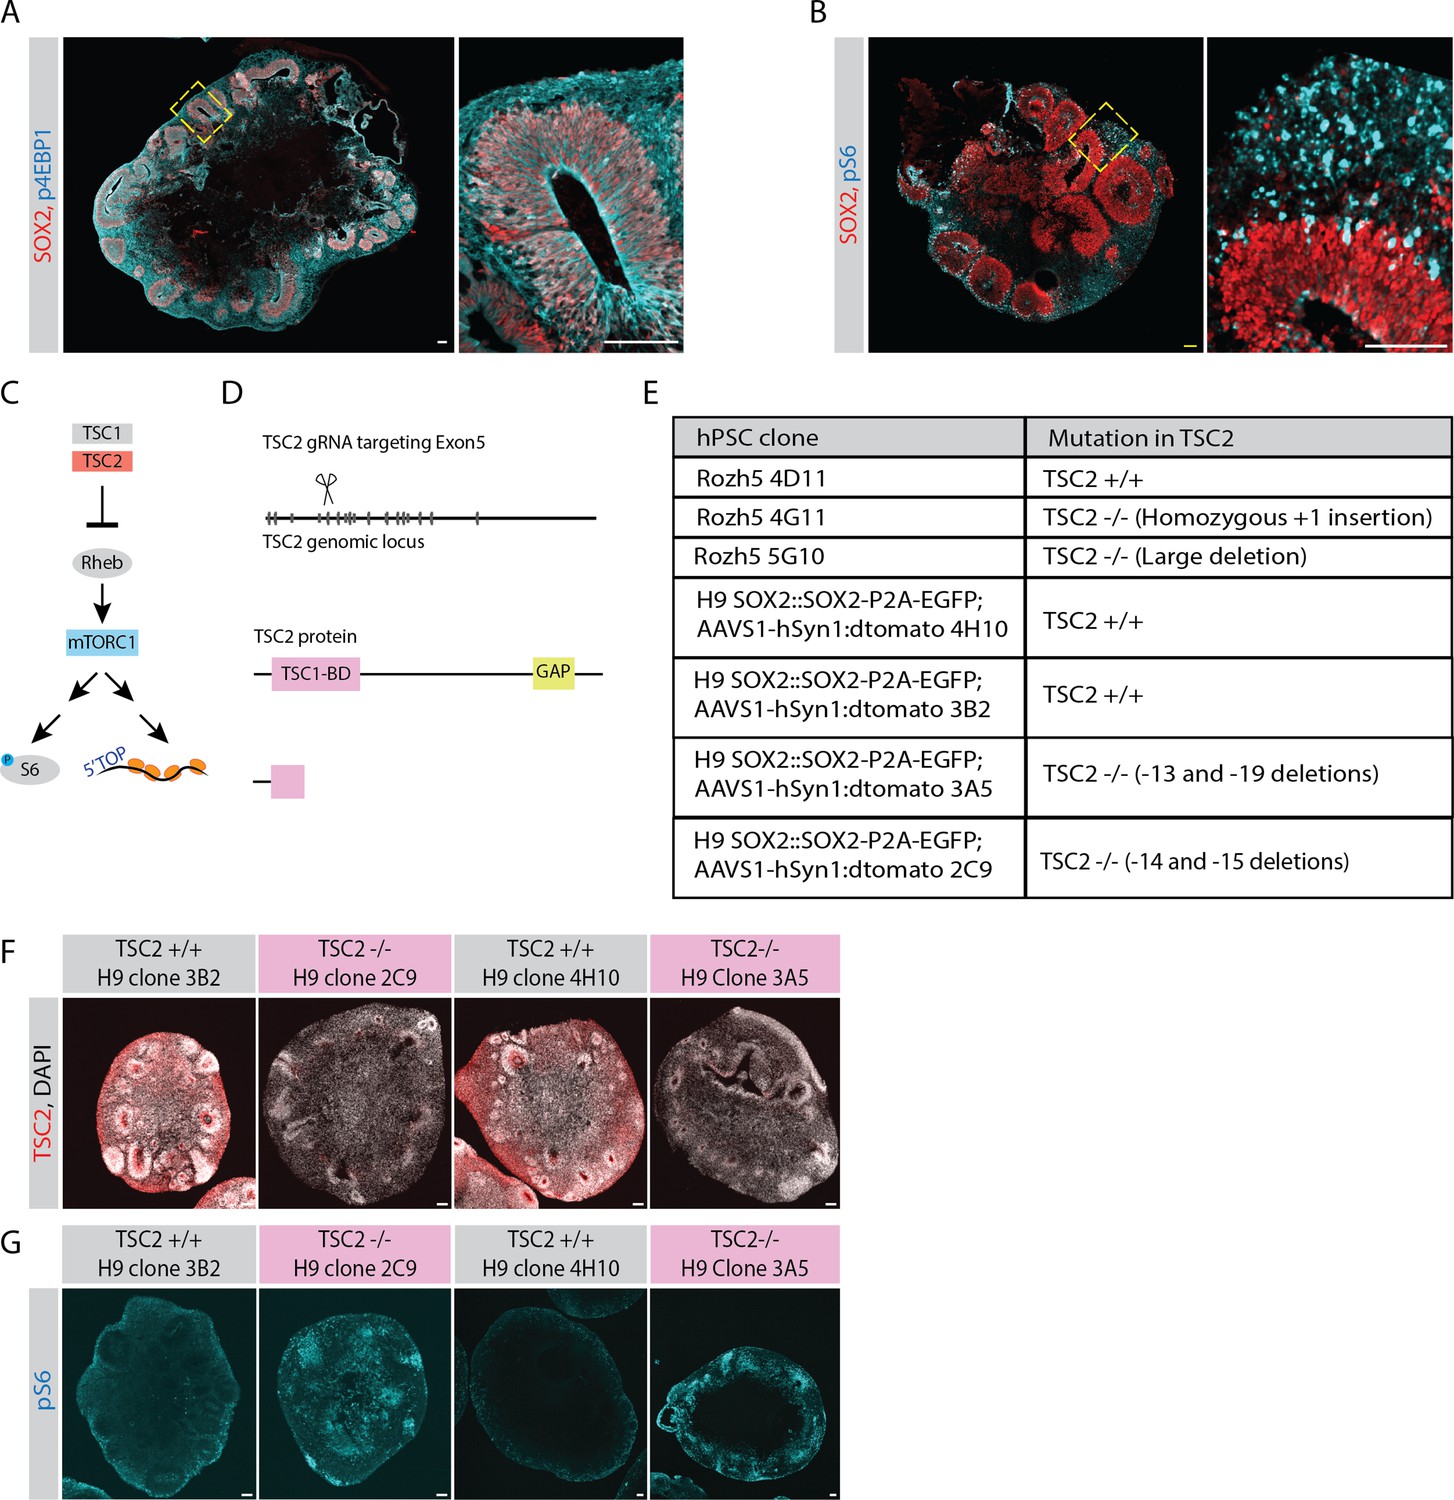
(A) Confocal scan of a 40-day-old organoid (H9 background) stained with anti-phospho-4EBP1 (cyan) and anti-SOX2 (red) antibodies. Zoomed-in image of the inlay shows a ventricular zone (VZ). Scale bar = 100 µm. (B) Confocal scan of a 40-day-old organoid (H9 background) stained with anti-phospho-S6 (cyan) and anti-SOX2 (red) antibodies. Zoomed-in image of the inlay shows a VZ. Scale bar = 100 µm. (C) Schematic representation of the mTOR pathway. (D) Schematic representation of genome editing of TSC2 genomic locus by CRISPR-Cas9 approach. A guide targeting Exon5 was used to generate TSC2-/- hPSCs. (E) Table summarizing TSC2 control and knockout hPSC clones used in this study. (F) Confocal scan of 40-day-old TSC2+/+ and TSC2-/- organoid sections (H9 dual reporter background) stained with anti-TSC2 antibody and DAPI. Scale bar = 100 µm. (G) Confocal scan of 40-day-old TSC2+/+ and TSC2-/- organoid sections (H9 dual reporter background) stained with anti-pS6 and antibody. Scale bar = 100 µm.
Figure 5—figure supplement 2
Polysome profiling in mTOR overactivated organoids.
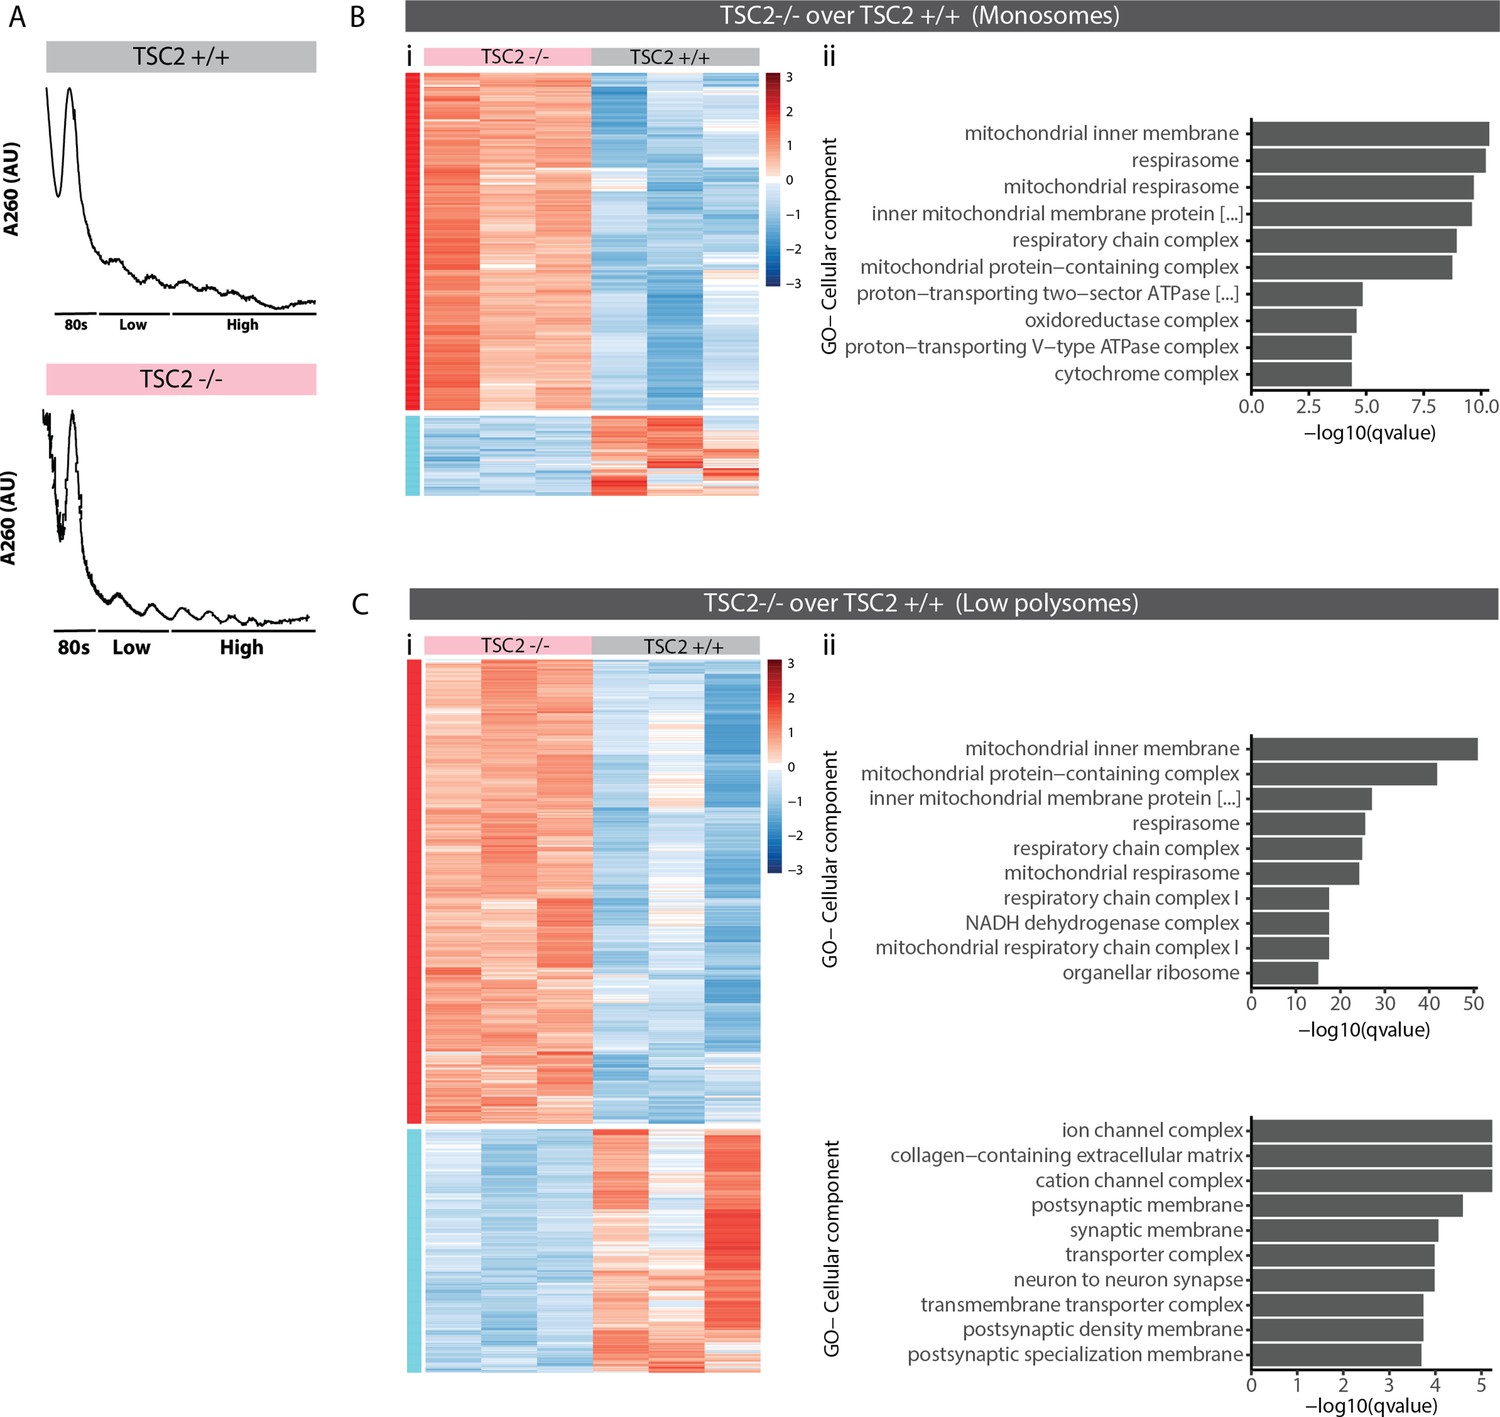
(A) Representative traces of polysome profiling of TSC2+/+ and TSC2-/- organoids. (B) Hierarchical clustered heatmap of genes differentially associated with monosome fractions of TSC2+/+ and TSC2-/- organoids (i). Top 10 most significant cellular component gene ontology (GO) terms for TSC2-/- enriched differentially associated genes (DAGs) (ii). There was no significant GO term observed for TSC2+/+ enriched DAGs. (C) Hierarchical clustered heatmap of genes differentially associated with low-polysome fractions of TSC2+/+ and TSC2-/- organoids (i). Top 10 most significant cellular component GO terms for TSC2-/- enriched DAGs and TSC2+/+ enriched DAGs (ii).
Figure 5—figure supplement 3
Effect of mTOR overactivation on 5' terminal oligopyrimidine (5’TOP) RNA and protein levels.
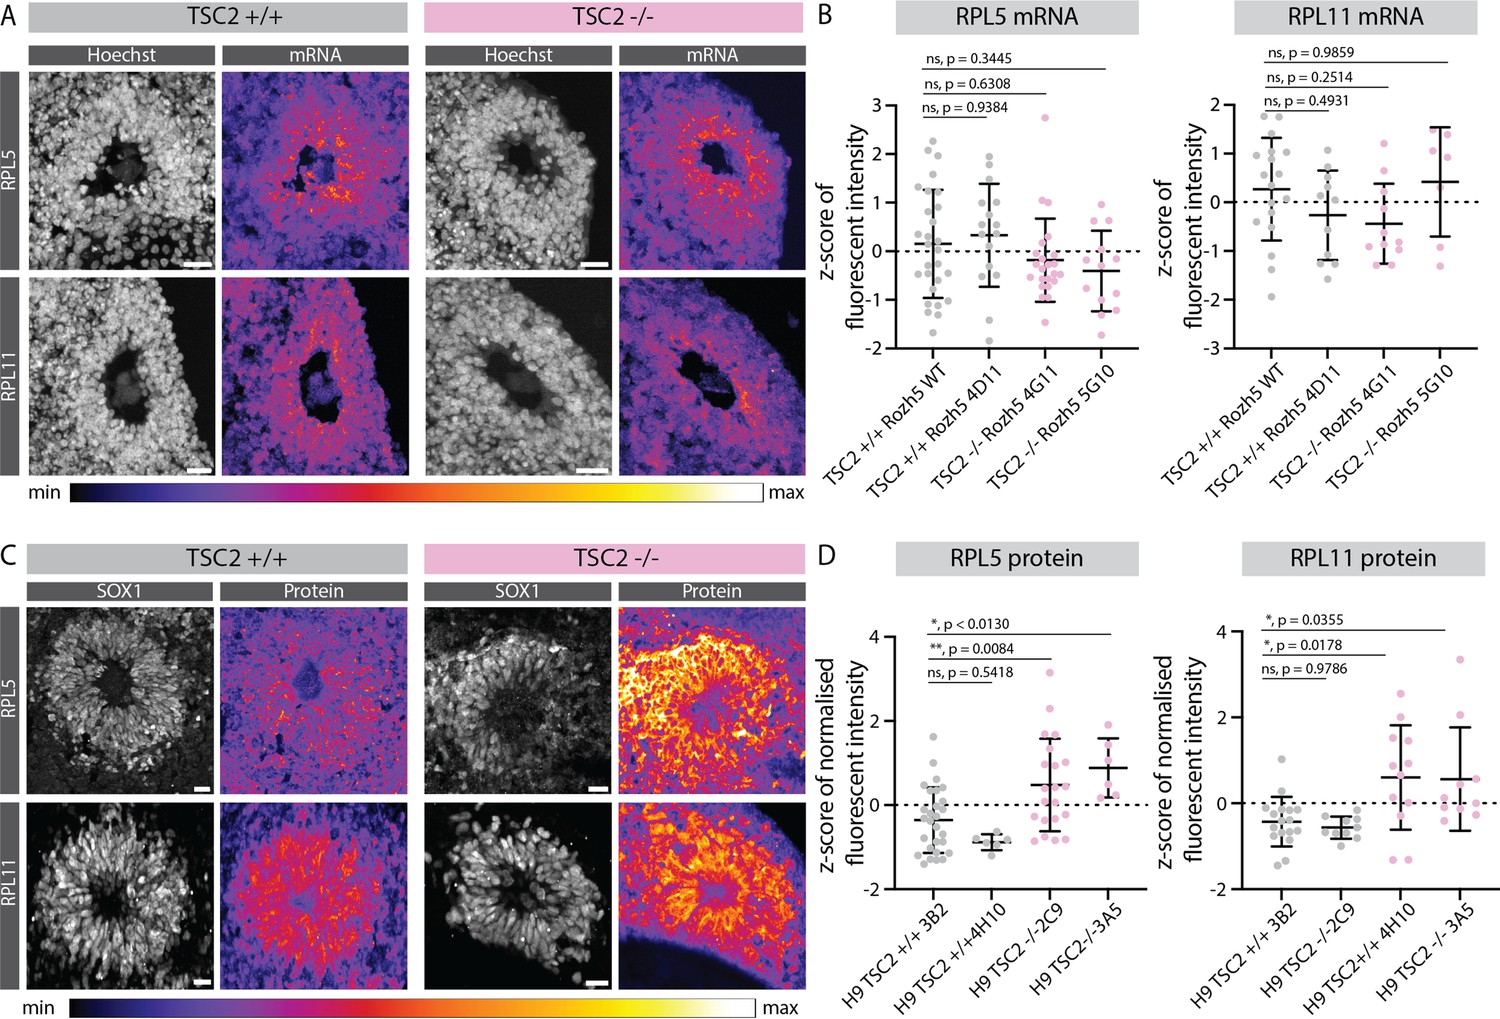
(A) RNA-FISH for the 5’TOP transcripts RPL5 and RPL11, in 40-day-old TSC2+/+ and TSC2-/- organoids (Rozh-5 background). Images show a typical ventricular zone (VZ)-like structure in the brain organoid. Scale bar = 20 µm. (B) Quantification of z-score normalized fluorescent intensity of RPL5 and RPL11 FISH signal in the VZs of TSC2+/+ and TSC2-/- organoids (Rozh-5 background). Error bars mark standard deviation. p-Values of unpaired t-test are shown. Each dot represents a VZ. Data from three batches of organoid differentiation for each clone. (C) Immunostaining for the 5’TOP proteins RPL5 and RPL11, in 40-day-old TSC2+/+ and TSC2-/- organoids. Images show a typical VZ-like structure in the brain organoid. Scale bar = 20 µm. (D) Quantification of z-score normalized fluorescent intensity of RPL5 and RPL11 proteins in the VZs of TSC2+/+ and TSC2-/- organoids (H9 background). Error bars mark standard deviation. p-Values of unpaired t-test are shown. Each dot represents a VZ. Data from three batches of organoid differentiation for each clone.
Figure 5—figure supplement 4
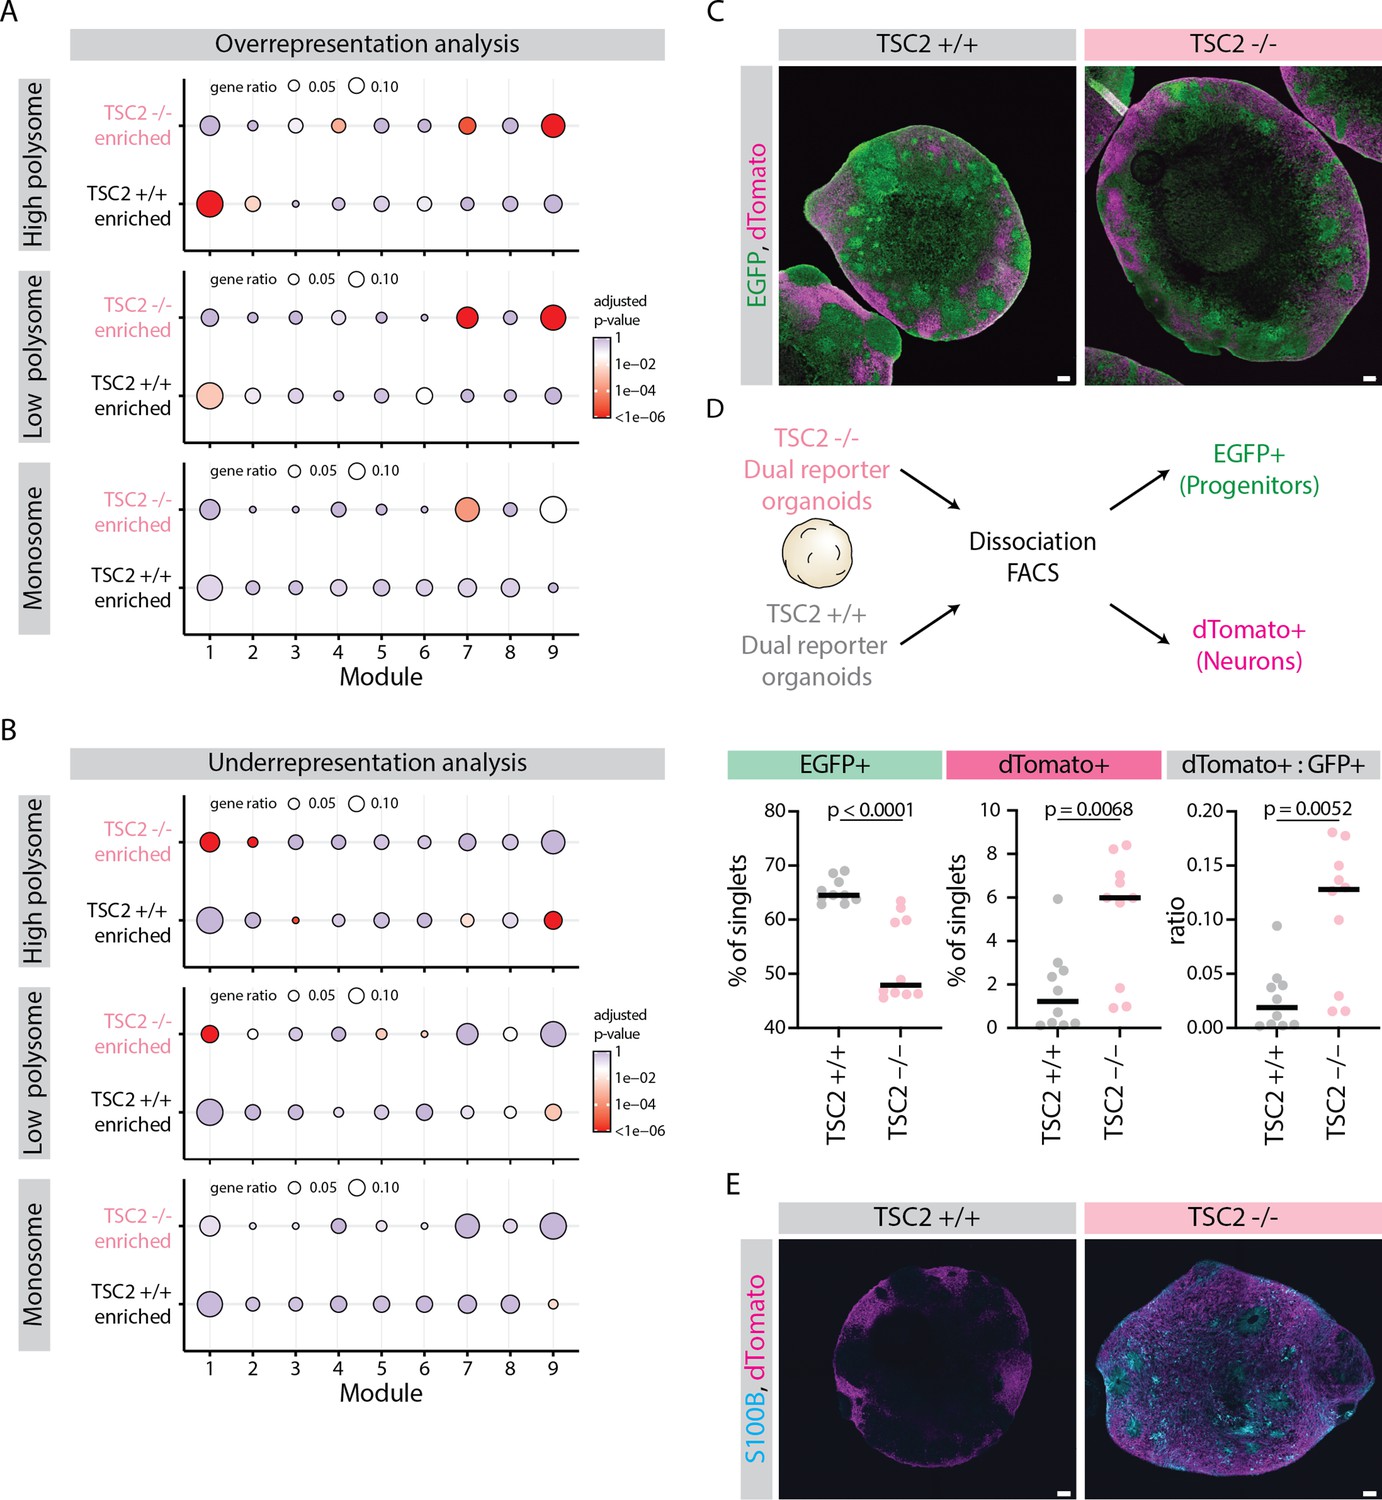
Effect of mTOR overactivation on tissue development.
(A) Dot plot showing overrepresentation analysis of genes differentially associated with ribosome fractions of TSC2-/- and TSC2+/+ organoids across the nine gene modules. Significance threshold: Adjusted p-value <0.05. Gene lists refer to differentially associated genes (DAGs) from clusters from Figure 5D. (B) Dot plot showing underrepresentation analysis of genes differentially associated with ribosome fractions of TSC2-/- and TSC2+/+ organoids across the nine gene modules. Significance threshold: adjusted p-value <0.05. Gene lists refer to DAGs from clusters from Figure 5D. (C) Confocal scan of cryosections of 40-day-old TSC2+/+ and TSC2-/- dual reporter organoids showing EGFP and dTomato distribution. Scale bar = 100 µm. (D) Schematic representation of the flow cytometry analysis of dual reporter TSC2+/+ and TSC2-/- organoids. Plots show the percentage of single cells that are EGFP+ (green), dTomato+ (magenta), and the ratio of dTomato:EGFP cells (gray). Horizontal line marks the median values. p-Values of Mann-Whitney tests are shown. Samples from two batches of organoid differentiation with two clones per condition. (E) Confocal scan of cryosections of 40-day-old TSC2+/+ and TSC2-/- dual reporter organoids immunostained for dTomato and S100B. Scale bar = 100 µm.
Author response image 1
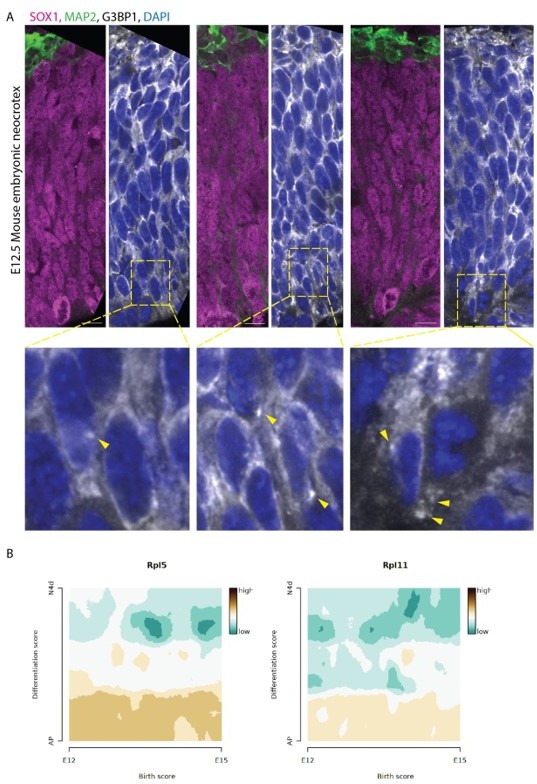
Analysis of developing mouse brain tissue.
(A) Confocal scans of ventricular zones in E12. 5 Mouse developing cortex stained with anti-EGFP, anti-G3BP1, anti-SOX1 and anti-MAP2 antibodies and DAPI. Zoomed-in images of the boxed areas are shown below. Arrows mark G3BP1 positive punctate structures. Scale bar = 50 µm. (B) Expression scores of 5’TOP genes RPL5 and RPL11 during mouse cortex development. scRNA-seq data from Telley et al. , Science 2019: http://genebrowser.unige.ch/telagirdon/.
Tables
Appendix 1—key resources table
| Reagent type (species) or resource | Designation | Source or reference | Identifiers | Additional information |
|---|---|---|---|---|
| Antibody | Chicken anti-GFP, polyclonal | Aves Labs | Aves Labs Cat# GFP-1020; RRID:AB_10000240 | 1:500 |
| Antibody | Goat anti-SOX1, polyclonal | R&D Systems | R&D Systems Cat# AF3369; RRID:AB_2239879 | 1:200 |
| Antibody | Goat anti-Sox2, polyclonal | R&D Systems | R&D Systems Cat# AF2018; RRID:AB_355110 | 1:200 |
| Antibody | Mouse anti-G3BP1, monoclonal | Abcam | Abcam Cat# ab56574; RRID:AB_941699 | 1:200 |
| Antibody | Mouse anti-NeuN, monoclonal | Millipore | Millipore Cat# MAB377; RRID:AB_2298772 | 1:600 |
| Antibody | Rabbit anti-dsred, polyclonal | Takara Bio | Takara Bio Cat# 632496; RRID:AB_10013483 | 1:250 |
| Antibody | Rabbit anti-p4EBP1 (Thr37/46), monoclonal | Cell Signaling Technology | Cell Signaling Technology Cat# 2855; RRID:AB_560835 | 1:200 |
| Antibody | Rabbit anti-pS6 (Ser235/236), monoclonal | Cell Signaling Technology | Cell Signaling Technology Cat# 4858; RRID:AB_916156 | 1:200 |
| Antibody | Rabbit anti-RPL11, polyclonal | Abcam | Abcam Cat# ab79352; RRID:AB_2042832 | 1:200 |
| Antibody | Rabbit anti-RPL5, polyclonal | Abcam | Abcam Cat#ab137617; RRID:AB_2924679 | 1:200 |
| Antibody | Rabbit anti-phospho-EIF2a (Ser51) D9G8, monoclonal | Cell Signaling Technology | Cell Signaling Technology Cat#3398; RRID:AB_2096481 | 1:200 |
| Antibody | Rabbit anti-S100B, monoclonal | Abcam | Abcam Cat# ab52642; RRID:AB_882426 | 1:200 |
| Antibody | Sheep anti-Human EOMES, polyclonal | R&D Systems | R&D Systems Cat#AF6166-SP; RRID:AB_10569705 | 1:200 |
| Antibody | Alexa Fluor 488 Donkey anti-chicken, polyclonal | Jackson ImmunoResearch | Jackson ImmunoResearch Labs Cat# 703-545-155; RRID:AB_2340375 | 1:500 |
| Antibody | Alexa Fluor 488 Donkey anti-goat, polyclonal | Thermo Fisher Scientific | Thermo Fisher Scientific Cat# A-11055; RRID:AB_2534102 | 1:500 |
| Antibody | Alexa Fluor 568 Donkey anti-rabbit, polyclonal | Thermo Fisher Scientific | Thermo Fisher Scientific Cat# A10042; RRID:AB_2534017 | 1:500 |
| Antibody | Alexa Fluor 647 Donkey anti-goat, polyclonal | Thermo Fisher Scientific | Thermo Fisher Scientific Cat# A-21447; RRID:AB_2535864 | 1:500 |
| Antibody | Alexa Fluor 647 Donkey anti-mouse, polyclonal | Thermo Fisher Scientific | Thermo Fisher Scientific Cat# A-31571; RRID:AB_162542 | 1:500 |
| Antibody | Alexa Fluor 647 Donkey anti-rabbit, polyclonal | Thermo Fisher Scientific | Thermo Fisher Scientific Cat# A-31573; RRID:AB_2536183 | 1:500 |
| Antibody | Alexa Fluor 647 Donkey anti-sheep, polyclonal | Jackson ImmunoResearch | Jackson ImmunoResearch Labs Cat#713-605-147; RRID:AB_2340751 | 1:500 |
| Antibody | Alexa Fluor 488Mouse anti-β-Tubulin, Class III, monoclonal | BD Biosciences | BD Biosciences Cat# 560338; RRID:AB_1645345 | 1:25 |
| Antibody | Alexa Fluor488Mouse IgG2a, κ Isotype control, monoclonal | BD Biosciences | BD Biosciences Cat# 558055; RRID:AB_1645612 | 1:25 |
| Antibody | PE Mouse IgG1, κ Isotype Control, monoclonal | BD Biosciences | BD Biosciences Cat# 554680; RRID:AB_395506 | 1:25 |
| Antibody | Sox2 Mouse, PE, Clone: O30-678, BD, monoclonal | BD Biosciences | BD Biosciences Cat# 562195; RRID:AB_10895118 | 1:25 |
| Recombinant DNA reagent | pSpCas9(BB)–2A- GFP (PX458) | Addgene | 48138 | |
| Recombinant DNA reagent | AAVS1-Neo-TRE- CMV-Cre-rtTA | Addgene | 165457 | |
| Recombinant DNA reagent | pSF4 TetCMV 5'TOP intron 20xGCN4 Renilla FKBP Stop 24xMS2v5 SV40 CTE polyA | Addgene | 119946 | |
| Recombinant DNA reagent | HR_G3BP1-V5- APEX2-GFP | Addgene | 105284 | |
| Recombinant DNA reagent | pmScarlet-i_C1 | Addgene | 85044 | |
| Commercial assay or kit | Cellartis DEF-CS 500 Culture System | Takara Bio | Y30012 | |
| Commercial assay or kit | Phusion Hot Start Flex DNA Polymerase | New England Biolabs | M0535S | |
| Commercial assay or kit | Human Stem Cell Nucleofector Kit 1 | Lonza | VPH-5012 | |
| Commercial assay or kit | QuickExtract DNA Extraction Solution | Cambio | QE09050 | |
| Commercial assay or kit | NEBNext Ultra II Directional RNA Library Prep Kit for Illumina | New England Biolabs | E7760 | |
| Commercial assay or kit | NEBNext Poly(A) mRNA Magnetic Isolation Module | New England Biolabs | E7490 | |
| Commercial assay or kit | Amaxa nucleofector 2b device | Lonza | AAB-1001 | |
| Other | gentleMACS Dissociator | Miltenyi Biotec | 130-093-235 | see section on 'Organoid dissociation' in the 'Materials and methods' for details |
| Other | FACS ARIAIII | BD Biosciences | see section on 'FACS' in the 'Materials and methods' for details | |
| Other | BD LSR Fortessa Cell Analyzer | BD Biosciences | see section on 'Flow cytometry analysis' in the 'Materials and methods' for details | |
| Other | Epredia Cryostar NX70 cryostat | Thermo Fisher Scientific | 957000H | see section on 'Immunohistochemistry' in the 'Materials and methods' for details |
| Other | Fragment analyser | Agilent | see section on 'RNA extraction, library generation and RNA-seq' in the 'Materials and methods' for details | |
| Other | Gradient master base unit | Biocomp | B108 | see section on 'Polysome profiling by sucrose gradient fractionation' in the 'Materials and methods' for details |
| Software, algorithm | Fiji | https://doi.org/10.1038/nmeth.2019; https://imagej.net/software/fiji/ | ||
| Software, algorithm | trim-galore v0.5.0 | https://www.bioinformatics.babraham.ac.uk/projects/trim_galore/ | ||
| Software, algorithm | bowtie2 v2.3.4.1 | https://bowtie-bio.sourceforge.net/bowtie2/index.shtml | ||
| Software, algorithm | star v2.6.0c | doi:10.1093/bioinformatics/bts635 | ||
| Software, algorithm | subread v1.6.2 | doi:10.1093/nar/gkz114 | ||
| Software, algorithm | DESeq2 v1.18.1 | doi:10.1186/s13059-014-0550-8 | ||
| Software, algorithm | Seurat package | doi:10.1016/j.cell.2021.04.048 | ||
| Software, algorithm | Proteome Discoverer (version 2.4.0.305) | Thermo Fisher Scientific | ||
| Software, algorithm | MSAmanda v2.0.0.13248 | doi:10.1021/pr500202e | ||
| Software, algorithm | maSigPro version 1.68.00 | doi:10.1093/bioinformatics/btu333 | ||
| Software, algorithm | clusterProfiler | doi:10.1089/omi.2011.0118 | ||
| Software, algorithm | biomart | doi:10.1038/nprot.2009.97 | ||
| Software, algorithm | ViennaRNA package | doi:10.1186/1748-7188-6-26 | ||
| Software, algorithm | Transite | doi:10.1016/j.celrep.2020.108064; https://transite.mit.edu/ | ||
| Software, algorithm | REMBRANDTS | https://github.com/csglab/REMBRANDTS; Alkallas et al., 2017 | ||
| Software, algorithm | zUMI v2.9.7 | doi:10.1093/gigascience/giy059 | ||
| Chemical compound, drug | DAPI | Merck | D9542 | |
| Chemical compound, drug | Doxycycline hyclate | Merck | D9891 | |
| Chemical compound, drug | Sodium (meta)arsenite | Merck | S7400 | |
| Chemical compound, drug | Corning Matrigel hESC-Qualified Matrix | Corning | 354277 | |
| Chemical compound, drug | Puromycin dihydrochloride | Thermo Fisher Scientific | A1113803 | |
| Chemical compound, drug | Geneticin/G418 Sulfate | Thermo Fisher Scientific | 10131035 | |
| Chemical compound, drug | InSolution GSK-3 Inhibitor XVI, CHIR99021 | Merck | 361571 | |
| Chemical compound, drug | Everolimus | Abcam | ab142151 | |
| Chemical compound, drug | DMEM/F12 HEPES | Thermo Fisher Scientific | 11330–032 | |
| Chemical compound, drug | BSA | Europa Bioproducts | EQBAH-0500 | |
| Chemical compound, drug | 7.5% Sodium bicarbonate | Thermo Fisher Scientific | 25080094 | |
| Chemical compound, drug | Insulin-Transferrin- Selenium (100×) | Thermo Fisher Scientific | 41400–045 | |
| Chemical compound, drug | TGF-beta1 | R&D Systems | RD-240-B-010 | |
| Chemical compound, drug | Accutase | Merck | A6964 | |
| Chemical compound, drug | Anti-adherence rinsing solution | Stemcell Technologies | 7010 | |
| Chemical compound, drug | 10× Trypsin-EDTA | Thermo Fisher Scientific | 15400054 | |
| Chemical compound, drug | TURBO DNase (2 U/µl) | Thermo Fisher Scientific | AM2238 | |
| Chemical compound, drug | DPBS, no calcium, no magnesium (dPBS -/-) | Thermo Fisher Scientific | 14190250 | |
| Chemical compound, drug | Saponin | Merck | 47036 | |
| Chemical compound, drug | Sucrose | Merck | 84097 | |
| Chemical compound, drug | Tissue-Tek O.C.T. Compound | Sakura | 4583 | |
| Chemical compound, drug | Triton X-100 | Merck | 93420 | |
| Chemical compound, drug | Dextran Sulfate 50% Solution | Merck | S4030 | |
| Chemical compound, drug | tRNA from E. coli MRE 600 | Merck | 10109541001 | |
| Chemical compound, drug | Ribonucleoside Vanadyl Complex | New England Biolabs | S1402S | |
| Chemical compound, drug | Formamid | Merck | F9037 | |
| Chemical compound, drug | DCX probes | Stellaris | VSMF-2504–5 | |
| Chemical compound, drug | Stellaris RNA FISH wash buffer A | Stellaris | SMF-WA1-60 | |
| Chemical compound, drug | Stellaris RNA FISH wash buffer B | Stellaris | SMF-WB1-20 | |
| Chemical compound, drug | Dako Fluorescence mounting medium | Agilent | S302380-2 | |
| Chemical compound, drug | RNasin Plus Ribonuclease Inhibitor | Promega | NA2615 | |
| Chemical compound, drug | Acid-Phenol:Chloroform, pH 4.5 (with IAA, 125:24:1) | Thermo Fisher Scientific | AM9720 | |
| Chemical compound, drug | Glycoblue | Thermo Fisher Scientific | AM9515 | |
| Cell line (human) | Human embryonic stemm cell (hESC), H9, female | WiCell | WA09 | |
| Cell line (human) | Human induced pluripotent stem cell (hiPSC), Rozh-5, female | hPSCreg | WTSIi015-A | |
| Sequence-based reagent | Sox2_sgRNA-top | This paper | JS89 | CACCgGAGCGGCC CGGTGCCCGGCA |
| Sequence-based reagent | Sox2_sgRNA-bottom | This paper | JS90 | AAACTGCCGGGCAC CGGGCCGCTCc |
| Sequence-based reagent | Sox2_HAL_F | This paper | JS91 | gacggtatcgataagcttgatatcgtc gacCATGATGGAGACGGAGCTG |
| Sequence-based reagent | Sox2_HAL_R | This paper | JS92 | tccgcttccgtcgacCATGTG TGAGAGGGGCAG |
| Sequence-based reagent | P2A-EGFP_F | This paper | JS93 | cccctctcacacatgGTCGAC GGAAGCGGAGCTAC |
| Sequence-based reagent | P2A-EGFP_R | This paper | JS94 | ttcgctgtccggcccTTACTTG TACAGCTCGTCCATGC |
| Sequence-based reagent | Sox2_HAR_F | This paper | JS95 | gagctgtacaagtaaGGGCC GGACAGCGAACTG |
| Sequence-based reagent | Sox2_HAR_R | This paper | JS96 | tggagctccaccgcggtggcgggtttaaac GCAGACTGATTCAAATAATACAGAGCCG |
| Sequence-based reagent | F2DTA_F | This paper | JS56 | GTTTAAACCCGCCACCGC |
| Sequence-based reagent | F2DTA_R | This paper | JS57 | GTCGACGATATCAAGCTTATC |
| Sequence-based reagent | Sox2_PAMmut_F | This paper | JS104 | CCCGGTGCCCGGCA CAGCCATTAACGGCAC |
| Sequence-based reagent | Sox2_PAMmut_R | This paper | JS105 | GTGCCGTTAATGGCTG TGCCGGGCACCGGG |
| Sequence-based reagent | hSyn1_Gibson forward | This paper | OJAB602 | GAAAGAGAGATTTAGAATGA CAGTCTAGAGCGGATGCAT atcgatctgcagagggccctgcgtatg |
| Sequence-based reagent | hSyn1_Gibson Reverse | This paper | OJAB603 | gtcgtgcctgagagcgcagccttaagc tgcagaagttggtcgtgaggc actgggcaggtaagtatc |
| Sequence-based reagent | min_CMVpromoter_F | This paper | JS304 | ggtaggcgtgtacggtgg |
| Sequence-based reagent | 5'TOPreportergibson_R | This paper | JS305 | TCCTTAATCAGCTCGCT catggtggctagcctatagtg |
| Sequence-based reagent | gibsontagBFP_F | This paper | JS306 | TAGGCTAGCCACCATG agcgagctgattaaggag |
| Sequence-based reagent | gibsontagBFP_R | This paper | JS307 | CACTGGACTAGTGGATC CGAGCTCGGTACCTCA attaagcttgtgccccag |
| Sequence-based reagent | TSC2_sgRNA-top | This paper | JS376 | CACCGCTTTAGG GCGAGCGTTTGG |
| Sequence-based reagent | TSC2_sgRNA-bottom | This paper | JS377 | AAACCCAAACGC TCGCCCTAAAGC |
| Sequence-based reagent | TSC2_exon5_FP | This paper | JS378 | AGTGGAAGCACTCTGGAAGG |
| Sequence-based reagent | TSC2_exon5_RP | This paper | JS379 | GACGCCGAATCTACATCTCC |
| Sequence-based reagent | TSC2_exon5_seq | This paper | JS380 | CTGCCCTGTACAATGCTGATG |
| Sequence-based reagent | sox2_F | This paper | JS127 | CAGCTCGCAGACCTACATG |
| Sequence-based reagent | sox2_R | This paper | JS128 | GCACATGATGCTGGACTAG |
| Sequence-based reagent | AAVS1_F | This paper | JAB405 | tgagtccggaccactttgag |
| Sequence-based reagent | hSyn1 promoter_R | This paper | OW23 | ccgcctcatcctggtcc |
| Sequence-based reagent | WPRE_F | This paper | JS125 | gacgtccttctgctacgtc |
| Sequence-based reagent | AAVS1_R | This paper | JAB406 | cttcttggccacgtaacctg |
| Sequence-based reagent | G3BP1_genomic_F | This paper | KNO-oPT-102 | CACTCATTAGTGTTGTGACCC |
| Sequence-based reagent | APEX-N-R | This paper | KNO-oPT-103 | CTCACAGTTGGGTAAGACTTTC |
| Sequence-based reagent | Sox2 guide B | This paper | GAGCGGCCCGGTGCCCGGCA | |
| Sequence-based reagent | G3BP1 guide | This paper | TCCATGAAGATTCACTGCCG | |
| Sequence-based reagent | TSC2 guide | This paper | CTTTAGGGCGAGCGTTTGG | |
| Sequence-based reagent | RPL5_1 | Stellaris, Quasar 570 Dye | cgctagggggtgggaaaagg | |
| Sequence-based reagent | RPL5_2 | Stellaris, Quasar 570 Dye | catcctgcggaacagagacc | |
| Sequence-based reagent | RPL5_3 | Stellaris, Quasar 570 Dye | gccttattcttaacaacttt | |
| Sequence-based reagent | RPL5_4 | Stellaris, Quasar 570 Dye | cacttggtatctcttaaagt | |
| Sequence-based reagent | RPL5_5 | Stellaris, Quasar 570 Dye | cctctcgtcgtcttctaaat | |
| Sequence-based reagent | RPL5_6 | Stellaris, Quasar 570 Dye | tccgagcataataatcagtt | |
| Sequence-based reagent | RPL5_7 | Stellaris, Quasar 570 Dye | ttatcttgtatcaccaagcg | |
| Sequence-based reagent | RPL5_8 | Stellaris, Quasar 570 Dye | ctgtatttgggtgtgttgta | |
| Sequence-based reagent | RPL5_9 | Stellaris, Quasar 570 Dye | ctctgtttgtcacacgaact | |
| Sequence-based reagent | RPL5_10 | Stellaris, Quasar 570 Dye | acgggcataagcaatctgac | |
| Sequence-based reagent | RPL5_11 | Stellaris, Quasar 570 Dye | gctgcgcagactatcatatc | |
| Sequence-based reagent | RPL5_12 | Stellaris, Quasar 570 Dye | acaccatattttggcagttc | |
| Sequence-based reagent | RPL5_13 | Stellaris, Quasar 570 Dye | agcataatttgtcaggccaa | |
| Sequence-based reagent | RPL5_14 | Stellaris, Quasar 570 Dye | cagcaggccagtacaatatg | |
| Sequence-based reagent | RPL5_15 | Stellaris, Quasar 570 Dye | ccaaacctattgagaagcct | |
| Sequence-based reagent | RPL5_16 | Stellaris, Quasar 570 Dye | cttggccttcatagatcttg | |
| Sequence-based reagent | RPL5_17 | Stellaris, Quasar 570 Dye | ttgtattcatcaccagtcac | |
| Sequence-based reagent | RPL5_18 | Stellaris, Quasar 570 Dye | tggctgaccatcaatgcttt | |
| Sequence-based reagent | RPL5_19 | Stellaris, Quasar 570 Dye | tccaaatagcaggtgaaggc | |
| Sequence-based reagent | RPL5_20 | Stellaris, Quasar 570 Dye | cagtggtagttctggcaagg | |
| Sequence-based reagent | RPL5_21 | Stellaris, Quasar 570 Dye | cttcagggcaccaaaaactt | |
| Sequence-based reagent | RPL5_22 | Stellaris, Quasar 570 Dye | tgtgagggatagacaagcct | |
| Sequence-based reagent | RPL5_23 | Stellaris, Quasar 570 Dye | taaccagggaatcgtttggt | |
| Sequence-based reagent | RPL5_24 | Stellaris, Quasar 570 Dye | ctgcattaaattccttgctt | |
| Sequence-based reagent | RPL5_25 | Stellaris, Quasar 570 Dye | atgatgtgcttccgatgtac | |
| Sequence-based reagent | RPL5_26 | Stellaris, Quasar 570 Dye | gtaatctgcaacattctggc | |
| Sequence-based reagent | RPL5_27 | Stellaris, Quasar 570 Dye | tcttcttccattaagtagcg | |
| Sequence-based reagent | RPL5_28 | Stellaris, Quasar 570 Dye | actgtttcttgtaagcatct | |
| Sequence-based reagent | RPL5_29 | Stellaris, Quasar 570 Dye | ggagttacgctgttctttat | |
| Sequence-based reagent | RPL5_30 | Stellaris, Quasar 570 Dye | gagctttcttatacatctcc | |
| Sequence-based reagent | RPL5_31 | Stellaris, Quasar 570 Dye | tggattctctcgtatagcag | |
| Sequence-based reagent | RPL5_32 | Stellaris, Quasar 570 Dye | tcttgggcttcttttcatag | |
| Sequence-based reagent | RPL5_33 | Stellaris, Quasar 570 Dye | ccacctcttctttttaactt | |
| Sequence-based reagent | RPL5_34 | Stellaris, Quasar 570 Dye | tgagcaagggacattttggg | |
| Sequence-based reagent | RPL5_35 | Stellaris, Quasar 570 Dye | ttcttttgagctacccgatc | |
| Sequence-based reagent | RPL5_36 | Stellaris, Quasar 570 Dye | ctgagctctgaggaagcttg | |
| Sequence-based reagent | RPL5_37 | Stellaris, Quasar 570 Dye | aaattgctgggtttagctct | |
| Sequence-based reagent | RPL5_38 | Stellaris, Quasar 570 Dye | agttgctgttcataagttta | |
| Sequence-based reagent | RPL11_1 | Stellaris, Quasar 570 Dye | ccatgatggagagcaggaag | |
| Sequence-based reagent | RPL11_2 | Stellaris, Quasar 570 Dye | ttctccttttcaccttgatc | |
| Sequence-based reagent | RPL11_3 | Stellaris, Quasar 570 Dye | agtttgcggatgcgaagttc | |
| Sequence-based reagent | RPL11_4 | Stellaris, Quasar 570 Dye | cccaacacagatgttgagac | |
| Sequence-based reagent | RPL11_5 | Stellaris, Quasar 570 Dye | tggaaaacacaggggtctgc | |
| Sequence-based reagent | RPL11_6 | Stellaris, Quasar 570 Dye | gatctgacagtgtatctagc | |
| Sequence-based reagent | RPL11_7 | Stellaris, Quasar 570 Dye | atcttttcatttctccggat | |
| Sequence-based reagent | RPL11_8 | Stellaris, Quasar 570 Dye | tcgaactgtgcagtggacag | |
| Sequence-based reagent | RPL11_9 | Stellaris, Quasar 570 Dye | ttctccaagatttcttctgc | |
| Sequence-based reagent | RPL11_10 | Stellaris, Quasar 570 Dye | tttcttaactcatactcccg | |
| Sequence-based reagent | RPL11_11 | Stellaris, Quasar 570 Dye | tccagtatctgagaagttgt | |
| Sequence-based reagent | RPL11_12 | Stellaris, Quasar 570 Dye | cctggatcccaaaaccaaag | |
| Sequence-based reagent | RPL11_13 | Stellaris, Quasar 570 Dye | tttgatacccagatcgatgt | |
| Sequence-based reagent | RPL11_14 | Stellaris, Quasar 570 Dye | tagataccaatgcttgggtc | |
| Sequence-based reagent | RPL11_15 | Stellaris, Quasar 570 Dye | agcaccacatagaagtccag | |
| Sequence-based reagent | RPL11_16 | Stellaris, Quasar 570 Dye | tcttgtctgcgatgctgaaa | |
| Sequence-based reagent | RPL11_17 | Stellaris, Quasar 570 Dye | tctttgctgattctgtgttt | |
| Sequence-based reagent | RPL11_18 | Stellaris, Quasar 570 Dye | atgatcccatcatacttctg | |
| Sequence-based reagent | RPL11_19 | Stellaris, Quasar 570 Dye | acgggaatttatttgccagg | |
| Sequence-based reagent | RPL11_20 | Stellaris, Quasar 570 Dye | ctttttattgctcttttgga | |
| Recombinant DNA reagent | pSpCas9(BB)–2A- tomato SOX2-sgRNA | This study; Addgene | 196190 | |
| Recombinant DNA reagent | pHDR_sox2HA_P2A- GFP-pA_HA_G2913A | This study; Addgene | 196191 | |
| Recombinant DNA reagent | AAVS1 SA-2A-puro-pA_hSYN1_dTomato- SV40pA | This study; Addgene | 196192 | |
| Recombinant DNA reagent | AAVS1-Neo-TRE-CMV-5'TOPtagBFP_bGHpA -CAG rtTA | This study; Addgene | 196193 | |
| Recombinant DNA reagent | AAVS1-Neo-TRE-CMV-mutant5'TOPtagBFP _bGHpA-CAG rtTA | This study; Addgene | 196194 | |
| Recombinant DNA reagent | pSpCas9(BB)–2A-tomato-TSC2-sgRNA | This study; Addgene | 196195 | |
| Recombinant DNA reagent | pHDR_G3BP1-V5-APEX2-mScarlet-I EF1a-Puro | This study; Addgene | 196196 | |
| Recombinant DNA reagent | pSpCas9(BB)–2A -Puro G3BP1-sgRNA | This study; Addgene | 196197 |
Additional files
-
Supplementary file 1
List of Oligos used for PCRs, guide sequence cloning and RNA-FISH.
- https://cdn.elifesciences.org/articles/85135/elife-85135-supp1-v1.xlsx
-
Supplementary file 2
Summary of genomic integrity and karyotype testing of the cell lines and clones used in this study.
- https://cdn.elifesciences.org/articles/85135/elife-85135-supp2-v1.pdf
-
Supplementary file 3
Reagents and media used in the study.
- https://cdn.elifesciences.org/articles/85135/elife-85135-supp3-v1.xlsx
-
MDAR checklist
- https://cdn.elifesciences.org/articles/85135/elife-85135-mdarchecklist1-v1.pdf
Download links
A two-part list of links to download the article, or parts of the article, in various formats.
Downloads (link to download the article as PDF)
Open citations (links to open the citations from this article in various online reference manager services)
Cite this article (links to download the citations from this article in formats compatible with various reference manager tools)
Integrated transcriptome and proteome analysis reveals posttranscriptional regulation of ribosomal genes in human brain organoids
eLife 12:e85135.
https://doi.org/10.7554/eLife.85135


