Myristoyl’s dual role in allosterically regulating and localizing Abl kinase
- Heidelberg Institute for Theoretical Studies (HITS), Heidelberg University, Germany
- Institute for Scientific Computing (IWR), Heidelberg University, Germany
Figures
Figure 1
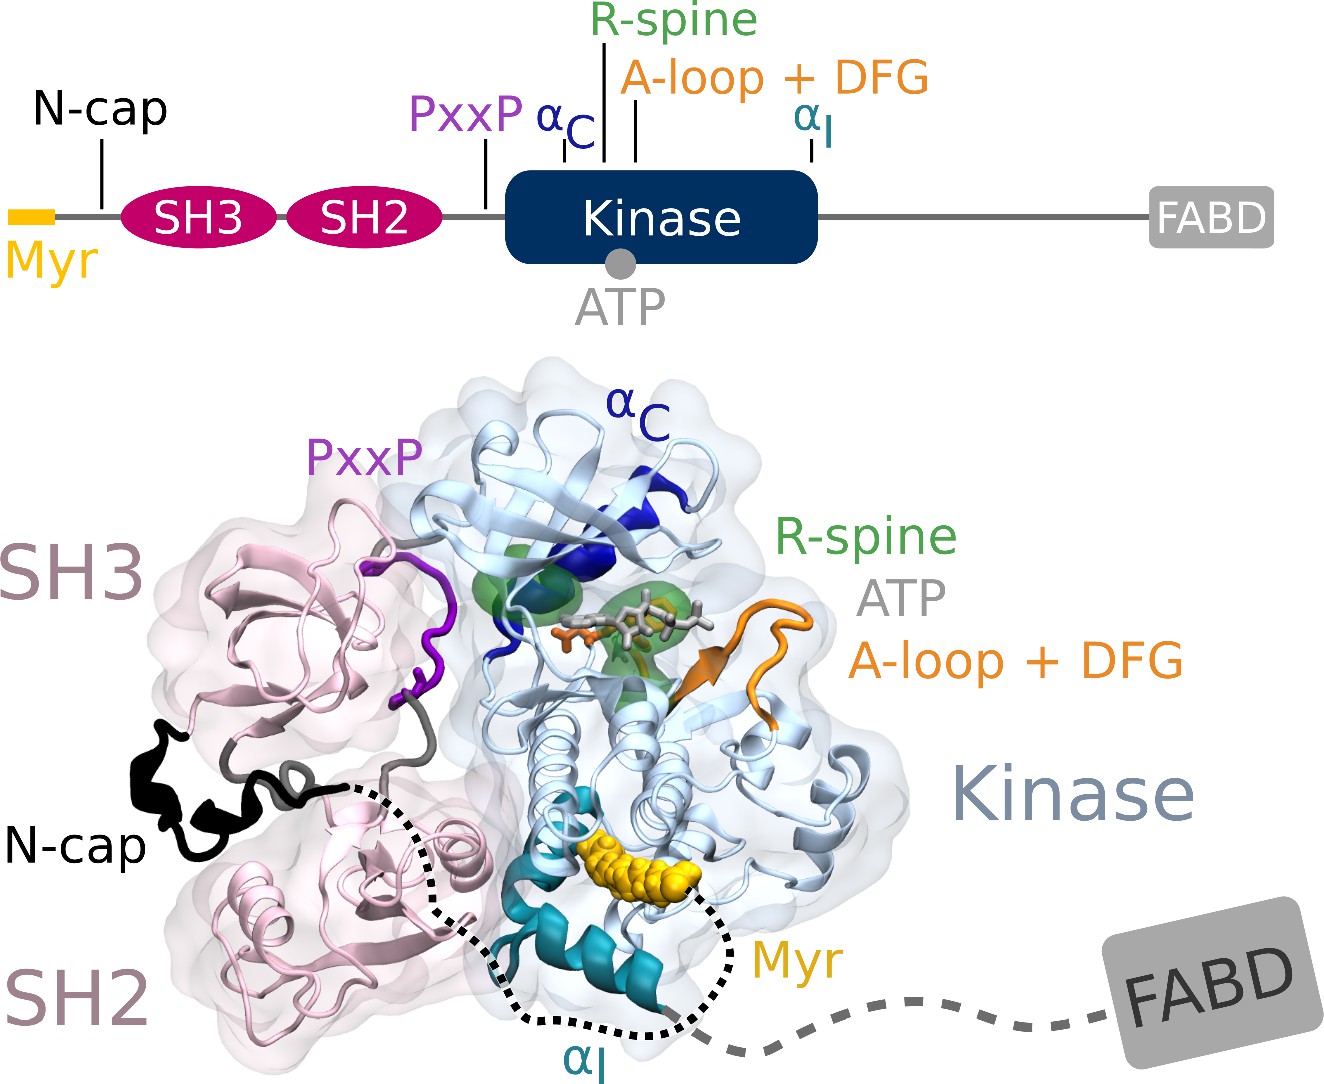
Abl structure in the assembled state.
The SH3 and SH2 domains (magenta) attach to the kinase domain (blue), mediated by two prolines (PxxP, purple) on the SH2-kinase linker and the kinked conformation of the αI helix (cyan), respectively. Myr (yellow) binds to a hydrophobic pocket at the C-terminal of the kinase and the N-cap (black) clamps around the assembled complex. ATP (light gray) is bound at the active center between the kinase N- and C-lobe. Changes during kinase activation include detachment of the SH domains from the back of the kinase domain, unbinding of Myr and straightening of the αI helix, rotation of the αC helix (dark blue), assembly of the R-spine (green), extension of the A-loop (orange) to allow substrate binding and transition of the DFG-motif (orange stick representation) to the in-conformation. The C-terminal disordered region and F-actin binding domain (FABD) were not considered in our simulation systems.
Figure 2 with 4 supplements
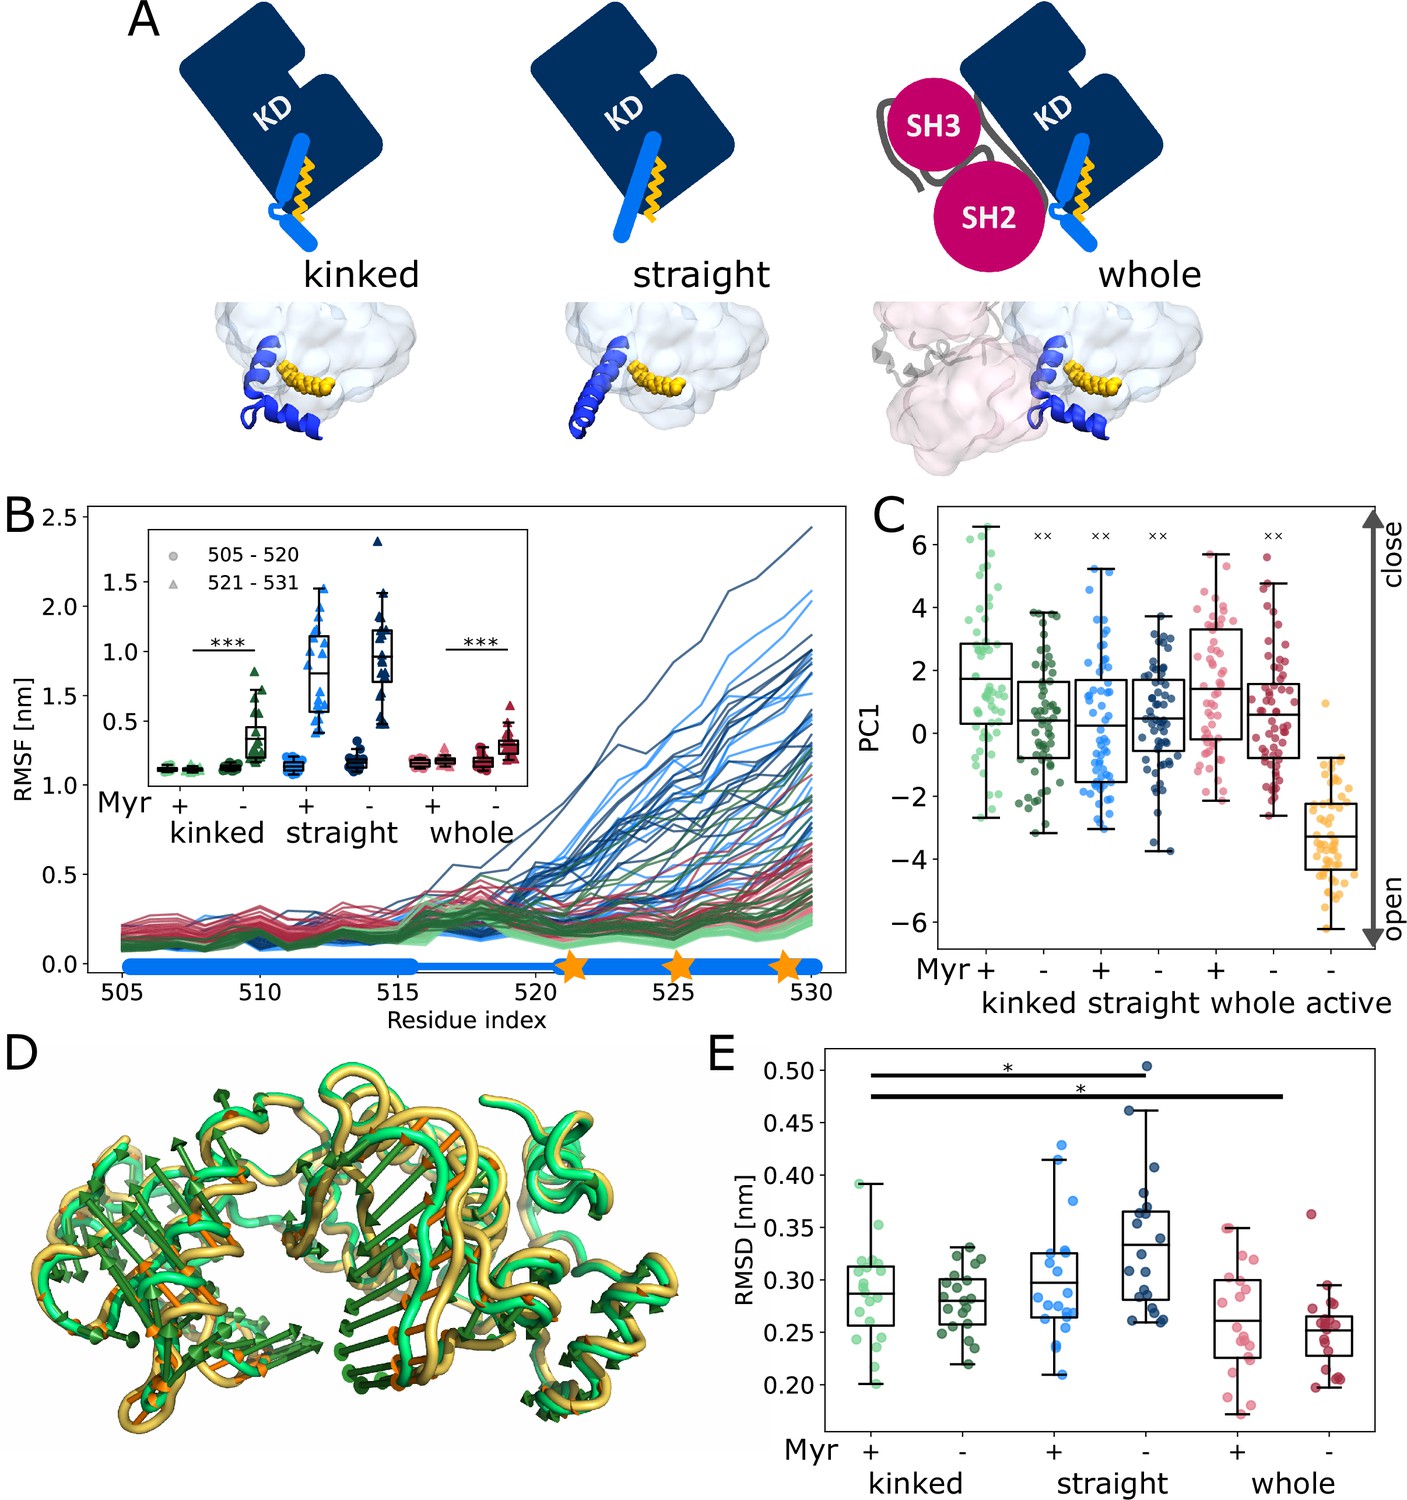
Influence of Myr on kinase domain dynamics.
(A) Overview of simulated Abl models. Models referred to as ’whole’ contain the kinase (KD, dark blue) and SH domains (magenta). The kinase was simulated with a kinked or straight αI helix (light blue) conformation. All models were simulated in the absence or presence of Myr (yellow). Results of ’whole,’ ’kinked,’ and ’straight’ models are shown in red, green, and blue colors, respectively, in subsequent figure panels. Lighter color shades represent simulations with and darker shades without Myr. (B) Root mean squared fluctuations (RMSF) of the αI helix. The thick and thin blue line at the bottom indicates the position of the folded or unfolded part of the kinked helix, respectively. Orange stars represent the hydrophobic residues at the helix C-terminal part. The inset shows the average RMSF of residues of the first half (505–520, circles) and second half (521–531, triangles) of the helix. (C) Principal component analysis of kinase domain dynamics. The projection of the trajectories onto the first eigenvalue is shown. We separated the trajectory into 400 ns sections, leaving out 100 ns in between, and plotted the averages for each of these sections. The sections are not correlated according to an autocorrelation analysis (Figure 2—figure supplement 3C). (D) Porcupine plot illustrating the motion described by the first principal component. Orange tones represent the kinase domain in an active conformation, green tones represent the kinase with a kinked αI helix bound with Myr. Visualized using PyMol v2.4.1 and the modevectors.py script (http://www.pymolwiki.org/index.php/Modevectors). (E) Root mean squared deviation (RMSD) of the kinase domain excluding the αI helix. Centerlines of boxplots denote the mean, box edges the upper and lower quartile. Whiskers represent 1.5× interquartile range. */***p-value <0.05/0.001 between indicated models. ×× p-value vs. kinked + Myr < 0.01.
Figure 2—figure supplement 1
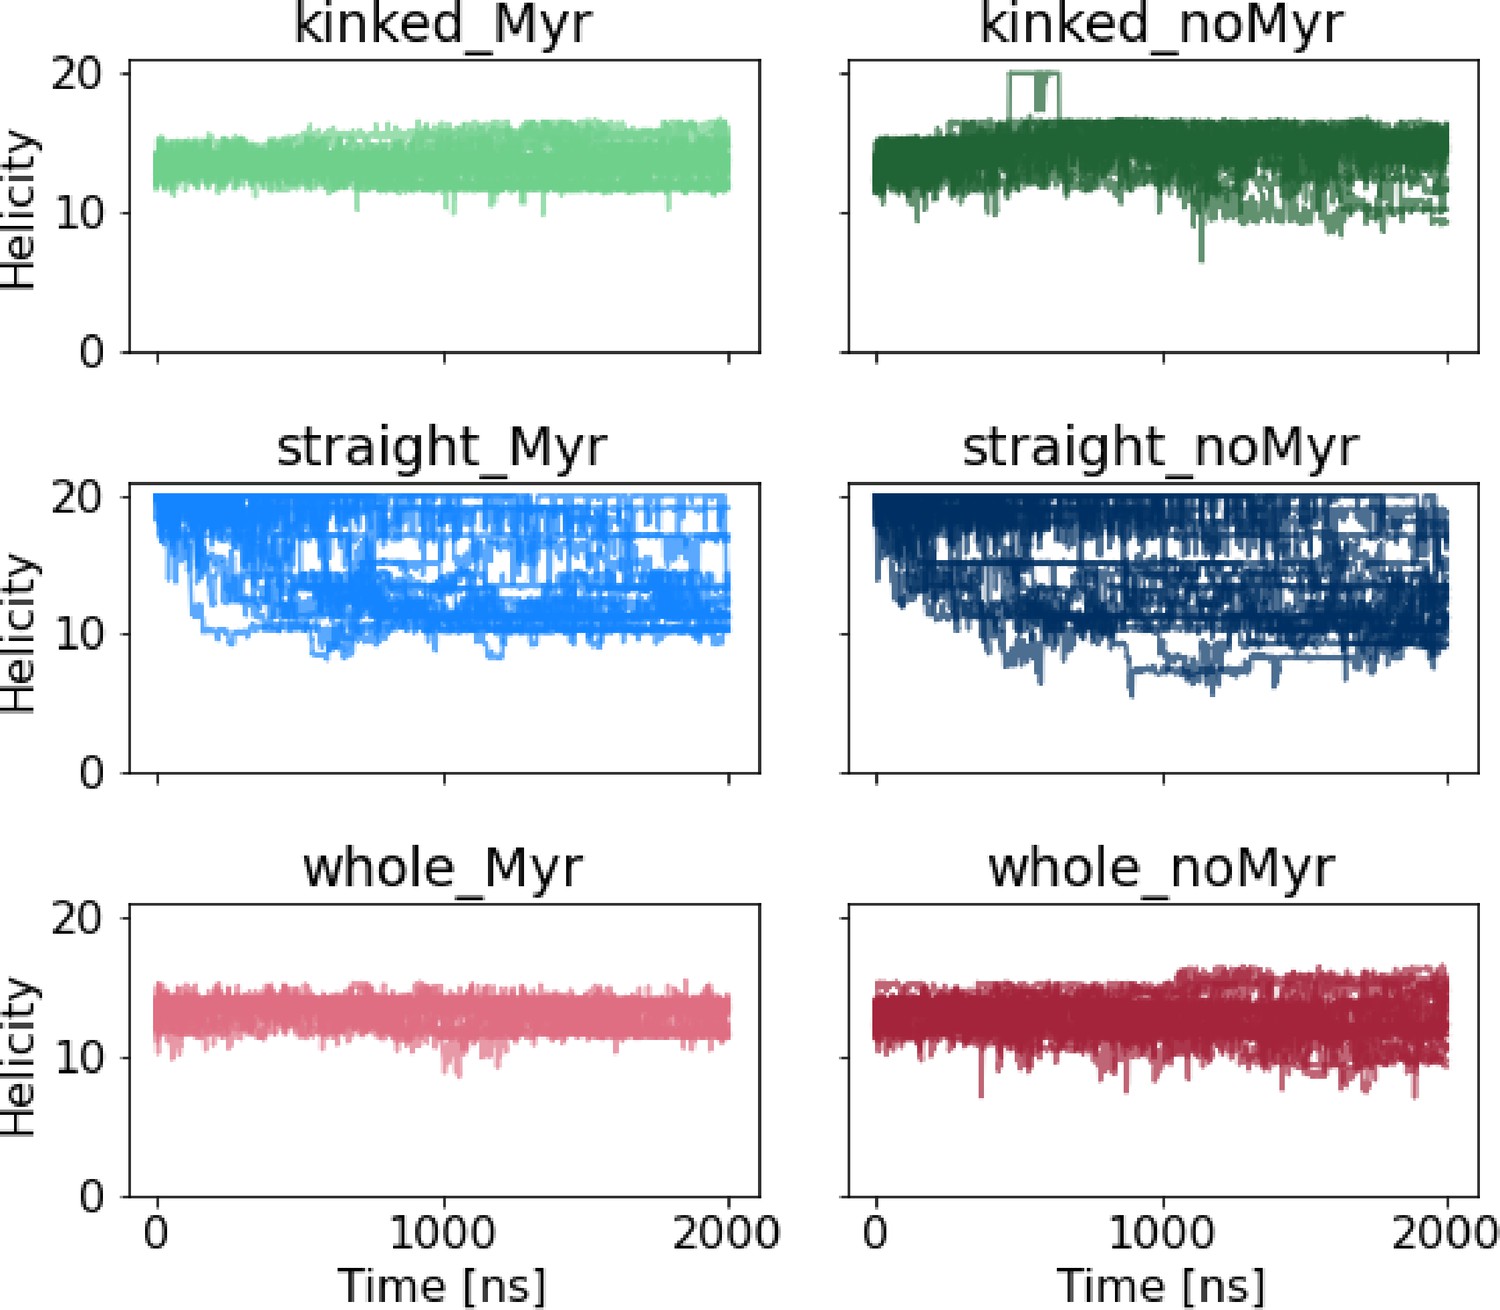
Helicity of the αI helix.
Helicity is calculated using Plumed’s alpharmsd CV. Straight αI helices partially unravel regardless of whether Myr is bound or not. The kinked helices remain stable in all cases albeit with slightly larger helicity fluctuations in the absence of Myr.
Figure 2—figure supplement 2
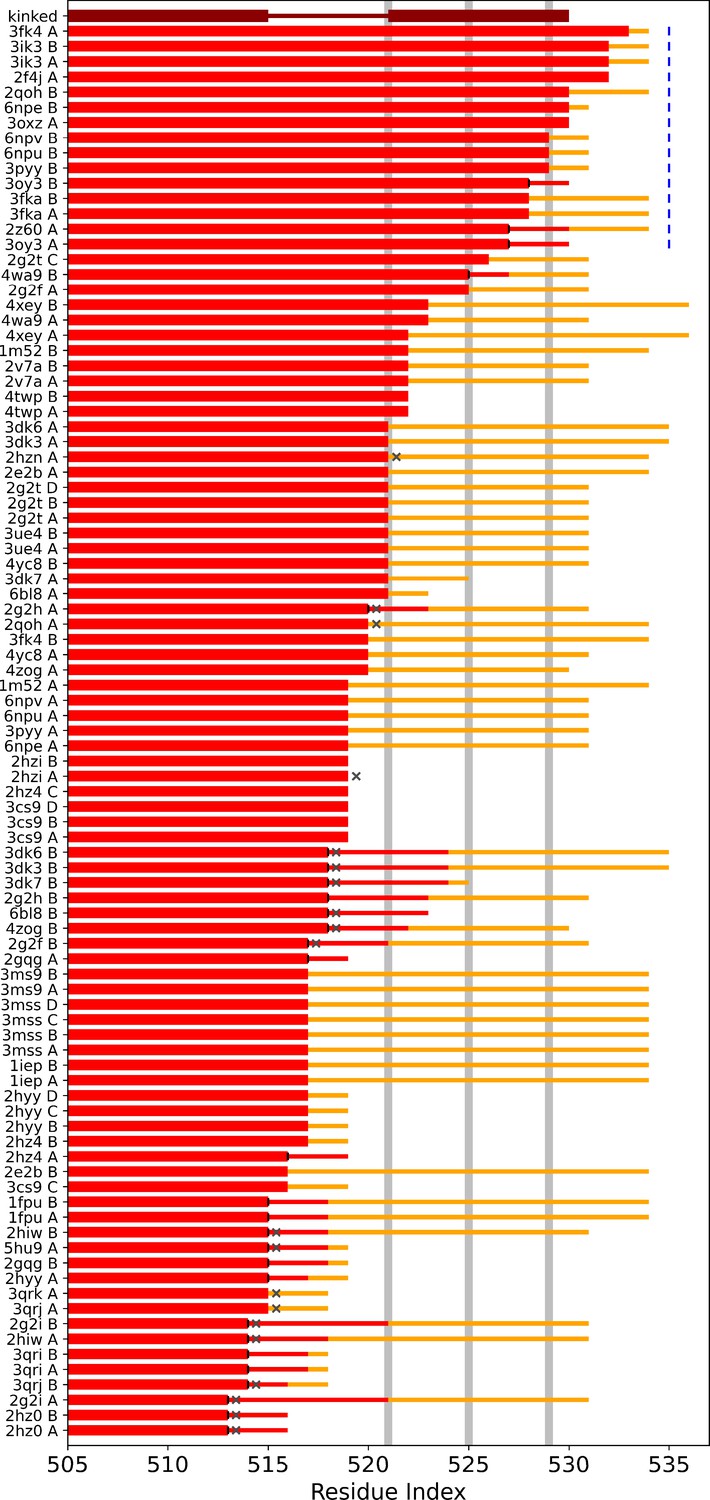
αI helix lengths in crystal structures.
Overview over αI helix lengths in Abl crystal structures published on the protein data bank. The kinked αI helix structure is shown for reference in dark red. The two thick line segments indicate the folded part, which is interrupted as shown by the thinner line segment. Light gray horizontal lines represent the position of the hydrophobic residues I521, L525, and V529. Light red lines depict resolved residues. Yellow lines represent residues that were present in the construct used for crystallization, but were not resolved. Vertical black lines indicate that the helices were not folded beyond this residue position, dark gray Xs that helix continuation was blocked by another copy of Abl in the crystal lattice. Blue labels illustrate that the straight helix conformation, especially the hydrophobic residues, were protected by another protein copy in the crystal lattice. It can be seen that the majority of helices that continue folded beyond the first hydrophobic residues are stabilized by another protein copy, while helices, which end much sooner, are either blocked or the respective residues were not included in the construct used for crystallization.
Figure 2—figure supplement 3
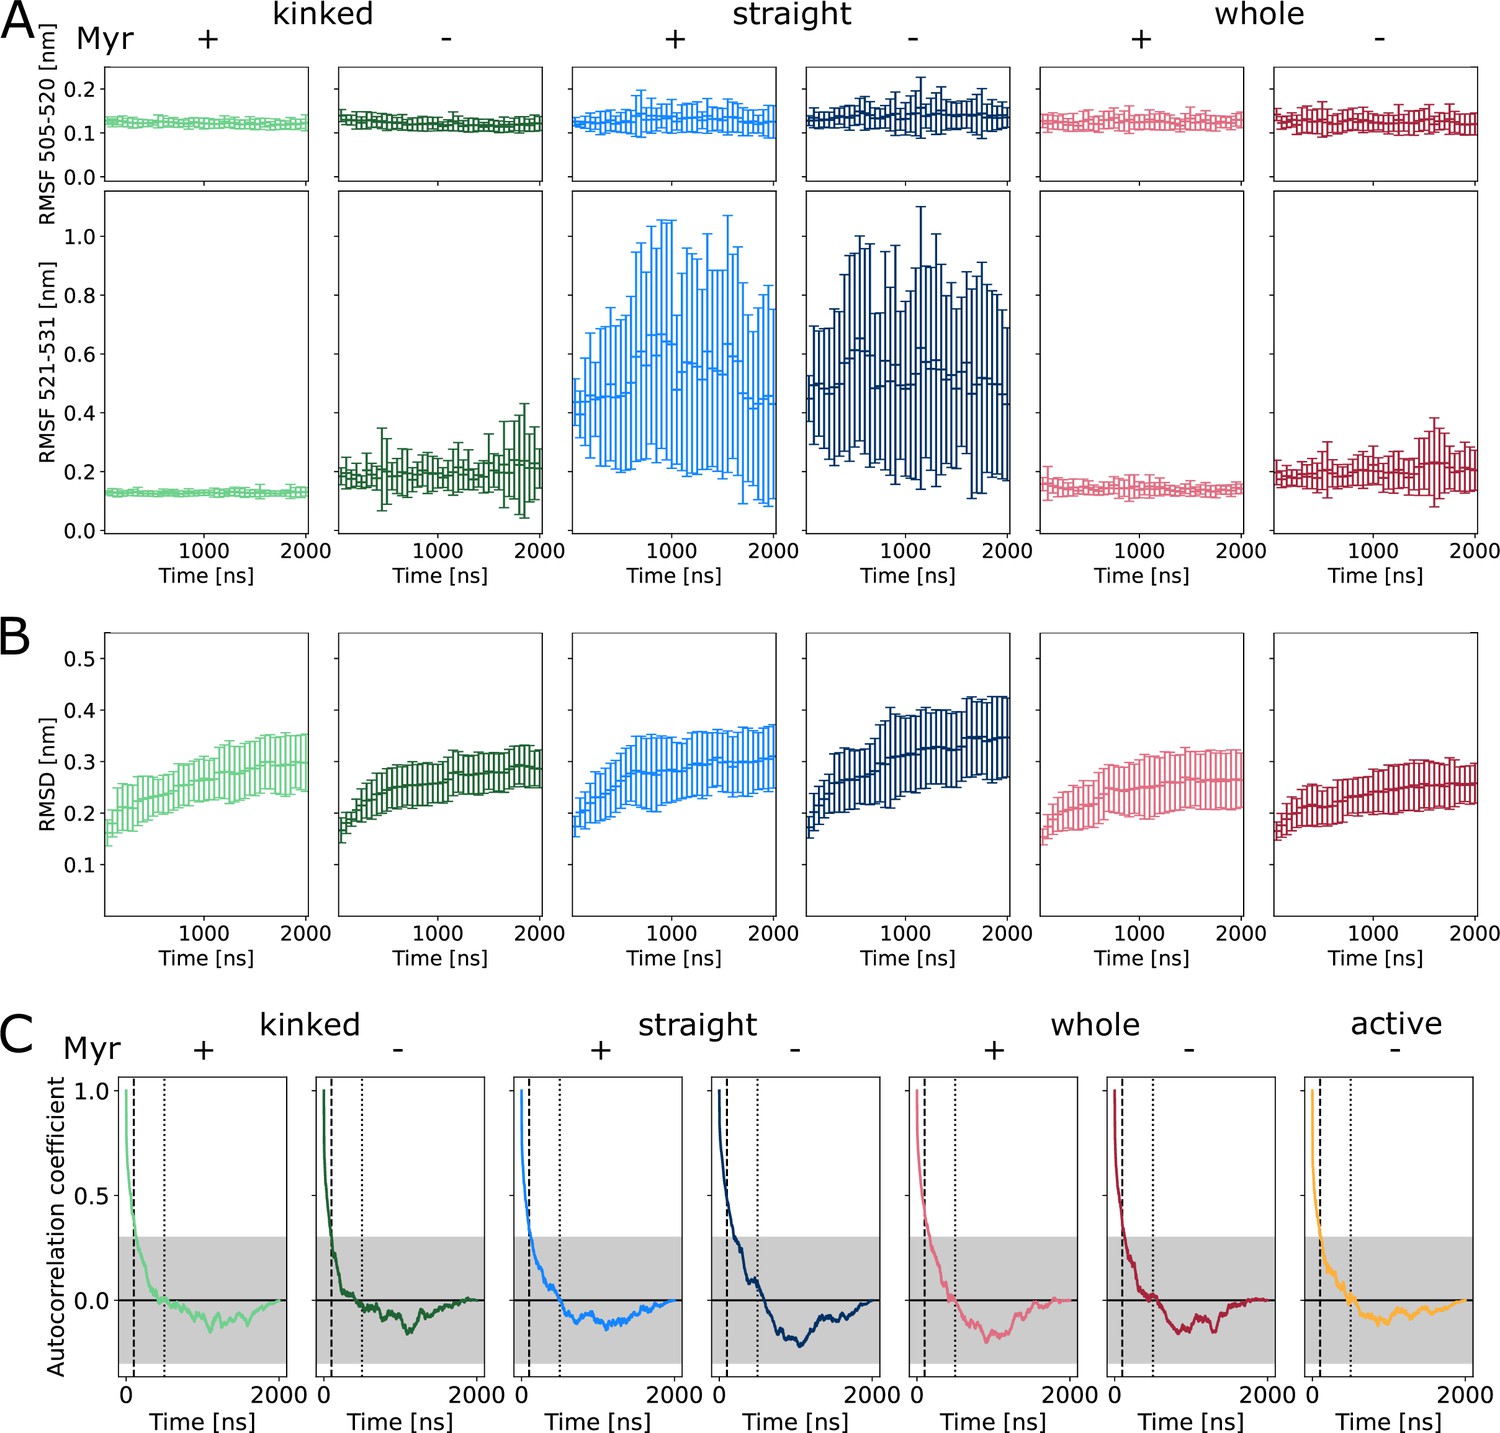
Convergence of equilibrium molecular dynamics (MD) simulations.
Block analysis of (A) αI helix root mean squared fluctuations (RMSF) and (B) kinase domain root mean squared deviation (RMSD). The properties were computed for each block with a length of 50 ns. Due to the slowly converging RMSD, the first 1000 ns were excluded from the main analyses. (C) Autocorrelation of the projection on the first principal component. The correlation coefficient is low after 100 ns (indicated by the dashed line) and close to zero after 500 ns (dotted line).
Figure 2—figure supplement 4
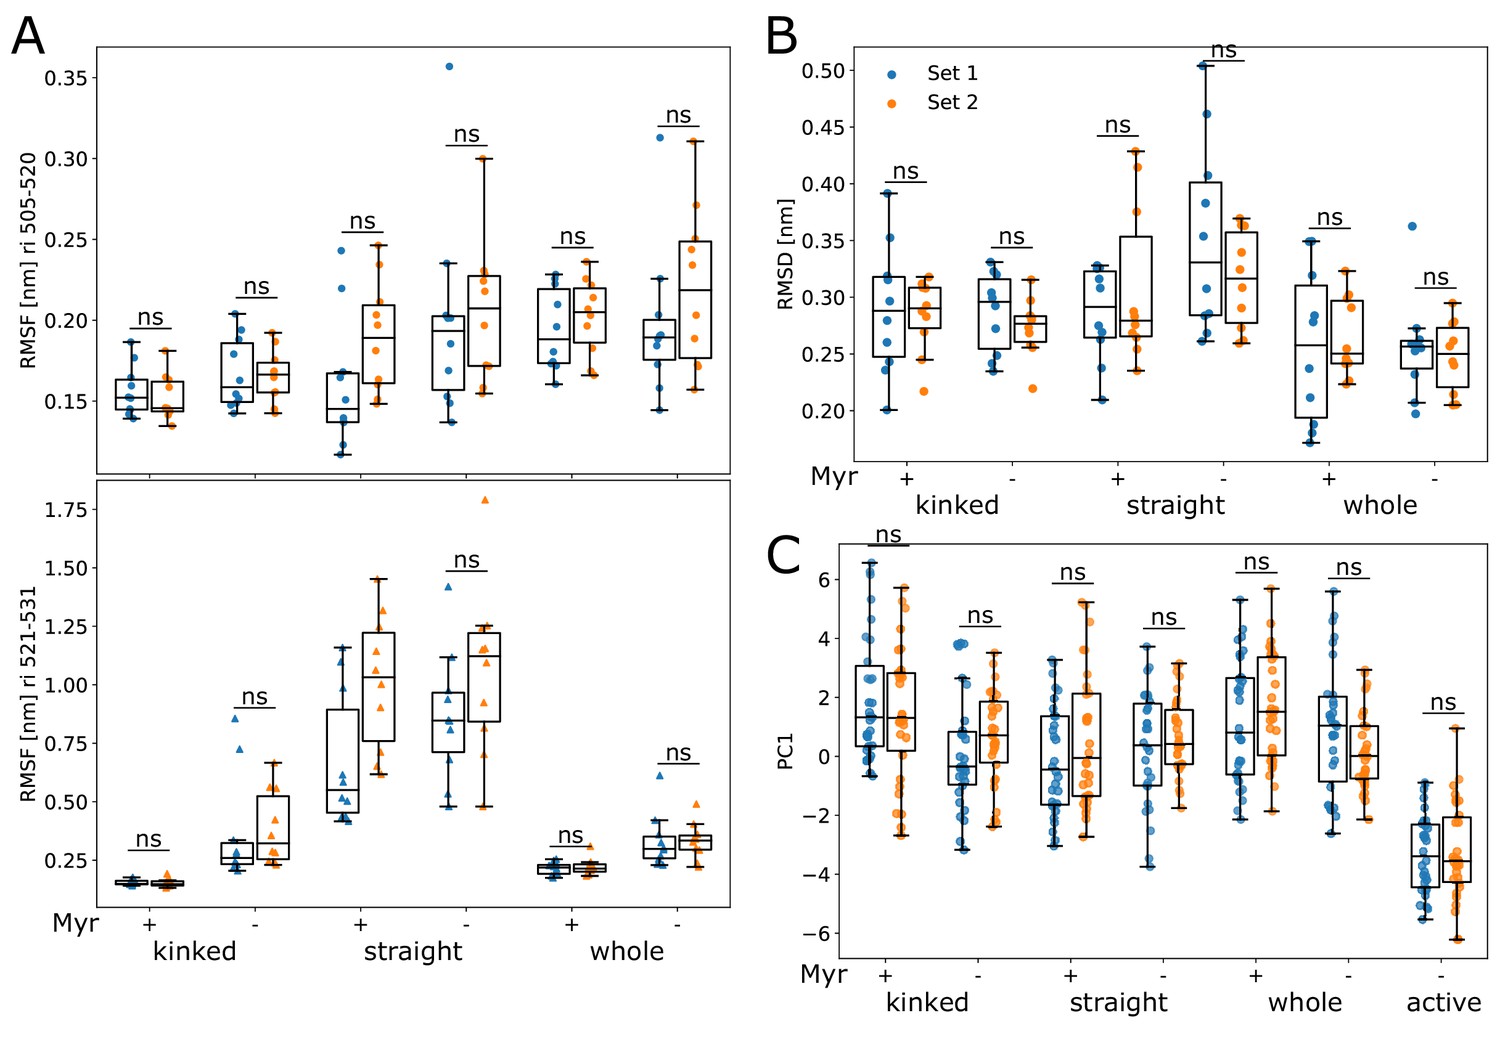
Comparison of data sets.
Comparison between different simulation conditions (used to create Figures 2 and 3). Both were simulated using Gromacs 2020.3 and the proteins were capped to remove artificial charges introduced by a premature ending of protein structures, that is, most of the N-terminal linker and the C-terminal disordered region and F-actin binding domain were not part of any of the simulated systems. The difference between sets 1 and 2 is the use of the v-rescale and Nosè–Hoover thermostat, respectively. The remaining simulation parameters were as described in the ‘Methods’ section.
Figure 3 with 2 supplements
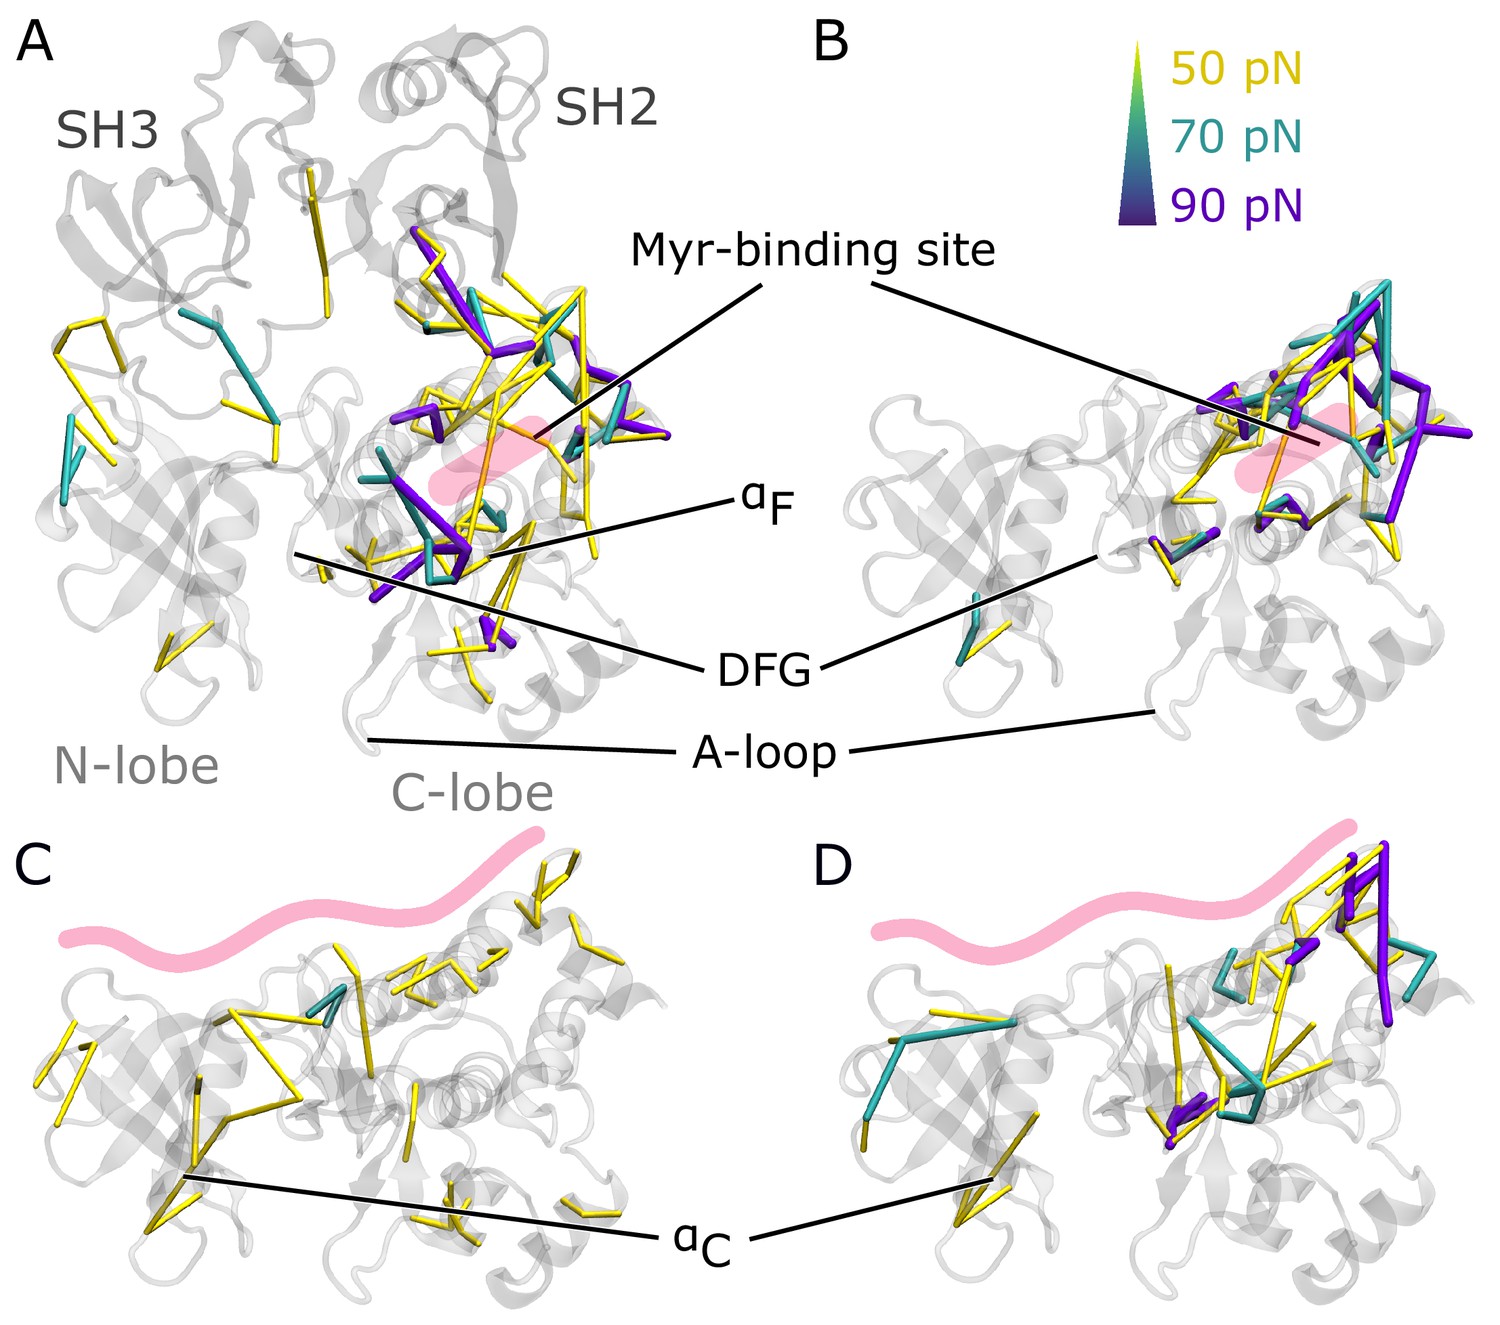
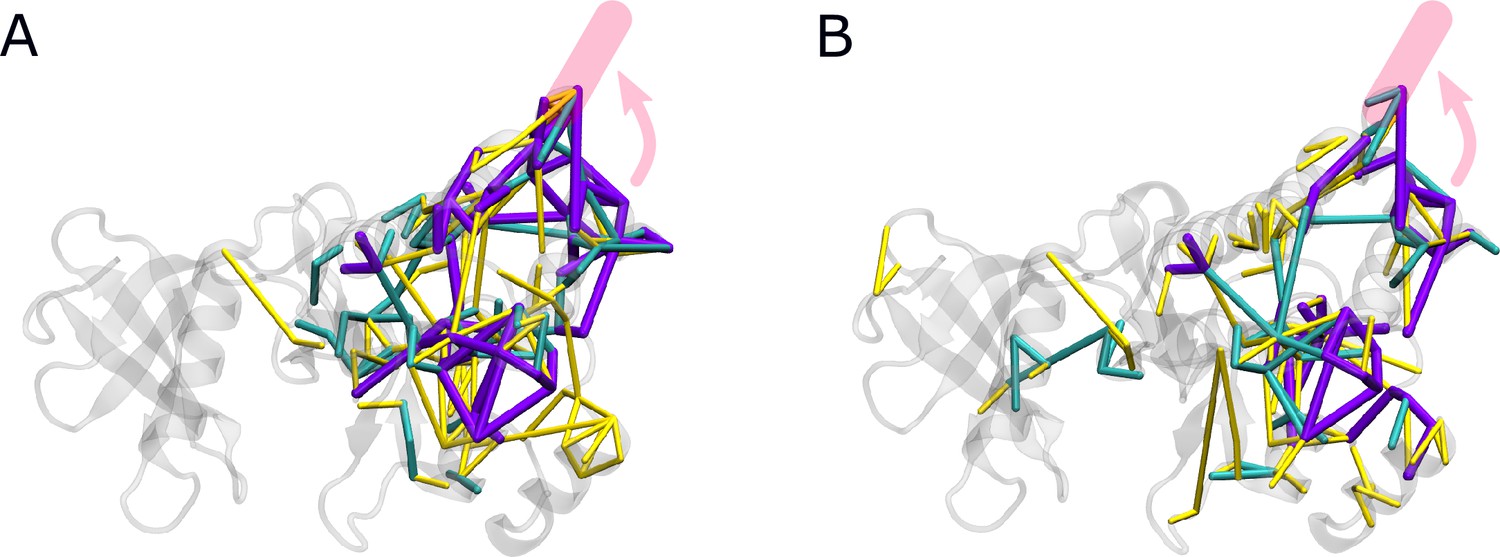
Residue pairwise force differences.
The protein is shown in gray. Difference clusters with the indicated force threshold are visualized when at least three residues are connected. As indicated in light red, the top row compares differences between simulations with and without Myr in (A) the SH3-SH2-kinase complex or (B) a sole kinase domain with a kinked αI helix. The bottom row compares simulations with and without the SH domains (C) with Myr or (D) without Myr.
Figure 3—figure supplement 1
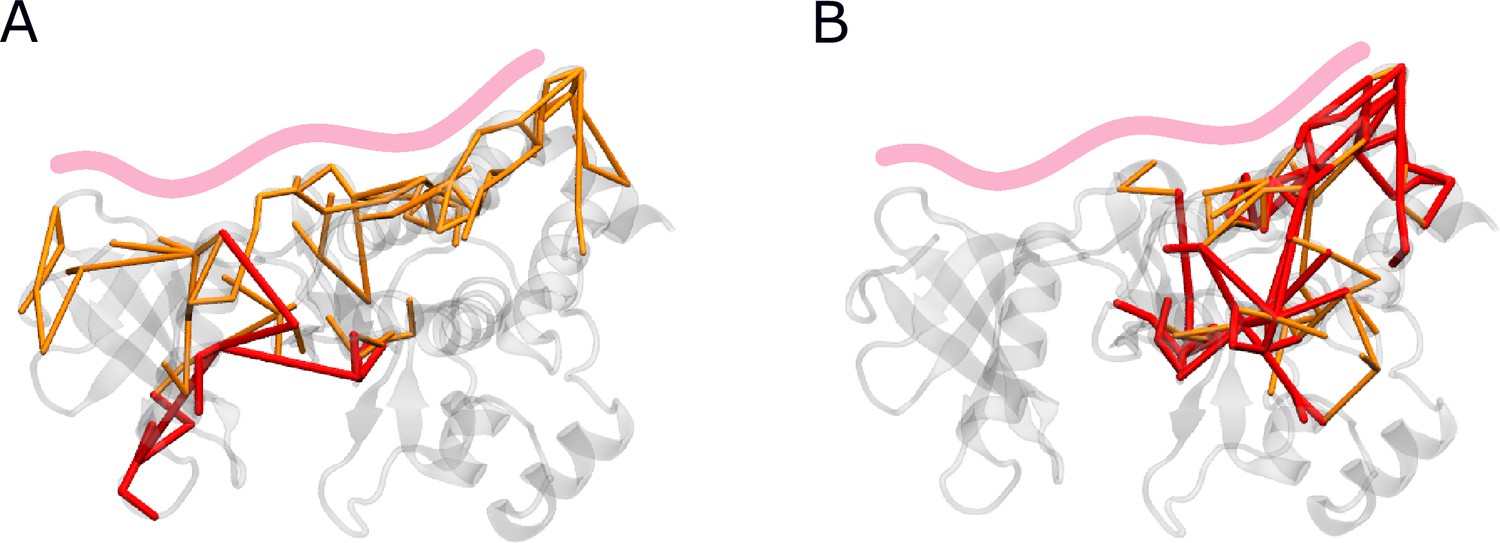
Biggest force difference clusters with and without SH domains.
Force distribution analysis (FDA) comparing simulations with and without the SH domains (A) in the presence or (B) absence of Myr. Only the biggest connected force difference cluster is shown with a threshold of 30 and 40 pN, indicated by orange and red rods, respectively.
Figure 3—figure supplement 2
Force differences between straight and kinked αI helix.
Force distribution analysis (FDA) of the impact of changing the helix from a kinked to a straight conformation (A) with or (B) without Myr.
Figure 4 with 1 supplement
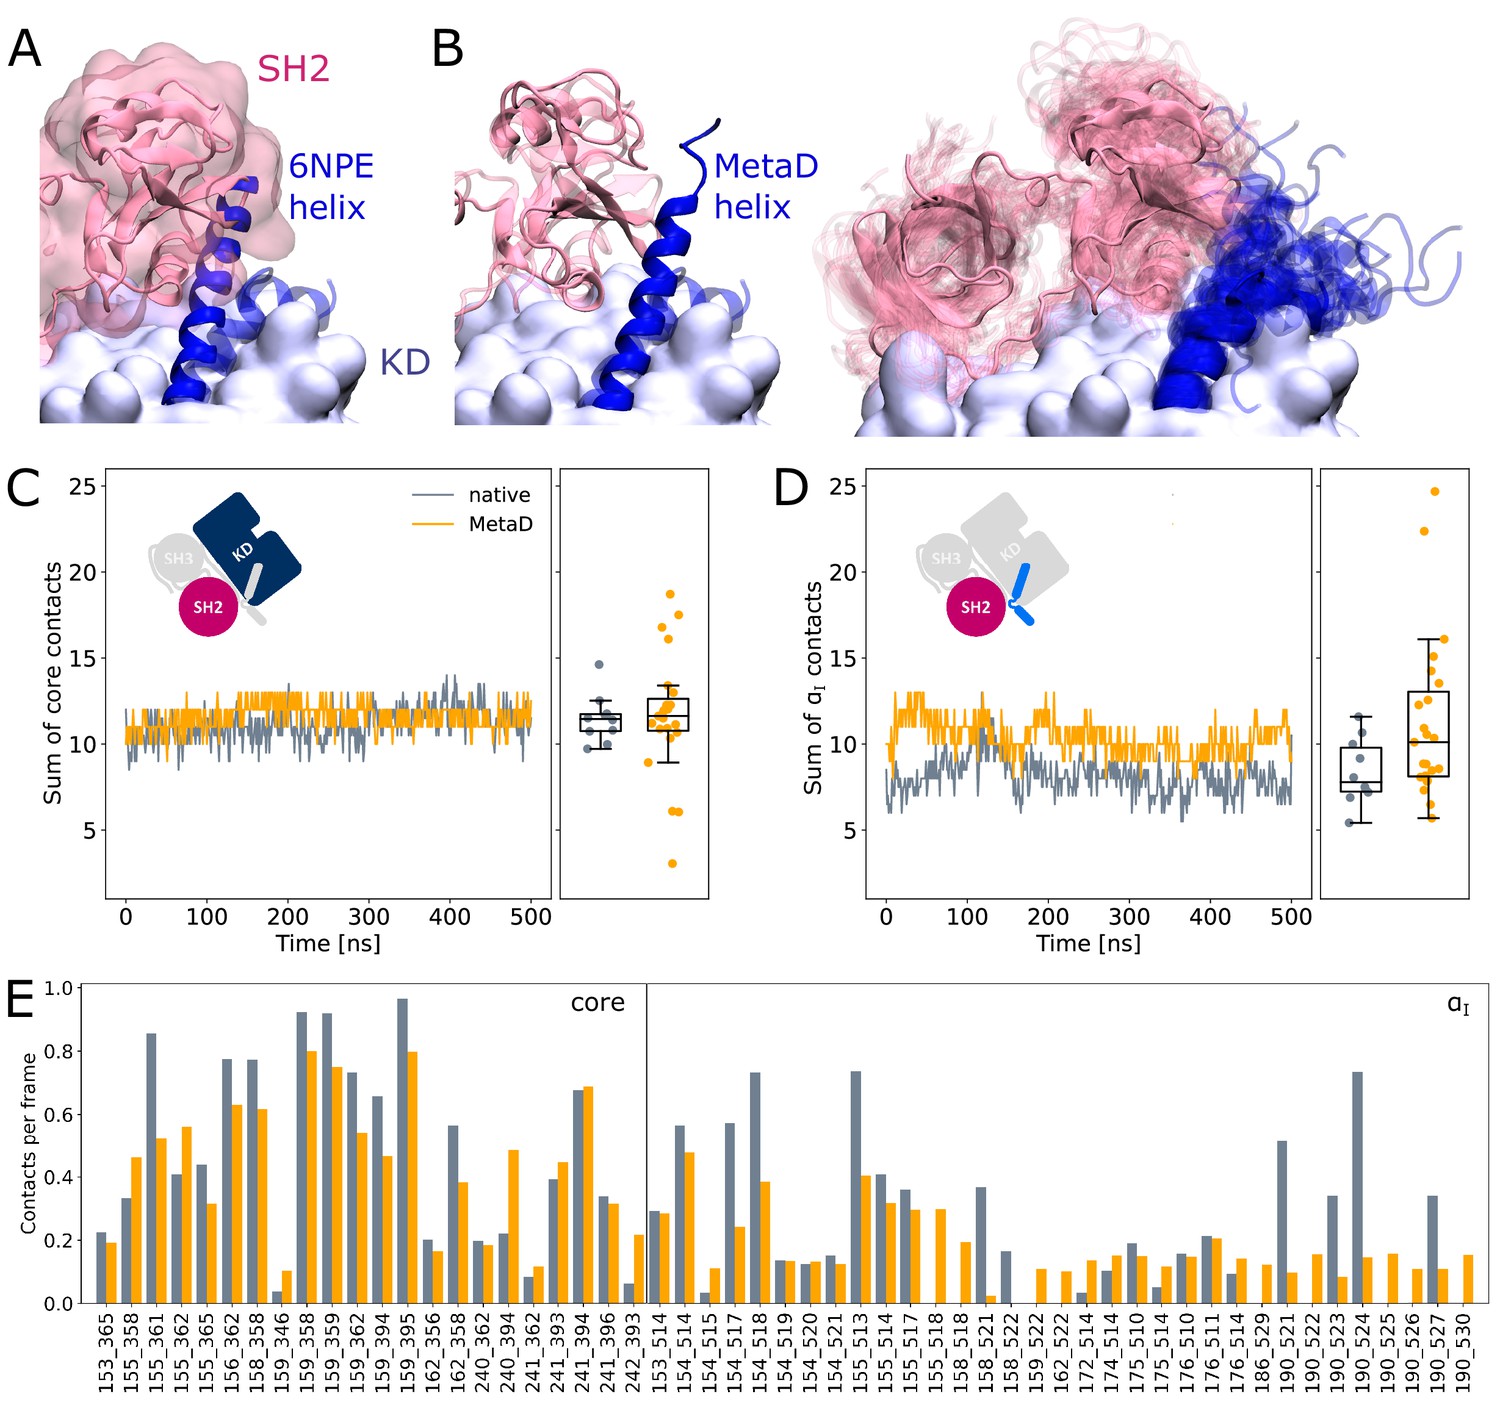
SH2 domain binding is preserved after Metadynamics enhanced αI helix straightening.
(A) The straight αI helix from crystal structures (PDB-ID: 6NPE, blue) clashes with the Abl SH2 domain (light pink). For reference, the structure corresponding to a kinked helix is shown transparently. The kinase domain is shown in opaque surface representation. (B) Helix conformations obtained by Metadynamics simulations are compatible with SH2 binding. One example of a straightened helix is depicted on the left, the right image shows an overlay of all 23 frames with high helicity after simulating them under equilibrium conditions. (C, D) Sum of contacts per frame considering contacts of (C) the kinase domain excluding the αI helix or (D) only the αI helix. Contacts are considered native when they appeared in our simulations of the Abl SH3-SH2-kinase complex. The ’MetaD’ contacts were determined from simulations started from Metadynamics frames with high helicity values. (E) Conservation of contacts per frame and residue pair. Contacts, which are present in at least 10% of the simulation time in either native simulations or after Metadynamics, are shown. The label ’core’ denotes contacts excluding the αI helix, which starts at residue index 505.
Figure 4—figure supplement 1
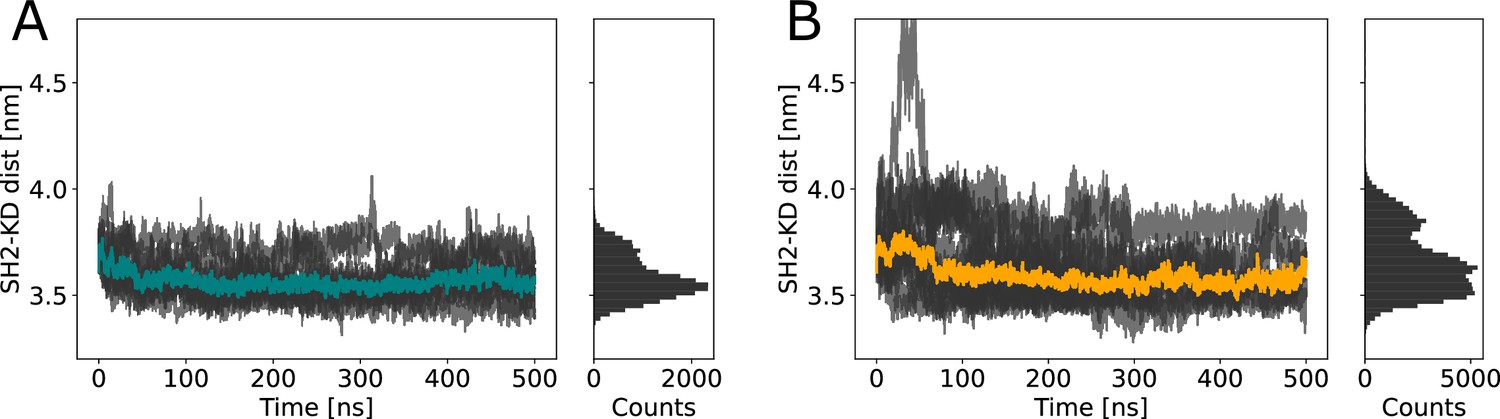
Distances between the kinase and SH2 domain.
Distances between the center of mass of SH2 and kinase domain during (A) equilibrium molecular dynamics (MD) and (B) Metadynamics simulations. Despite transient unbinding events characterized by distance increases toward the beginning of a few Metadynamics simulations, the median distance (depicted as colored lines) is very similar in both cases: 3.56 for equilibrium MD and 3.55 for Metadynamics simulations.
Figure 5 with 1 supplement
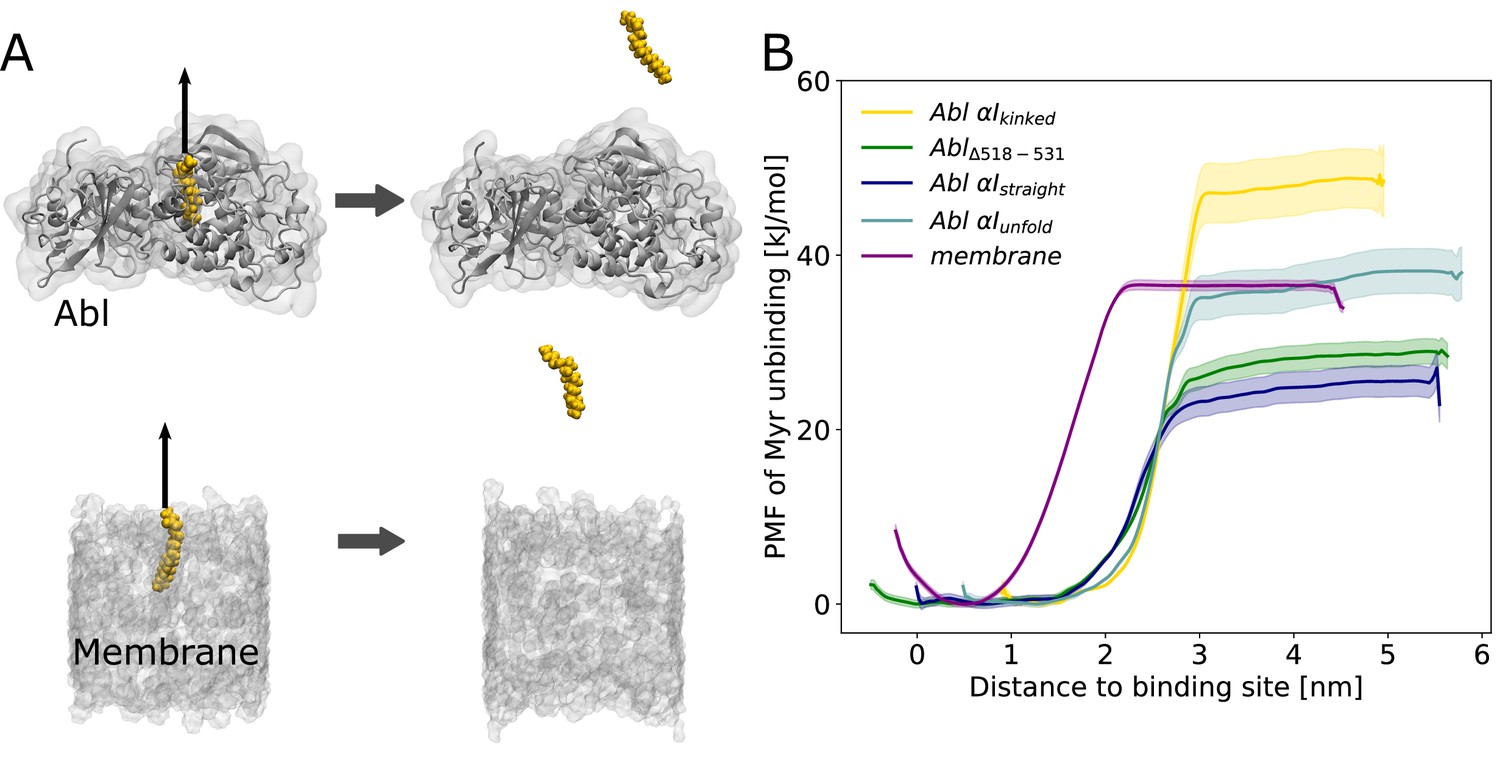
Myr binding to the membrane can compete with Myr binding to Abl.
(A) Umbrella sampling was performed after pulling Myr from its protein binding pocket or a 1-palmitoyl-2-oleoyl-glycero-3-phosphocholine (POPC) membrane. (B) Potential of mean force (PMF) profiles of Myr unbinding. For comparison, we used an Abl SH3-SH2-kinase complex with a partially unfolded or straight αI helix conformation as obtained by Metadynamics simulations, with the residues after the kink (518–531) deleted, or with the kinked conformation.
Figure 5—figure supplement 1
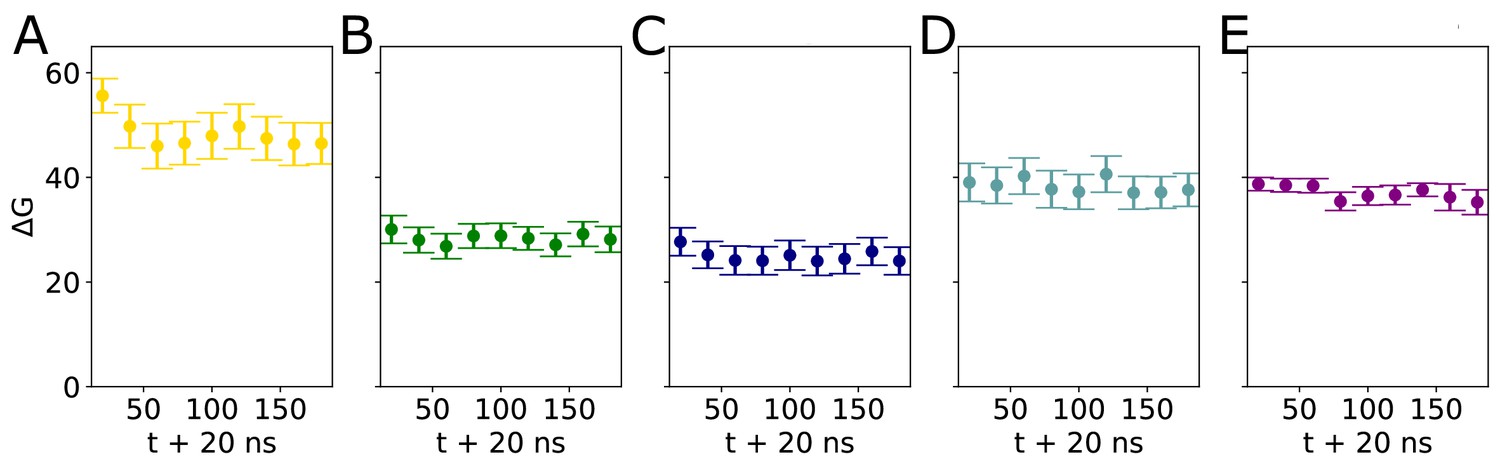
Convergence of umbrella sampling windows.
Block analysis of ΔG values determined by umbrella sampling. The sampling windows were separated into 20-ns-long blocks and a ΔG value was calculated for each block for Abl with a (A) kinked, (B) truncated, (C) straight, or (D) partially unfolded αI helix, or (E) for the membrane.
Figure 6
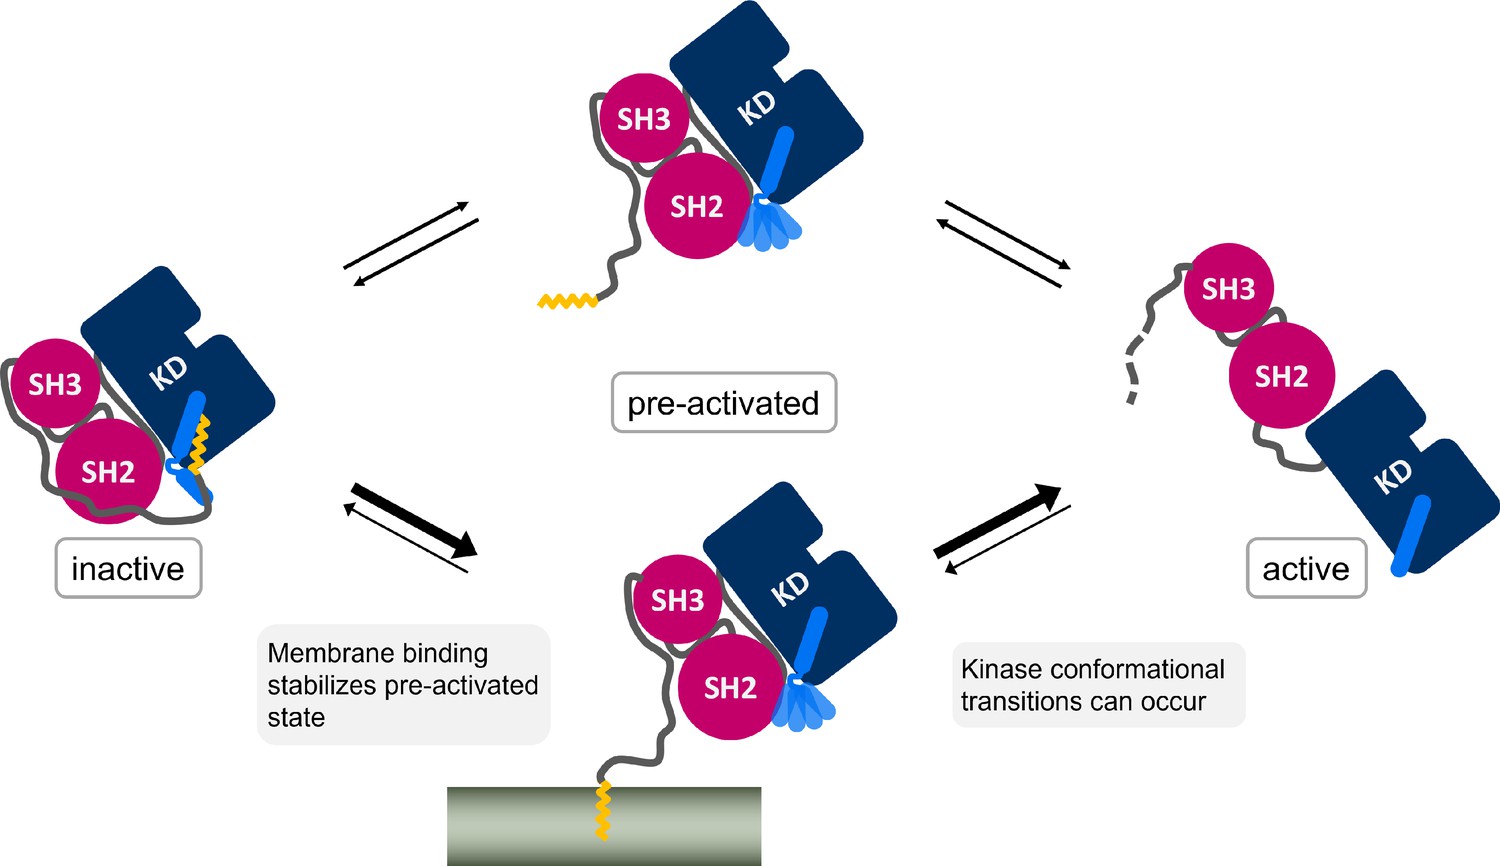
Myr, which is covalently bound to the N-terminal end of the flexible N-cap linker of Abl, leaves its protein binding pocket during the kinase activation pathway.
Membrane binding of Myr enhances Abl activation by stabilizing the preactivated state.
Tables
Table 1
ΔG values derived from umbrella sampling simulations or observed experimentally (*Peitzsch and McLaughlin, 1993, †Hantschel et al., 2003).
KD values are calculated using the Nernst equation with the assumption of an equal number of binding sites of 1 per Myr. Errors in the ΔG values were obtained by bootstrapping and propagated for KD calculation.
| ΔG (kJ/mol) | KD (µM) | |
|---|---|---|
| Membrane | 36.3 ± 0.9 | 0.5 ± 0.03 |
| MembraneExp. | 33.5* | 1.5 |
| AblExp. | 32.4 | 2.3† |
| Abl αI - kinked | 47.3 ± 3.7 | 6 ± 1 |
| Abl Δ518 - 531 | 28.3 ± 1.9 | 11.9 ± 2.1 |
| Abl αI - straight | 24.9 ± 2.3 | 45.9 ± 11.3 |
| Abl αI - unfold | 37.8 ± 2.9 | 0.3 ± 5 |
Additional files
Download links
A two-part list of links to download the article, or parts of the article, in various formats.
Downloads (link to download the article as PDF)
Open citations (links to open the citations from this article in various online reference manager services)
Cite this article (links to download the citations from this article in formats compatible with various reference manager tools)
Myristoyl’s dual role in allosterically regulating and localizing Abl kinase
eLife 12:e85216.
https://doi.org/10.7554/eLife.85216


