The nutrient-sensing GCN2 signaling pathway is essential for circadian clock function by regulating histone acetylation under amino acid starvation
- State Key Laboratory of Mycology, Institute of Microbiology, Chinese Academy of Sciences, China
- College of Life Sciences, University of the Chinese Academy of Sciences, China
- School of Life Sciences, Yunnan University, Kunming, China
- Key Laboratory of Gene Engineering of the Ministry of Education, State Key Laboratory of Biocontrol, School of Life Sciences, Sun Yat-sen University, China
- MOA Key Laboratory of Soil Microbiology, College of Biological Sciences, China Agricultural University, China
- Department of Physiology, University of Texas Southwestern Medical Center, United States
Figures
Figure 1 with 2 supplements

CPC-3 and CPC-1 are required for circadian rhythm by regulating rhythmic frq transcription in response to amino acid starvation.
(A) Race tube assay showing that amino acid starvation (3-aminotriazole [3-AT] treatment) disrupted circadian conidiation rhythm of the cpc-3KO and cpc-1KO strains. 0 mM 3-AT is the normal growth condition. (B) Luciferase reporter assay showing that amino acid starvation disrupted rhythmic expression of frq promoter-driven luciferase of the cpc-3KO and cpc-1KO strains. A frq-luc transcriptional fusion construct was expressed in cpc-3KO and cpc-1KO strains grown on the fructose-glucose-sucrose FGS-Vogel’s medium with the indicated concentrations of 3-AT, and the luciferase signal was recorded using a LumiCycle in constant darkness (DD) for more than 7 days. Normalized data with the baseline luciferase signals subtracted are shown. (C) Western blot showing that amino acid starvation dampened rhythmic expression of FRQ protein of the cpc-3KO and cpc-1KO strains at the indicated time points in DD (n = 3; WT: p = 5.00E−08, cpc-3KO: p = 0.0016, cpc-1KO: p = 0.0004, RAIN; WT vs cpc-3KO: mesor p = 0.1421, amplitude p = 0.0774, phase p = 0.4319; WT vs cpc-1KO: mesor p = 0.0614, amplitude p = 0.1920, phase p = 0.4404, CircaCompare). The left panel showing that protein extracts were isolated from WT, cpc-3KO, and cpc-1KO strains grown in a circadian time course in DD and probed with FRQ antibody. The right panel showing that the densitometric analyses of the results of three independent experiments. (D) Northern blot showing that amino acid starvation dampened rhythmic expression of frq mRNA of the cpc-3KO and cpc-1KO strains at the indicated time points in DD (n = 3; WT: p = 6.56E−05, cpc-3KO: p = 0.0039, cpc-1KO: p > 0.05, RAIN; WT vs cpc-3KO: mesor p = 0.1153, amplitude p = 0.4316, phase p = 0.0788, CircaCompare). The densitometric analyses of the results from three independent experiments were shown on the right panel. Error bars indicate standard deviation (n = 3). *p < 0.05; **p < 0.01; ***p < 0.001; Student’s t test was used.
-
Figure 1—source data 1
LumiCycle analysis dataset in Figure 1B.
- https://cdn.elifesciences.org/articles/85241/elife-85241-fig1-data1-v2.zip
-
Figure 1—source data 2
Scan of western blot probed for FRQ protein and quantification dataset in Figure 1C.
- https://cdn.elifesciences.org/articles/85241/elife-85241-fig1-data2-v2.zip
-
Figure 1—source data 3
Scan of Northern blot probed for frq mRNA and quantification dataset in Figure 1D.
- https://cdn.elifesciences.org/articles/85241/elife-85241-fig1-data3-v2.zip
Figure 1—figure supplement 1
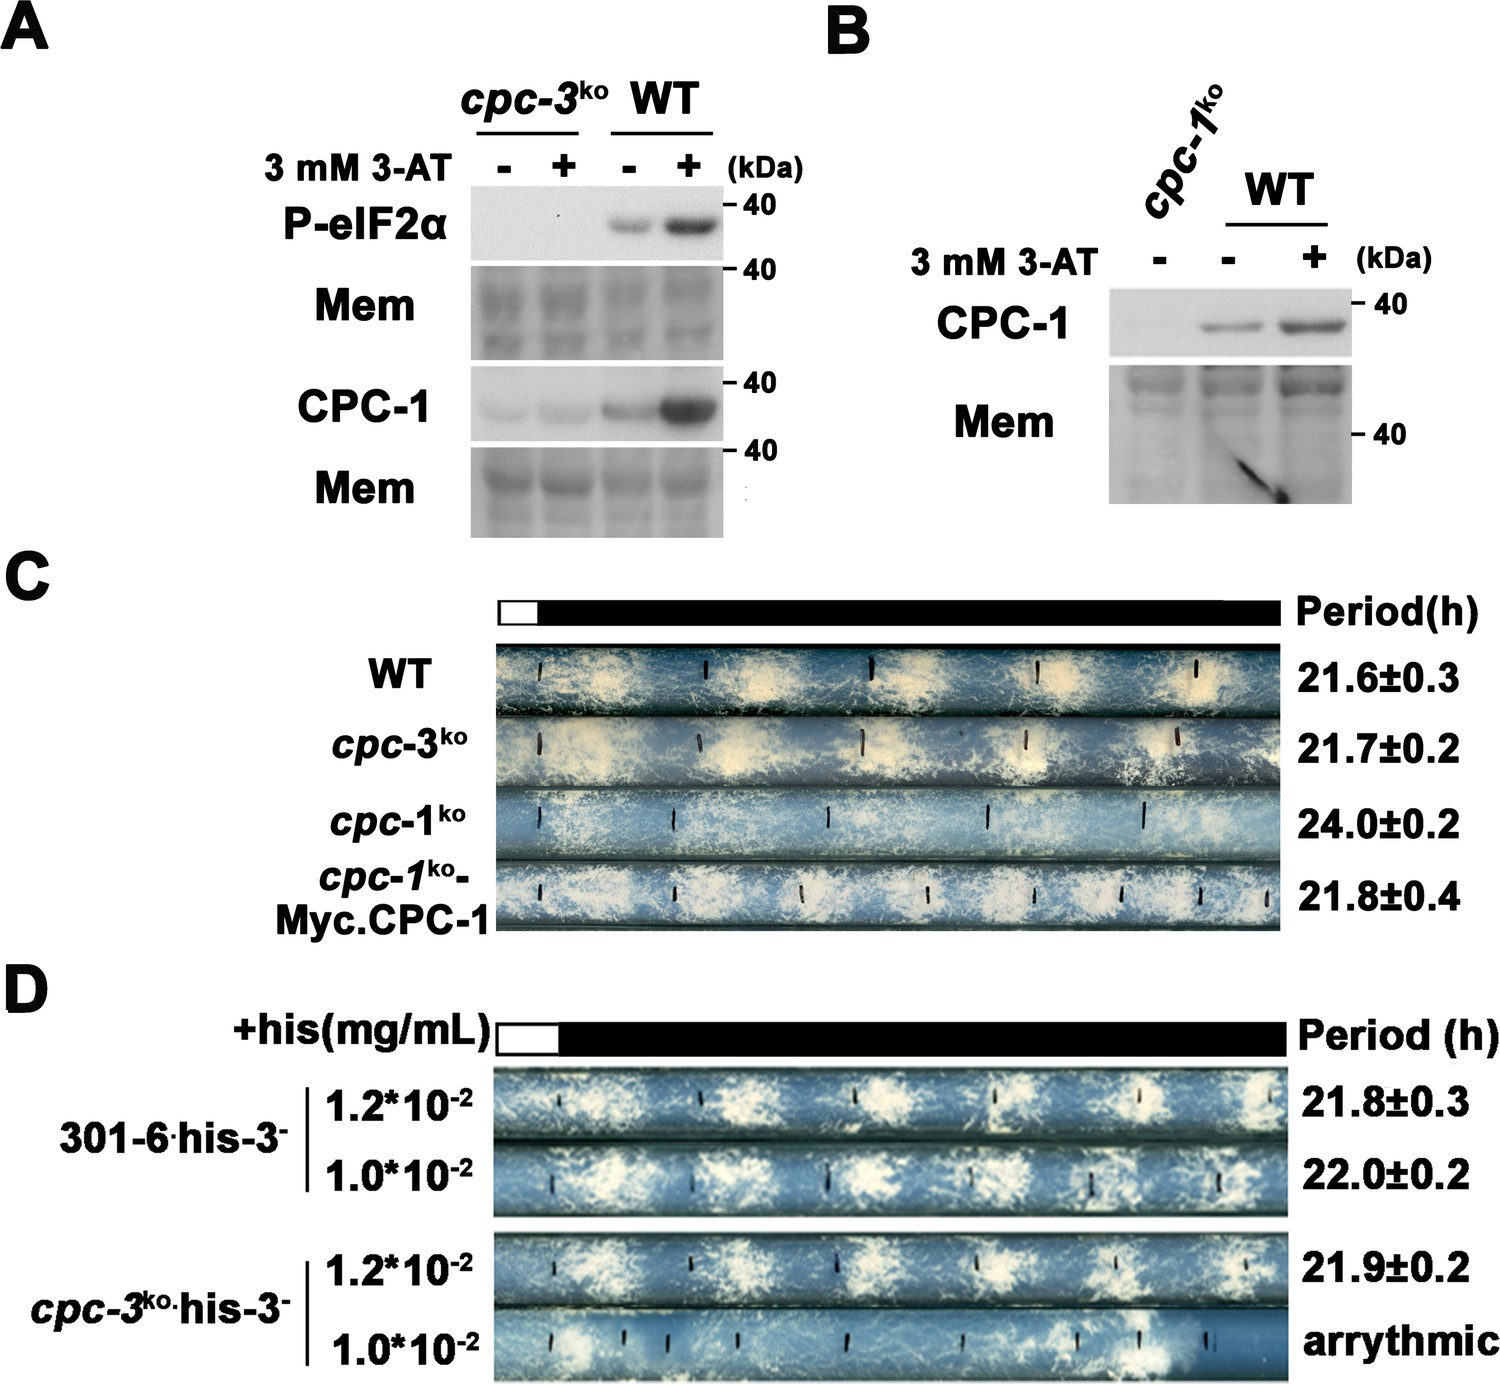
CPC-3 and CPC-1 are activated and required for robust circadian conidiation rhythm under histidine starvation.
(A) eIF2α was phosphorylated and CPC-1 was activated in WT but not cpc-3KO strain in the presence of 3 mM 3-aminotriazole (3-AT). Western blot of proteins from WT and cpc-3KO strains treated (+) or not (−) with 3-AT using P-eIF2α and CPC-1 antibodies. Mem: stained membrane (loading control). (B) CPC-1 was activated in the presence of 3 mM 3-AT. Western blot of proteins from WT and cpc-1KO strains harvested in the indicated hours after 3-AT treatment using CPC-1 antibody. Mem: stained membrane. (C) Race tube assay showing that expression of Myc-CPC-1 rescued the prolonged circadian period of cpc-1KO strain. (D) Race tube assay showed that the his-3− strain could grow with 1.0 × 10⁻² mg/ml histidine, and exhibited normal circadian conidiation rhythm, however, the cpc-3KO his-3− strains lost circadian conidiation rhythm with limited histidine at the concentration of 1.0 × 10⁻² mg/ml.
-
Figure 1—figure supplement 1—source data 1
Scan of western blot probed for eIF2α protein phosphorylation and CPC-1 protein in Figure 1—figure supplement 1A.
- https://cdn.elifesciences.org/articles/85241/elife-85241-fig1-figsupp1-data1-v2.zip
-
Figure 1—figure supplement 1—source data 2
Scan of western blot probed for CPC-1 protein in Figure 1—figure supplement 1B.
- https://cdn.elifesciences.org/articles/85241/elife-85241-fig1-figsupp1-data2-v2.zip
Figure 1—figure supplement 2
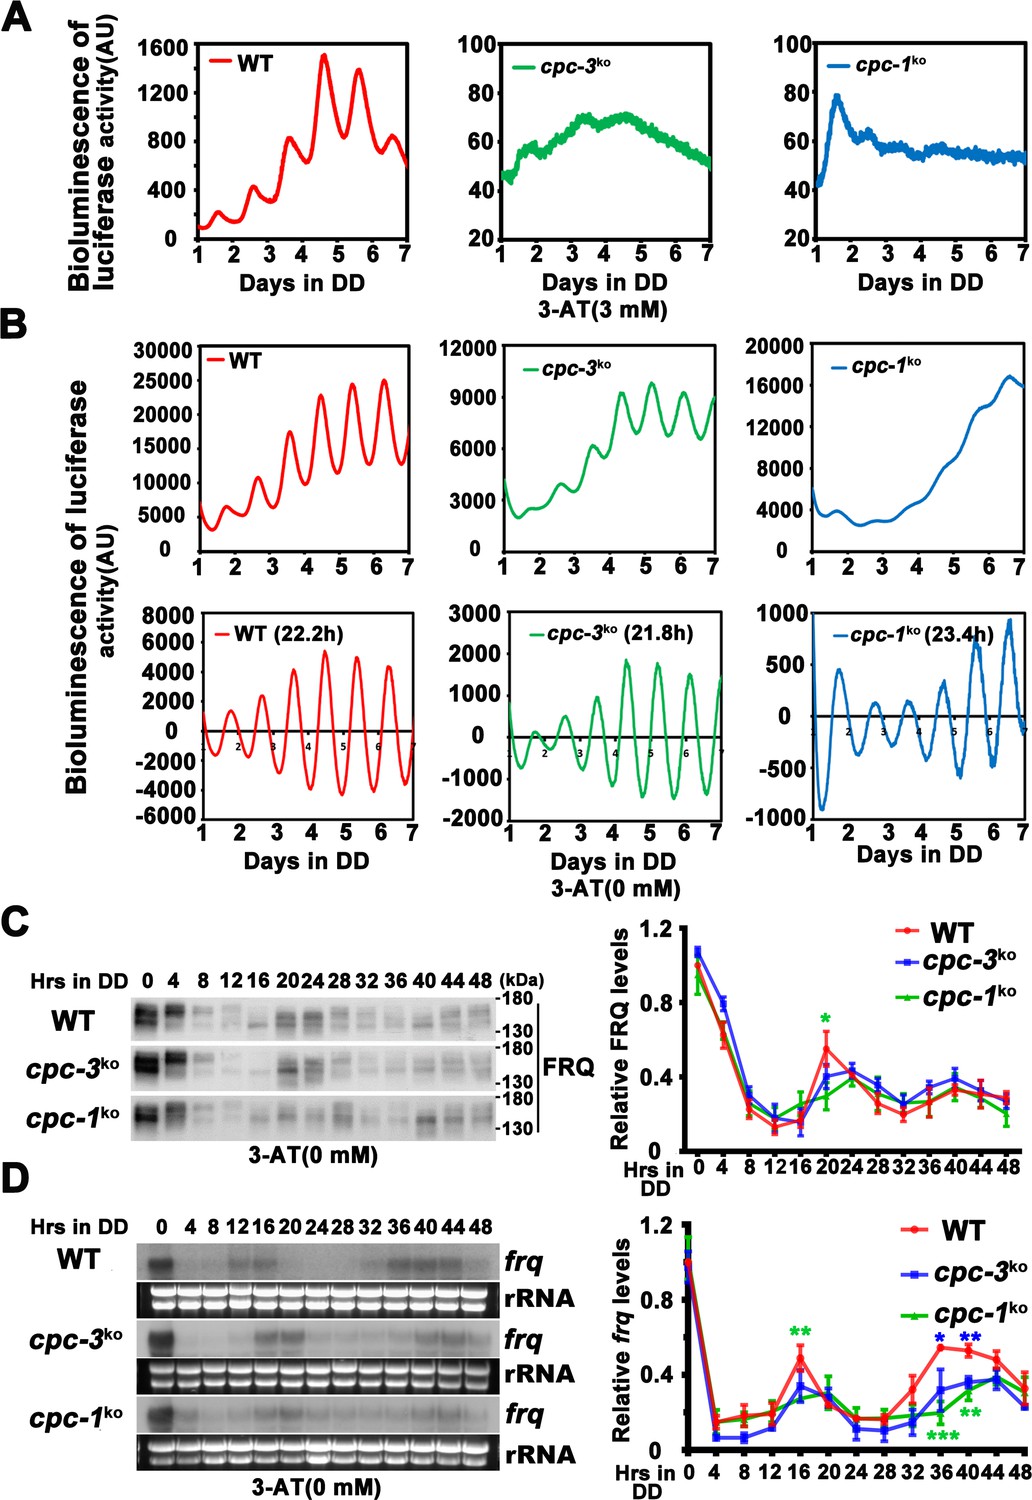
Rhythmic frq expression of cpc-3KO and cpc-1KO strain.
(A) Luciferase reporter assay showing loss of circadian rhythm in the cpc-3KO and cpc-1KO strain with 3-aminotriazole (3-AT; raw data are shown). (B) Luciferase reporter assay showing normal circadian period of cpc-3KO strain and prolonged circadian period of cpc-1KO strain without 3-AT. Raw data (up panels) and normalized data (down panels) with the baseline luciferase signals subtracted are shown. A frq-luc transcriptional fusion construct was expressed in cpc-3KO and cpc-1KO strains grown on the FGS-Vogel’s medium, and the luciferase signal was recorded using a LumiCycle in constant darkness (DD) for more than 7 days. (C) Western blot assay showing the rhythmic expression of FRQ protein in the cpc-3KO and cpc-1KO strains at the indicated time points in DD (n = 3; WT: p = 4.49E−05, cpc-3KO: p = 0.0003, cpc-1KO: p = 0.0017, RAIN; WT vs cpc-3KO: mesor p = 0.3923, amplitude p = 0.9627, phase p = 0.3164; WT vs cpc-1KO: mesor p = 0.8562, amplitude p = 0.3505, phase p = 0.2841, CircaCompare). The left panel showing that protein extracts were isolated from WT, cpc-3KO, and cpc-1KO strains grown in a circadian time course in DD and probed with FRQ antibody. The right panel showing that the densitometric analyses of the results of three independent experiments. (D) Northern blot assay showing the rhythmic expression of frq mRNA in the cpc-3KO and cpc-1KO strains at the indicated time points in DD (n = 3; WT: p = 0.0153, cpc-3KO: p = 0.0026, cpc-1KO: p = 0.0031, RAIN; WT vs cpc-3KO: mesor p = 0.0416, amplitude p = 0.7082, phase p = 0.4328; WT vs cpc-1KO: mesor p = 0.1113, amplitude p = 0.8360, phase p = 0.1145, CircaCompare). The densitometric analyses of the results from three independent experiments are shown on the right panel. Error bars indicate standard deviations (n = 3). *p < 0.05; **p < 0.01; ***p < 0.001; Student’s t test was used.
-
Figure 1—figure supplement 2—source data 1
LumiCycle analysis dataset in Figure 1—figure supplement 2A.
- https://cdn.elifesciences.org/articles/85241/elife-85241-fig1-figsupp2-data1-v2.zip
-
Figure 1—figure supplement 2—source data 2
LumiCycle analysis dataset in Figure 1—figure supplement 2B.
- https://cdn.elifesciences.org/articles/85241/elife-85241-fig1-figsupp2-data2-v2.zip
-
Figure 1—figure supplement 2—source data 3
Scan of western blot probed for FRQ protein and quantification dataset in Figure 1—figure supplement 2C.
- https://cdn.elifesciences.org/articles/85241/elife-85241-fig1-figsupp2-data3-v2.zip
-
Figure 1—figure supplement 2—source data 4
Scan of Northern blot probed for frq mRNA and quantification dataset in Figure 1—figure supplement 2D.
- https://cdn.elifesciences.org/articles/85241/elife-85241-fig1-figsupp2-data4-v2.zip
Figure 2 with 1 supplement
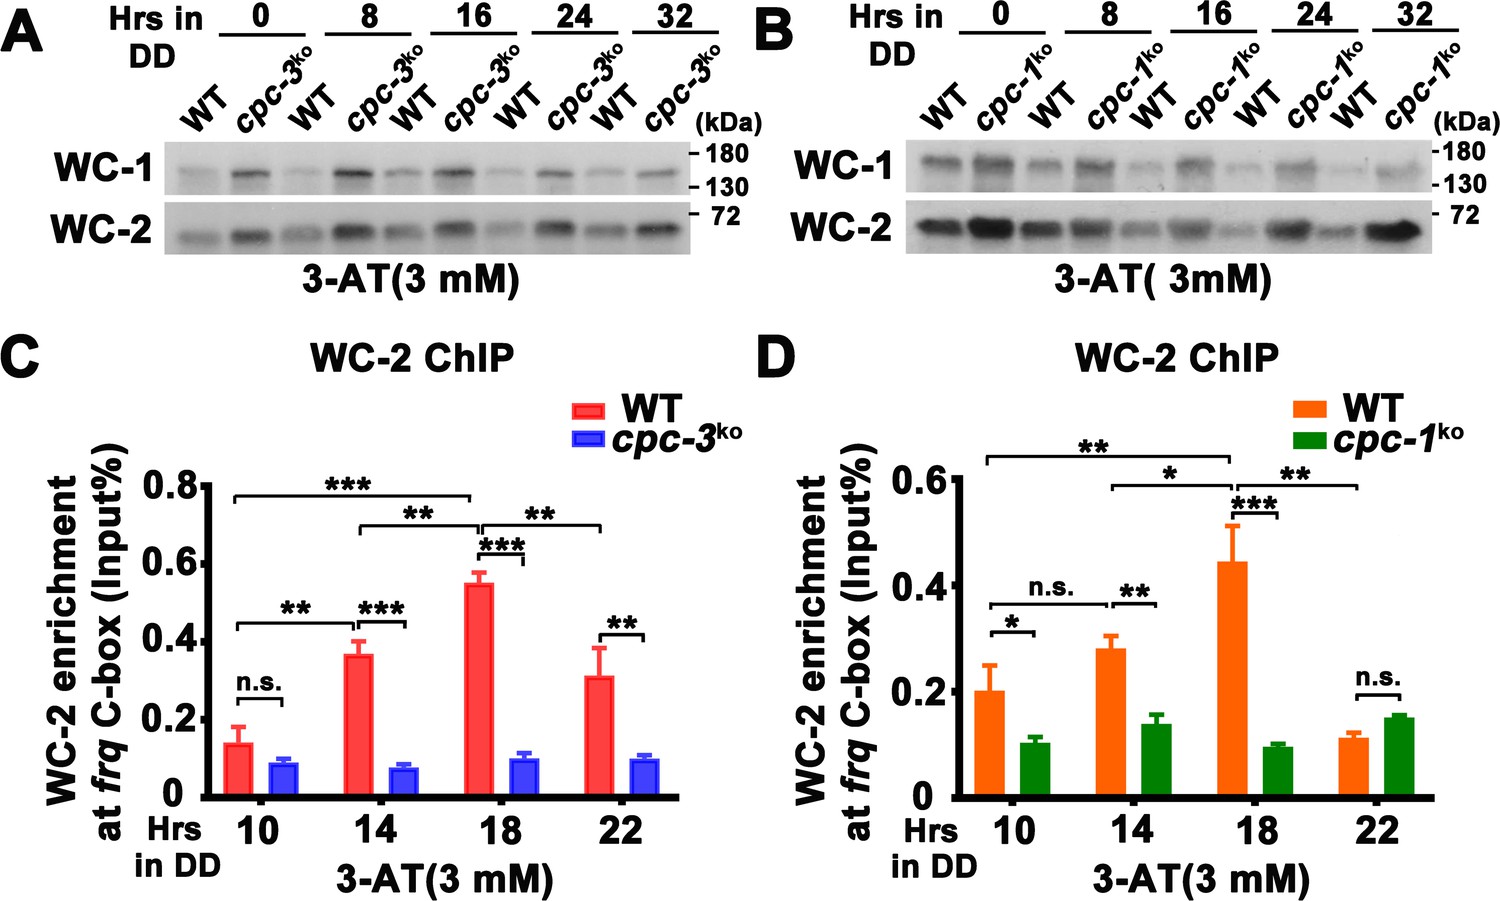
CPC-3 and CPC-1 are required for rhythmic WCC binding in response to amino acid starvation.
Western blot assay showing that WCC protein levels were elevated in the cpc-3KO (A) and cpc-1KO (B) strains after 3 mM 3-aminotriazole (3-AT) treatment. Protein extracts were isolated from WT, cpc-3KO, and cpc-1KO strains grown in the indicated time points in DD and probed with WC-1 and WC-2 antibodies. Chromatin immunoprecipitation (ChIP) assay showing that amino acid starvation disrupted rhythmic WC-2 binding at the promoter of frq gene in the cpc-3KO (n = 3; WT: p = 1.84E−05, cpc-3KO: p > 0.05) (C) or cpc-1KO strains (n = 3; WT: p = 0.0025, cpc-1KO: p > 0.05) (D). Samples were grown for the indicated number of hours in DD prior to harvesting and processing for ChIP using WC-2 antibody. Occupancies were normalized by the ratio of ChIP to Input DNA. Error bars indicate standard deviation (n = 3). *p < 0.05; **p < 0.01; ***p < 0.001; Student’s t test was used.
-
Figure 2—source data 1
Scan of western blot probed for WC-1 and WC-2 proteins in WT and cpc-3KO strains with 3-aminotriazole (3-AT) in Figure 2A.
- https://cdn.elifesciences.org/articles/85241/elife-85241-fig2-data1-v2.zip
-
Figure 2—source data 2
Scan of western blot probed for WC-1 and WC-2 proteins in WT and cpc-1KO strains with 3-aminotriazole (3-AT) in Figure 2B.
- https://cdn.elifesciences.org/articles/85241/elife-85241-fig2-data2-v2.zip
-
Figure 2—source data 3
Chromatin immunoprecipitation (ChIP) analysis dataset in Figure 2C.
- https://cdn.elifesciences.org/articles/85241/elife-85241-fig2-data3-v2.zip
-
Figure 2—source data 4
Chromatin immunoprecipitation (ChIP) analysis dataset in Figure 2D.
- https://cdn.elifesciences.org/articles/85241/elife-85241-fig2-data4-v2.zip
Figure 2—figure supplement 1
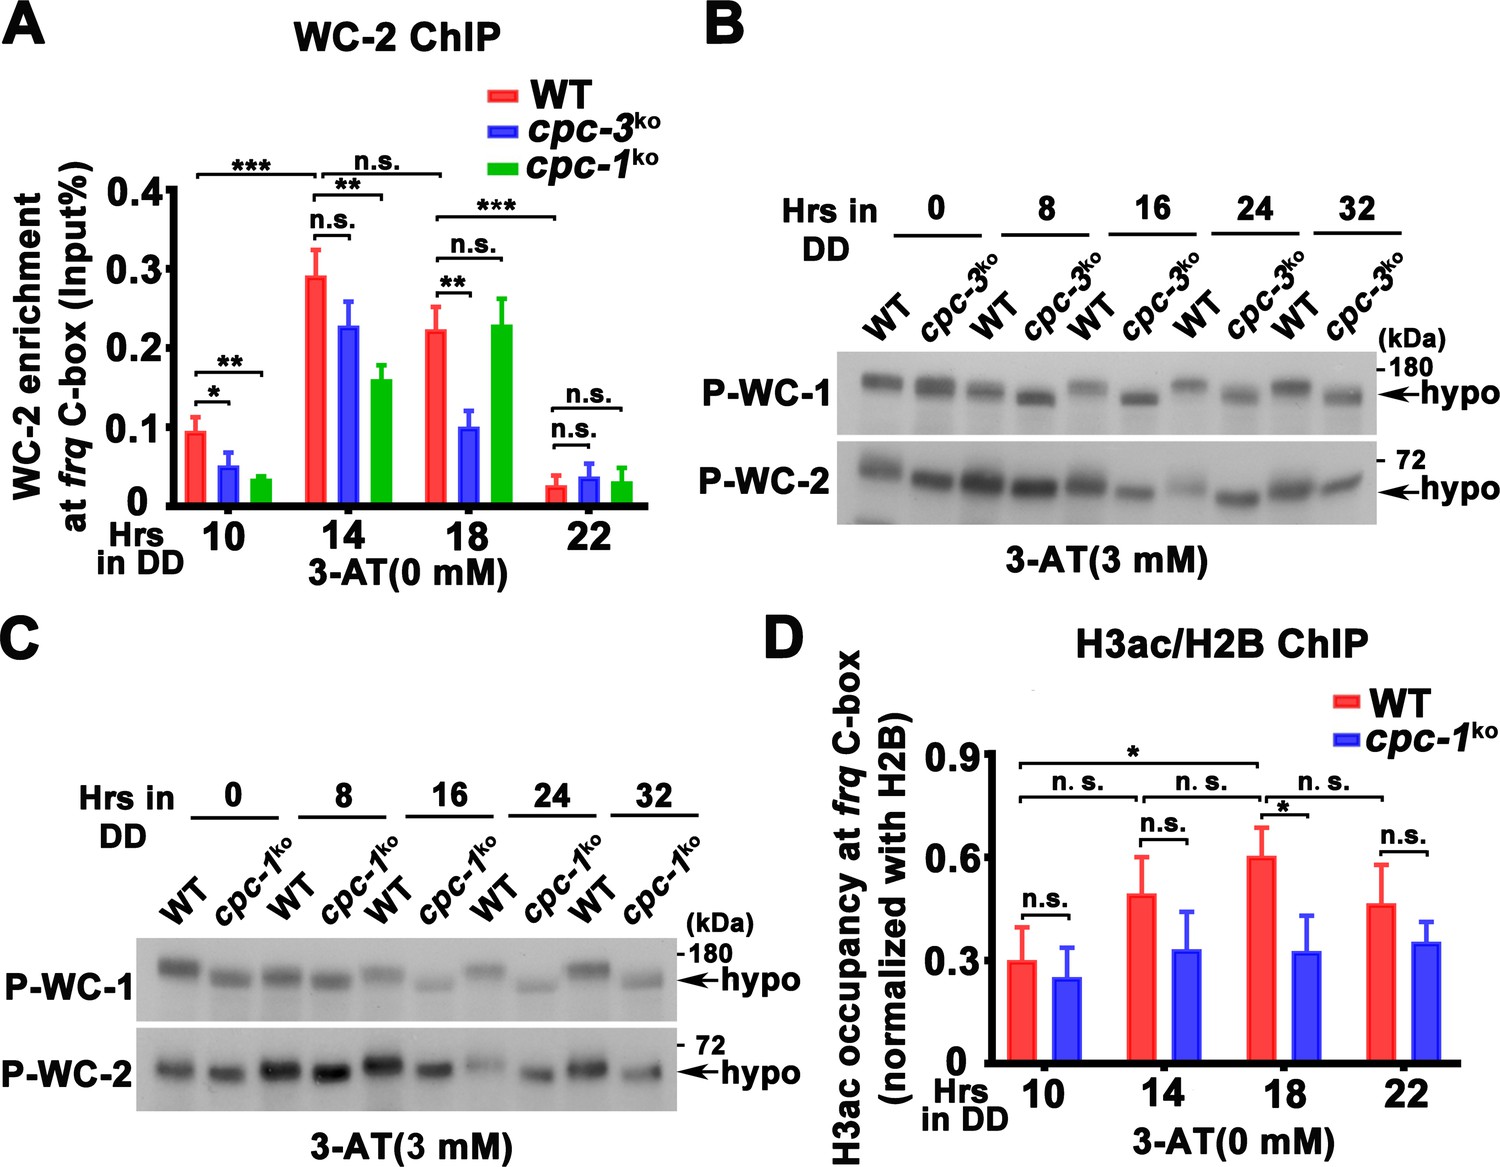
WCC binding at the frq promoter and WCC phosphorylation levels in the cpc-3KO and cpc-1KO strain.
(A) Chromatin immunoprecipitation (ChIP) assay showing that deletion of cpc-3 or cpc-1 did not dramatically affect WC-2 binding at the promoter of frq gene without 3-aminotriazole (3-AT; n = 3; WT: p = 2.60E−07, cpc-3KO: p = 0.0016, cpc-1KO: p = 1.06E−05, RAIN; WT vs cpc-3KO: mesor p = 0.4797, amplitude p = 0.0238, phase p = 0.7395; WT vs cpc-1KO: mesor p = 0.1151, amplitude p = 0.1311, phase p = 0.0039, CircaCompare). Samples were grown for the indicated number of hours in DD prior to harvesting and processing for ChIP using WC-2 antibody. Occupancies were normalized by the ratio of ChIP to Input DNA. Error bars indicate standard deviation (n = 3). *p < 0.05; **p < 0.01; ***p < 0.001; Student’s t test was used. Western blot assay showing that WCC was hypophosphorylated in the cpc-3KO (B) and cpc-1KO (C) strains in the presence of 3 mM 3-AT. Proteins were extracted by protein extraction buffer with PPase inhibitors and loaded in each protein lane of 7.5% sodium dodecyl sulfate–polyacrylamide gel electrophoresis (SDS–PAGE) gels containing a ratio of 149:1 acrylamide/bisacrylamide. The faster mobility shift indicated hypophosphorylation levels of WC-1 and WC-2. (D) ChIP assay showing slightly decreased histone H3ac levels at the promoter of frq gene in the cpc-1KO strain without 3-AT at the indicated time points in DD (n = 3; WT: p = 0.0025, cpc-1KO: p > 0.05). Error bars indicate standard deviations (n = 3). *p < 0.05; Student’s t test was used.
-
Figure 2—figure supplement 1—source data 1
Chromatin immunoprecipitation (ChIP) analysis dataset in Figure 2—figure supplement 1A.
- https://cdn.elifesciences.org/articles/85241/elife-85241-fig2-figsupp1-data1-v2.zip
-
Figure 2—figure supplement 1—source data 2
Scan of western blot probed for phosphorylation of WC-1 and WC-2 proteins in WT and cpc-3KO strains with 3-aminotriazole (3-AT) in Figure 2—figure supplement 1B.
- https://cdn.elifesciences.org/articles/85241/elife-85241-fig2-figsupp1-data2-v2.zip
-
Figure 2—figure supplement 1—source data 3
Scan of western blot probed for phosphorylation of WC-1 and WC-2 proteins in WT and cpc-1KO strains with 3-aminotriazole (3-AT) in Figure 2—figure supplement 1C.
- https://cdn.elifesciences.org/articles/85241/elife-85241-fig2-figsupp1-data3-v2.zip
-
Figure 2—figure supplement 1—source data 4
Chromatin immunoprecipitation (ChIP) analysis dataset in Figure 2—figure supplement 1D.
- https://cdn.elifesciences.org/articles/85241/elife-85241-fig2-figsupp1-data4-v2.zip
Figure 3
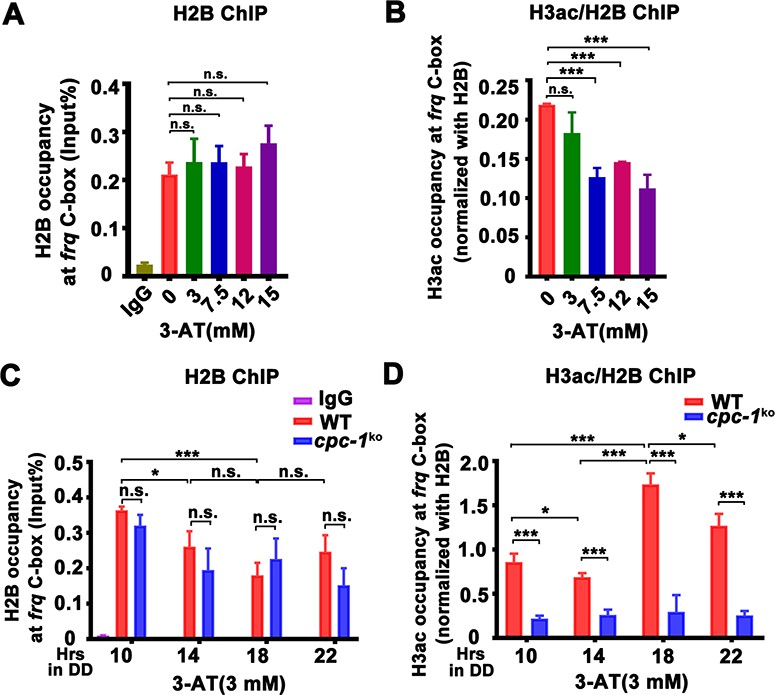
CPC-1 is required for the maintenance of chromatin structure in response to amino acid starvation.
Chromatin immunoprecipitation (ChIP) assay showing that amino acid starvation slightly increased histone H2B levels (A) and dramatically decreased histone H3ac levels (B) at the promoter of frq gene in the WT strain at DD18 at the indicated concentration of 3-aminotriazole (3-AT). Relative H3ac levels were normalized with H2B levels. (C, D) ChIP assay showing that amino acid starvation slightly increased histone H2B levels (n = 3; WT: p = 3.85E−04, cpc-1KO: p = 0.0364, RAIN; WT vs cpc-1KO: mesor p = 0.0312, amplitude p = 0.2155, phase p = 0.2995, CircaCompare) (C) and dramatically decreased histone H3ac levels (n = 3; WT: p = 0.0168, cpc-1KO: p > 0.05) (D) at the promoter of frq gene in the cpc-1KO strain at the indicated time points in DD. Error bars indicate standard deviations (n = 3). *p < 0.05; ***p < 0.001; Student’s t test was used.
-
Figure 3—source data 1
Chromatin immunoprecipitation (ChIP) analysis dataset in Figure 3A.
- https://cdn.elifesciences.org/articles/85241/elife-85241-fig3-data1-v2.zip
-
Figure 3—source data 2
Chromatin immunoprecipitation (ChIP) analysis dataset in Figure 3B.
- https://cdn.elifesciences.org/articles/85241/elife-85241-fig3-data2-v2.zip
-
Figure 3—source data 3
Chromatin immunoprecipitation (ChIP) analysis dataset in Figure 3C.
- https://cdn.elifesciences.org/articles/85241/elife-85241-fig3-data3-v2.zip
-
Figure 3—source data 4
Chromatin immunoprecipitation (ChIP) analysis dataset in Figure 3D.
- https://cdn.elifesciences.org/articles/85241/elife-85241-fig3-data4-v2.zip
Figure 4 with 1 supplement
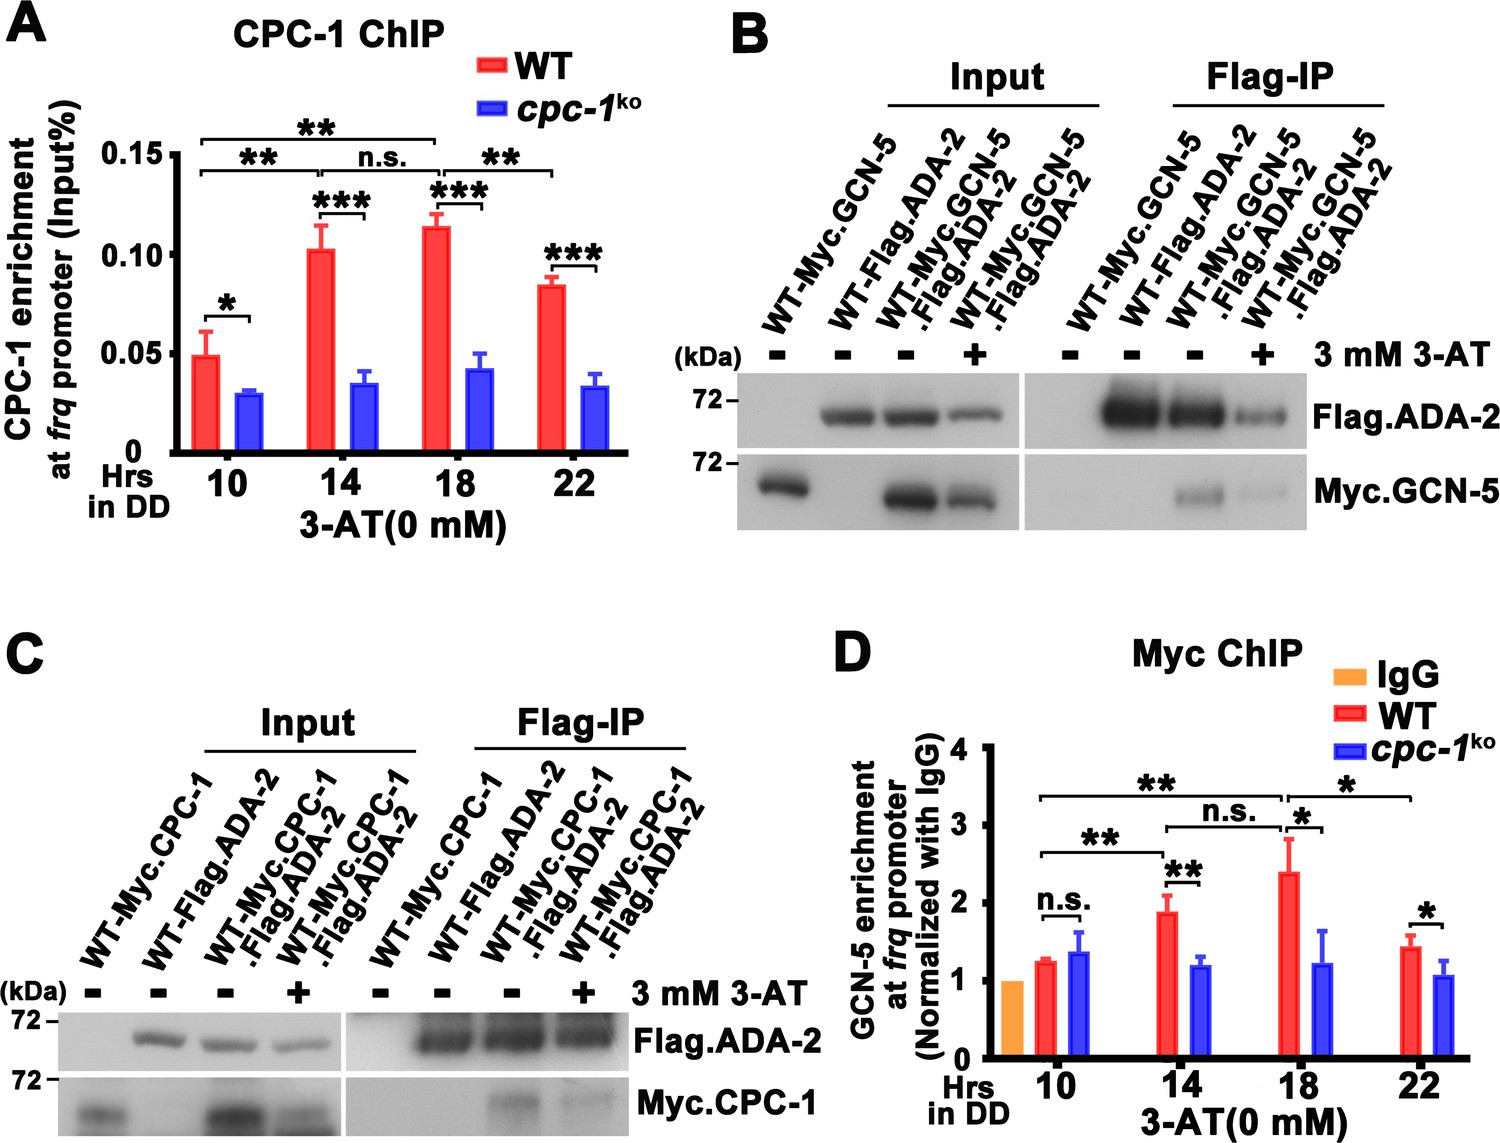
CPC-1 recruits GCN-5 to activate frq transcription in response to amino acid starvation.
(A) Chromatin immunoprecipitation (ChIP) assay showing that CPC-1 rhythmically bound at the promoter of frq gene (n = 3; WT: p = 8.37E−06, cpc-1KO: p > 0.05). WT and cpc-1KO strains grown for the indicated number of hours in DD. Samples were crosslinked with formaldehyde and harvested for ChIP using CPC-1 antibody. CPC-1 ChIP occupancies were normalized by the ratio of ChIP to Input DNA. (B) Co-immunoprecipitation (Co-IP) assay showing that Flag.ADA-2 interacted with Myc.GCN-5 with or without 3 mM 3-aminotriazole (3-AT). Flag.ADA-2 and Myc.GCN-5 were co-expressed in the WT strain and immunoprecipitation was performed using Flag antibody. (C) Co-IP assay showing that Flag.ADA-2 interacted with Myc.CPC-1 with or without 3 mM 3-AT. Flag.ADA-2 and Myc.CPC-1 were co-expressed in the WT strain and immunoprecipitation was performed using Flag antibody. (D) ChIP assay showing that rhythmic GCN-5 binding at the promoter of frq gene was dampened in the cpc-1KO strain (n = 3; WT: p = 0.0006, cpc-1KO: p > 0.05). Samples were grown for the indicated number of hours in DD prior to harvesting and processing for ChIP as described in (A). Error bars indicate standard deviations (n = 3). *p < 0.05; **p < 0.01; ***p < 0.001; Student’s t test was used.
-
Figure 4—source data 1
Chromatin immunoprecipitation (ChIP) analysis dataset in Figure 4A.
- https://cdn.elifesciences.org/articles/85241/elife-85241-fig4-data1-v2.zip
-
Figure 4—source data 2
Scan of western blot probed for Flag.ADA-2 and Myc.GCN-5 proteins in Figure 4B.
- https://cdn.elifesciences.org/articles/85241/elife-85241-fig4-data2-v2.zip
-
Figure 4—source data 3
Scan of western blot probed for Flag.ADA-2 and Myc.CPC-1 proteins in Figure 4C.
- https://cdn.elifesciences.org/articles/85241/elife-85241-fig4-data3-v2.zip
-
Figure 4—source data 4
Chromatin immunoprecipitation (ChIP) analysis dataset in Figure 4D.
- https://cdn.elifesciences.org/articles/85241/elife-85241-fig4-data4-v2.zip
Figure 4—figure supplement 1
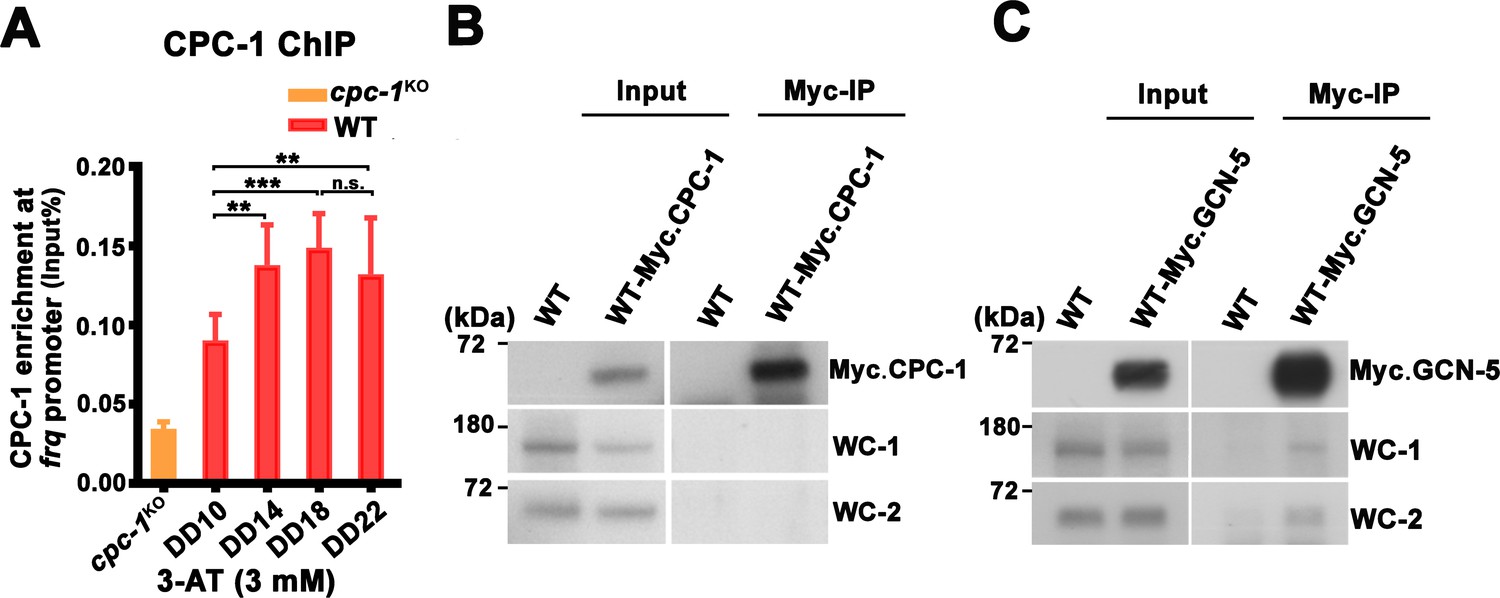
CPC-1 rhythmically binds at the frq promoter and GCN-5 interacts with WCC.
(A) Chromatin immunoprecipitation (ChIP) assay showing that CPC-1 rhythmically bound at the promoter of frq gene with 3 mM 3-aminotriazole (3-AT) (n = 3; WT: p = 7.64E−05). WT and cpc-1KO strains grown with 3 mM 3-AT for the indicated number of hours in DD. Samples were crosslinked with formaldehyde and harvested for ChIP using CPC-1 antibody. CPC-1 ChIP occupancies were normalized by the ratio of ChIP to Input DNA. Error bars indicate standard deviation (n = 3). **p < 0.01; ***p < 0.001; Student’s t test was used. (B) IP assay showing that CPC-1 did not interact with WCC. Myc-CPC-1 was expressed in the WT strain and immunoprecipitation was performed using Myc antibody. (C) Co-immunoprecipitation (Co-IP) assay showing that GCN-5 interacted with WC-1 and WC-2. Myc-GCN-5 was expressed in the WT strain and immunoprecipitation was performed using Myc antibody.
-
Figure 4—figure supplement 1—source data 1
Chromatin immunoprecipitation (ChIP) analysis dataset in Figure 4—figure supplement 1A.
- https://cdn.elifesciences.org/articles/85241/elife-85241-fig4-figsupp1-data1-v2.zip
-
Figure 4—figure supplement 1—source data 2
Scan of western blot probed for Myc.CPC-1, WC-1, and WC-2 proteins in Figure 4—figure supplement 1B.
- https://cdn.elifesciences.org/articles/85241/elife-85241-fig4-figsupp1-data2-v2.zip
-
Figure 4—figure supplement 1—source data 3
Scan of western blot probed for Myc.GCN-5, WC-1, and WC-2 proteins in Figure 4—figure supplement 1C.
- https://cdn.elifesciences.org/articles/85241/elife-85241-fig4-figsupp1-data3-v2.zip
Figure 5 with 1 supplement
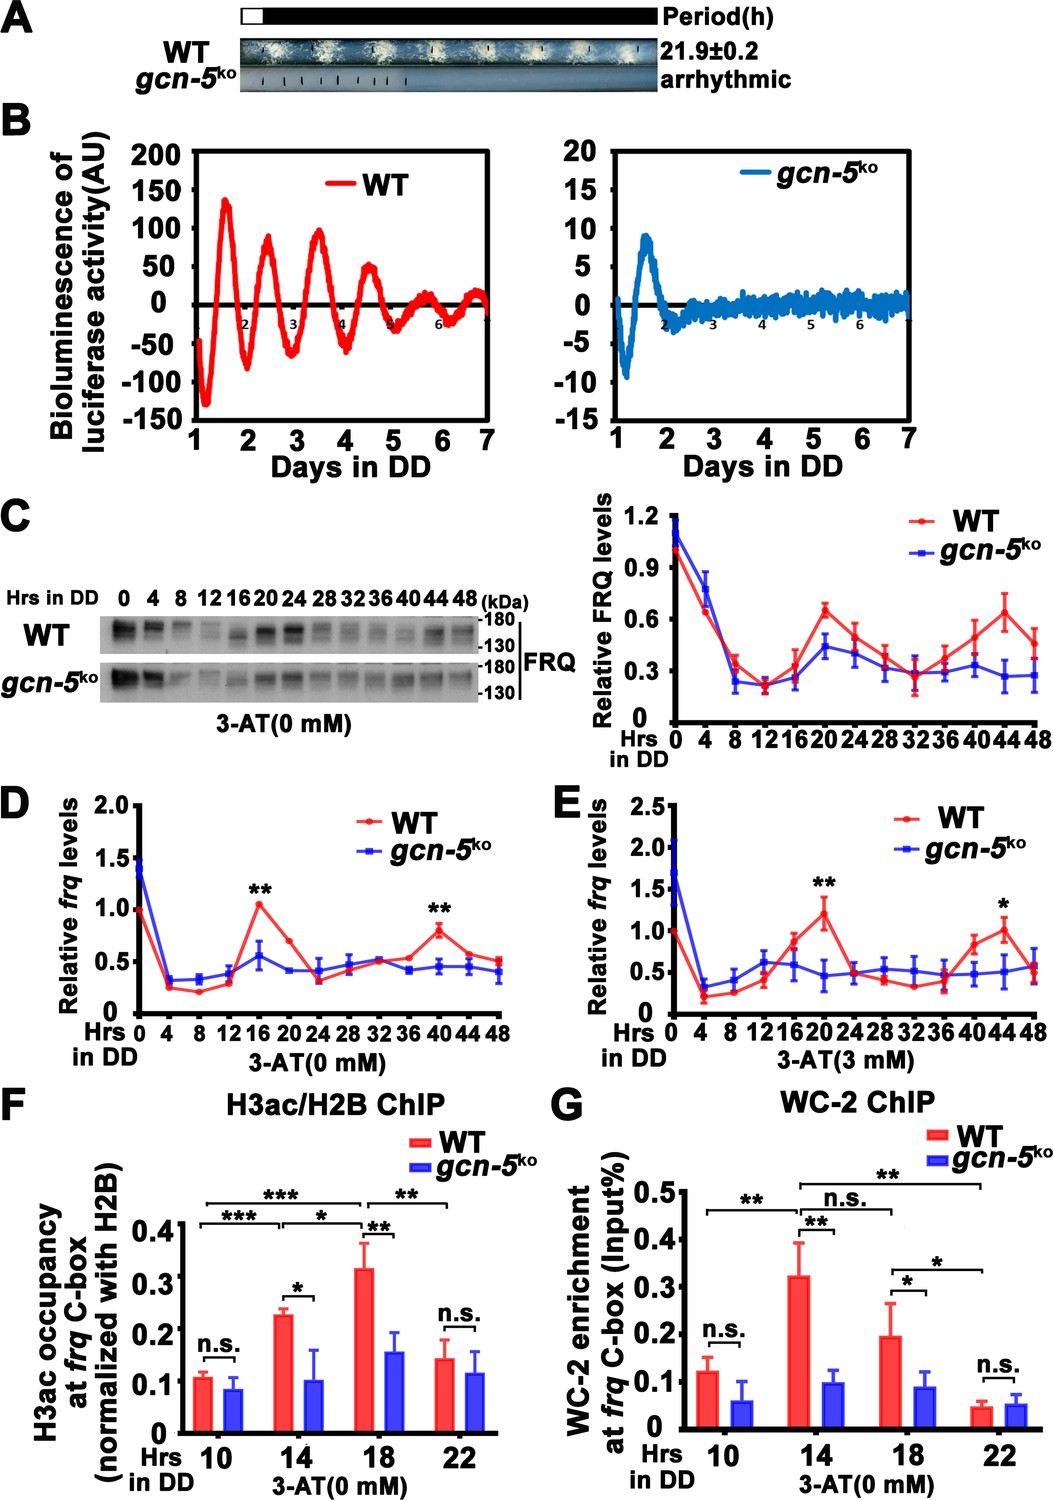
GCN-5 is required for rhythmic chromatin structure changes at the frq promoter.
(A) Race tube assay showing that the conidiation rhythm in gcn-5KO strain was lost compared with WT strain. (B) Luciferase assay showing that the luciferase activity rhythm was impaired in the gcn-5KO strain after 1 day transition from light to dark. A FRQ-LUC translational fusion construct was expressed in WT and gcn-5KO strains, and the luciferase signal was recorded in DD for more than 7 days. Normalized data with the baseline luciferase signals subtracted are shown. (C) Western blot assay showing that rhythmic expression of FRQ protein was dampened in the gcn-5KO strain (n = 3; WT: p = 5.00E−08, gcn-5KO: p = 0.0016, RAIN; WT vs gcn-5KO: mesor p = 0.1421, amplitude p = 0.0774, phase p = 0.4319, CircaCompare). RT-qPCR analysis showing that rhythmic expression of frq mRNA was dampened in the gcn-5KO strain without 3-aminotriazole (3-AT; n = 3; WT: p = 8.37E−06, gcn-5KO: p > 0.05) (D) or with 3-AT (n = 3; WT: p = 5.39E−12, gcn-5KO: p > 0.05) (E). (F) Chromatin immunoprecipitation (ChIP) assay showing decreased histone H3ac levels at the promoter of frq gene in the gcn-5KO strain at the indicated time points in DD (n = 3; WT: p = 8.10E−05, gcn-5KO: p > 0.05). Relative H3ac levels were normalized with H2B levels. (G) ChIP assay showing decreased WC-2 levels at the promoter of frq gene in the gcn-5KO strain at the indicated time points in DD (n = 3; WT: p = 0.0003, gcn-5KO: p = 0.0459, RAIN; WT vs gcn-5KO: mesor p = 0.2939, amplitude p = 0.0010, phase p = 0.6933, CircaCompare). Error bars indicate standard deviations (n = 3). *p < 0.05; **p < 0.01; ***p < 0.001; Student’s t test was used.
-
Figure 5—source data 1
LumiCycle analysis dataset in Figure 5B.
- https://cdn.elifesciences.org/articles/85241/elife-85241-fig5-data1-v2.zip
-
Figure 5—source data 2
Scan of western blot probed for FRQ protein and quantification dataset in Figure 5C.
- https://cdn.elifesciences.org/articles/85241/elife-85241-fig5-data2-v2.zip
-
Figure 5—source data 3
RT-qPCR analysis dataset in Figure 5D.
- https://cdn.elifesciences.org/articles/85241/elife-85241-fig5-data3-v2.zip
-
Figure 5—source data 4
RT-qPCR analysis dataset in Figure 5E.
- https://cdn.elifesciences.org/articles/85241/elife-85241-fig5-data4-v2.zip
-
Figure 5—source data 5
Chromatin immunoprecipitation (ChIP) analysis dataset in Figure 5F.
- https://cdn.elifesciences.org/articles/85241/elife-85241-fig5-data5-v2.zip
-
Figure 5—source data 6
Chromatin immunoprecipitation (ChIP) analysis dataset in Figure 5G.
- https://cdn.elifesciences.org/articles/85241/elife-85241-fig5-data6-v2.zip
Figure 5—figure supplement 1
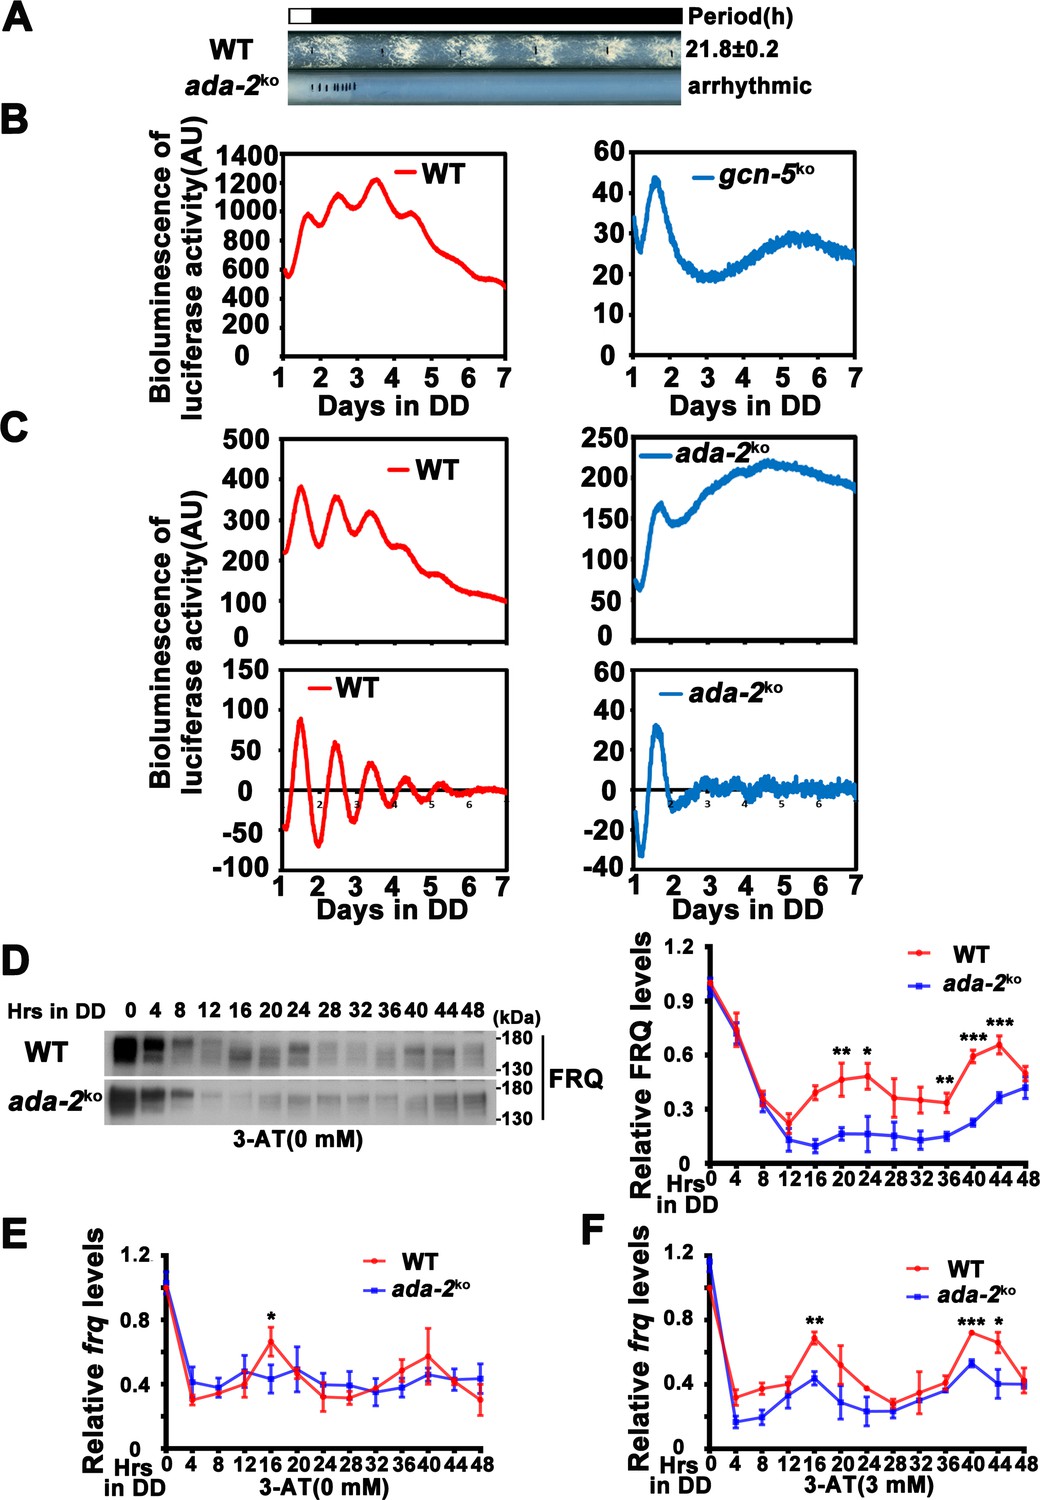
ADA-2 is required for circadian rhythm by regulating rhythmic frq expression.
(A) Race tube assay showing that the conidiation rhythm in ada-2KO strains was lost compared with WT strains. (B) Luciferase assay showing that the luciferase activity rhythm was impaired in the gcn-5KO strain after 1 day transition from light to dark (raw data are shown). (C) Luciferase assay showing that the luciferase activity rhythm was impaired in the ada-2KO strain after 1 day transition from light to dark. Raw data (up panels) and normalized data (down panels) with the baseline luciferase signals subtracted are shown. A FRQ-LUC translational fusion construct was expressed in WT and ada-2KO strains, and the luciferase signal was recorded in DD for more than 7 days. (D) Western blot assay showing that rhythmic expression of FRQ protein was dampened in the ada-2KO strain (n = 3; WT: p = 3.00E−05, ada-2KO: p = 0.0003, RAIN; WT vs ada-2KO: mesor p = 8.27E−05, amplitude p = 0.7450, phase p = 0.0914, CircaCompare). The right panel showing that the densitometric analyses of the results of three independent experiments. The densitometric analyses of Northern blot from three independent experiments showing dampened rhythmic expression of frq mRNA in the ada-2KO strain without 3-aminotriazole (3-AT) (E) (n = 3; WT: p = 0.0155, ada-2KO: p = 0.0207, RAIN; WT vs ada-2KO: mesor p = 0.9646, amplitude p = 0.7405, phase p = 0.0672, CircaCompare) or with 3 mM 3-AT (F) (n = 3; WT: p = 2.92E−05, ada-2KO: p = 0.0208, RAIN; WT vs ada-2KO: mesor p = 0.0167, amplitude p = 0.4307, phase p = 0.3926, CircaCompare) at the indicated time points in DD. Error bars indicate standard deviation (n = 3). *p < 0.05; **p < 0.01; ***p < 0.001; Student’s t test was used.
-
Figure 5—figure supplement 1—source data 1
LumiCycle analysis dataset in Figure 5—figure supplement 1B.
- https://cdn.elifesciences.org/articles/85241/elife-85241-fig5-figsupp1-data1-v2.zip
-
Figure 5—figure supplement 1—source data 2
LumiCycle analysis dataset in Figure 5—figure supplement 1C.
- https://cdn.elifesciences.org/articles/85241/elife-85241-fig5-figsupp1-data2-v2.zip
-
Figure 5—figure supplement 1—source data 3
Scan of western blot probed for FRQ protein and quantification dataset in Figure 5—figure supplement 1D.
- https://cdn.elifesciences.org/articles/85241/elife-85241-fig5-figsupp1-data3-v2.zip
-
Figure 5—figure supplement 1—source data 4
Quantification of Northern blot dataset in Figure 5—figure supplement 1E.
- https://cdn.elifesciences.org/articles/85241/elife-85241-fig5-figsupp1-data4-v2.zip
-
Figure 5—figure supplement 1—source data 5
Quantification of Northern blot dataset in Figure 5—figure supplement 1F.
- https://cdn.elifesciences.org/articles/85241/elife-85241-fig5-figsupp1-data5-v2.zip
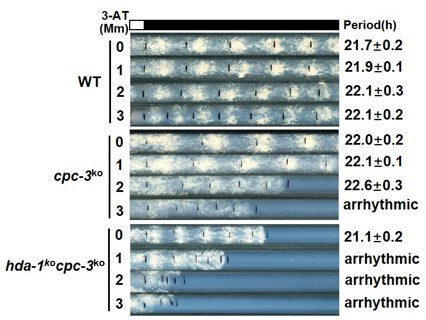
Figure 6
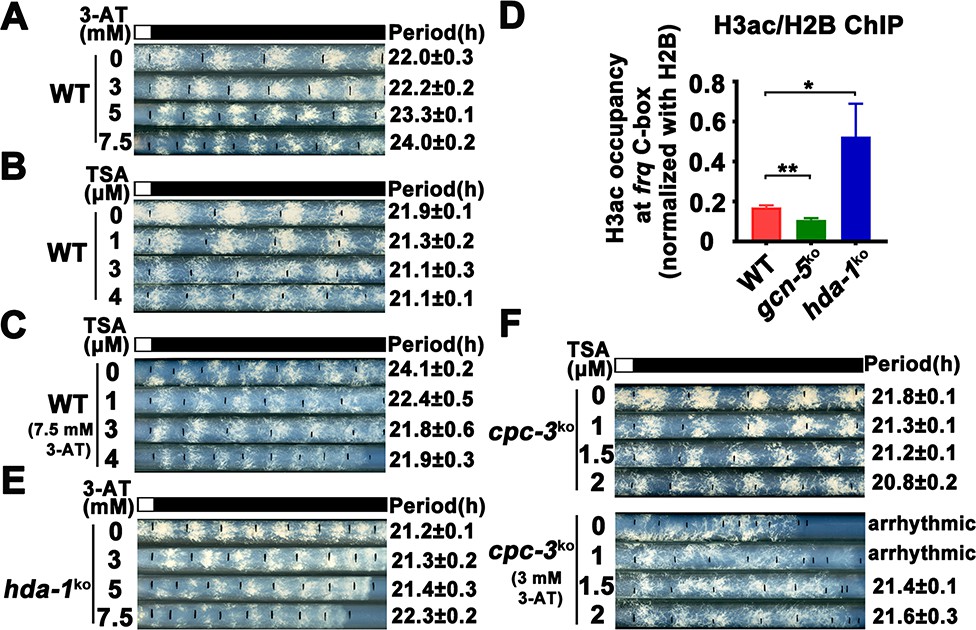
Elevated histone acetylation partially rescues impaired circadian rhythm caused by amino acid starvation stress.
(A) Race tube assay showing that high concentrations of 3-aminotriazole (3-AT) treatment elongated circadian conidiation period of WT strain. (B) Race tube assay showing that the high concentrations of Trichostatin A (TSA) treatment shortened circadian conidiation period of WT strain. (C) TSA treatment rescued prolonged circadian period of WT strain caused by 3-AT treatment. WT strain was grown on the race tube medium containing 7.5 mM 3-AT and indicated concentrations of TSA in DD. (D) Chromatin immunoprecipitation (ChIP) assay showing that H3ac levels were decreased in gcn-5KO strains and increased in hda-1KO strains at the promoter of frq gene. Error bars indicate standard deviations (n = 3). *p < 0.05; **p < 0.01; Student’s t test was used. (E) The hda-1KO strain exhibited near normal circadian period in the presence of 3-AT. hda-1KO strains were grown on the race tube medium containing the indicated concentrations of 3-AT in DD. (F) TSA treatment rescued the impaired circadian rhythm of cpc-3KO strain caused by 3-AT treatment. cpc-3KO strains were grown on the race tube medium containing 3 mM 3-AT and indicated concentrations of TSA in DD.
-
Figure 6—source data 1
RT-qPCR analysis dataset in Figure 6D.
- https://cdn.elifesciences.org/articles/85241/elife-85241-fig6-data1-v2.zip
Figure 7 with 1 supplement
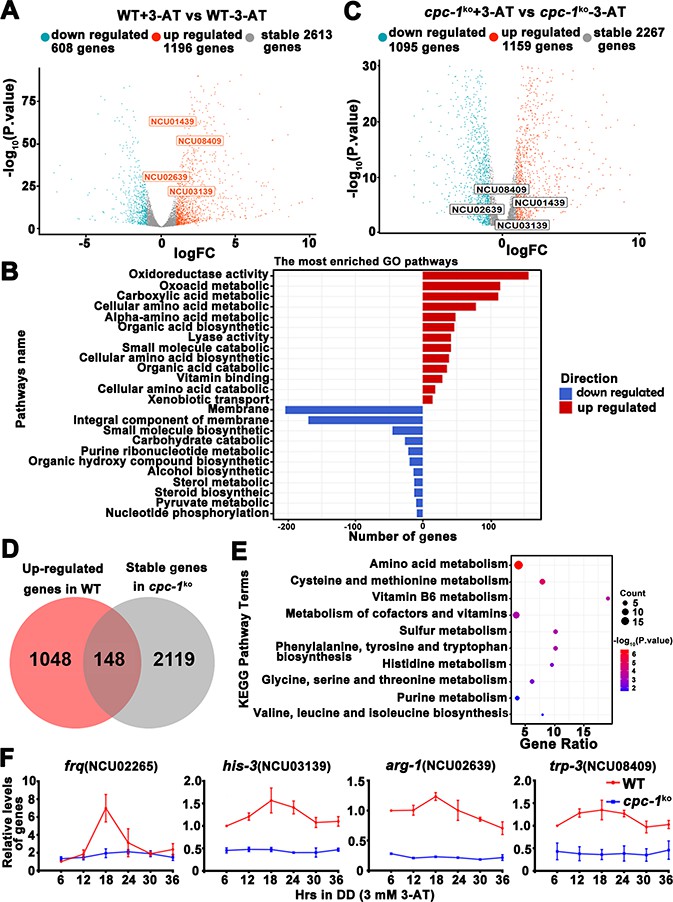
Circadian clock control of CPC-1-activated metabolic genes under amino acid starvation.
(A) Comparison of the transcript expression profiles of the WT strains with and without 12 mM 3-aminotriazole (3-AT) treatment. (B) Gene functional enrichment analysis based on the mRNA levels changes for the up- and downregulated genes in the WT strains with and without 12 mM 3-AT treatment. (C) Comparison of the transcript expression profiles of the cpc-1KO strains with and without 12 mM 3-AT treatment. (D) Pie charts showing the overlaps of upregulated genes in the WT strain, but stable genes in the cpc-1KO strains after 12 mM 3-AT treatment. (E) Gene functional enrichment analysis based on the mRNA levels changes for the overlaps of upregulated genes in the WT strain, but stable genes in the cpc-1KO strains after 12 mM 3-AT treatment. (F) RT-qPCR analysis showing that amino acid synthetic genes his-3 (NCU03139) (n = 3; WT: p = 2.21E−05, cpc-1KO: p>0.05), arg-1 (NCU02639) (n = 3; WT: p = 0.0097, cpc-1KO: p > 0.05), and trp-3 (NCU08409) (n = 3; WT: p = 0.0009, cpc-1KO: p > 0.05) were activated by CPC-1 and were rhythmic expressed with 3 mM 3-AT treatment. The primers used for RT-qPCR are shown in Key Resources Table.
-
Figure 7—source data 1
Raw dataset of RNA-seq analysis in Figure 7A.
- https://cdn.elifesciences.org/articles/85241/elife-85241-fig7-data1-v2.zip
-
Figure 7—source data 2
Raw dataset of RNA-seq analysis in Figure 7C.
- https://cdn.elifesciences.org/articles/85241/elife-85241-fig7-data2-v2.zip
-
Figure 7—source data 3
RT-qPCR analysis dataset in Figure 7F.
- https://cdn.elifesciences.org/articles/85241/elife-85241-fig7-data3-v2.zip
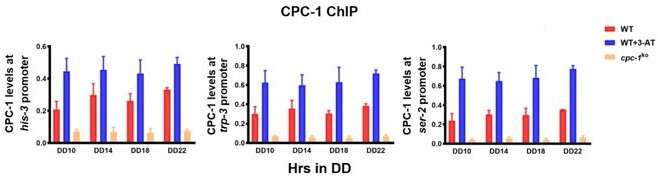
Figure 7—figure supplement 1
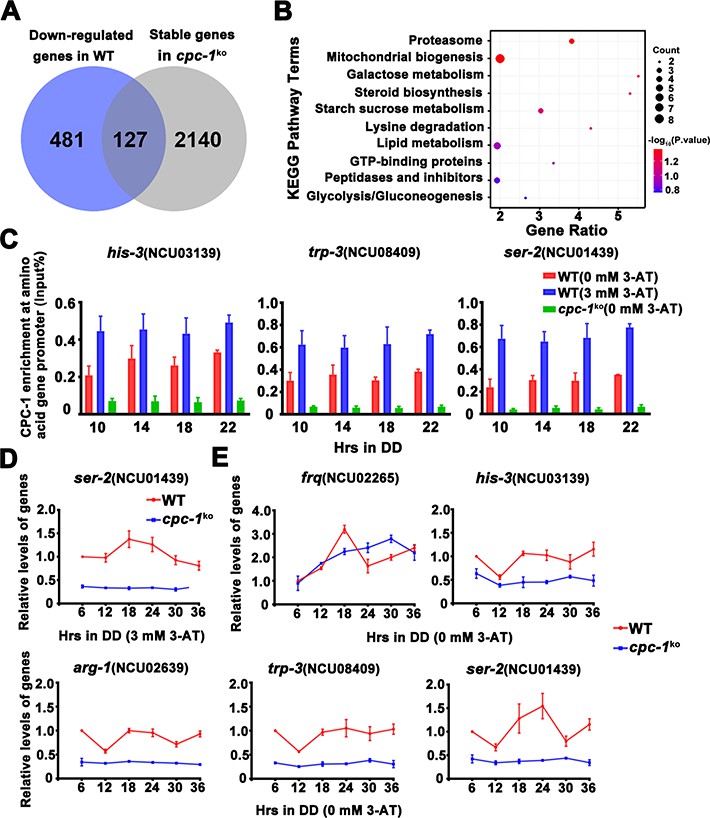
CPC-1 regulated metabolic genes under amino acid starvation.
(A) Pie charts showing the overlaps of downregulated genes in the WT strain, but unchanged genes in the cpc-1KO strains. (B) Gene functional enrichment analysis based on the mRNA levels changes for the overlaps of downregulated genes in the WT strain, but stable genes in the cpc-1KO strains. (C) Chromatin immunoprecipitation (ChIP) assay showing that the CPC-1 occupancy at the his-3 (n = 3; WT (0 mM 3-aminotriazole [3-AT]): p > 0.05, WT (3 mM 3-AT): p > 0.05, cpc-1KO (0 mM 3-AT): p > 0.05), trp-3 (n = 3; WT (0 mM 3-AT): p > 0.05, WT (3 mM 3-AT): p > 0.05, cpc-1KO (0 mM 3-AT): p > 0.05), and ser-2 (n = 3; WT (0 mM 3-AT): p > 0.05, WT (3 mM 3-AT): p > 0.05, cpc-1KO (0 mM 3-AT): p > 0.05) promoters was not rhythmic. WT and cpc-1KO strains were grown for the indicated number of hours in DD. Samples were crosslinked with formaldehyde and harvested for ChIP using CPC-1 antibody. CPC-1 ChIP occupancies were normalized by the ratio of ChIP to Input DNA. (D) RT-qPCR analysis showing that amino acid synthetic gene ser-2 (NCU01439) was activated by CPC-1 and was rhythmic expressed with 3 mM 3-AT treatment (n = 3; WT: p = 2.25E−05, cpc-1KO: p > 0.05). (E) RT-qPCR analysis showing that amino acid synthetic genes arg-1 (NCU02639) (n = 3; WT: p = 0.0353, cpc-1KO: p > 0.05), trp-3 (NCU08409) (n = 3; WT: p = 0.0436, cpc-1KO: p = 0.0288, RAIN; WT vs cpc-1KO: mesor p = 1.83E−14, amplitude p = 0.1326, phase p = 0.4851, CircaCompare), and ser-2 (NCU01439) genes (n = 3; WT: p = 0.0008, cpc-1KO: p = 0.0151, RAIN; WT vs cpc-1KO: mesor p = 2.35E−13, amplitude p = 0.0009, phase p = 0.2833, CircaCompare), but not the his-3 (NCU03139) gene (n = 3; WT: p > 0.05), were rhythmic expressed under normal condition (0 mM 3-AT).
-
Figure 7—figure supplement 1—source data 1
Chromatin immunoprecipitation (ChIP) analysis dataset in Figure 7—figure supplement 1C.
- https://cdn.elifesciences.org/articles/85241/elife-85241-fig7-figsupp1-data1-v2.zip
-
Figure 7—figure supplement 1—source data 2
RT-qPCR analysis dataset in Figure 7—figure supplement 1D.
- https://cdn.elifesciences.org/articles/85241/elife-85241-fig7-figsupp1-data2-v2.zip
-
Figure 7—figure supplement 1—source data 3
RT-qPCR analysis dataset in Figure 7—figure supplement 1E.
- https://cdn.elifesciences.org/articles/85241/elife-85241-fig7-figsupp1-data3-v2.zip
Figure 8
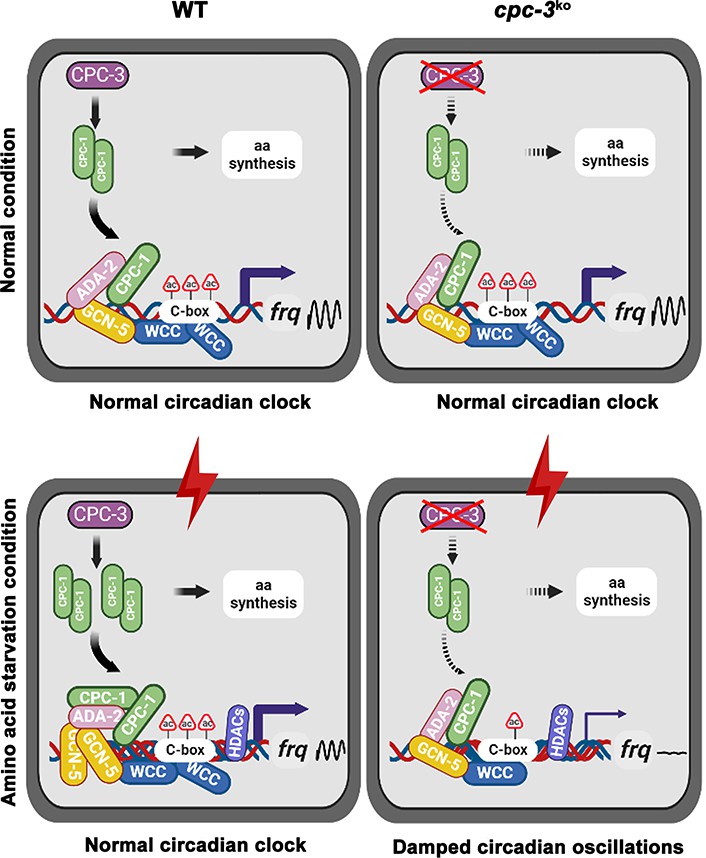
Model showing the role of CPC-3 and CPC-1 in maintaining the Neurospora circadian rhythm in response to amino acid starvation.
Under normal conditions, CPC-1 is expressed at its basal levels in the WT (Left) or cpc-3KO (Right) strain, which is required for rhythmic expression of frq gene by recruiting the histone acetyltransferase GCN-5 containing SAGA complex to the frq promoter. Under amino acid starvation conditions, the chromatin in the frq promoter of the WT strain is constitutively compacted (due to decreased H3ac), likely due to activation of histone deacetylases or inhibition of histone acetyltransferases. CPC-3 and CPC-1 signaling pathway was activated by amino acid starvation and the elevated CPC-1 protein would efficiently recruit the histone acetyltransferase GCN-5 containing SAGA complex to promote the histone acetylation levels, which permitted rhythmic WCC binding at the frq promoter (Left). Disruption of the CPC-3 and CPC-1 signaling pathway resulted in decreased histone acetylation levels of the frq gene promoter, reduced WCC binding and damped circadian oscillations in response to the amino acid starvation stress (Right).
Author response image 1
Author response image 2
Tables
Key resources table
| Reagent type (species) or resource | Designation | Source or reference | Identifiers | Additional information |
|---|---|---|---|---|
| Strain, strain background (Neurospora crassa) | 87-3 (ras-1bd, a) | Dr.Yi Liu’s Laboratory | ||
| Strain, strain background (Neurospora crassa) | 301-6 (ras-1bd, his-3-, A) | Dr.Yi Liu’s Laboratory | ||
| Strain, strain background (Neurospora crassa) | ras-1bd;cpc-3KO | Fungal Genetics Stock Center | NCU01187 | |
| Strain, strain background (Neurospora crassa) | ras-1bd;cpc-1KO | Fungal Genetics Stock Center | NCU04050 | |
| Strain, strain background (Neurospora crassa) | ras-1bd;gcn-5KO | Fungal Genetics Stock Center | NCU10847 | |
| Strain, strain background (Neurospora crassa) | ras-1bd;ada-2KO | Fungal Genetics Stock Center | NCU04459 | |
| Strain, strain background (Neurospora crassa) | ras-1bd;hda-1KO | Fungal Genetics Stock Center | NCU01525 | |
| Strain, strain background (Neurospora crassa) | ras-1bd;cpc-1KO, cpc-1-Myc.CPC-1 | Dr.Xiao Liu’s Laboratory | ||
| Strain, strain background (Neurospora crassa) | 301-6, cfp-Myc.CPC-1, cfp-Flag.ADA-2 | Dr.Xiao Liu’s Laboratory | ||
| Strain, strain background (Neurospora crassa) | 301-6, cfp-Myc.GCN-5, cfp-Flag.ADA-2 | Dr.Xiao Liu’s Laboratory | ||
| Strain, strain background (Neurospora crassa) | frq-luc | Dr.Yi Liu’s Laboratory | ||
| Strain, strain background (Neurospora crassa) | ras-1bd;cpc-3KO, frq-luc | Dr.Xiao Liu’s Laboratory | ||
| Strain, strain background (Neurospora crassa) | ras-1bd;cpc-1KO, frq-luc | Dr.Xiao Liu’s Laboratory | ||
| Strain, strain background (Neurospora crassa) | FRQ-LUC | Dr. Luis Larrondo’s Laboratory | ||
| Strain, strain background (Neurospora crassa) | ras-1bd;gcn-5KO, FRQ-LUC | Dr.Xiao Liu’s Laboratory | ||
| Strain, strain background (Neurospora crassa) | ras-1bd;ada-2KO, FRQ-LUC | Dr.Xiao Liu’s Laboratory | ||
| Antibody | Rabbit polyclonal anti-Histone H2B | Abcam | Cat# ab1790 | 1:3000 |
| Antibody | Rabbit polyclonal anti-Histone H3ac | Millipore | Cat# 06-599 | 1:3000 |
| Antibody | Mouse monoclonal anti-c-Myc | TransGen | Cat# HT101 | 1:3000 |
| Antibody | Mouse monoclonal anti-Flag | Sigma | Cat# F1804 | 1:3000 |
| Antibody | Rabbit polyclonal anti-P-eIF2α | Abcam | Cat# ab32157 | 1:3000 |
| Antibody | Rabbit polyclonal anti-CPC-1 | Dr.Xiao Liu’s Laboratory | 1:3000 | |
| Antibody | Rabbit polyclonal anti-FRQ | Dr.Yi Liu’s Laboratory | 1:3000 | |
| Antibody | Rabbit polyclonal anti-WC-1 | Dr.Yi Liu’s Laboratory | 1:4000 | |
| Antibody | Rabbit polyclonal anti-WC-2 | Dr.Yi Liu’s Laboratory | 1:8000 | |
| Sequence-based reagent | frq-F | Dr.Xiao Liu’s Laboratory | RT-qPCR | GCAGTGTCATTGACGACTTG |
| Sequence-based reagent | frq-R | Dr.Xiao Liu’s Laboratory | RT-qPCR | CCTCCAACTCACGTTTCTTTC |
| Sequence-based reagent | his-3-F | Dr.Xiao Liu’s Laboratory | RT-qPCR | CCTCGTTCGTCAAGCACATTA |
| Sequence-based reagent | his-3-R | Dr.Xiao Liu’s Laboratory | RT-qPCR | CTCCTCAACCTTAGCCAACTG |
| Sequence-based reagent | trp-3-F | Dr.Xiao Liu’s Laboratory | RT-qPCR | ACCTATATCCTTCAGAACCAATACG |
| Sequence-based reagent | trp-3-R | Dr.Xiao Liu’s Laboratory | RT-qPCR | GCTCGGTATCCTTCCAGTTG |
| Sequence-based reagent | ser-2-F | Dr.Xiao Liu’s Laboratory | RT-qPCR | GCTGCTAACGGTGACTACTT |
| Sequence-based reagent | ser-2-R | Dr.Xiao Liu’s Laboratory | RT-qPCR | GGTGAGGATGATGTTGTTGAG |
| Sequence-based reagent | arg-1-F | Dr.Xiao Liu’s Laboratory | RT-qPCR | CCCATCATTGCCCGTGCCC |
| Sequence-based reagent | arg-1-R | Dr.Xiao Liu’s Laboratory | RT-qPCR | TGACGACCCTGGAAGCGAG |
| Sequence-based reagent | β-tubulin-F | Dr.Xiao Liu’s Laboratory | RT-qPCR | GCGTATCGGCGAGCAGTT |
| Sequence-based reagent | β-tubulin-R | Dr.Xiao Liu’s Laboratory | RT-qPCR | CCTCACCAGTGTACCAATGCA |
| Sequence-based reagent | frq C-box-F | Dr.Xiao Liu’s Laboratory | ChIP-qPCR | GTCAAGCTCGTACCCACATC |
| Sequence-based reagent | frq C-box-R | Dr.Xiao Liu’s Laboratory | ChIP-qPCR | CCGAAAGTATCTTGAGCCTCC |
| Sequence-based reagent | frq promoter-F | Dr.Xiao Liu’s Laboratory | ChIP-qPCR | GTTGCCGTGACTCCCCCTTG |
| Sequence-based reagent | frq promoter-R | Dr.Xiao Liu’s Laboratory | ChIP-qPCR | CCGAAAGTATCTTGAGCCTCC |
| Sequence-based reagent | his-3 ChIP-F | Dr.Xiao Liu’s Laboratory | ChIP-qPCR | TTTTCATAAAGCCCGAGTCT |
| Sequence-based reagent | his-3 ChIP-R | Dr.Xiao Liu’s Laboratory | ChIP-qPCR | CAGGTATTGTGCTGTTCCCC |
| Sequence-based reagent | trp-3 ChIP-F | Dr.Xiao Liu’s Laboratory | ChIP-qPCR | AATCGGGTGAGTCAAAGGCG |
| Sequence-based reagent | trp-3 ChIP-R | Dr.Xiao Liu’s Laboratory | ChIP-qPCR | CGAGCAAGAGGGAGAGGTGT |
| Sequence-based reagent | ser-2 ChIP-F | Dr.Xiao Liu’s Laboratory | ChIP-qPCR | GGGACAAAAGCAGTGATTCTA |
| Sequence-based reagent | ser-2 ChIP-R | Dr.Xiao Liu’s Laboratory | ChIP-qPCR | CGATTTACATCCATCTGAGA |
| Sequence-based reagent | frq northern-F | Dr.Xiao Liu’s Laboratory | Northern blot | TAATACGACTCACTATAGGGCCTTCGTTGGATATCCATCATG |
| Sequence-based reagent | frq northern-R | Dr.Xiao Liu’s Laboratory | Northern blot | GAATTCTTGCAGGGAAGCCGG |
| Software, algorithm | ImageJ | https://imagej.nih.gov/ij/ | ||
| Software, algorithm | LumiCycle | https://actimetrics.com/products/lumicycle/ | ||
| Software, algorithm | CircaCompare | https://github.com/RWParsons/circacompare/; Parsons et al., 2020 |
Additional files
-
MDAR checklist
- https://cdn.elifesciences.org/articles/85241/elife-85241-mdarchecklist1-v2.pdf
-
Supplementary file 1
Analyses of CPC-1 regulated genes.
- https://cdn.elifesciences.org/articles/85241/elife-85241-supp1-v2.xlsx
-
Supplementary file 2
Analyses of rhythmic datasets by CircaCompare.
- https://cdn.elifesciences.org/articles/85241/elife-85241-supp2-v2.xlsx
Download links
A two-part list of links to download the article, or parts of the article, in various formats.
Downloads (link to download the article as PDF)
Open citations (links to open the citations from this article in various online reference manager services)
Cite this article (links to download the citations from this article in formats compatible with various reference manager tools)
The nutrient-sensing GCN2 signaling pathway is essential for circadian clock function by regulating histone acetylation under amino acid starvation
eLife 12:e85241.
https://doi.org/10.7554/eLife.85241


