Tau polarizes an aging transcriptional signature to excitatory neurons and glia
- Jan and Dan Duncan Neurological Research Institute, Texas Children’s Hospital, United States
- Medical Scientist Training Program, Baylor College of Medicine, United States
- Department of Molecular and Human Genetics, Baylor College of Medicine, United States
- Department of Neuroscience, Baylor College of Medicine, United States
- Department of Neurology, Baylor College of Medicine, United States
- Department of Pediatrics, Baylor College of Medicine, United States
- Center for Alzheimer’s and Neurodegenerative Diseases, Baylor College of Medicine, United States
Figures
Figure 1 with 3 supplements
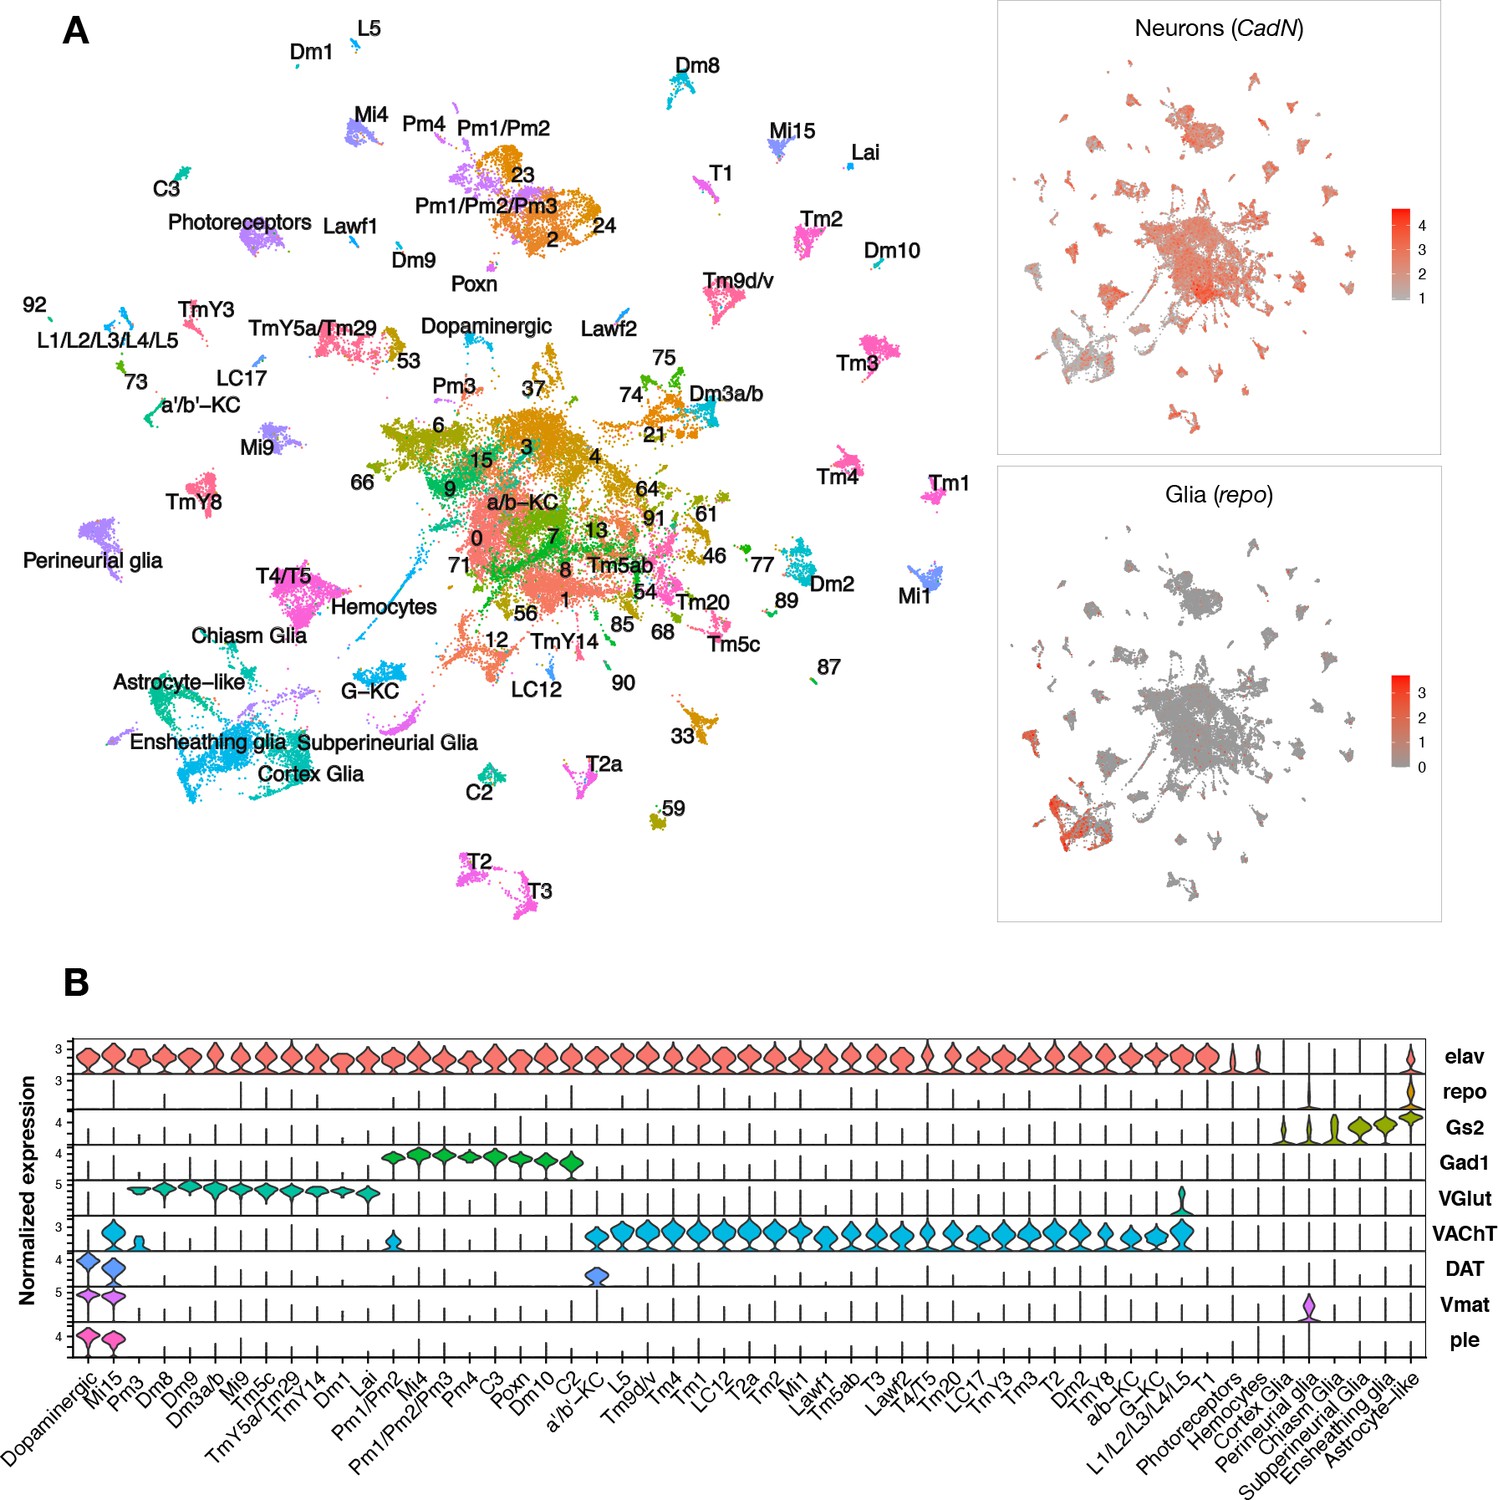
Single-cell RNA-sequencing of the adult Drosophila brain.
(A) Uniform manifold approximation and projection (UMAP) plot displays unsupervised clustering of 48,111 cells, including from control (elav-GAL4/+) and elav>tauR406W transgenic animals (elav-GAL4/+; UAS-tauR406W/+) at 1, 10, and 20 days. Expression of neuron- and glia-specific marker genes, CadN and repo, respectively, is also shown. Cell cluster annotations identify heterogeneous optic lobe neuron types, including from the lamina (L1-5, T1, C2/3, Lawf, Lai), medulla (Tm/TmY, Mi, Dm, Pm, T2/3), and lobula (T4/T5, LC). Other identified neuron types include photoreceptors (ninaC, eya), dopaminergic neurons (DAT, Vmat, ple), and central brain mushroom body Kenyon cells (ey, Imp, sNFP, trio). (B) Violin plot showing cell-type marker expression across annotated cell clusters. Selected markers include Elav (neurons), repo/Gs2 (glia), Gad1 (GABA), VGlut (glutamate), VAChT (acetylcholine), and DAT/Vmat/ple (dopamine). See also Figure 1—figure supplements 1–3 and Figure 1—source data 1–4.
-
Figure 1—source data 1
Drosophila scRNAseq cell cluster annotations.
Cluster refers to the numeric ID assigned by Seurat when FindClusters resolution is set to 2, and the Annotation column notes the cell identity assignment. This table can be used to obtain cell identities of Seurat cluster IDs in the result tables below.
- https://cdn.elifesciences.org/articles/85251/elife-85251-fig1-data1-v2.xlsx
-
Figure 1—source data 2
Cell cluster markers.
Cluster markers are obtained by MAST differential expression analysis where each cell cluster is compared against all remaining cells. Only genes with a positive log2 fold change are displayed. Log2 fold change = expression fold change between a given cluster and all remaining cells. Pct.1 = percent of cells in the given cluster with non-zero expression of the gene. Pct.2 = percent of the remaining cells (not in the cluster) that have non-zero expression of the gene. Cluster ID = Seurat assigned cluster ID. BH-adjusted p-value = Benjamini–Hochberg-corrected p-value from the MAST differential expression analysis for each cluster.
- https://cdn.elifesciences.org/articles/85251/elife-85251-fig1-data2-v2.xlsx
-
Figure 1—source data 3
Single-cell RNA-sequencing quality control parameters.
Cell library metrics from the 10x Genomics Cell Ranger output. Sample = cell library labels. Libraries from the replication experiment are labeled with ‘rep’ behind the final underscore. See also Figure 1—figure supplement 1. Additional details on the data provided in each column can be found in 10x Genomics support materials: https://support.10xgenomics.com/single-cell-gene-expression/software/pipelines/latest/output/gex-metrics.
- https://cdn.elifesciences.org/articles/85251/elife-85251-fig1-data3-v2.xlsx
-
Figure 1—source data 4
Drosophila cell-type expression markers.
Table of established fly gene expression markers used as references for cell annotation. Genes = marker genes that can be used to identify a cell type. Cell type = Drosophila brain cell subpopulation. Reference = source publication used to obtain the genes.
- https://cdn.elifesciences.org/articles/85251/elife-85251-fig1-data4-v2.xlsx
Figure 1—figure supplement 1
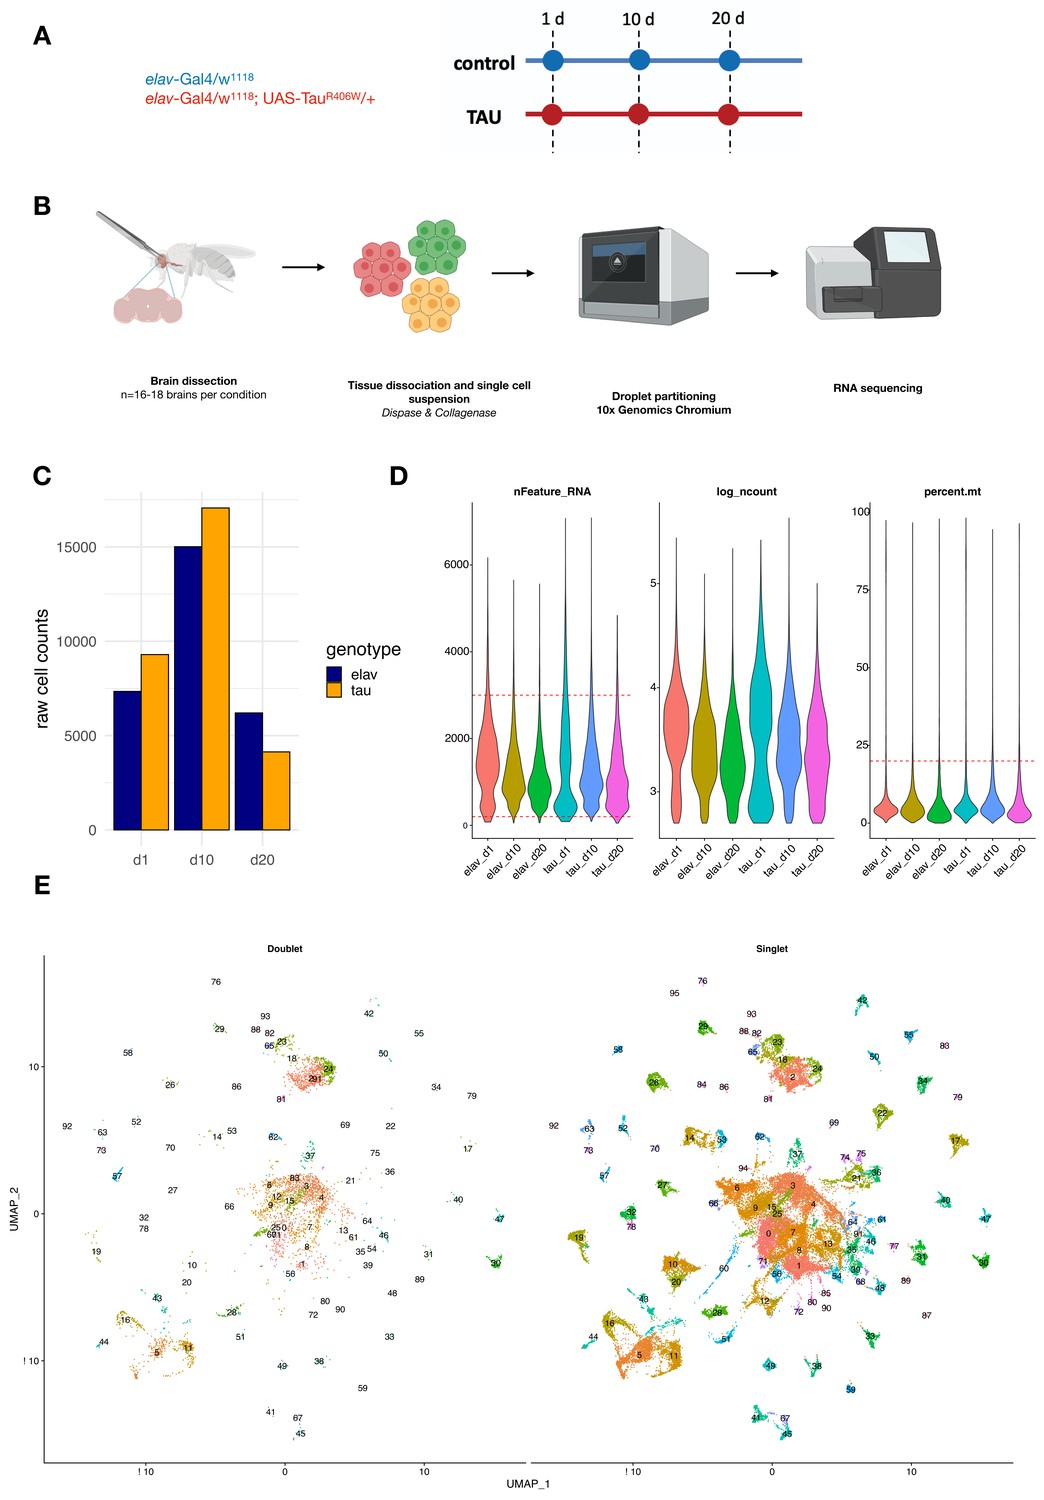
Study design and quality control metrics.
(A) Schematic showing longitudinal study design for this study. Control (elav-GAL4/+) and elav>tauR406W transgenic animals (elav-GAL4/+; UAS-tauR406W/+) animals were aged to three timepoints: 1, 10, and 20 days. (B) For each library, 16–18 brains were dissected from the cuticle and pooled for dissociation into a single-cell suspension. Cells were partitioned into single-cell droplets using the 10x Genomics Chromium platform for library preparation, and completed libraries were sequenced using the Illumina NovaSeq 6000. Figures were generated using BioRender. (C) Plot shows the number of cells captured in each library for elav-GAL4 controls (elav) and elav>tauR406W (tau) at each timepoint: day 1 (d1), day 10 (d10), or day 20 (d20). (D) Violin plots display scRNAseq library quality control metrics, including the number of unique genes captured (nFeature_RNA), log(number of UMIs) (log_ncount), and % mitochondrial reads (percent.mt). Cell filtering cutoffs are denoted by red dashed lines. (E) Unsupervised clustering of cells after filtering by DoubletFinder, showing cells classified as doublets or multiplets (left) and singlets (right). A total of 48,111 cells classified as singlets were used for downstream analyses.
Figure 1—figure supplement 2
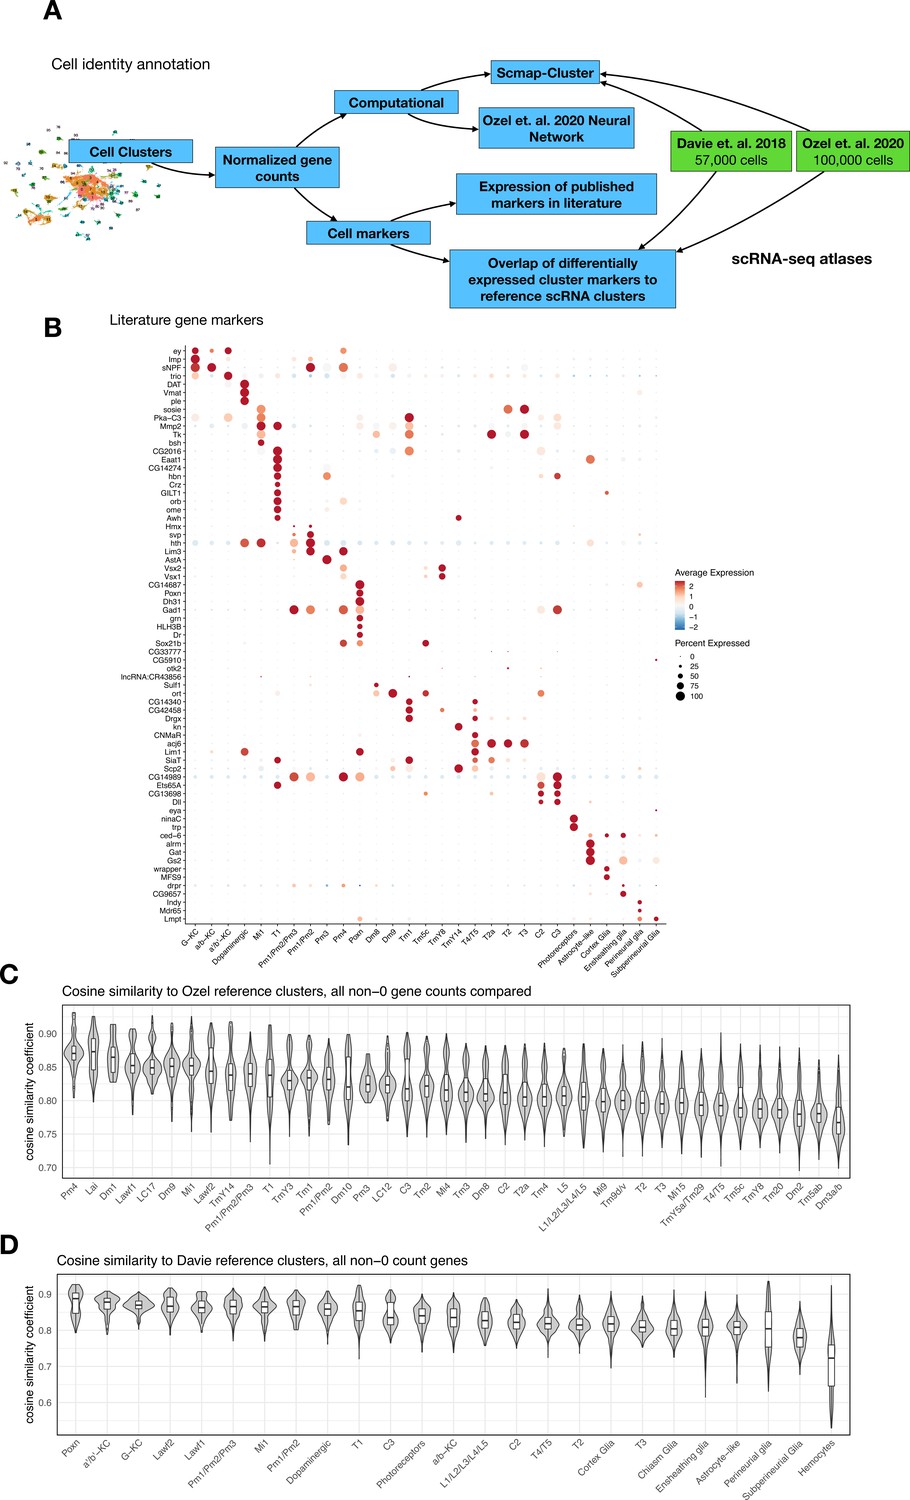
Annotating cell identities for 96 cell clusters across 48,111 cells from Drosophila brains.
(A) Schematic shows the cell identity annotation pipeline utilized for this study. We leveraged both published scRNA-seq atlases from Davie et al., 2018 and Özel et al., 2021 as well as other well-established cell-type markers. Our strategy included (i) correlation-based approach (scmap) using the two brain atlases as reference, (ii) a two-layer neural network classifier from Özel et al., 2021 to identify optic lobe neurons, and (iii) differential expression of cell-specific marker genes. (B) Expression of cell-specific markers across annotated cell identities. Normalized expression for each gene is scaled (Z-transformed) across all cell clusters and represented in a blue-red color scale. Percent of cells in each cluster that have detectable (non-zero) gene expression is represented by dot size. (C) Correlation analysis (cosine similarity) of shared, non-dropout, genes from individual annotated cells in our dataset to cluster-level means of the corresponding cell identity in Özel et al., 2021. Violin plot representing distribution of cosine similarity scores of annotated cells in our dataset to their (available) corresponding reference cluster in Özel et al., 2021. The median similarity coefficient for cell-to-reference pairings ranged from 0.87 to 0.76. (D) Identical correlation analysis as described in (C), applied with reference clusters from Davie et al., 2018. The median similarity coefficient for cell-to-reference pairings ranged from 0.9 to 0.72.
Figure 1—figure supplement 3
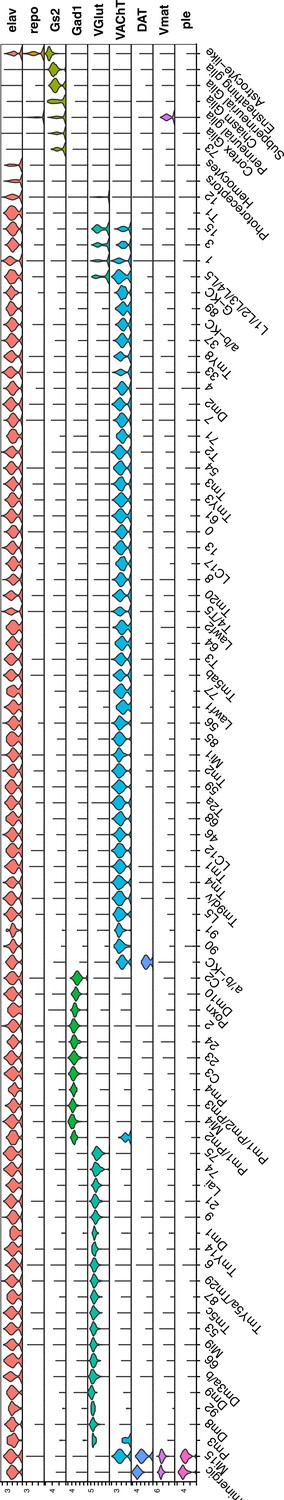
Normalized gene expression of general cell-type markers across all defined cell clusters.
Violin plot of general cell-type markers for all cell clusters, as described in Figure 1B.
Figure 2 with 3 supplements
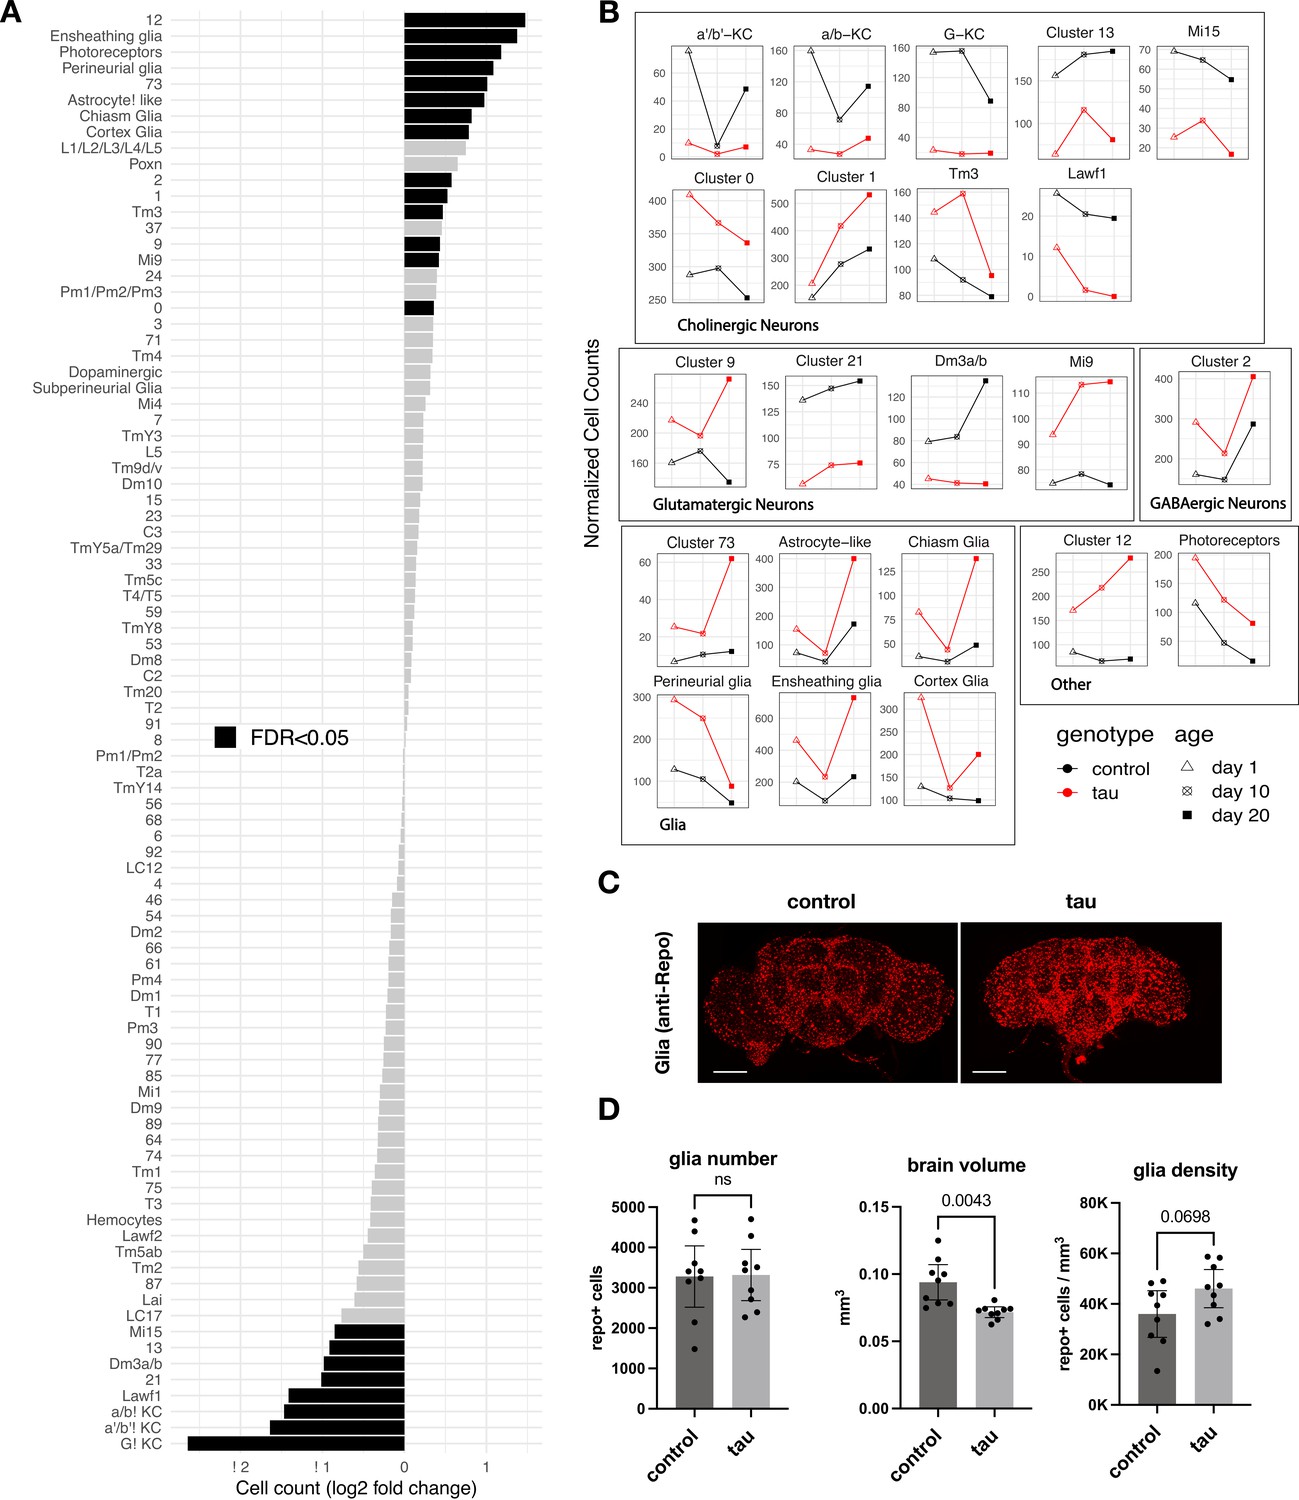
Tau-triggered cell proportion changes in the adult brain.
(A) Log2-fold change (log2FC) of normalized cell counts between elav>tauR406W (elav-GAL4/+; UAS-tauR406W/+) and control (elav-GAL4/+) animals. Timepoints are pooled for each cluster. Cell clusters with statistically significant changes (false discovery rate [FDR] < 0.05) are highlighted in black. Many of these cell abundance changes were replicated in an independent dataset generated from 10-day-old animals (Figure 2—figure supplement 1). Since cell-type abundance estimates are relative between clusters, we also performed an adjusted analysis in which glia were assumed to be unchanged (Figure 2—figure supplement 3A). (B) Plots highlight cluster cell counts with significant differences based on pooled timepoint comparisons between elav>tauR406W (red) and control (black) animals, including results for samples collected at 1 day (triangle), 10 days (cross-hatch square), or 20 days (filled square). See Figure 2—figure supplement 2 for complementary analysis based on deconvolution of bulk brain RNA-sequencing. (C) Whole-mount immunofluorescence of adult brains from 10-day-old flies. Glia are stained using the Anti-Repo antibody (red) in control (elav-GAL4/+) and elav>tauR406W transgenic flies. Full Z-stack projection is shown. Scale bar = 100 microns. See also Figure 2—figure supplement 3B for additional immunostains for nuclei and actin. (D) Quantification of glia (Repo-positive puncta), brain volume, and glial density is shown. Statistical analysis employed Welch’s T-test with n=9 animals per group and significance threshold p < 0.05. Error bars denote the 95% confidence interval. See also Figure 2—figure supplements 1–3 and Figure 2—source data 1.
-
Figure 2—source data 1
Tau-triggered cell proportion changes.
Analysis of cell abundance changes between elav>tauR406W and control animals as quantified by DESeq2. In the discovery dataset, the 1, 10, and 20-day timepoints are pooled, such that n = 3 values for each comparison. The replication dataset is comprised of n = 3 elav>tauR406W and control (elav-GAL4) animals all prepared at day 10. baseMean = mean of normalized cell counts for the given cell cluster across all samples. Log2FoldChange = log2 fold change of elav>tauR406W vs. control cell counts. lfcSE = standard error of log2 fold change value. Pvalue = p-value from Wald test of the genotype log2 fold change value. Differences in cell count are quantified by negative binomial GLM, such that count ~genotype + age. Padj = adjusted p values using the Benjamini–Hochberg procedure. Experiment = denotes if data is from the discovery or replication analysis.
- https://cdn.elifesciences.org/articles/85251/elife-85251-fig2-data1-v2.xlsx
Figure 2—figure supplement 1
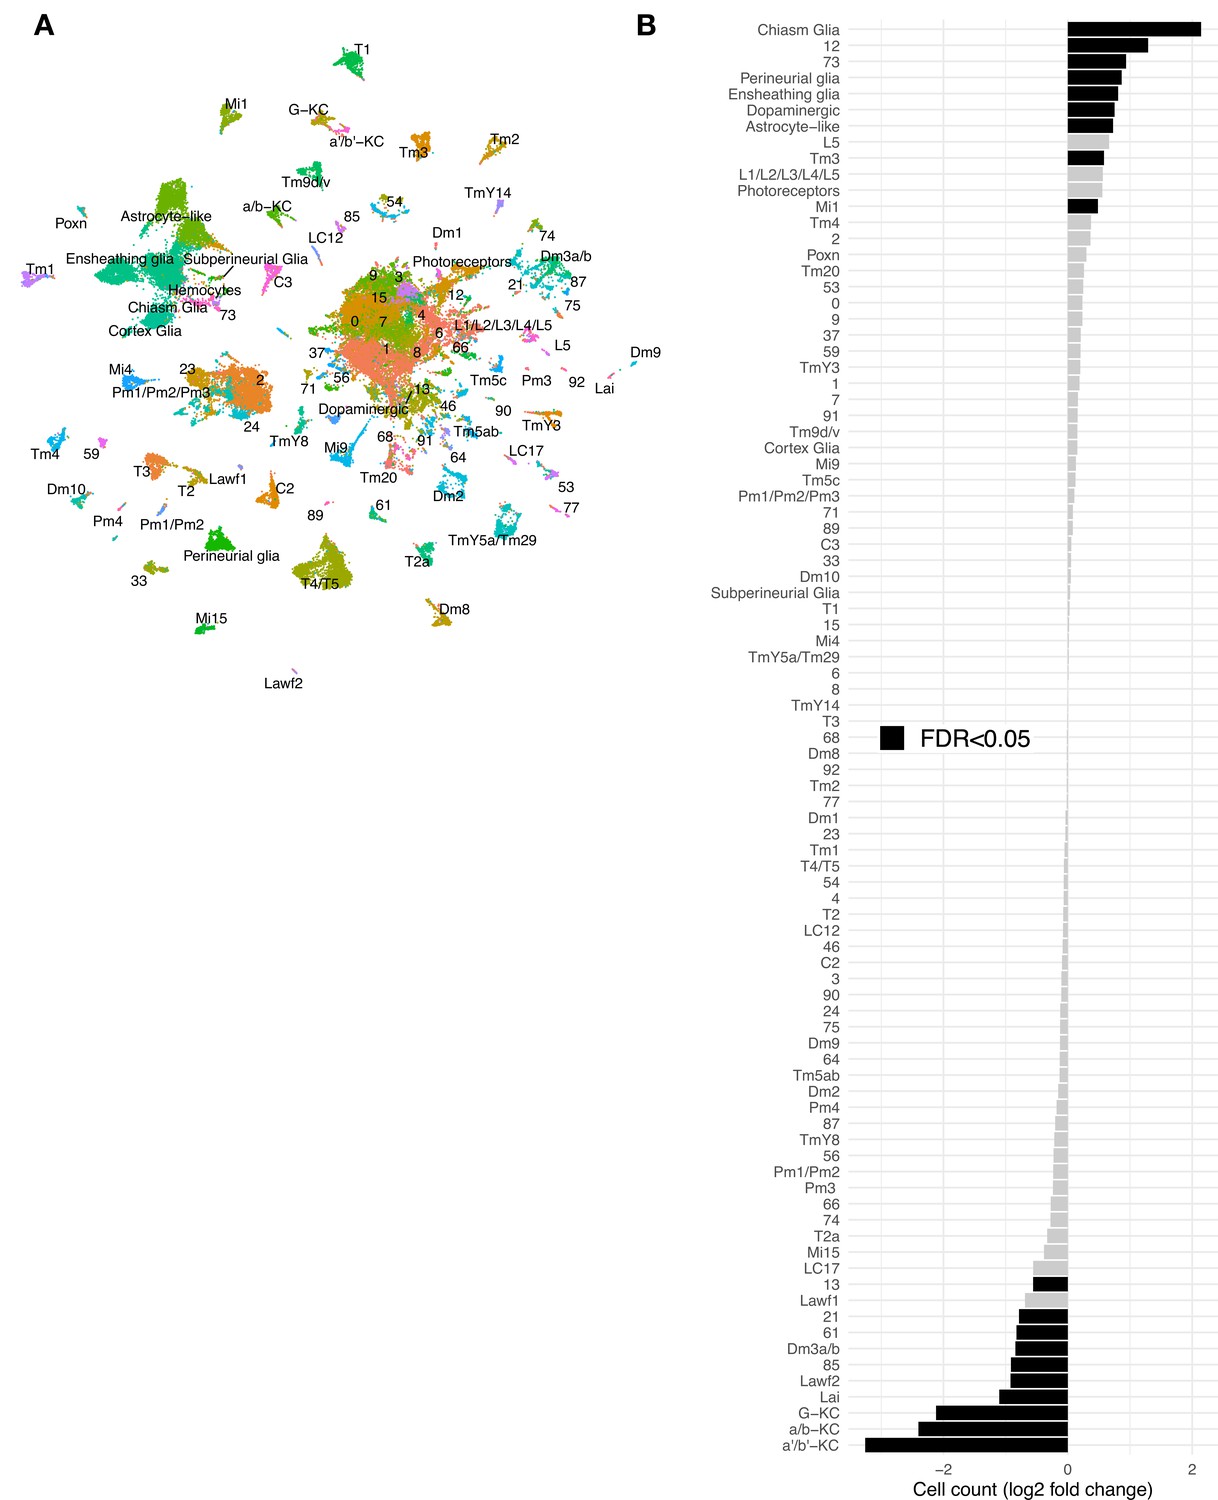
Additional scRNAseq from three tauR406Wand three control libraries at day 10 post-eclosion.
(A) UMAP plot showing the 69,128 cells comprising the scRNAseq replication dataset from 10-day-old control (elav-GAL4/+) and elav>tauR406W (elav-GAL4/+; UAS-tauR406W/+) flies. Cell cluster names are consistent with that used in the discovery dataset (Figure 1). (B) Plots shows tau-triggered cell abundance changes, based on log2-fold change of normalized cell counts in the replication dataset. 19 clusters have statistically significant cell abundance changes (false discovery rate [FDR] < 0.05; black bars). Of note, in the replication dataset, hemocytes were present in only very low numbers, and therefore were not included in cell abundance analyses.
Figure 2—figure supplement 2

Estimation of cell proportions by deconvolution of bulk-tissue RNA-sequencing.
Cell proportions (y-axis) are shown for selected cell types of interest, based on analysis of bulk-tissue RNAseq from control (black, n = 2) (elav-GAL4/+) and elav>tauR406W (red, n = 3) (elav-GAL4/+; UAS-tauR406W/+) flies (Mangleburg et al., 2020). A line is drawn through the median of each condition. There is an elevation in the estimated proportions of astrocyte-like, ensheathing, and perineurial glia, recapitulating observations in the scRNAseq cell abundance analysis.
Figure 2—figure supplement 3
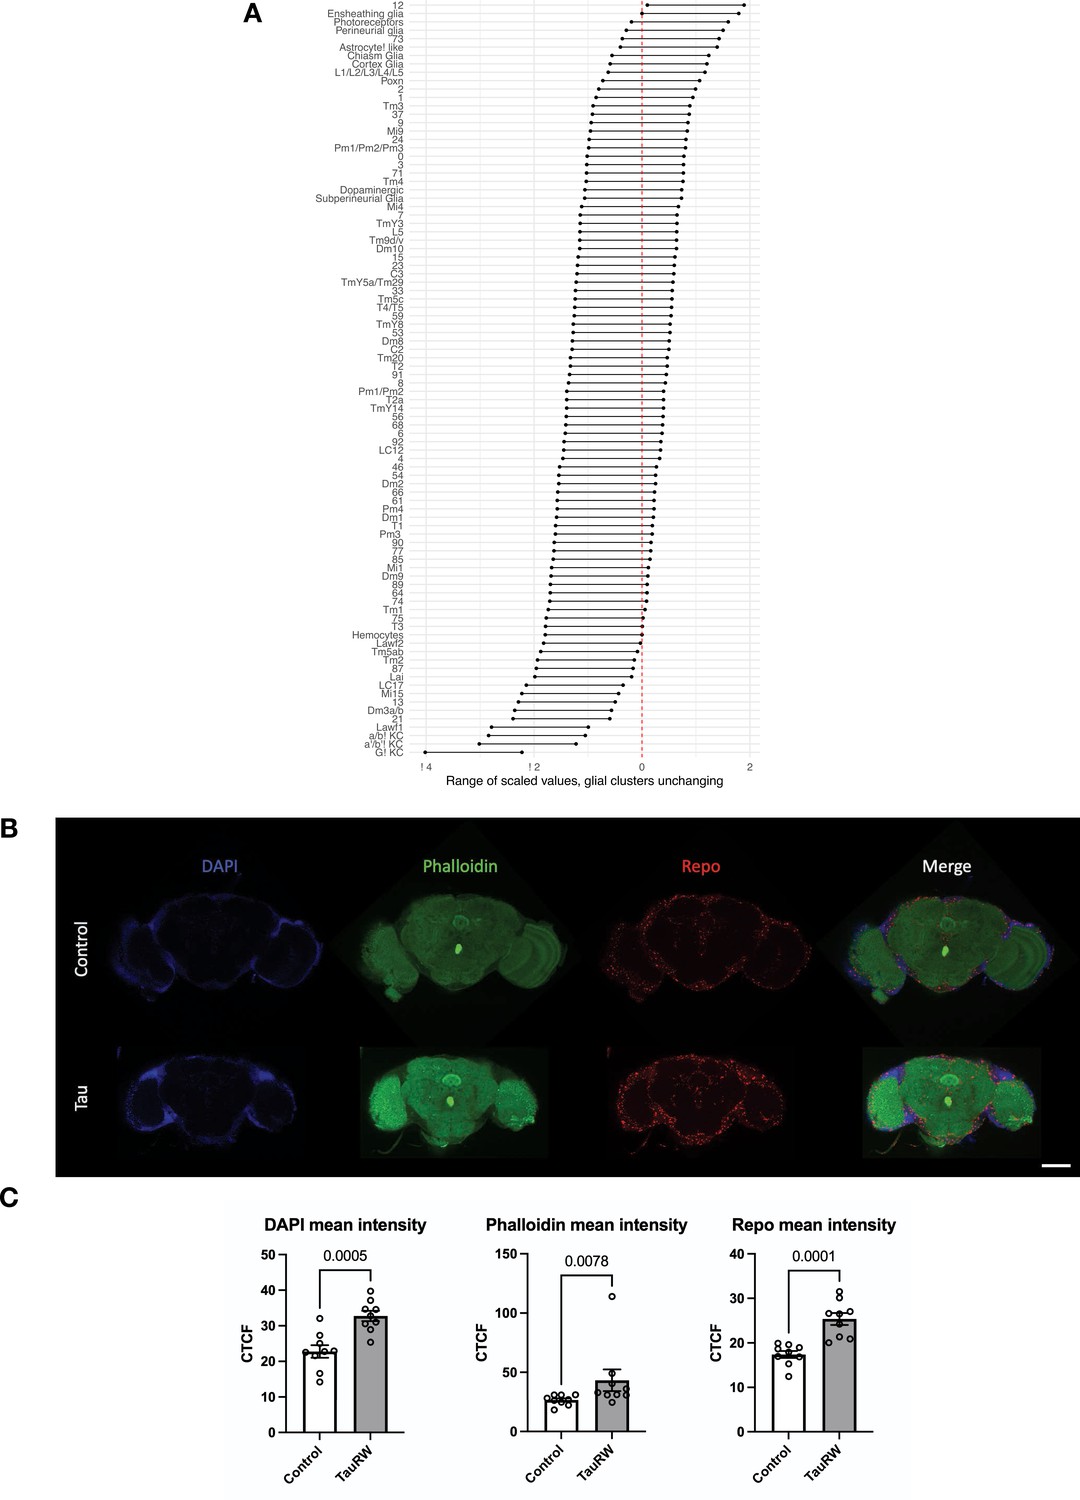
Adjusted tau-triggered cell abundance changes.
(A) In order to adjust for proportional changes, the log2 fold-change value for seven cell clusters (Ensheathing glia, Perineurial glia, Astrocyte-like glia, Cortex glia, Chiasm glia, Subperineurial glia, and Hemocytes) was iteratively subtracted from the cell abundance estimates for all other clusters, establishing a confidence interval. Following adjustment, 14 decreasing and 1 increasing cell types are highlighted. All other cell-type clusters have fold-change estimates overlapping zero. (B) Whole-mount immunofluorescence of adult brains from 10-day-old flies, including control (elav-GAL4/+) and elav>tauR406W (elav-GAL4/+; UAS-tauR406W/+) flies. Composite of 10 confocal sections is shown, from co-staining for glia (Anti-Repo, red) along with nuclei (DAPI, blue) and actin (phalloidin, green). Scale bar = 100 microns. (C) Quantification of fluorescent intensity in (B) across genotypes. Statistical analysis of mean pixel intensity employed either unpaired, two-tailed t-tests (DAPI, Repo) or the Mann-Whitney t-test (Phalloidin), with n=9 animals per group and significance threshold p < 0.05. Error bars denote the 95% confidence interval.
Figure 3 with 5 supplements
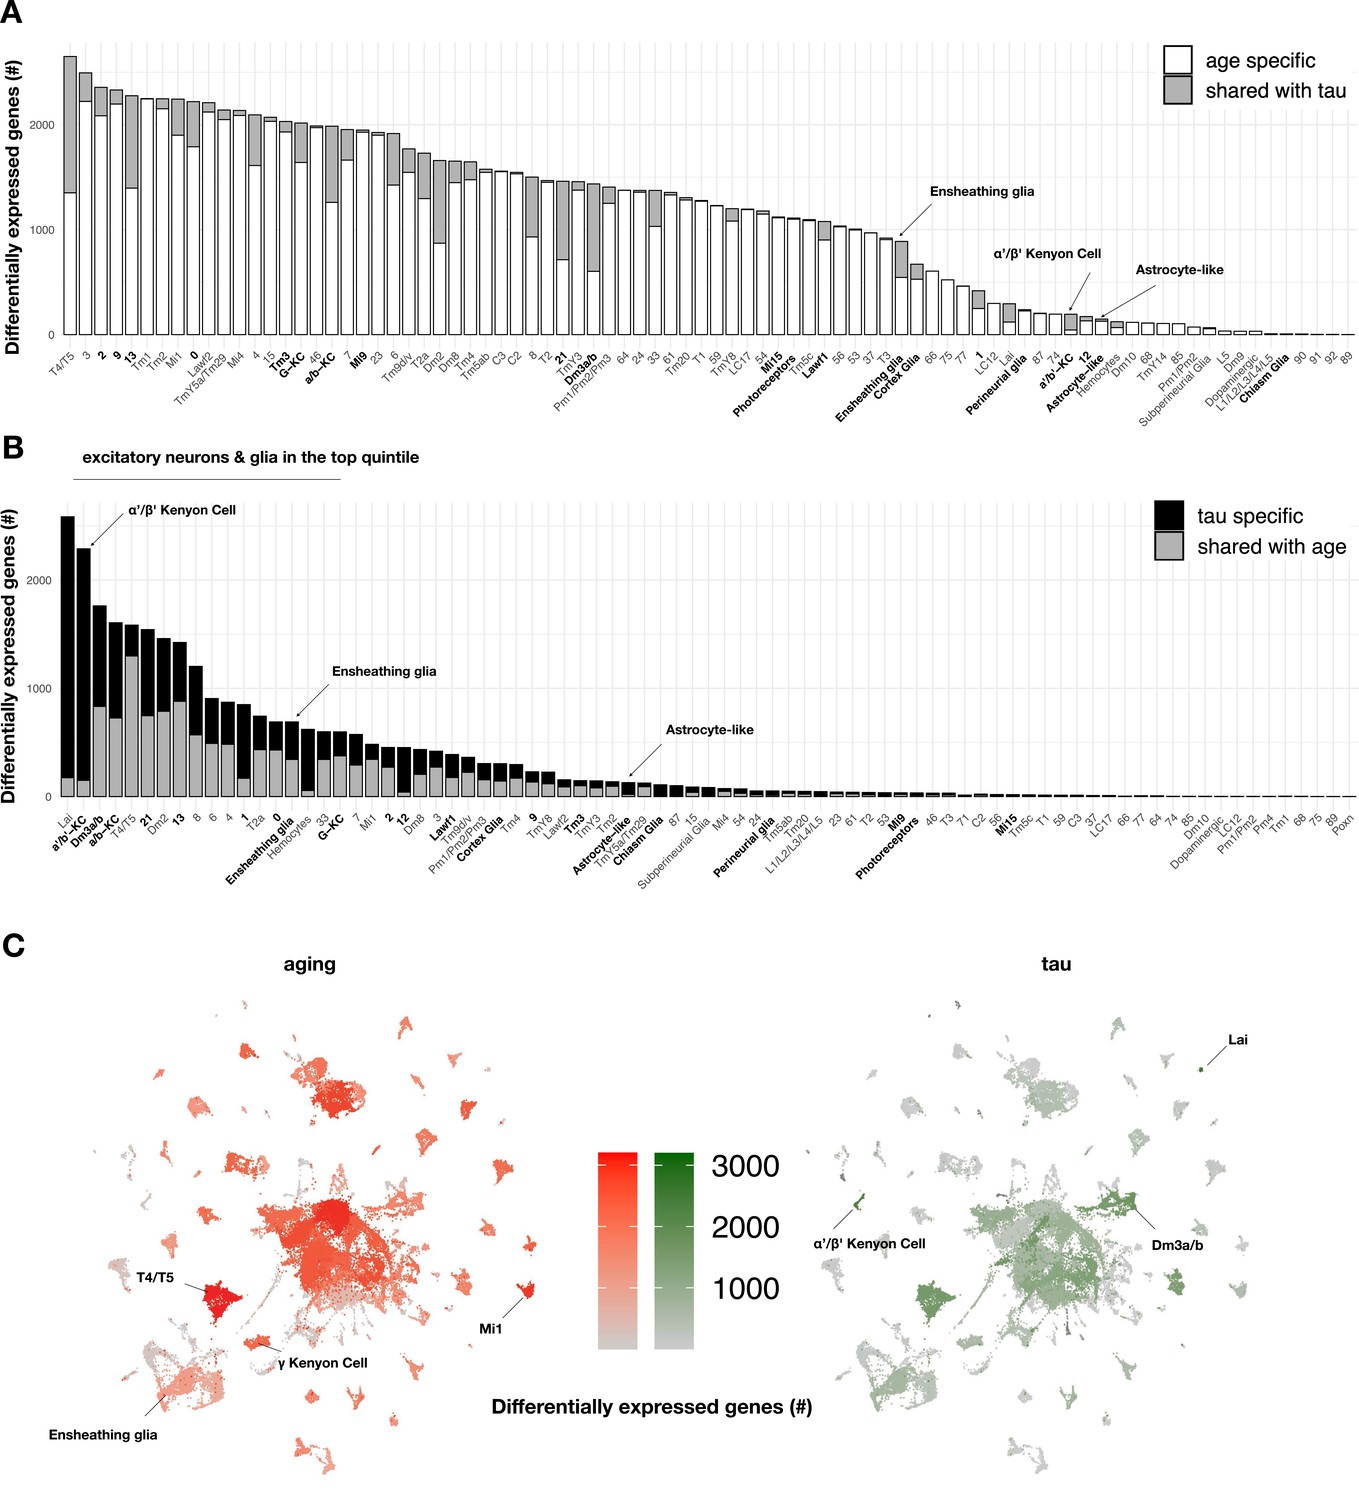
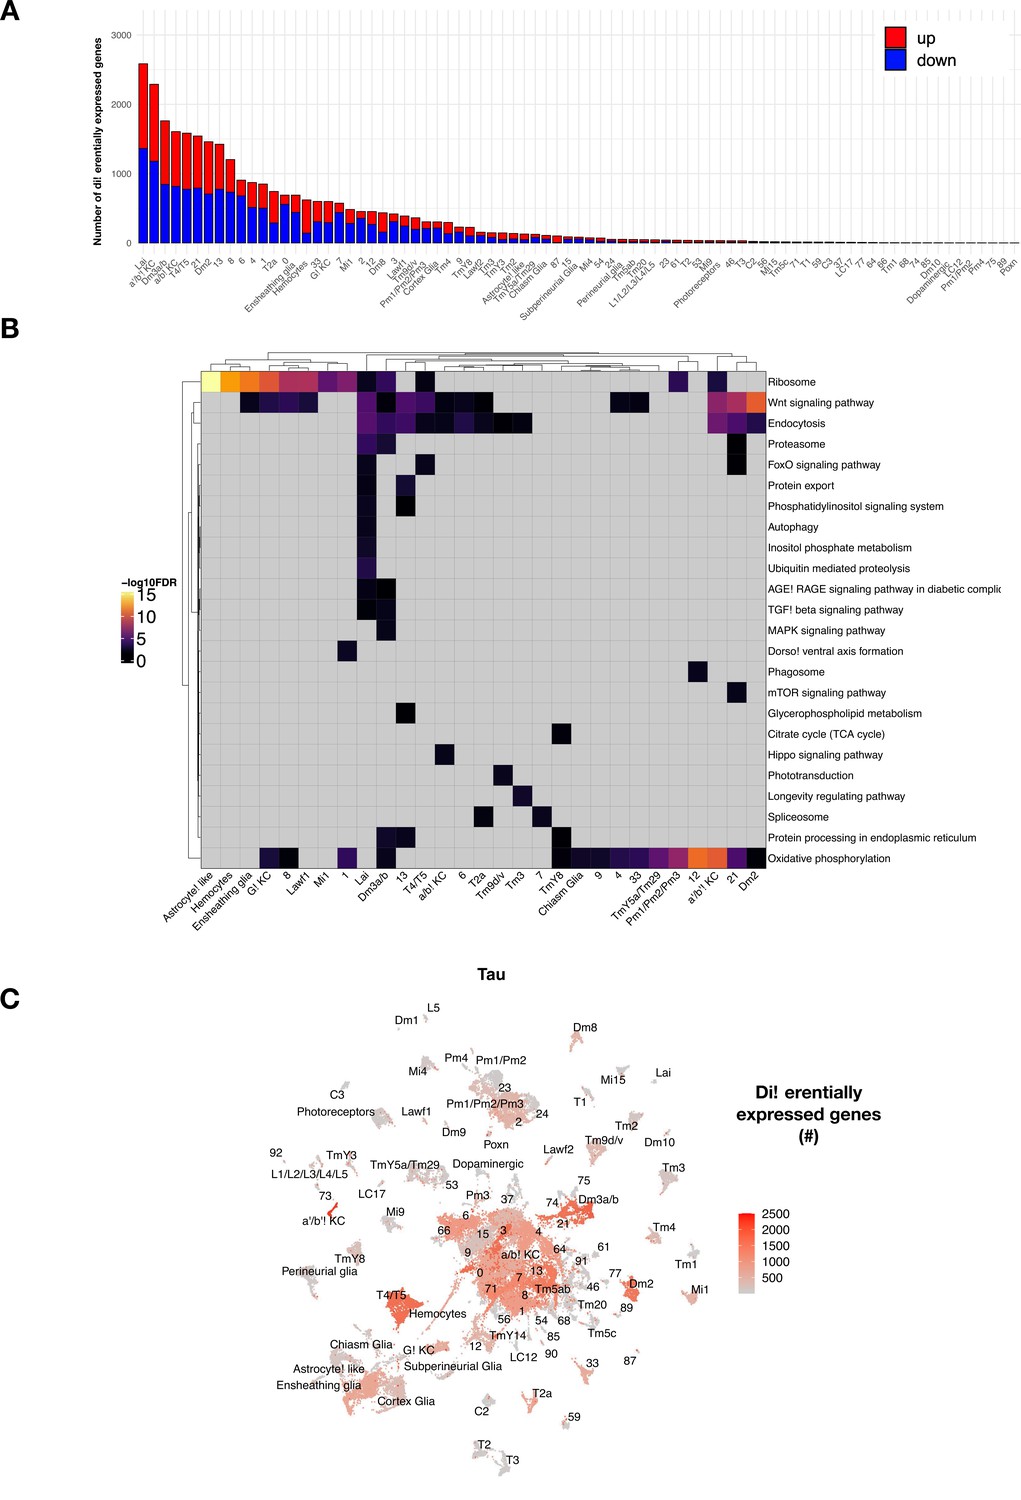
Aging- versus tau-triggered brain gene expression changes.
(A) Aging has widespread transcriptional effects on most brain cell types. Number of aging-induced differentially expressed genes (false discovery rate [FDR] < 0.05) within each cell cluster is shown, based on comparisons of day 1 vs. day 10 and day 10 vs. day 20 in control animals only (elav-GAL4/+). For each cell cluster, the number of gene expression changes unique to aging (white) or overlapping with tau-induced changes (gray) is highlighted. Labels for cell clusters with significant tau-induced cell abundance changes are shown in bold. (B) In contrast with aging, tau induces a more focal transcriptional response, with greater selectivity for excitatory neurons and glia. Number of tau-induced, differentially-expressed genes (FDR < 0.05) within each cell cluster is shown, based on regression models including age as a covariate and considering both control and elav>tauR406W animals (elav-GAL4/+; UAS-tauR406W/+) at 1, 10, and 20 days. For each cell cluster, the number of gene expression changes unique to tau (black) or overlapping with aging-induced changes (gray) is highlighted. Labels for cell clusters with significant tau-induced cell abundance changes are shown in bold. Tau-induced gene expression changes from single-cell profiles significantly overlap with prior analyses conducted using bulk brain RNA-sequencing (Figure 3—figure supplement 2). (C) Uniform manifold approximation and projection (UMAP) plots show the number of aging- (red) versus tau- (green) triggered differentially expressed genes within each cell cluster. Color intensity represents the number of differentially expressed genes. See also Figure 3—figure supplements 1–5 and Figure 3—source data 1–5.
-
Figure 3—source data 1
Tau- and aging-triggered gene expression changes.
Tau-induced differentially expressed genes were adjusted for aging by including a covariate in the regression model, based on comparisons of scRNAseq data elav>tauR406W vs. control (elav-GAL4) at 1, 10, and 20 days. Aging-induced differentially expressed genes are based on comparisons in control (elav-GAL4) flies, including between day 1 (d1) and day 10 (d10), and day 10 vs. day 20 (d20); comparisons are noted in age_comparisons column. The cell cluster being compared is denoted in the cluster column. Avg_logFC is the log2 fold change of gene expression between day 10 vs. day 1 or day 20 vs. day 10; in each entry, the former is the numerator, and the latter is the denominator. For tau vs. control comparisons, the numerator is tau, and the denominator is control. Pct.1 and Pct.2 refer to the percent of cells that have non-zero expression for the given gene in the numerator and denominator, respectively. P_val = uncorrected p-values from the MAST linear regression. Padj = Benjamini–Hochberg-adjusted p-values. Analysis = specifies either ‘control aging’ or ‘tau age-adjusted’ for the respective analyses.
- https://cdn.elifesciences.org/articles/85251/elife-85251-fig3-data1-v2.xlsx
-
Figure 3—source data 2
Functional pathways from differential expression analysis.
Significantly enriched functional terms based on overrepresentation analysis (ORA) of cell-specific differentially expressed gene sets, including from either (i) aging (controls), (ii) tau age-adjusted (elav>tauR406W vs. control (elav-GAL4)), or the (iii) ‘tau-specific’ gene set, which is the unique subset of genes from ii not seen in i. Genes used for functional enrichment analysis have a false discovery rate (FDR) < 0.05 in all differential expression analyses, and all functional enrichment terms listed have a hypergeometric FDR < 0.05. Analysis = source of gene set used for functional enrichment (i–iii, above). Age = relevant age groups of source comparison. Cluster = cell cluster source of gene set. Term_id = identifier of enrichment term. term = description of enriched term. FDR = FDR-corrected p-values. Database = database origin of term.
- https://cdn.elifesciences.org/articles/85251/elife-85251-fig3-data2-v2.xlsx
-
Figure 3—source data 3
Tau-induced gene expression changes in the replication dataset.
Cross-sectional replication analysis comparing differentially expressed genes in an independent dataset from day 10 (elav >tauR406W vs. control (elav-GAL4)). The cell cluster being compared is denoted in the cluster column. Avg_log2FC is the log2 fold change of gene expression between tau vs. control comparisons, the numerator is tau, and the denominator is control. Pct.1 and Pct.2 refer to the percent of cells that have non-zero expression for the named gene in the numerator and denominator, respectively. P_val = unadjusted, raw p-values from the MAST linear regression. Padj = Benjamini–Hochberg-adjusted p-values.
- https://cdn.elifesciences.org/articles/85251/elife-85251-fig3-data3-v2.xlsx
-
Figure 3—source data 4
Cell-type-specific overlaps between tau-induced differentially expressed genes.
Cell-cluster overlaps are quantified between the age-adjusted discovery data (Figure 3—source data 1) and the day 10 cross-sectional replication data (Figure 3—source data 3). Cluster = annotated cell identities or Seurat ID of unannotated clusters. ageAdj_discovery_DEG_n = number of tau-induced differentially expressed genes (FDR < 0.05) in the discovery dataset. d10_CS_replicate_DEG_n = number of differentially expressed genes in the replication dataset. Intersect = number of overlapping differentially expressed genes between results of the two comparisons. percent_of_original = percent of differentially expressed genes in the discovery dataset that is also observed in the replication dataset. Phyper = p-value of hypergeometric tests evaluating whether the number of overlapping genes observed is greater than by chance. tot_genes = total number of unique genes detected in each cell type and shared between datasets used for hypergeometric test.
- https://cdn.elifesciences.org/articles/85251/elife-85251-fig3-data4-v2.xlsx
-
Figure 3—source data 5
Cross-sectional tau-induced differential expression.
Cross-sectional analysis of tau-induced changes (elav>tauR406W vs. control (elav-GAL4)) from the discovery dataset at 1, 10, and 20 days; age = the age being compared. The specific cell cluster being compared is denoted in the cluster column. Avg_log2FC is the log2 fold change of gene expression between tau vs. control comparisons, the numerator is tau, and the denominator is control. Pct.1 and Pct.2 refer to the percent of cells that have non-zero expression for the named gene in the numerator and denominator, respectively. P_val = unadjusted, raw p-values from the MAST linear regression. Padj = Benjamini–Hochberg-adjusted p-values.
- https://cdn.elifesciences.org/articles/85251/elife-85251-fig3-data5-v2.xlsx
Figure 3—figure supplement 1
tau-induced differential gene expression analysis and functional enrichment.
(A) The number of tau-induced, differentially expressed genes are shown following adjustment for aging, but highlighting up- (red) versus down- (blue) regulated genes. Data presented is otherwise same as that shown in Figure 3B, based on comparisons of control (elav-GAL4/+) and elav>tauR406W (elav-GAL4/+; UAS-tauR406W/+). (B) Heatmap shows significant KEGG terms from functional enrichment analysis of tau-induced differentially expressed genes, including pathways that are active in cell-type specific vs. more global patterns. Nonsignificant test results are shown in gray, whereas positive results (hypergeometric test, false discovery rate [FDR] < 0.05) are shaded based on significance level [-log10(FDR)]. Only cell clusters with at least one significant KEGG term enrichment are displayed. (C) UMAP displaying the number of age-adjusted tau-induced differentially expressed genes with rescaled color values for better visualization of dynamic range.
Figure 3—figure supplement 2
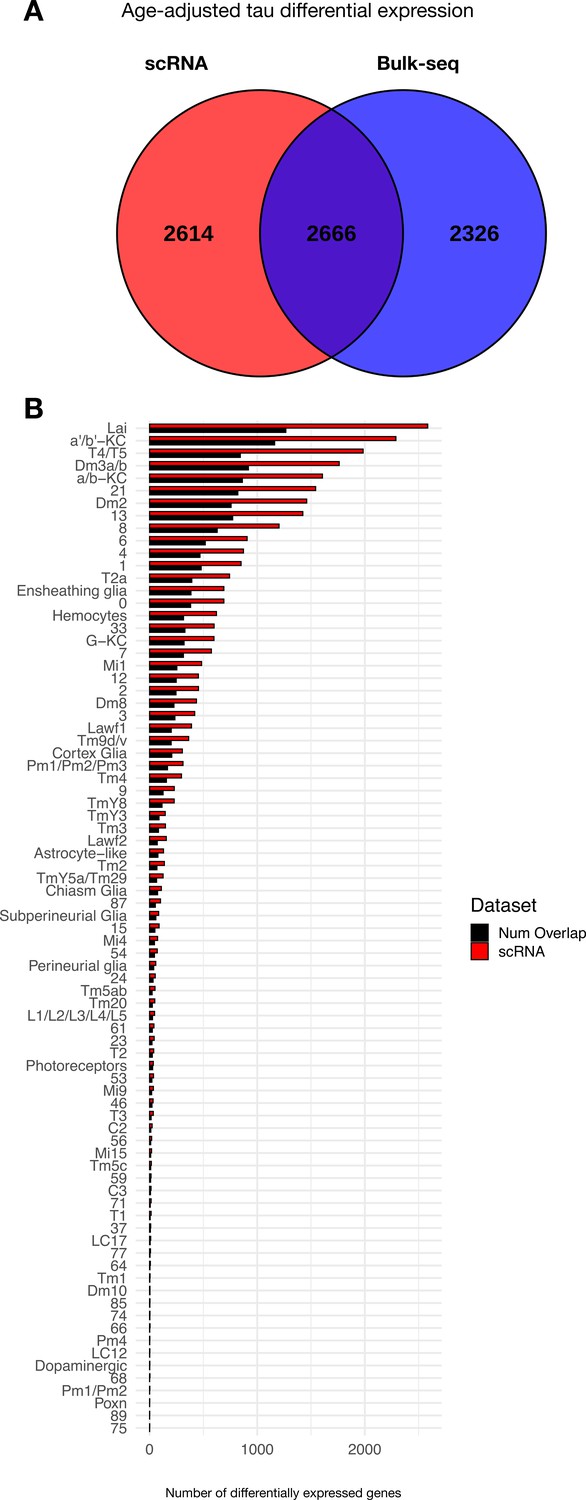
Overlap between tau-induced adult brain gene expression changes between Drosophila scRNAseq and bulk-tissue RNA-sequencing.
(A) Venn diagram illustrates the number of tau-induced differentially expressed genes in bulk (blue) vs. single-cell (red) RNAseq. These complementary analyses consider identical genotypes and timepoints, including control (elav-GAL4/+) and elav>tauR406W (elav-GAL4/+; UAS-tauR406W/+) transgenic flies profiled at 1, 10, and 20 days. Both regression analyses similarly adjust for age. (B) Plot shows the number of tau-induced differentially expressed genes per cell cluster from scRNAseq data (red), and the number of overlapping, differentially expressed genes from bulk tissue RNAseq (black). Overall, genes that are uniquely differentially expressed in the scRNAseq data (n = 2614 genes) are restricted to fewer cell clusters, whereas shared gene expression changes (n = 2666 genes) are expressed more broadly that are observed in both platforms (shared differentially expressed genes, 2666 genes). Further, genes that are uniquely differentially expressed in bulk RNAseq data, where sequencing reads are not diluted across individual cells, tend to be expressed at lower levels when compared to those that are shared.
Figure 3—figure supplement 3

Volcano plots for selected excitatory neurons and glial populations.
Volcano plots (gene expression log2 fold change vs. -log10(FDR)) of select cell-type clusters with the most tau-induced differentially expressed genes, including (A) α'/β' Kenyon cells, (B) α/β Kenyon cells, (C) γ Kenyon cells, (D) Lai, (E) Dm3a/b, (F) astrocyte-like glia, (G) perineurial glia (clusters 19 and 44), and (H) ensheathing glia. Genes with the top -log10(FDR) or log2 fold change are labeled.
Figure 3—figure supplement 4

Expression of the MAPT transgene.
(A) Uniform manifold approximation and projection (UMAP) plot showing widespread MAPT transgene expression across in elav>tauR406W (elav-GAL4/+; UAS-tauR406W/+) animals. The pan-neuronal elav-GAL4 driver induces widespread expression of tau. All gene expression data are displayed as normalized gene counts (‘Materials and methods’). (B) Plot showing insignificant Pearson correlation between the absolute value of cell abundance changes reported in Figure 2B and the mean MAPT expression level per cluster (R = −0.14, p=0.2). (C) Plot showing overall poor Pearson correlation (R = −0.0079, p=0.95) between number of tau-induced gene expression changes (y-axis) and the mean MAPT expression level per cell cluster (x-axis). (D) Neuronal vs. glial mean MAPT expression per cell cluster. Quantitation based on n=8 glia and n=82 neurons. Error bars denote 95% confidence intervals.
Figure 3—figure supplement 5
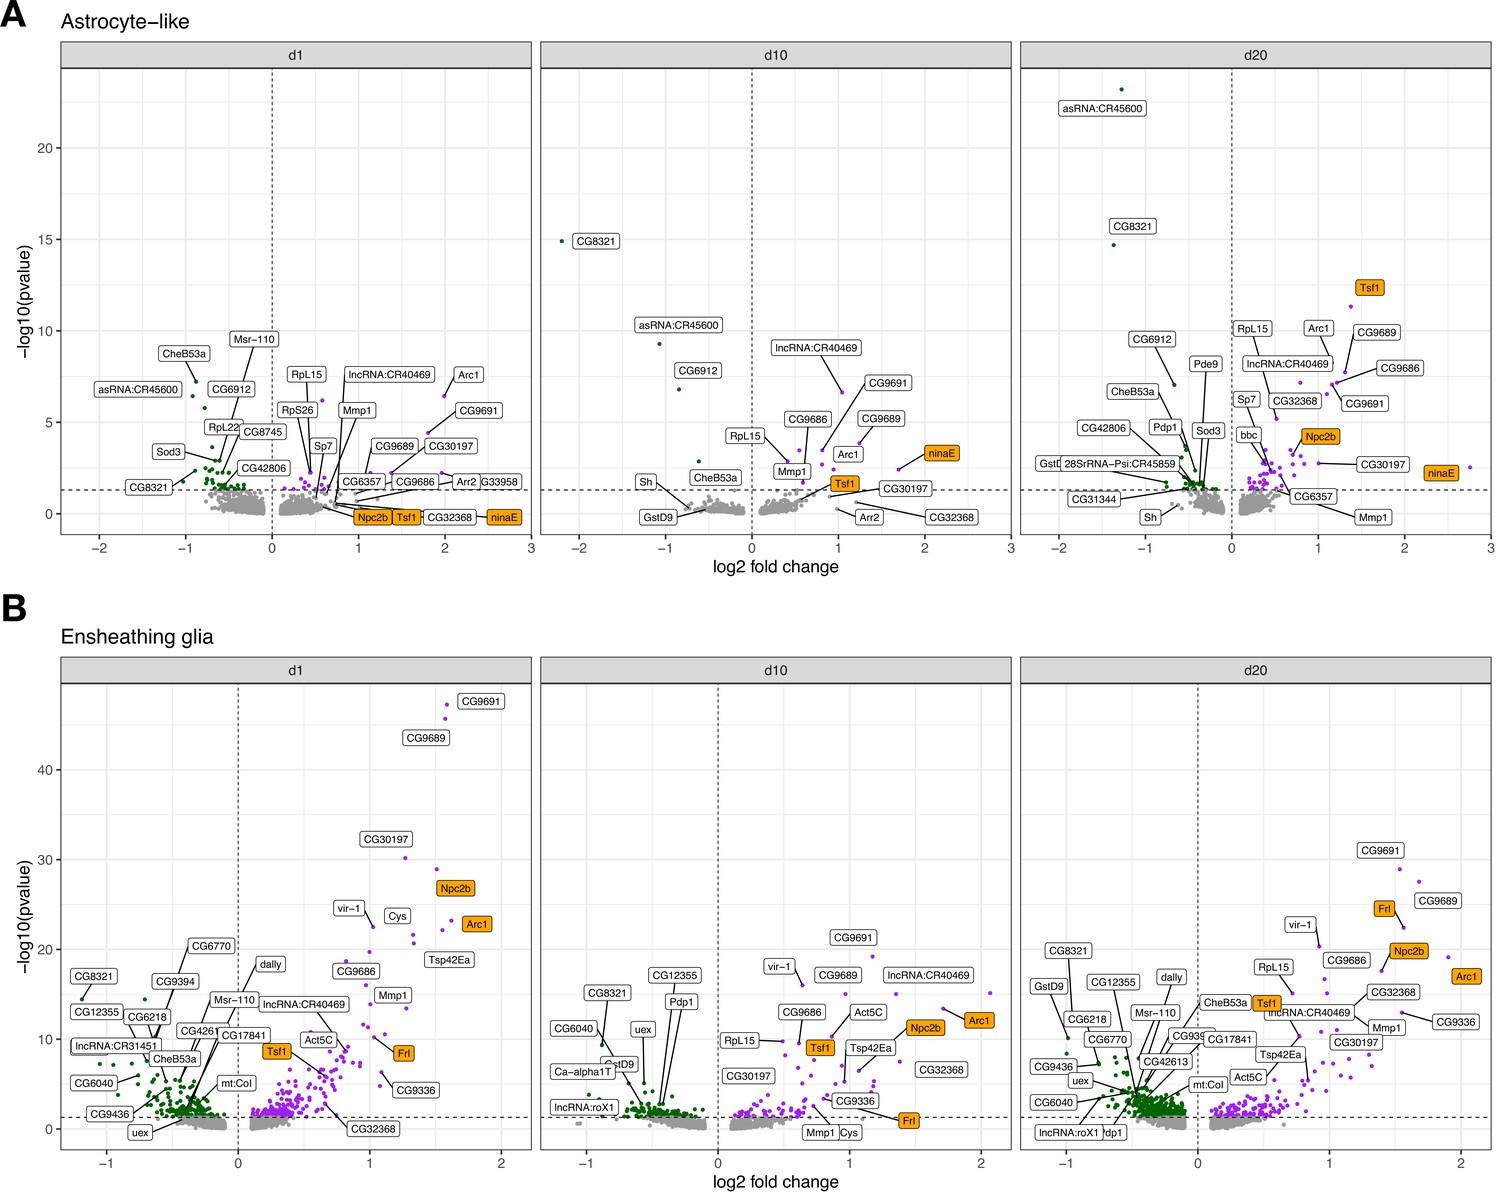
Volcano plots for cross-sectional tau-induced differentially expressed genes.
A cross-sectional visualization of differential gene expression changes for (A) astrocyte-like glia and (B) ensheathing glia demonstrating progressive, age-dependent gene expression changes. Top genes ranked by -log10(FDR) or log2 fold change are labeled, and several notable age-dependent changes are highlighted in orange. Comprehensive cross-sectional differential expression results are provided in Figure 3—source data 5.
Figure 4 with 8 supplements
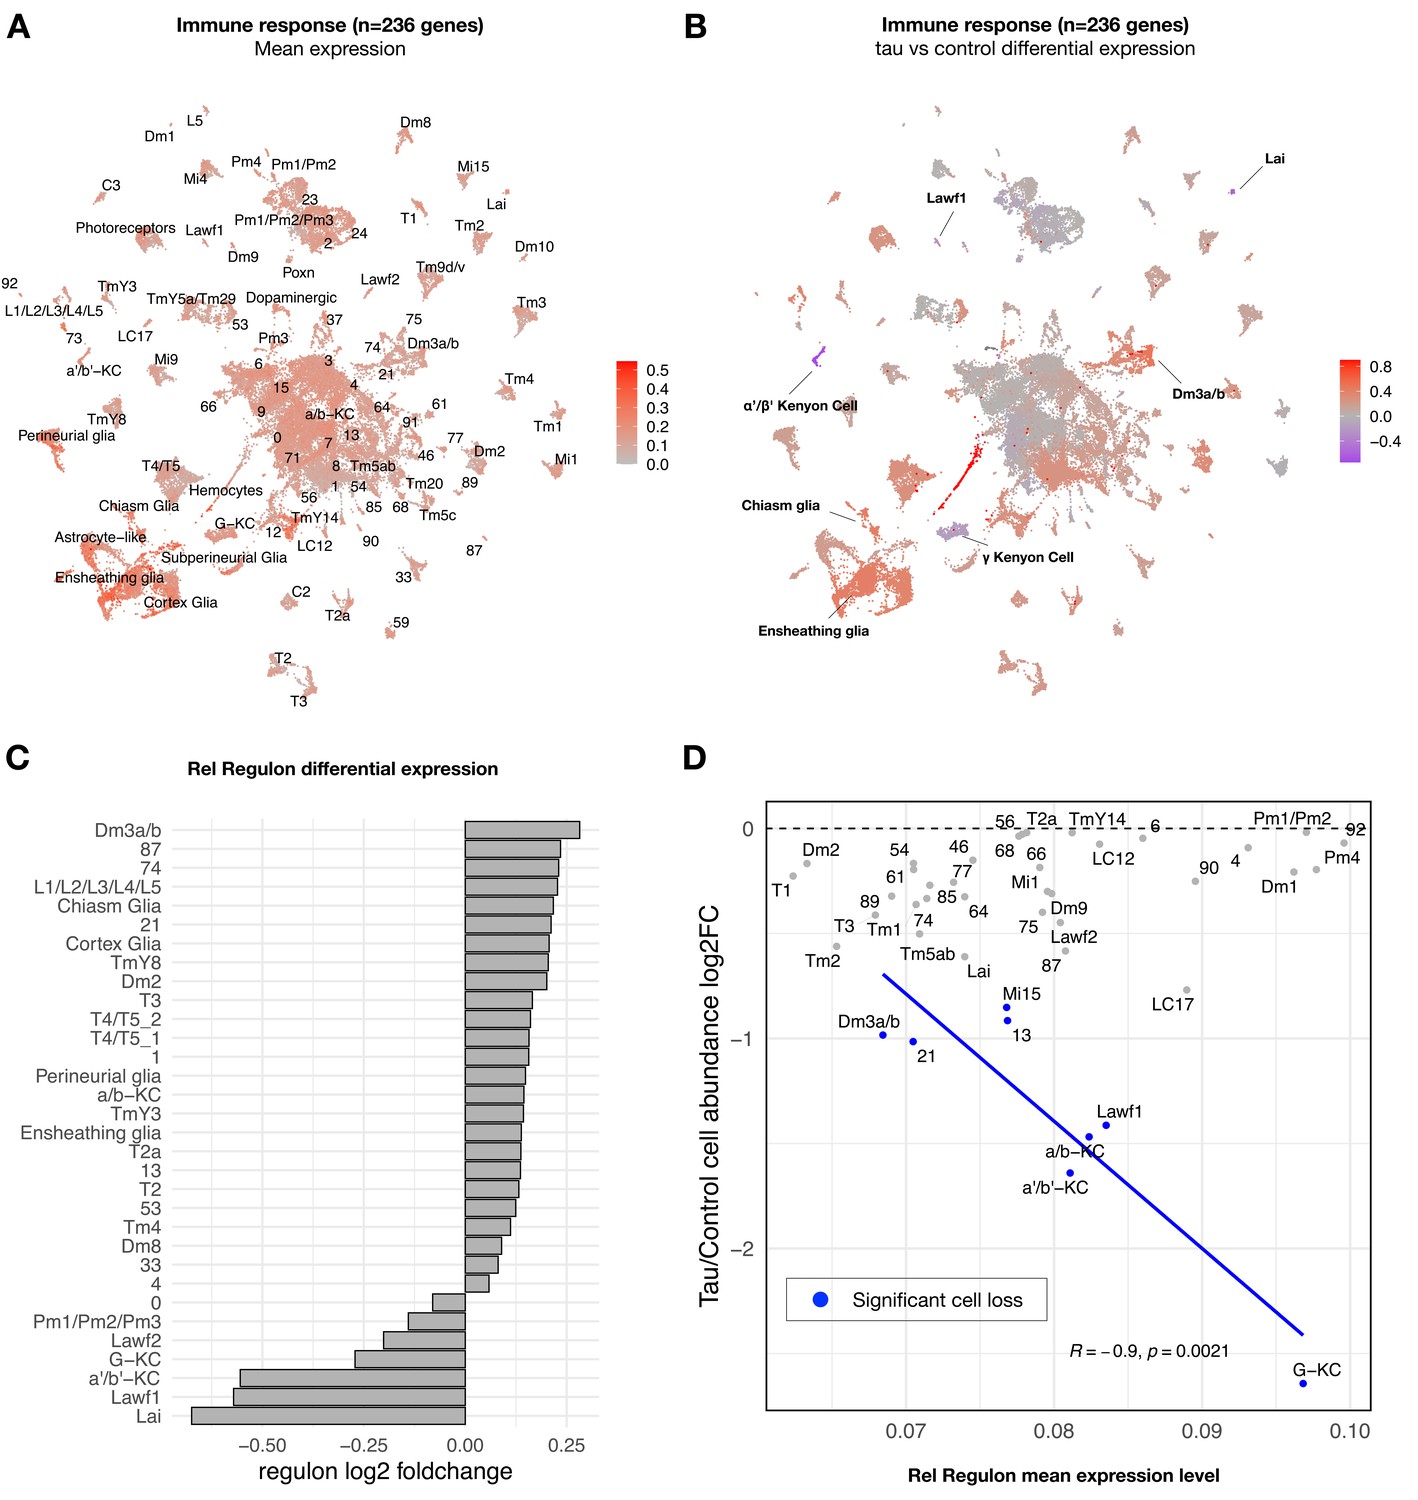
Tau-induced changes in innate immune response genes and neuronal vulnerability.
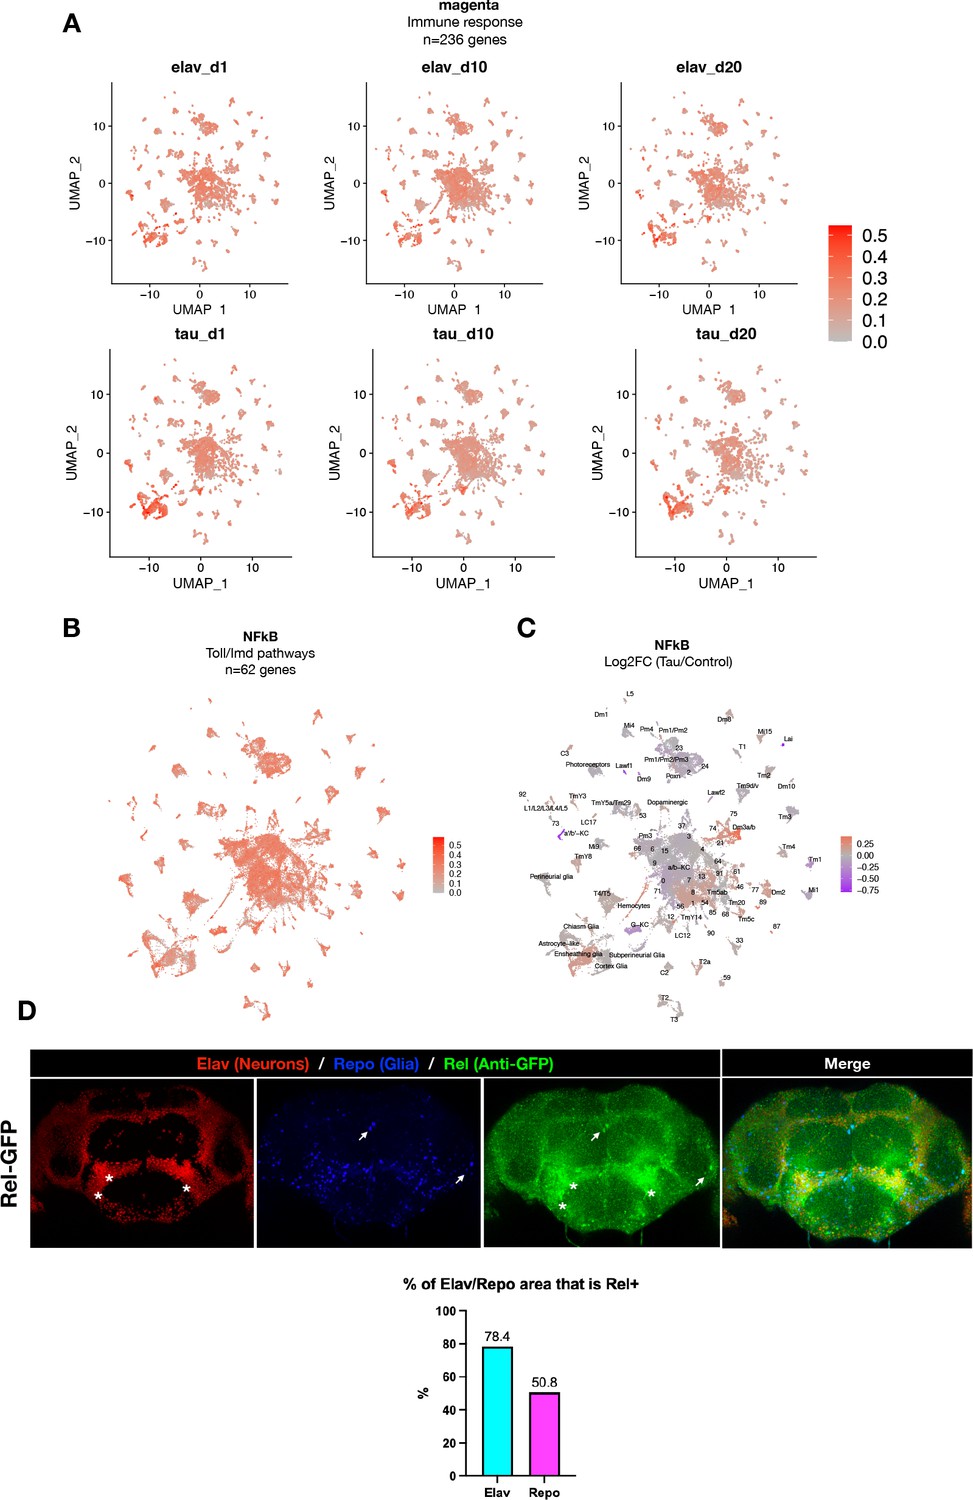
(A) Innate immune genes are expressed broadly in the adult fly brain, including both neurons and glia. Plot shows mean overall normalized expression by cell cluster among n = 236 genes belonging to a tau-induced coexpression module that is significantly enriched for innate immune response pathways (Mangleburg et al., 2020). In this plot, gene expression was averaged across both elav>tauR406W and control cells; similar results are seen when stratifying by either age or genotype (Figure 4—figure supplement 2A). See also Figure 4—figure supplement 2D for experimental confirmation of NFκB/Rel protein expression in neurons and glia. (B) Tau activates or suppresses innate immune response genes in a cell-type-specific manner. Plot shows log2 fold-change mean expression per cell cluster for the same 236-gene immune response coexpression module, based on comparisons between elav>tauR406W (elav-GAL4/+; UAS-tauR406W/+) and control (elav-GAL4/+) flies. See also Figure 4—figure supplement 2B and C for plots of curated NFκB signaling pathway genes and Figure 4—figure supplement 3 for similar analyses of other coexpression modules. (C) Log2 fold-change in Relish (Rel) regulon gene expression per cluster is shown, based on comparisons between tauR406W and control flies. All results were significant (false discovery rate [FDR] < 0.05) based on regression models including age as a covariate. (D) Plot shows overall mean expression of the Rel-regulon (x-axis) versus tau-induced cell abundance change (y-axis). Among clusters with significant, tau-induced cell loss (denoted in blue, FDR < 0.05; see also Figure 2A), cell abundance change was inversely correlated with Rel regulon expression (Pearson correlation: R = –0.9, p=0.0021). Many other cell types without significant cell abundance changes are also shown in gray. Both control and tau cells are pooled for this analysis. See also Figure 4—figure supplements 1–8 and Figure 4—source data 1–4.
-
Figure 4—source data 1
Tau-induced expression changes in innate immune response genes.
Differential expression of the immune response coexpression module (magenta, Mangleburg et al., 2020), based on comparisons of elav>tauR406W and control (elav-GAL4) animals, adjusting for age. Cluster = cell cluster identity. lrt.pvalues = uncorrected p-values from likelihood ratio test. lrt.padj = Benjamini–Hochberg-adjusted p-value. log2FC = log2 fold change of mean immune module expression between tau and controls for each cell cluster.
- https://cdn.elifesciences.org/articles/85251/elife-85251-fig4-data1-v2.xlsx
-
Figure 4—source data 2
Regulon coexpression networks.
183 regulons and member genes are denoted with the (+) notation, indicating that genes within these modules are positively co-expressed.
- https://cdn.elifesciences.org/articles/85251/elife-85251-fig4-data2-v2.xlsx
-
Figure 4—source data 3
Differential regulon expression analysis.
Regulon expression per cell was defined as the mean expression of regulon member genes. For each cell type, regulon expression across all cells was regressed on genotype [elav>tauR406W vs. control (elav-GAL4)] and age, and a likelihood ratio test was performed against a reduced model with age only. Cluster = cell identity. Regulons = regulon used in statistical testing. lrt.pvalues = unadjusted p-values from likelihood ratio test. lrt.padj = Benjamini–Hochberg-adjusted p-values. log2FC = log2 fold change of mean regulon expression between tau and control.
- https://cdn.elifesciences.org/articles/85251/elife-85251-fig4-data3-v2.xlsx
-
Figure 4—source data 4
Predictors of tau-triggered cell proportion changes.
Comprehensive list of retained, non-zero coefficients from the elastic net regression models considering expanded list of 2993 predictor variables and cell clusters showing significant, tau-induced reductions in cell abundance. Term = a variable in the elastic net multiple regression. Elastic net coefficient = the coefficient for the specified variable in the final regression model.
- https://cdn.elifesciences.org/articles/85251/elife-85251-fig4-data4-v2.xlsx
Figure 4—figure supplement 1
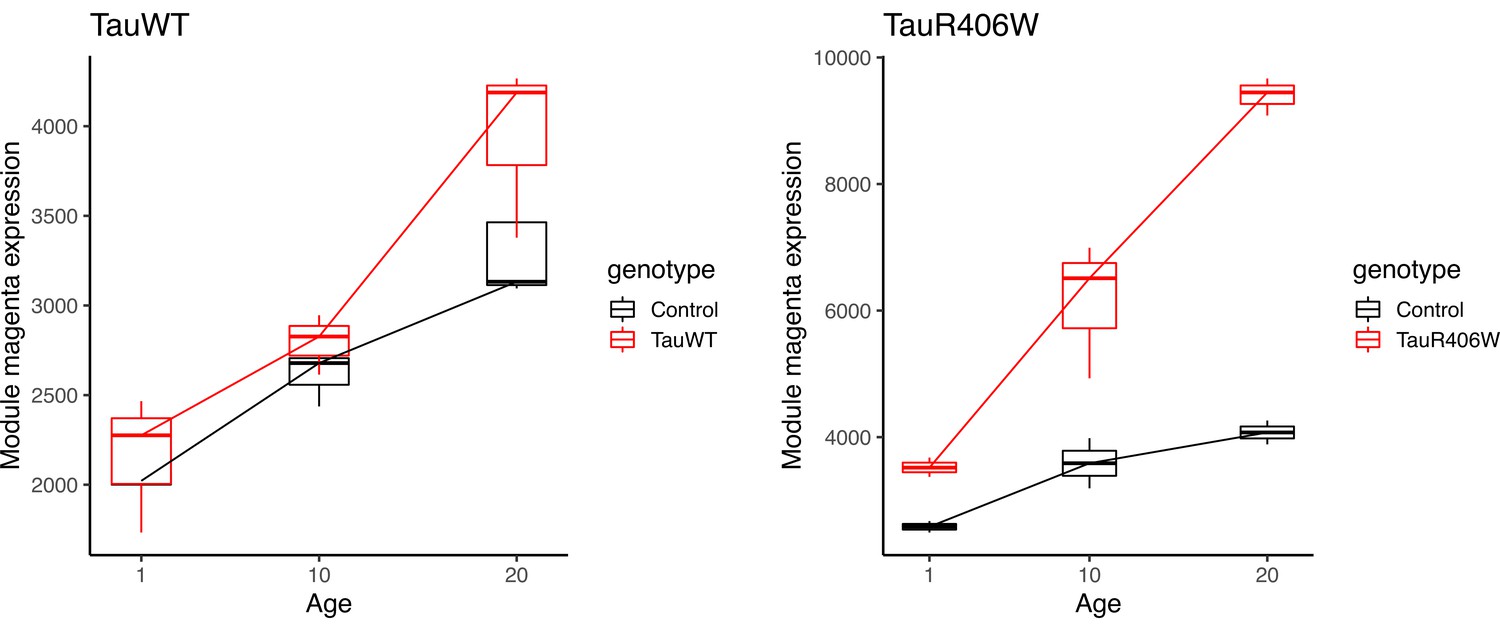
Mean expression of the innate immune (magenta) module in bulk-tissue RNAseq.
Previously published bulk-tissue RNAseq data from Mangleburg et al., 2020 showing age-dependent increases in innate immune module expression in both tauWT and tauR406W transgenic Drosophila. Module mean expression is plotted for each sample (n = 3 per condition).
Figure 4—figure supplement 2
Expression of immune response and NFκB genes in Drosophila brain.
(A) Plots showing mean expression of the immune response gene coexpression module (n = 236 genes), based on analyses of scRNAseq data stratified by genotype (control vs. elav>tauR406W) or age (1, 10, or 20 days). Innate immune signaling appears to be broadly expressed across brain cell types for all conditions. (B) Plot shows mean overall normalized expression by cell cluster among n = 62 curated NFκB signaling pathway genes (see ‘Materials and methods’ for full list). In this plot, gene expression was averaged across both elav>tauR406W and control cells. Results are similar to that seen for the immune response coexpression model (Figure 4A). (C) Plot shows log2 fold-change mean expression per cell cluster for the same 62-gene NFκB signaling mediators, based on comparisons between elav>tauR406W and control flies. Results are similar to that seen for the immune response coexpression model (Figure 4B). (D) Experimental confirmation of Relish expression in adult Drosophila brains. Whole mount immunofluorescence of adult brains from Rel-GFP flies, in which the endogenous Relish protein harbors an amino-terminal GFP tag in homozygosity in an otherwise wildtype genetic background (y, w; PBac{GFP.FPTB-Rel}VK00037). Rel-GFP (Anti-GFP, green) were stained for neuronal nuclei (anti-Elav, red), glia (anti-Repo, blue). The asterisks and arrows denote Rel expression/localization to neuronal and glial nuclei, respectively. Quantification of % overlap between Elav or Repo with GFP is also shown. See also Figure 4—figure supplement 6 for experiments demonstrating specificity of the Rel-GFP line.
Figure 4—figure supplement 3
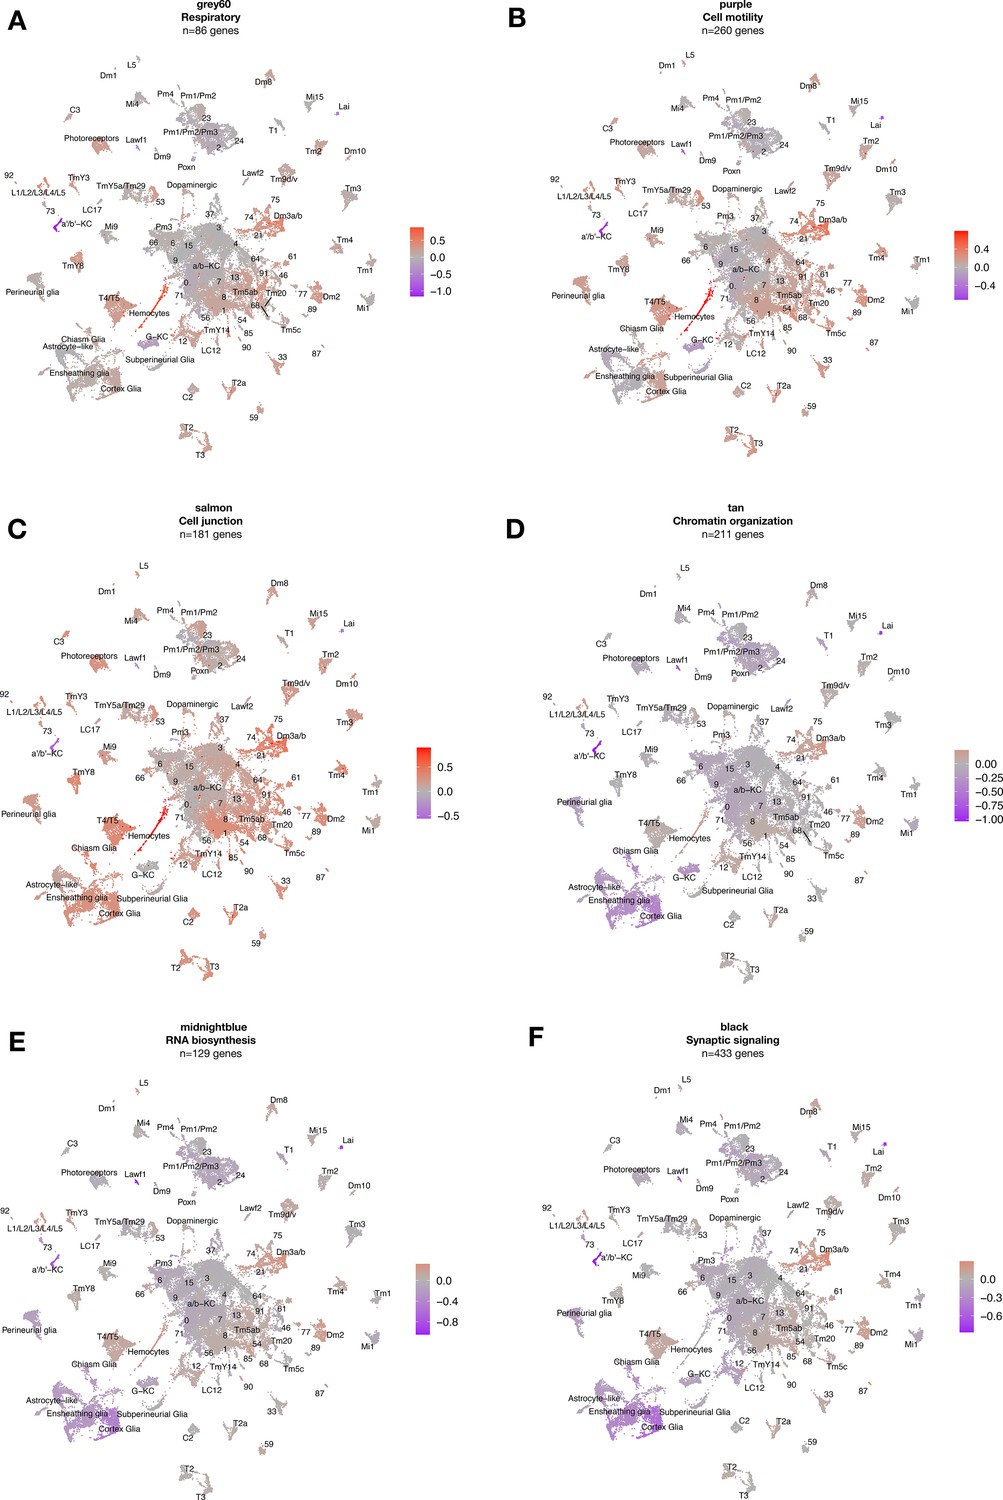
Cell-type-specific expression of tau-induced gene coexpression modules.
Uniform manifold approximation and projection (UMAP) plots show gene expression changes for several published, tau-triggered gene coexpression modules. Color scale shows mean gene expression changes per cell cluster (log2FC), based on scRNAseq data from elav>tauR406W (elav-GAL4/+; UAS-tauR406W/+) and control (elav-GAL4/+) flies. Modules are functionally enriched for genes involved in (A) respiration, (B) cell motility, (C) cell junctions, (D) chromatin organization, (E) RNA biosynthesis, and (F) synaptic signaling, as previously described (Mangleburg et al., 2020).
Figure 4—figure supplement 4
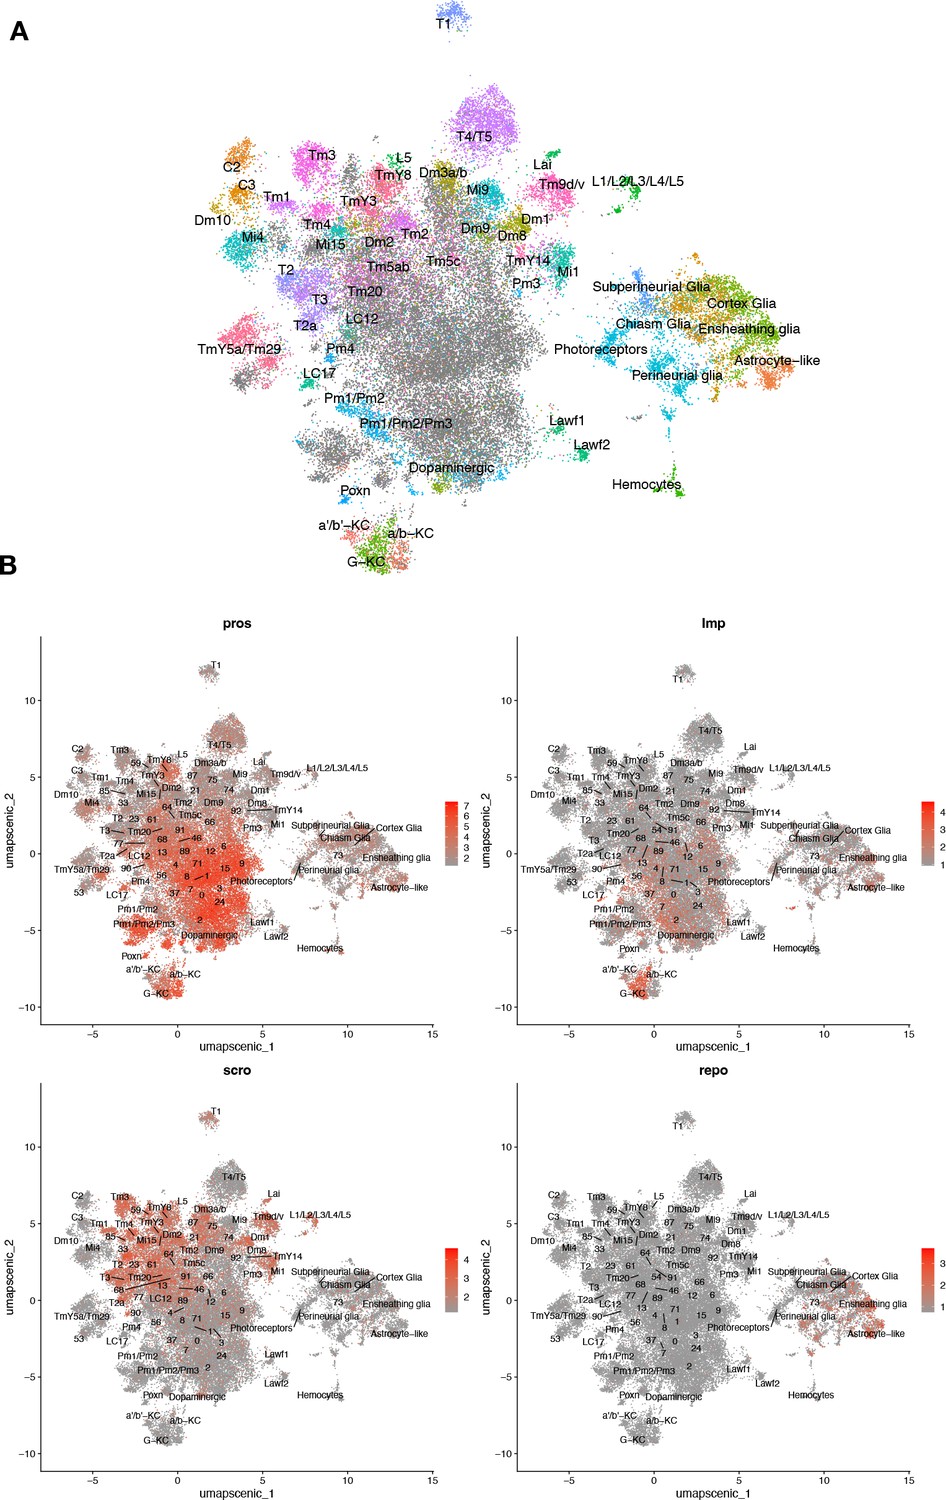
Unsupervised clustering based on regulon coexpression networks.
(A) Uniform manifold approximation and projection (UMAP) plots show relationships among 48,111 cells based on 183 regulons (cell-level regulon activity scores). (B) Cell-specific expression of brain cell marker genes. Whereas Pros and Imp expression appears widespread, scro show more restricted expression to optic lobe neurons, and repo expression is limited to glia.
Figure 4—figure supplement 5

Cross-sectional differential expression of the Rel regulon (n = 442 genes).
Select-cell clusters where the Rel regulon is differentially expressed in at least one time point while also demonstrating age-progressive change. Y-axis denotes log2 fold change of the Rel regulon between tau and control at each time point. Significant log2 fold changes (p<0.05) are colored in gray.
Figure 4—figure supplement 6

Specificity of Rel-GFP animals.
Whole-mount immunofluorescence of adult brains from Rel-GFP flies, in which the endogenous Relish protein harbors an amino-terminal GFP tag in homozygosity in an otherwise wildtype genetic background (y, w; PBac{GFP.FPTB-Rel}VK00037). Brains were co-stained for Rel-GFP (Anti-GFP, green) and (anti-Rel, red) to establish specificity. Neuronal nuclei (anti-Elav, grayscale) are also highlighted as a counterstain.
Figure 4—figure supplement 7
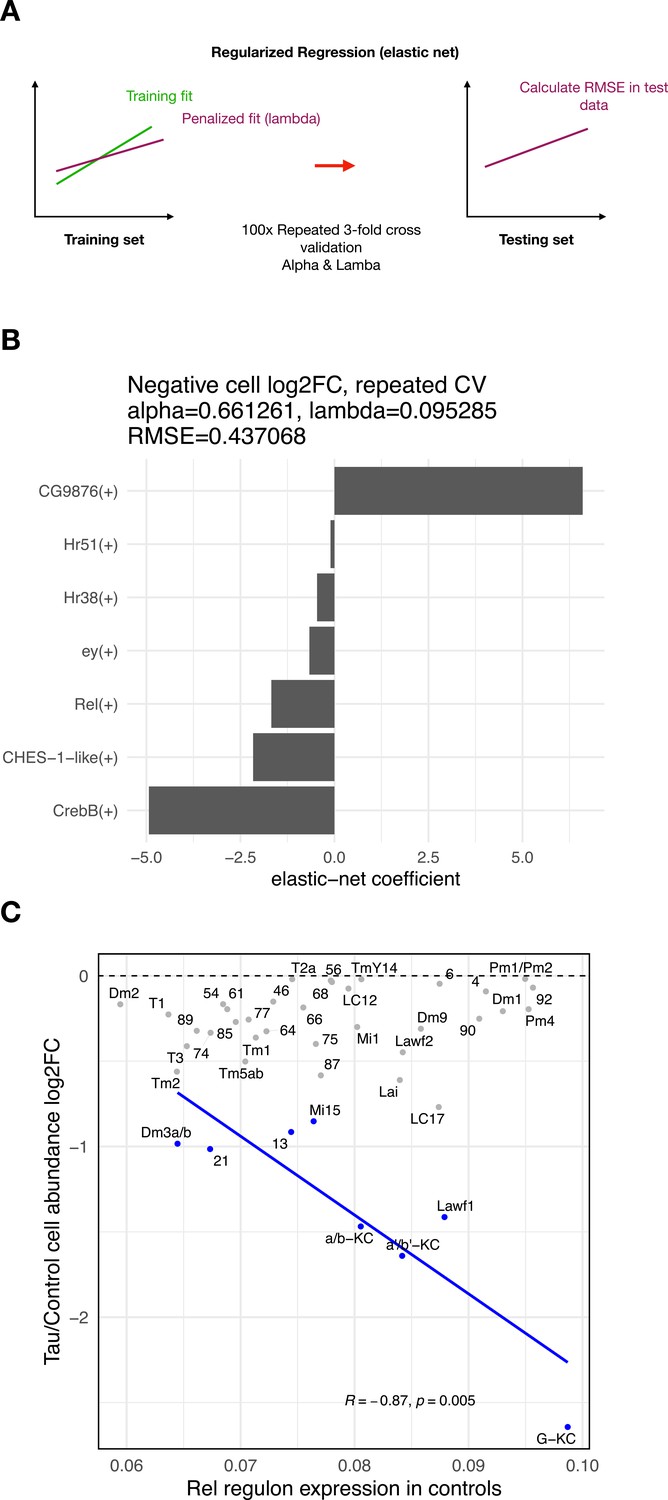
Regulons associated with tau-induced cell vulnerability.
(A) Schematic showing analytic strategy to identify regulon expression networks that predict tau-triggered cell loss. We implemented elastic net regression to examine the relation between regulon expression (predictor variable) and cell abundance changes (response variable) for clusters showing significant tau-induced cell abundance changes. Threefold cross-validation was repeated 100 times for hyperparameter tuning (alpha-lambda). (B) Plot showing the regression coefficients for prioritized regulons (out of 183 total) that predict cell abundance changes in elav>tauR406W flies. The Rel regulon was the third ranked predictor for the severity of neuronal loss. (C) We replotted Figure 4D, showing the relation between Rel regulon expression, but restricted to control animals, and tau-induced cell abundance changes. Among clusters with significant, tau-induced cell loss (denoted in blue, false discovery rate [FDR] < 0.05), cell abundance change remained inversely correlated with Rel regulon expression (Pearson correlation: R = –0.87, p=0.005).
Figure 4—figure supplement 8

Pan-neuronal knockdown of Rel in tauR406W flies.
(A) elav>tauR406W (elav-GAL4/+; UAS-tauR406W/+) flies show age-dependent neurodegeneration compared with controls (elav-GAL4/+), based on hematoxylin and eosin stained sections from 10-day-old animals. Knockdown of Rel using RNA-interference (RNAi) (elav-GAL4/+; UAS-Rel.RNAi-1/+; UAS-tauR406W/+ or elav-GAL4/+; UAS-tauR406W/UAS-Rel.RNAi-2) (RNAi-1: v49414; RNAi-2: HMS00070). Scale bar = 50 um. Arrows point to representative vacuoles. (B) For each genotype, the mean number of vacuoles per section was quantified (n = 8–15 per group). Each dot indicates the mean number of vacuoles across 10–11 sections from a single brain. Vacuoles equal or greater than 5 um in diameter within the central complex were quantified in each section. Error bars represent 95% confidence intervals. No significant statistical difference between elav>tauR406W and elav>tauR406W + RNAi was observed using Welch’s t-test.
Figure 5 with 3 supplements
Conservation of cell-type-specific gene expression signatures.
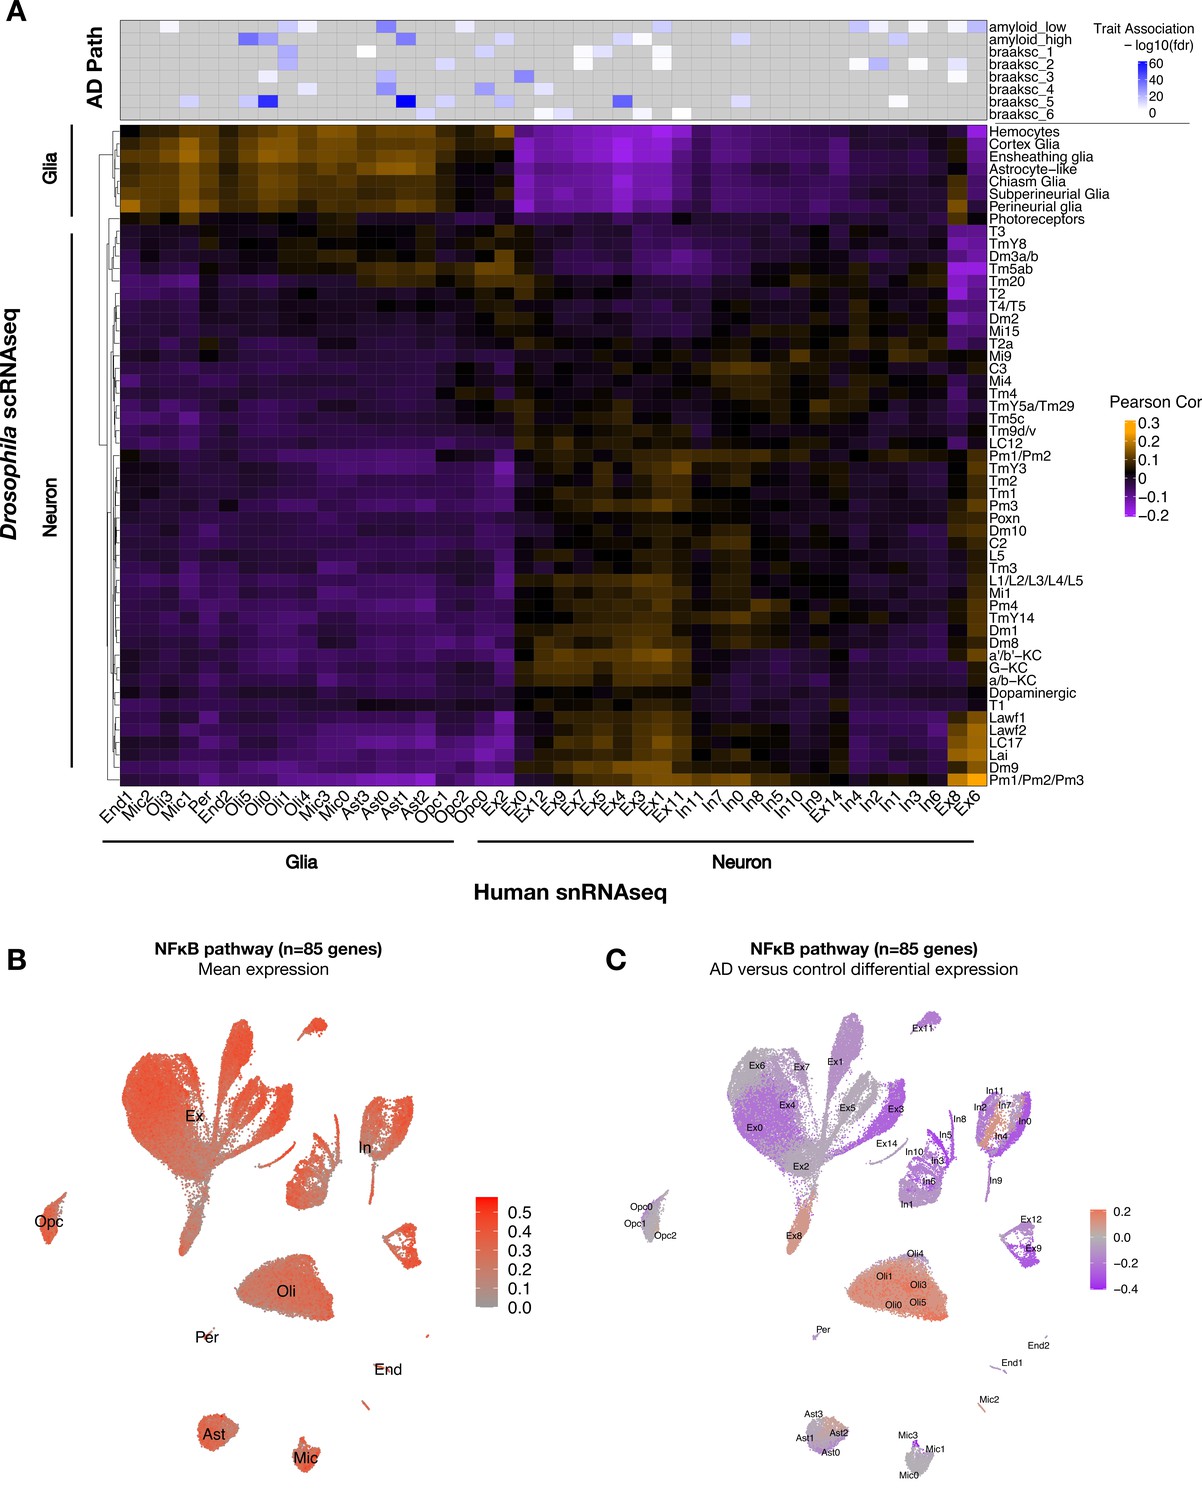
(A) Heatmap shows Pearson correlation of gene expression (5630 conserved, orthologous genes) between annotated cell clusters from Drosophila (rows) and human postmortem brain (column). Human brain single-nucleus RNA-sequencing (snRNAseq) was obtained from Mathys et al., 2019, including published cell-type associations with amyloid plaque burden and neurofibrillary tangle Braak staging (braaksc) (top). Annotated human cell types include endothelial cells (End), microglia (Mic), oligodendrocytes (Oli), pericytes (Per), astrocytes (Ast), oligodendrocyte precursor cells (Opc), excitatory neurons (Ex), and inhibitory neurons (In). (B) Innate immune mediators are expressed broadly in the human brain, including in neurons and glia. Plot shows mean expression by cell cluster for 85 human orthologs of NFκB signaling pathway members, based on reprocessing and analysis of the Mathys et al. snRNAseq data. (C) Alzheimer’s disease (AD) is associated with cell-type-specific perturbation in NFκB signaling genes. Plot shows log2 fold-change mean expression per cell cluster for the same 85 NFκB signaling genes, based on comparisons of brains with AD pathology versus controls. See also Figure 5—figure supplements 1–3 and Figure 5—source data 1.
-
Figure 5—source data 1
Cell-type-specific, Alzheimer’s disease (AD)-associated gene expression changes from human brain.
snRNAseq data from human postmortem brain tissues (Mathys et al., 2019) was analyzed for differentially expressed genes in AD neuropathological cases versus controls without AD pathology. Cell subcluster (subcluster) labels are as defined by the original publication. Pct.1 and Pct.2 refer to the percent of cells that have non-zero expression for the given gene in the numerator and denominator, respectively. Avg_log2FC is the log2 fold change of gene expression between AD vs. control comparisons; the numerator is AD, and the denominator is control. P_val = unadjusted p-values from the MAST linear regression analysis. Padj = Benjamini–Hochberg-adjusted p-values.
- https://cdn.elifesciences.org/articles/85251/elife-85251-fig5-data1-v2.xlsx
Figure 5—figure supplement 1
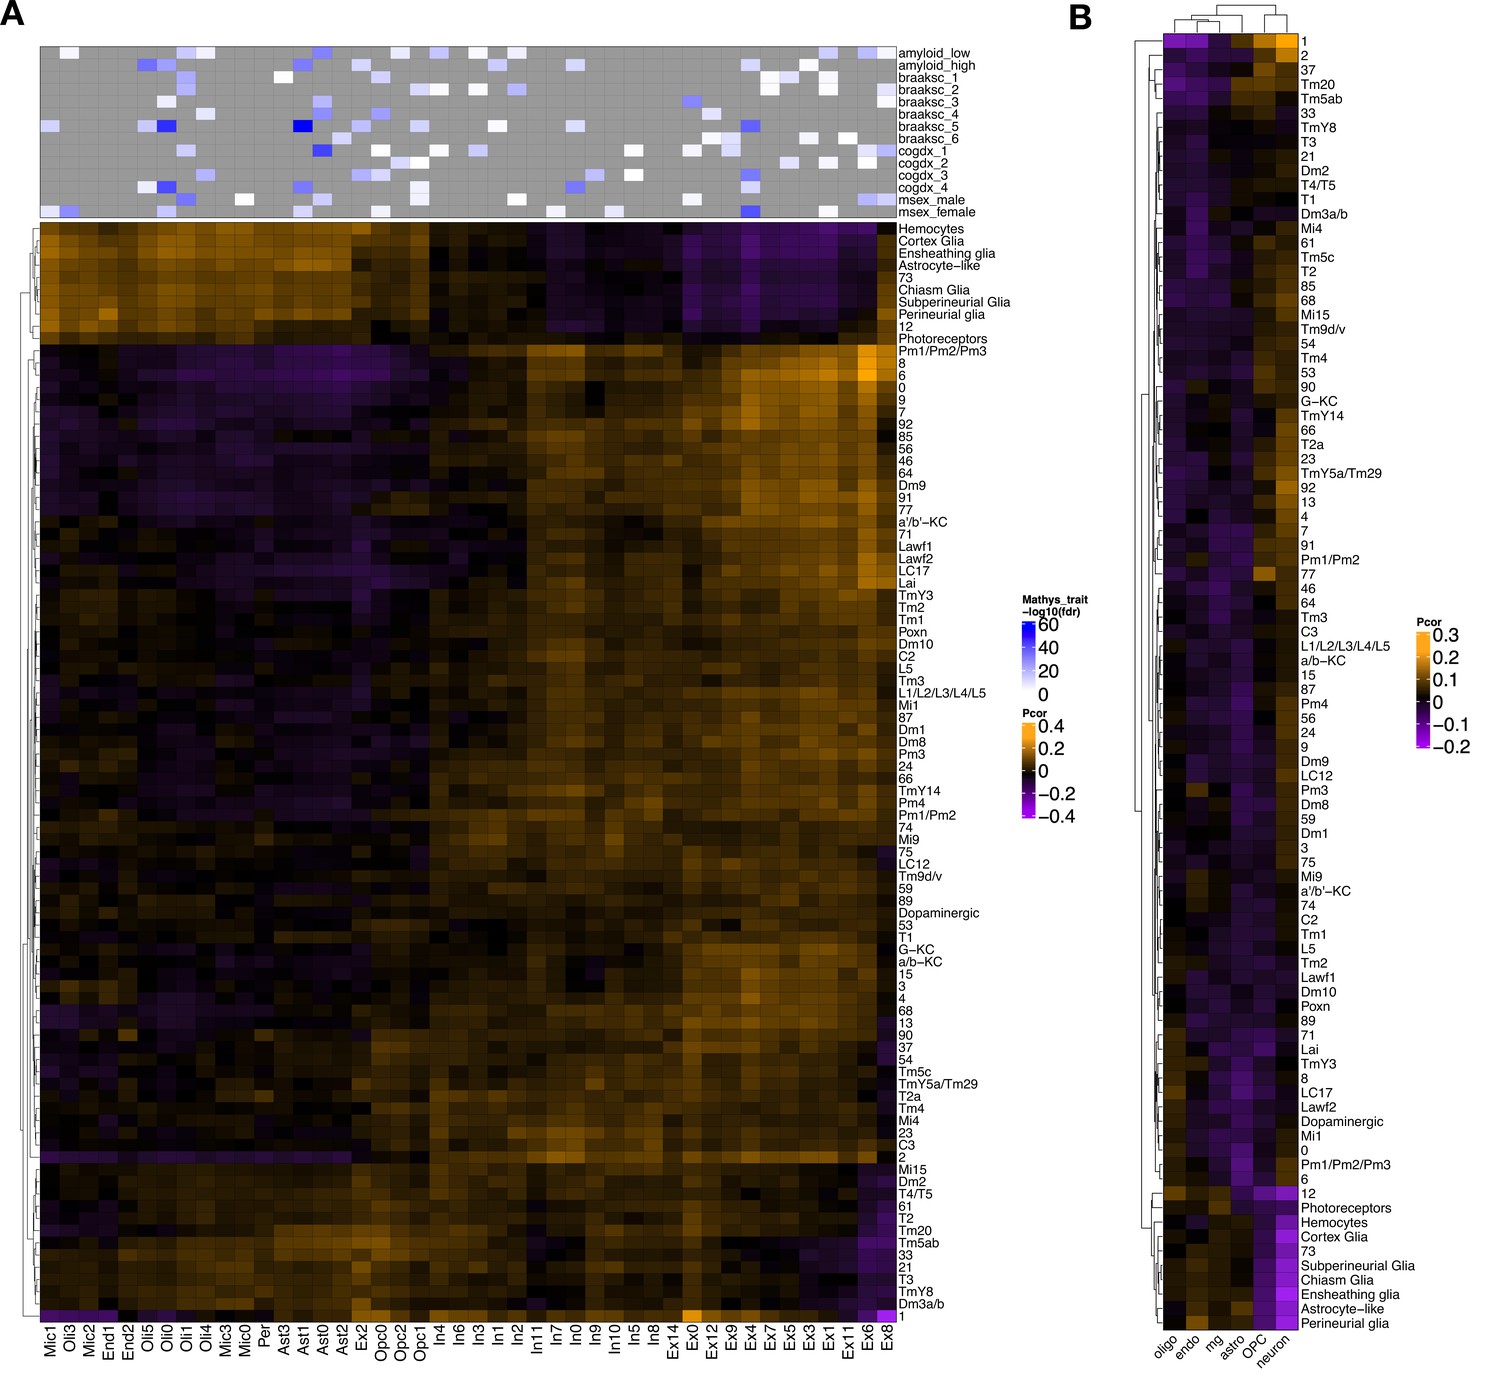
Cross-species gene expression correlation of all Drosophila cell clusters in this study.
(A) Heatmap shows Pearson correlation of gene expression (5630 conserved, orthologous genes in total) between cell clusters from Drosophila (rows) and human postmortem brain (columns; Mathys et al., 2019). Compared with Figure 5A, this plot includes the non-annotated Drosophila cell clusters. (B) Similar heatmap was constructed based on 4145 conserved orthologs from Drosophila and an independent human Alzheimer’s disease (AD) case–control snRNAseq dataset (Grubman et al., 2019). Annotated human cell types include oligodendrocytes (oligo), endothelial cells (endo), microglia (mg), astrocytes (astro), oligodendrocyte precursor cells (OPC), and neurons.
Figure 5—figure supplement 2
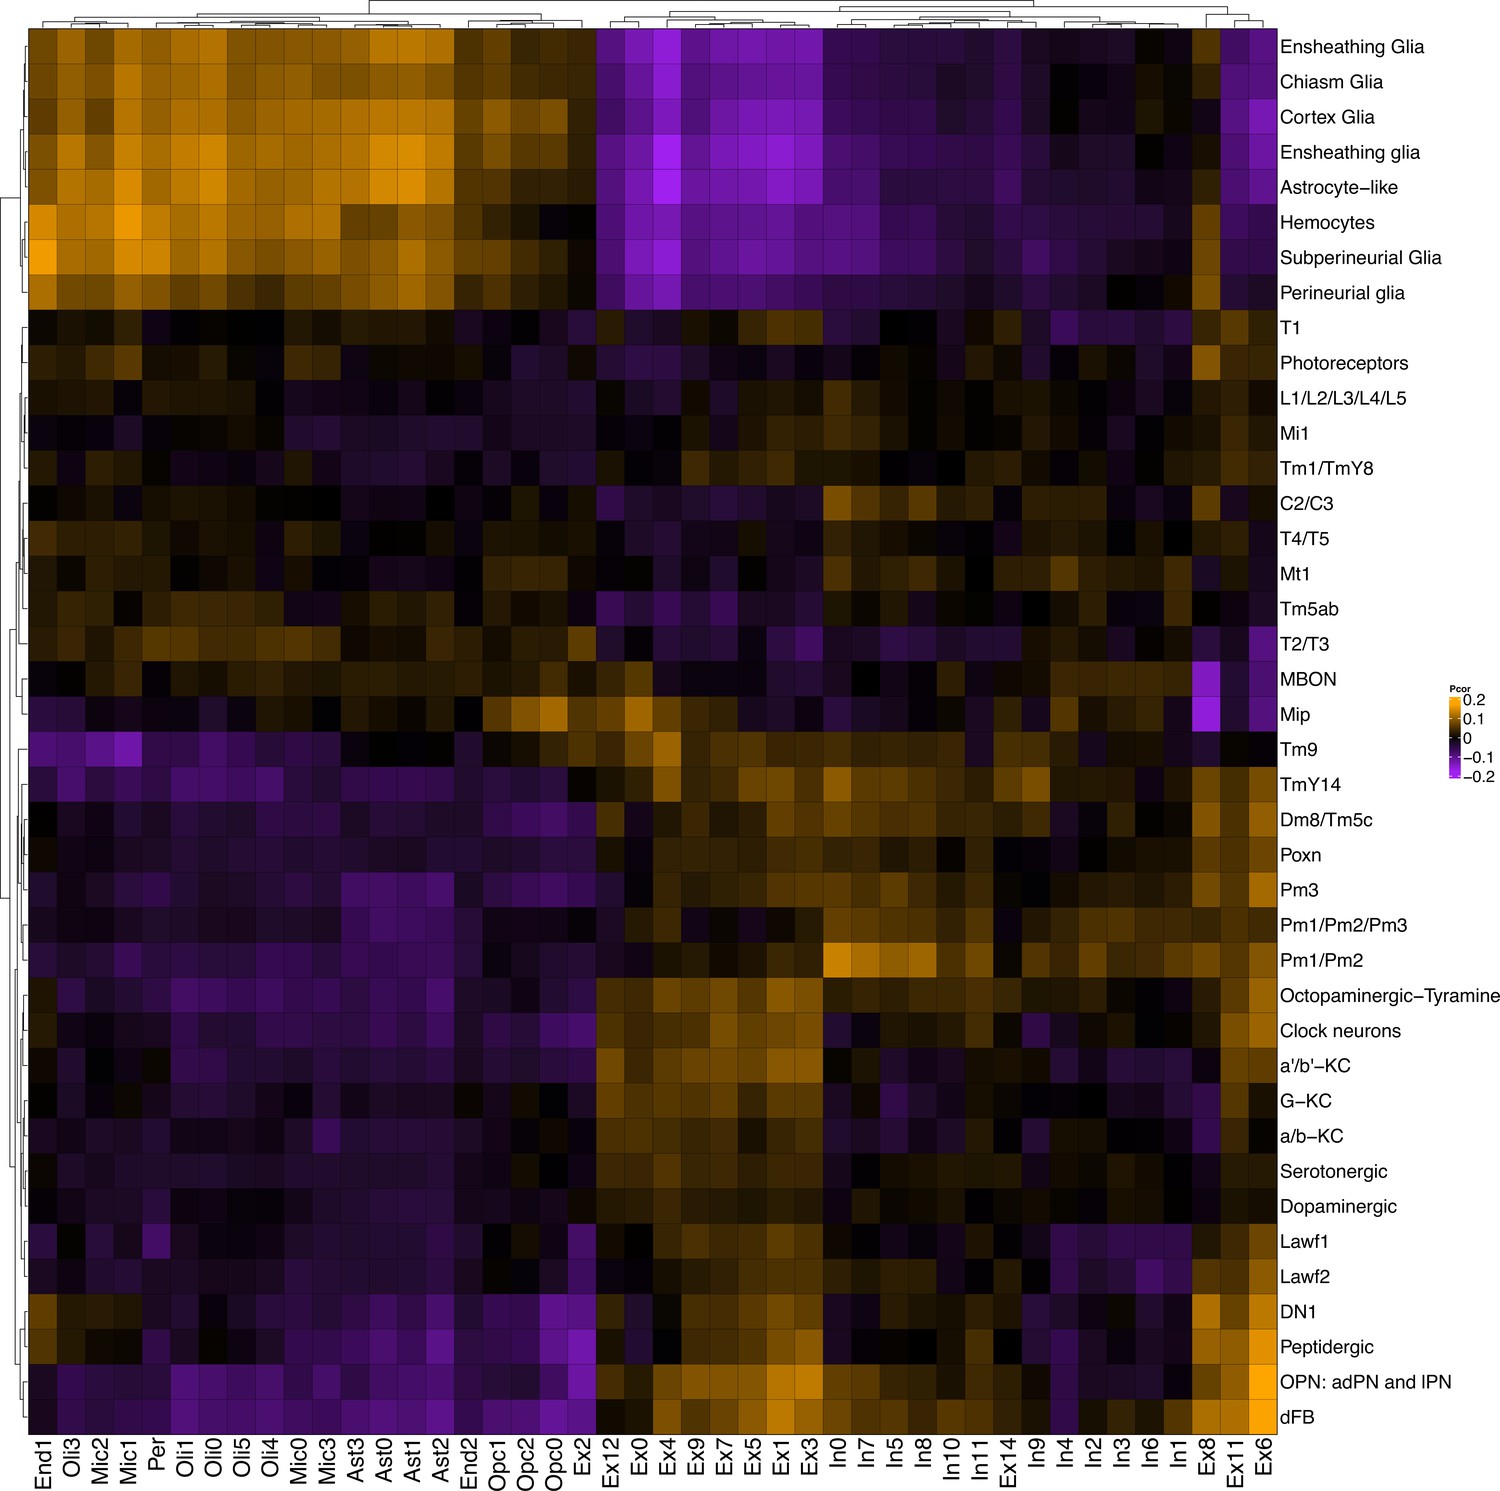
Replication of gene expression correlation between Drosophila scRNAseq and snRNAseq from control human subjects.
Heatmap shows Pearson correlation of gene expression between annotated wildtype Drosophila cell clusters from Davie et al., 2018 (rows) and cell clusters from control postmortem brain tissue (columns; Mathys et al., 2019).
Figure 5—figure supplement 3
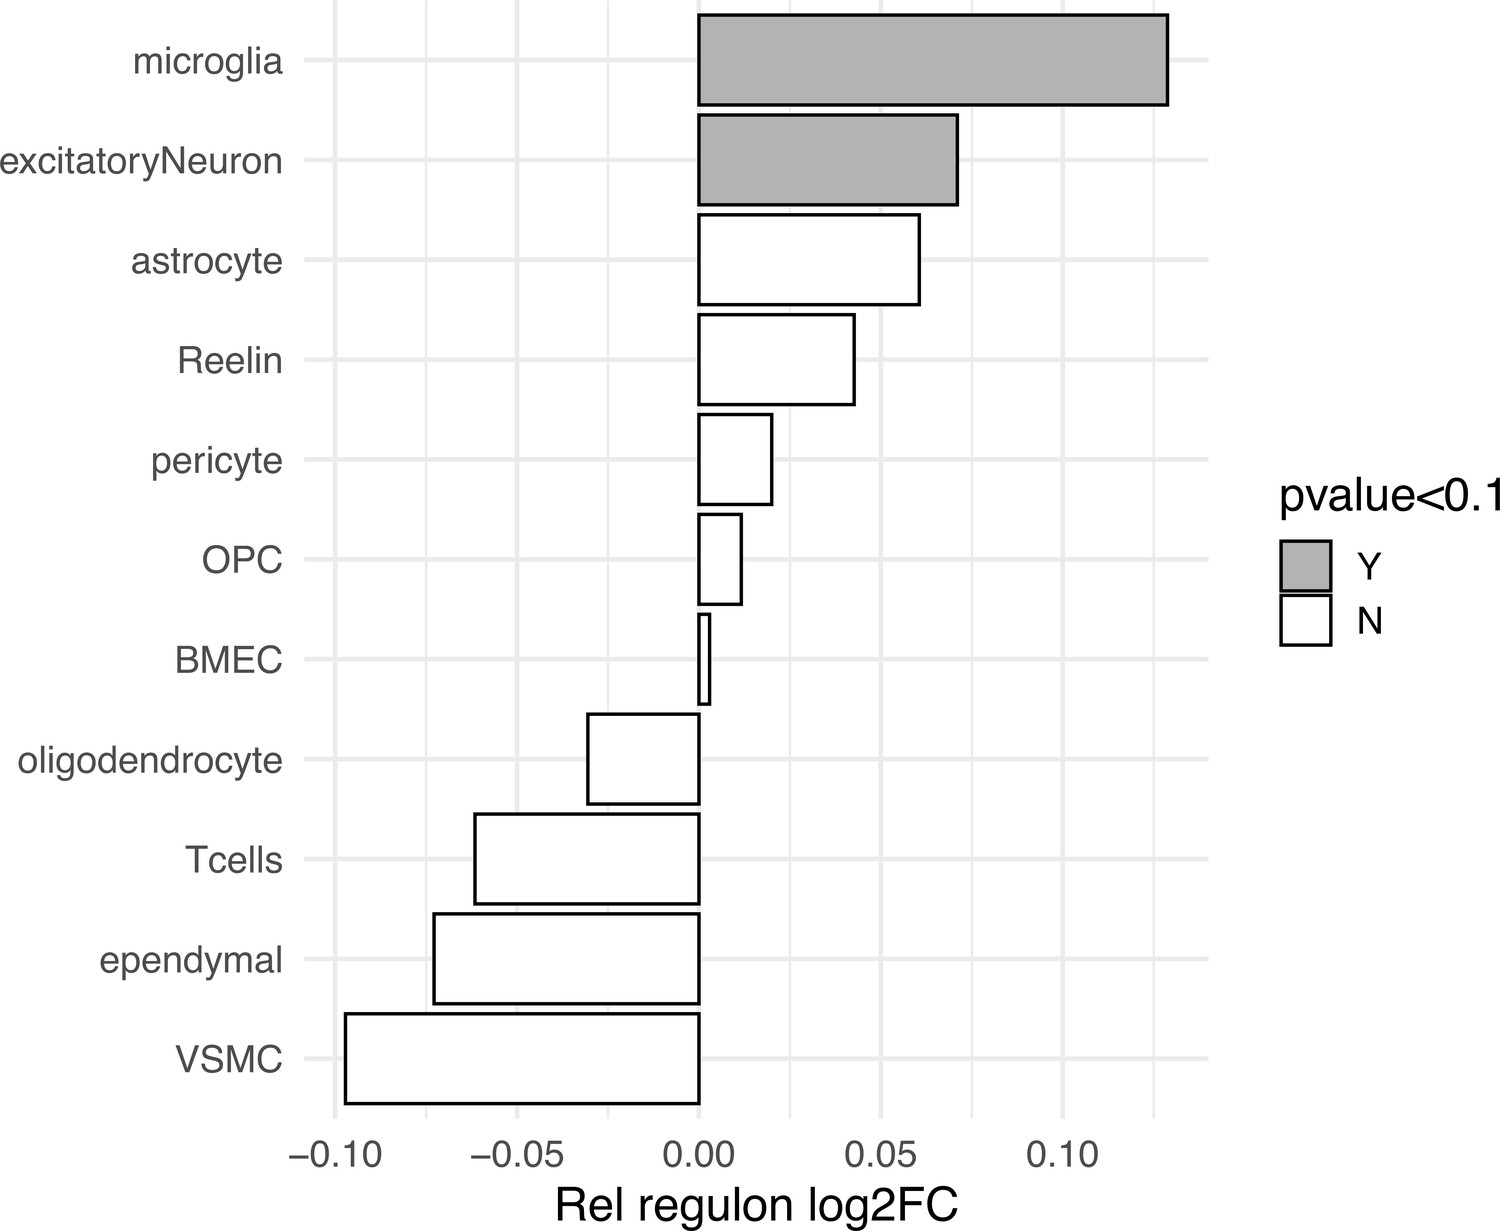
Cell-specific Rel/NFκB regulon differential expression in MAPTP301L transgenic mice.
Rel regulon differential expression is computed from scRNAseq pseudobulk counts of MAPTP301L mice (n = 3) and non-transgenic controls (n = 2) published in Lee et al., 2021. Conserved genes from the fly Rel regulon (DIOPT > 4) were averaged per cell cluster (554 mouse genes mapped to at least one fly ortholog). Log2 fold change (X-axis) is computed between P301L and non-transgenic control. Clusters with a likelihood ratio test p-value<0.1 are labeled in grey (microglia p=0.058, excitatory neuron p=0.047). BMEC = brain microvascular endothelial cell, VSMC = vascular smooth muscle cell, OPC = oligodendrocyte precursor cell, Reelin = Reelin-positive neurons.
Tables
Key resources table
| Reagent type (species) or resource | Designation | Source or reference | Identifiers | Additional information |
|---|---|---|---|---|
| Antibody | Rabbit polyclonal anti-GFP | GeneTex | Cat#GTX113617; RRID:AB_1950371 | IF(1:500) |
| Antibody | Alexa 647 goat polyclonal anti-rabbit IgG (H+L) | Jackson ImmunoResearch | Cat#111-605-003 | IF(1:500) |
| Antibody | CyTM3 AffiniPure goat polyclonal anti-mouse (H+L) | Jackson ImmunoResearch | Cat#115-165-003 | IF(1:500) |
| Antibody | Alexa Fluor 488 donkey polyclonal anti-mouse IgG (H+L) | Jackson ImmunoResearch | Cat#715-545-150 | IF(1:500) |
| Antibody | Cy3TM3 AffiniPure goat polyclonal anti-rat IgG (H+L) | Jackson ImmunoResearch | Cat#112-165-003 | IF(I:500) |
| Antibody | Mouse monoclonal anti-repo | DSHB | Cat#8D12 | IF(1:500) – glial counting IF(1:50) – Rel costain |
| Antibody | Rat monoclonal anti-Elav | DSHB | Cat#7E8A10; RRID:AB_528218 | IF(1:100) |
| Antibody | Mouse monoclonal anti-Rel | DSHB | Cat#21F3; RRID:AB_1553772 | IF(1:500) |
| Chemical compound, reagent | Conjugated A488-Phalloidin | Thermo Fisher | Cat#A12379 | IF(1:500) |
| Chemical compound, drug | Dispase | Sigma-Aldrich | Cat#D4818; | |
| Chemical compound, drug | Collagenase I | Invitrogen | Cat#17100-100 | |
| Chemical compound, drug | NucBlue and Propidium iodide | Invitrogen | Cat#R37610 | |
| Chemical compound, drug | Vectashield antifade mounting medium | Vector Laboratories | Cat#H-1000-10 | |
| Commercial assay or kit | Chromium Single Cell Gene Expression 3’ v3.1 | 10x Genomics | Cat#PN-1000268 | |
| Genetic reagent (Drosophila melanogaster) | elavC155-GAL4 | Bloomington Drosophila Stock Center | BDSC:458 | |
| Genetic reagent (D. melanogaster) | w1118; UAS-TauR406W | Lab: Dr. Mel B. Feany, PMID:11408621 | N/A | Wittmann et al., 2001 |
| Genetic reagent (D. melanogaster) | Rel-GFP | Bloomington Drosophila Stock Center | BDSC:81268 | y1 w*; PBac{GFP.FPTB-Rel}VK00037 |
| Genetic reagent (D. melanogaster) | UAS-Rel.RNAi-2 | Bloomington Drosophila Stock Center | BDSC:33661 | y1; P{TRiP.HMS00070}attP2 |
| Genetic reagent (D. melanogaster) | UAS-Rel.RNAi-1 | Vienna Drosophila Resource Center | VDRC:49414 | P{GD1199}v49414 |
| Software, algorithm | Imaris Microscopy Image Analysis Software 9.9.1 | https://imaris.oxinst.com/ | Oxford Instruments | |
| Software, algorithm | Prism 9.4.1 | https://www.graphpad.com/scientific-software/prism/ | GraphPad | |
| Software, algorithm | ImageJ | https://imagej.nih.gov/ij/ | NIH | |
| Software, algorithm | Cell Ranger 4.0.0 | https://support.10xgenomics.com/single-cell-gene-expression/software/pipelines/latest/what-is-cell-ranger | 10x Genomics | |
| Software, algorithm | Seurat v3 | https://doi.org/10.1016/j.cell.2019.05.031 | Stuart et al., 2019 | |
| Software, algorithm | DoubletFinder 2.0.3 | https://github.com/chris-mcginnis-ucsf/DoubletFinder | McGinnis et al., 2019 | |
| Software, algorithm | Scmap 1.9.3 | https://bioconductor.org/packages/release/bioc/html/scmap.html | Kiselev et al., 2018 | |
| Software, algorithm | Optic lobe neural network classifier | https://static-content.springer.com/esm/art%3A10.1038%2Fs41586-020-2879-3/MediaObjects/41586_2020_2879_MOESM7_ESM.zip | Özel et al., 2021, Supplementary Data Appendix 1, Python/R code | |
| Software, algorithm | pySCENIC 0.12.0 | https://github.com/aertslab/pySCENIC | Van de Sande et al., 2020 | |
| Software, algorithm | DESeq2 1.34.0 | https://bioconductor.org/packages/release/bioc/html/DESeq2.html | Love et al., 2014 | |
| Software, algorithm | MuSiC 0.1.1 | https://github.com/xuranw/MuSiC | Wang et al., 2019 | |
| Software, algorithm | MAST 1.20.0 | https://bioconductor.org/packages/release/bioc/html/MAST.html | Finak et al., 2015 | |
| Software, algorithm | WEBGESTALTR 0.4.4 | https://github.com/bzhanglab/WebGestaltR | Wang et al., 2013 | |
| Software, algorithm | Glmnet 4.1-4 | https://cran.r-project.org/web/packages/glmnet/index.html | Friedman et al., 2010 | |
| Software, algorithm | Caret 6.0-92 | https://cran.r-project.org/web/packages/caret/index.html | Kuhn, 2008 | |
| Software, algorithm | DRSC Integrated Ortholog Prediction Tool (DIOPT) | https://www.flyrnai.org/diopt | Hu et al., 2011 | |
| Software, algorithm | gProfiler2 0.2.1 | https://cran.r-project.org/web/packages/gprofiler2/index.html | Raudvere et al., 2019 | |
| Software, algorithm | SCTransform 0.3.3 | https://github.com/satijalab/sctransform | Stuart et al., 2019 |
Additional files
Download links
A two-part list of links to download the article, or parts of the article, in various formats.
Downloads (link to download the article as PDF)
Open citations (links to open the citations from this article in various online reference manager services)
Cite this article (links to download the citations from this article in formats compatible with various reference manager tools)
Tau polarizes an aging transcriptional signature to excitatory neurons and glia
eLife 12:e85251.
https://doi.org/10.7554/eLife.85251


