Enterobacterales plasmid sharing amongst human bloodstream infections, livestock, wastewater, and waterway niches in Oxfordshire, UK
- Nuffield Department of Medicine, University of Oxford, United Kingdom
- Oxford University Hospitals NHS Trust, United Kingdom
- Animal and Plant Health Agency, United Kingdom
- NIHR Biomedical Research Centre, United Kingdom
- Centre for Ecology and Hydrology, United Kingdom
- Department of Biology, University of Oxford, United Kingdom
Figures
Figure 1
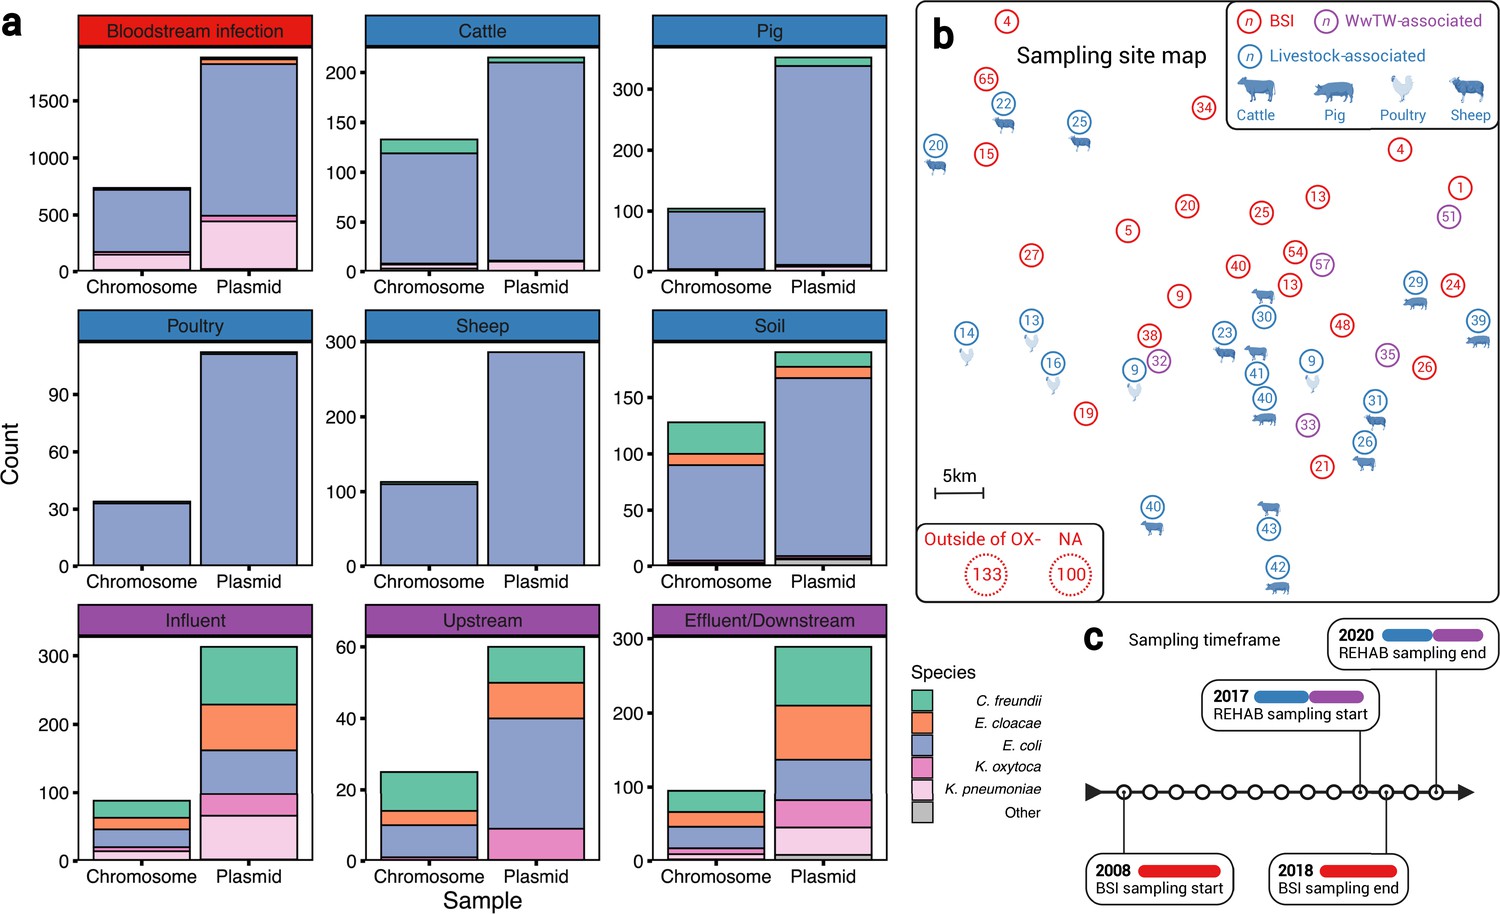
A diverse sample of geographically and temporally restricted Enterobacterales.
(a) Number of chromosomes and plasmids by niche, stratified by isolate genus. (b) Map of approximate, relative distances between sampling sites, coloured by niche (human bloodstream infection [BSI], livestock-associated [cattle, pig, poultry, and sheep faeces, soils nearby livestock sites], and wastewater treatment work [WwTW]-associated sources [influent, effluent, waterways upstream/downstream of effluent outlets]). Number in circles indicates how many of the n=1458 isolates are from that location. (c) Sampling timeframe for BSI and REHAB (non-BSI) isolates.
Figure 2
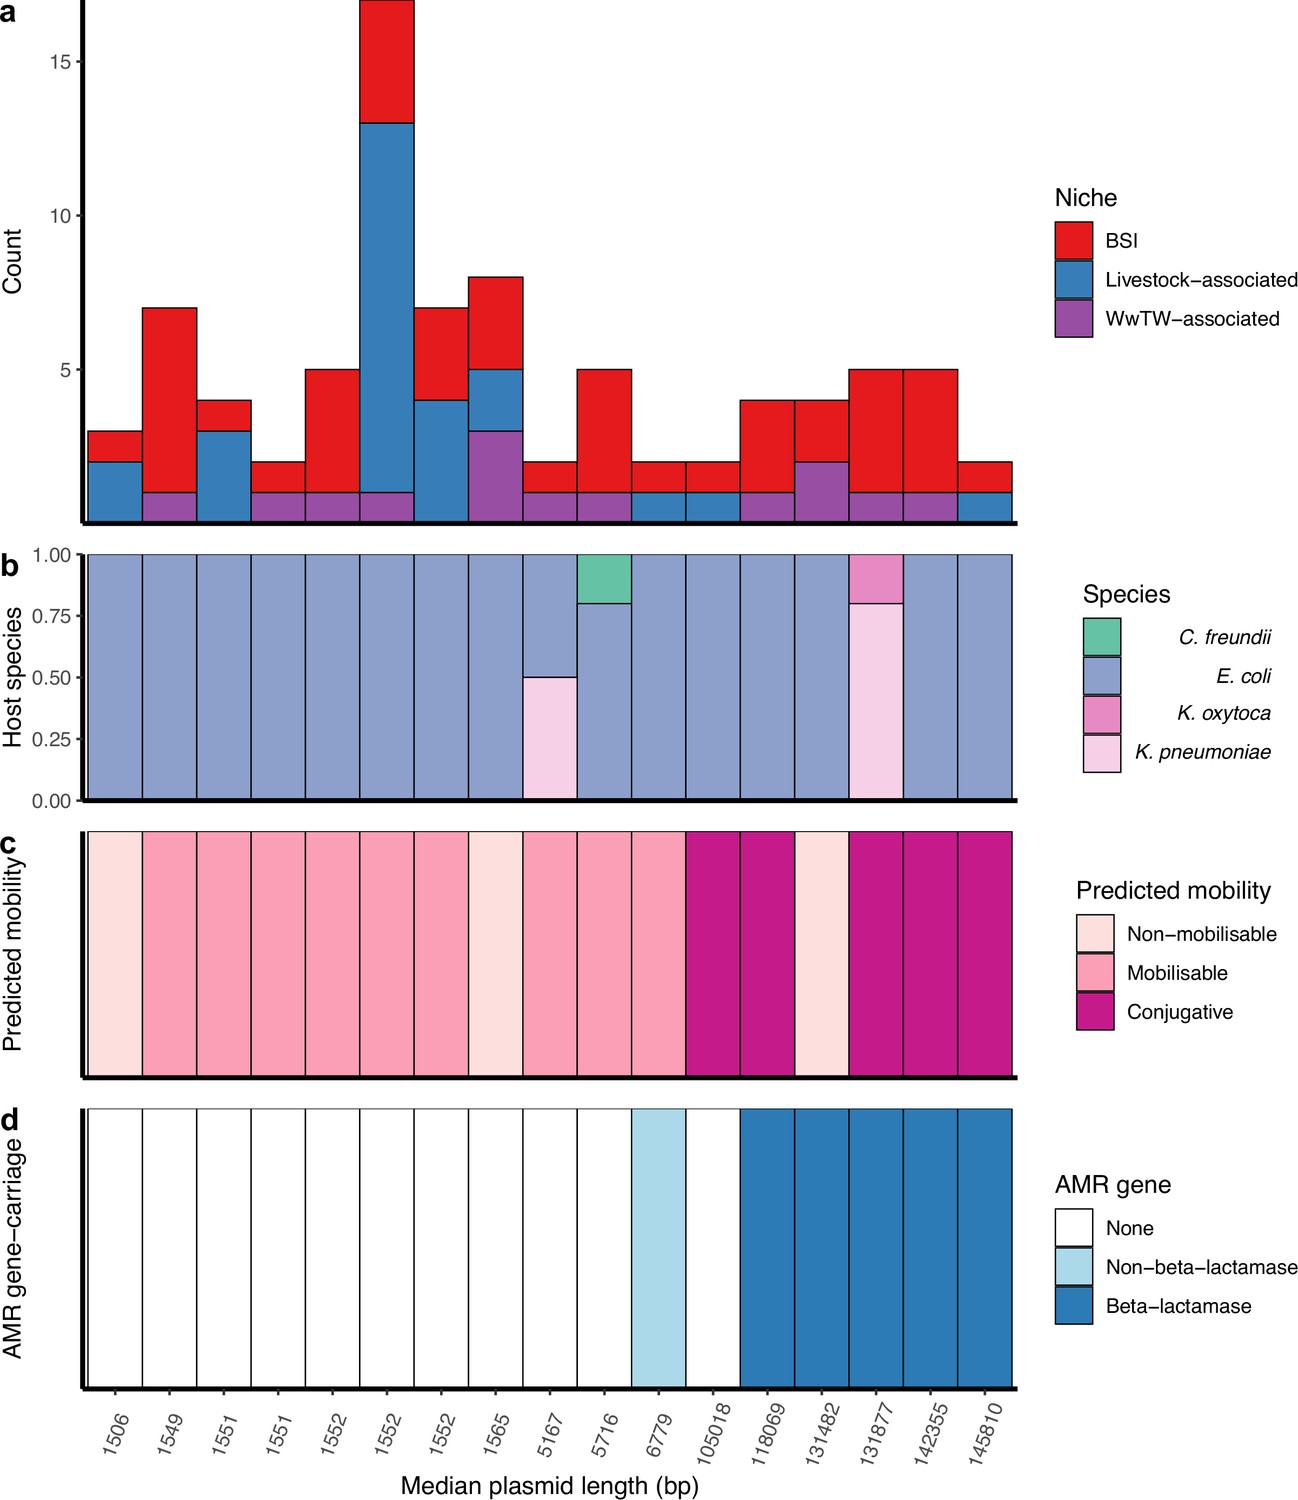
Cross-niche, near-identical plasmids.
(a) Size of cross-niche, near-identical plasmid groups, coloured by niche (total n=84 plasmids). Median length (bp) of plasmids within groups increases from left to right. (b) Proportion of plasmid host species by group. (c) Predicted mobility of plasmid. (d) Antimicrobial resistance (AMR) gene carriage in plasmid. For small plasmids, the stringent distance threshold (d<0.0001) becomes an identical threshold, meaning that plasmids of the same length with a single SNP between them are grouped into different groups (e.g. the three groups with length = 1552 bp; see Materials and methods). From left to right, the near-identical groups are named in Supplementary file 3 as 156, 18, 117, 210, 22, 29, 44, 19, 184, 6, 208, 139, 32, 26, 10, 192, 217.
Figure 3
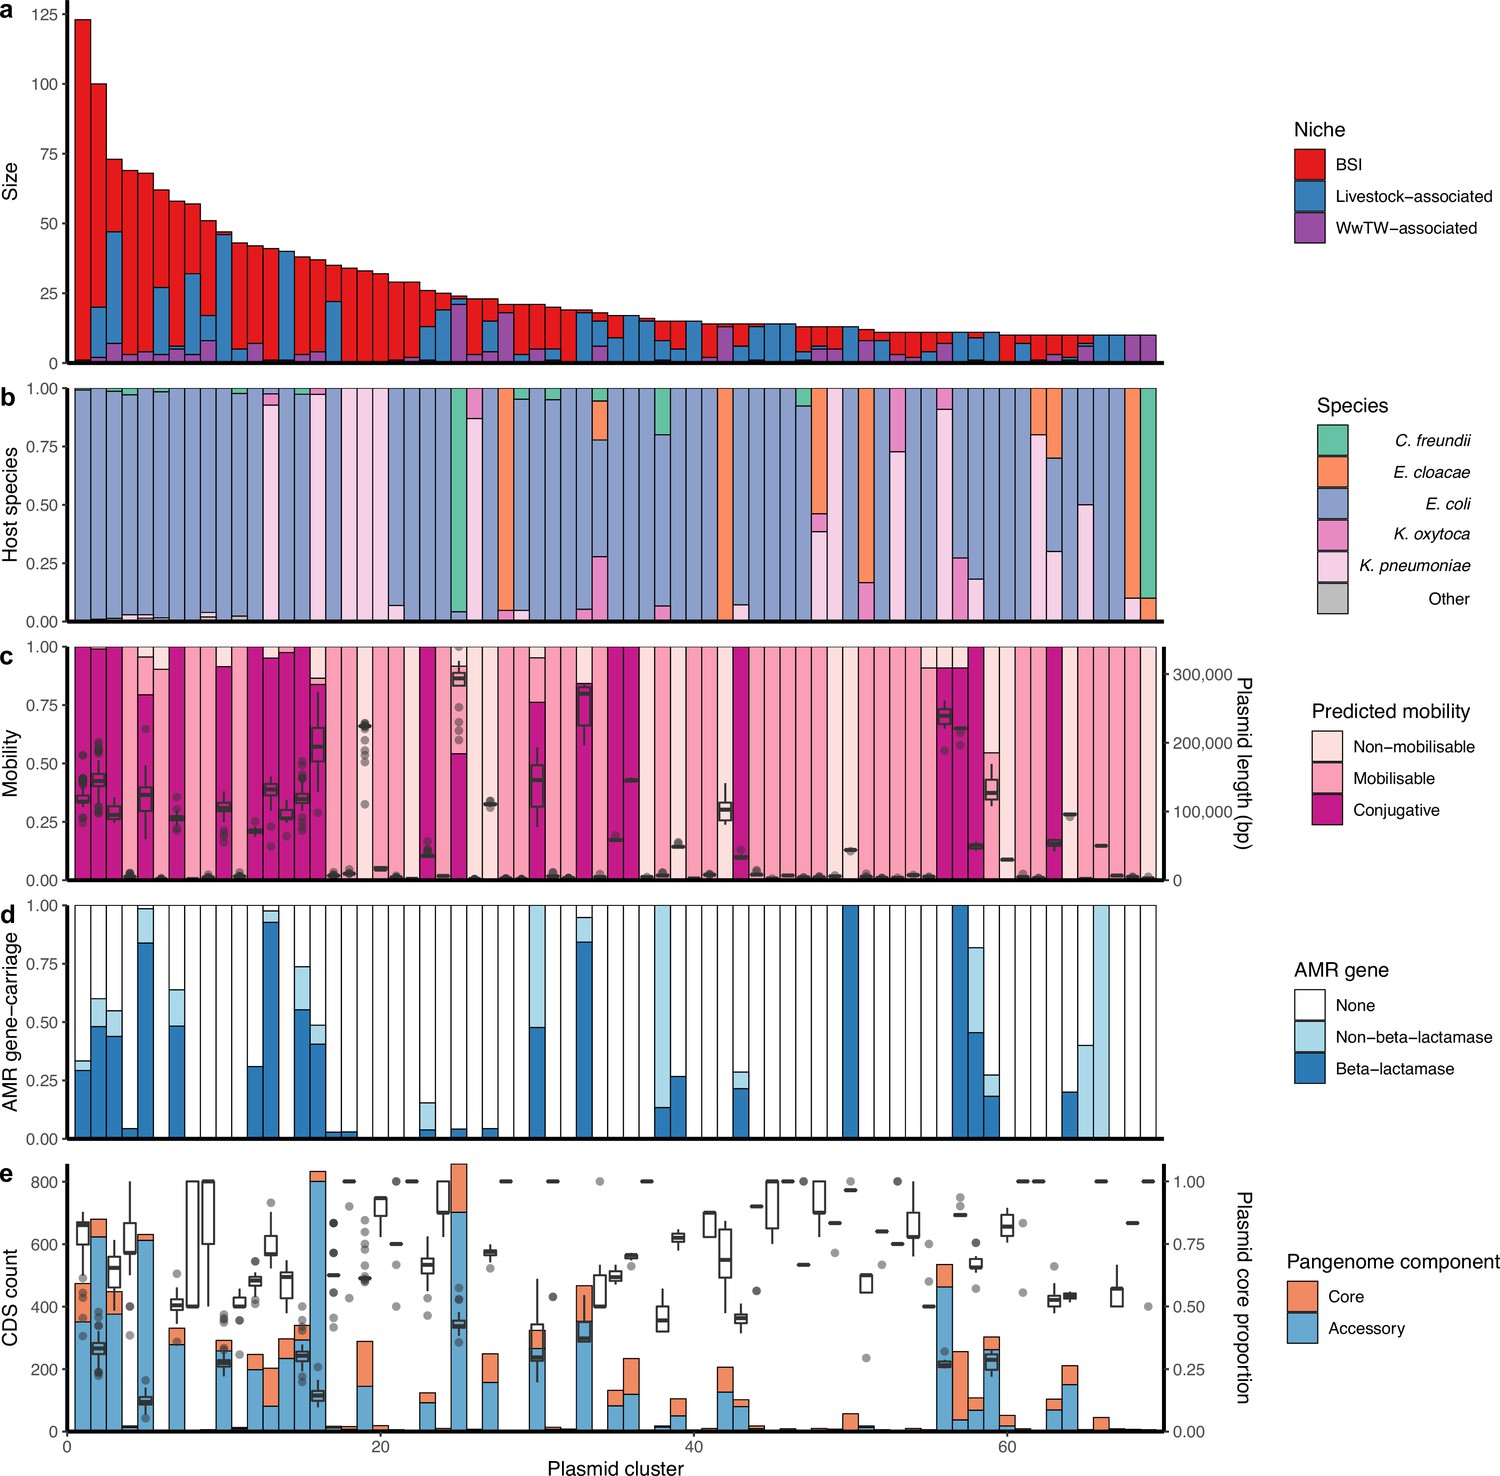
Genetically similar plasmids shared between niches.
(a) Size of plasmid clusters with at least 10 members, coloured by niche. Size of clusters decreases from left to right. (b) Proportion of plasmid host species by cluster. (c) Plasmid mobility class and size: Left-hand axis shows proportion of plasmids with a predicted mobility class by cluster. Right-hand axis shows plasmid length boxplots by cluster. (d) Proportions of antimicrobial resistance (AMR) gene carriage by cluster. (e) Plasmid core and accessory genomes: Left-hand axis shows the count of core and accessory coding sequences (CDS) for the entire cluster as a bar chart. Right-hand axis shows plasmid core-gene proportions (i.e. core CDS/total CDS for each plasmid) as a boxplot.
Figure 4
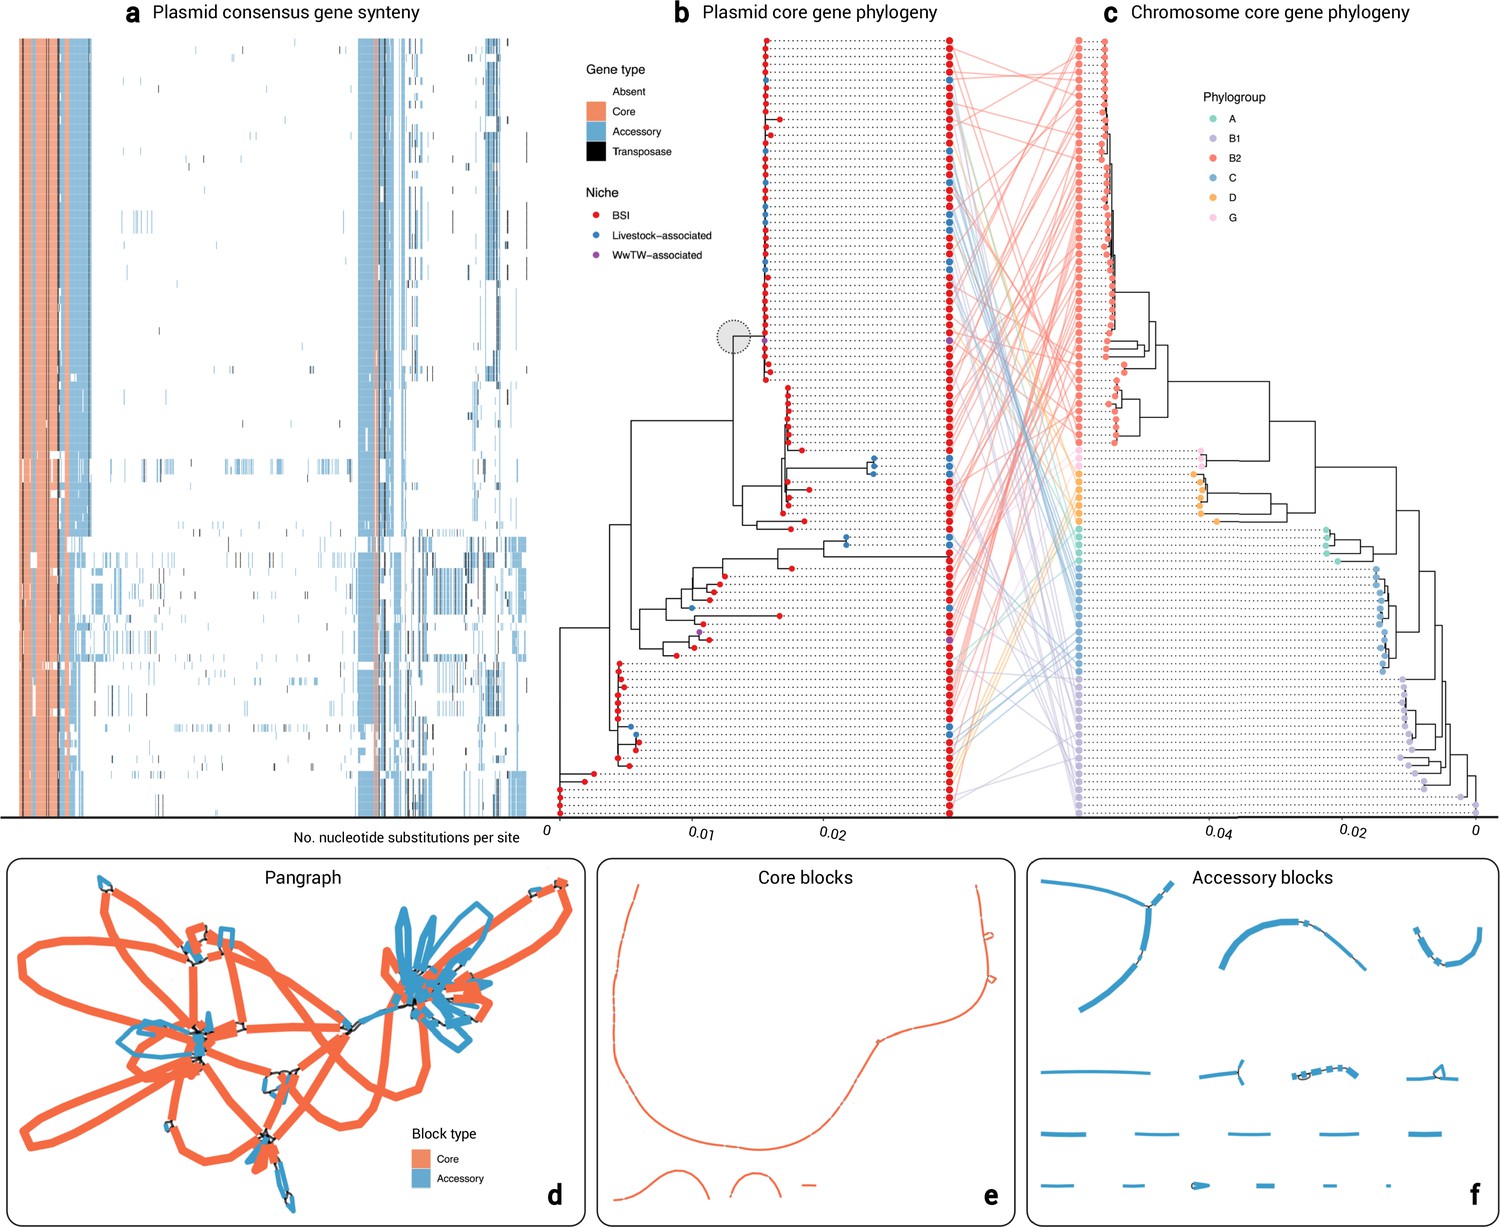
Cluster 2 plasmid and host evolution.
(a) Consensus gene ordering for plasmid cluster 2, coloured by gene type (total n=99 plasmids; n=1 Salmonella enterica isolate omitted). Genes are coloured by core, accessory, or transposase. (b) Plasmid core-gene phylogeny with tips coloured by sampling niche. The grey circle highlights the clade of n=44 plasmids which were further analysed. (c) Plasmid host chromosome core-gene phylogeny with tips coloured by sampling niche. Plasmid and host phylogeny tips are connected in a ‘tanglegram’ which connects pairs of plasmids and chromosomes from the same isolate. (d) Visualisation of the pangraph for n=44 plasmids in the grey-circled clade in (b). Blocks are coloured by presence in plasmids. (e) Core blocks (found in at least 95% of the n=44 plasmids). (f) Accessory blocks (found in less than 95% of the n=44 plasmids).
Appendix 1—figure 1
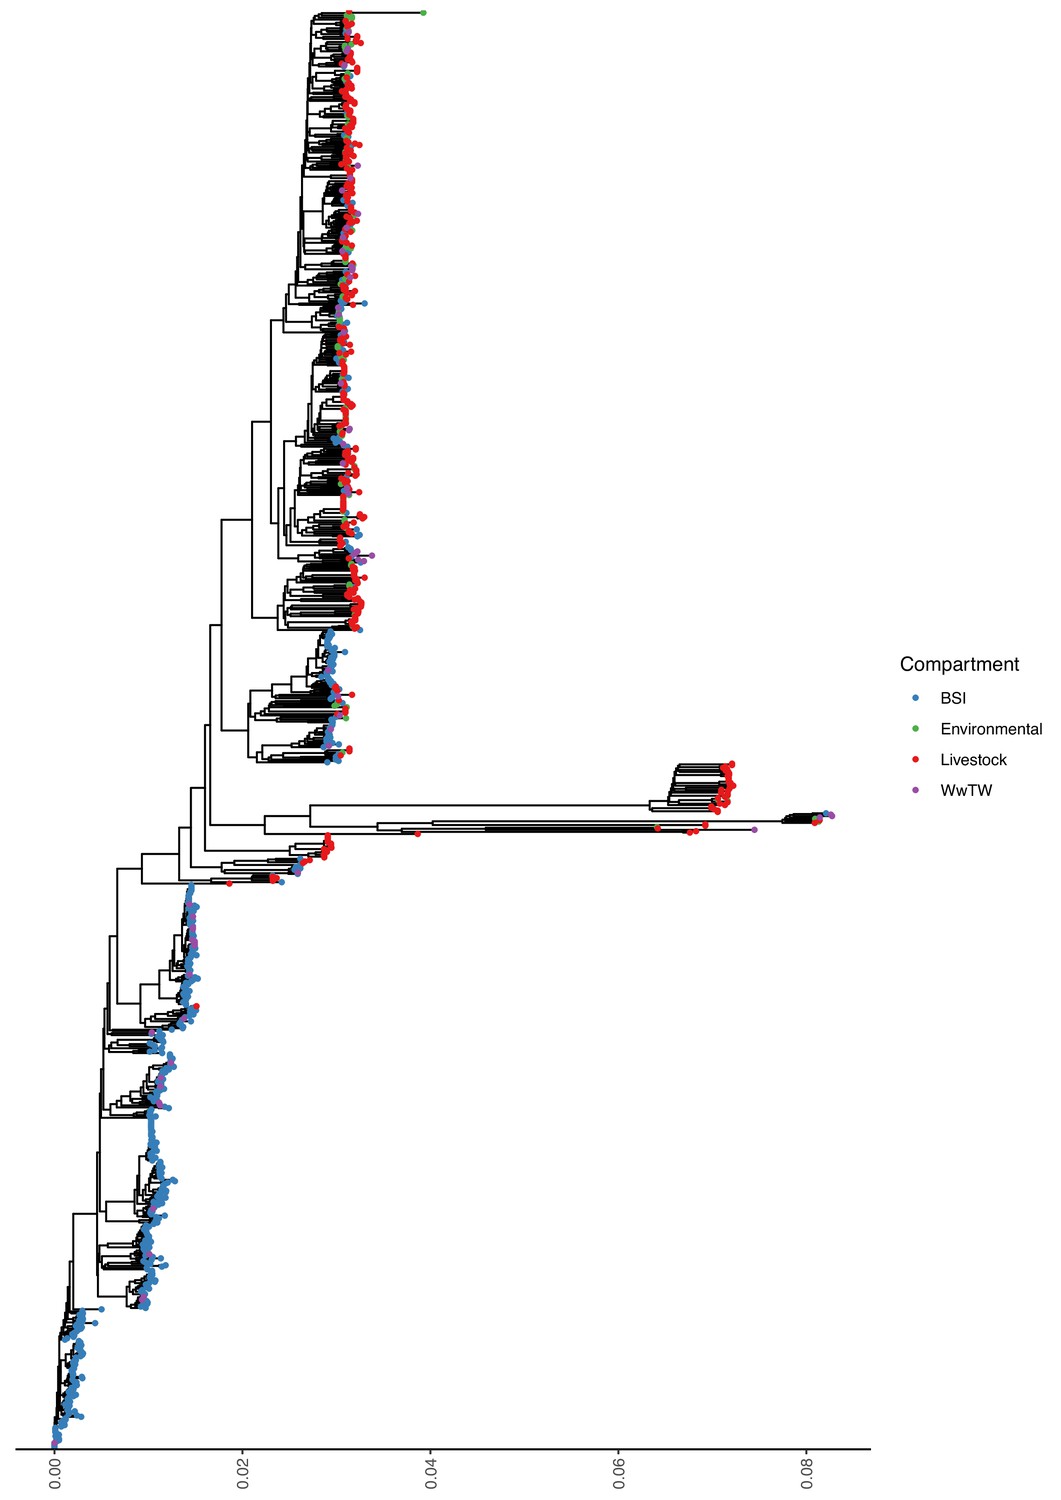
Mash tree for n=1044 E. coli chromosomes.
Tree tips are coloured by sampling compartment, scale is Mash distance.
Appendix 1—figure 2
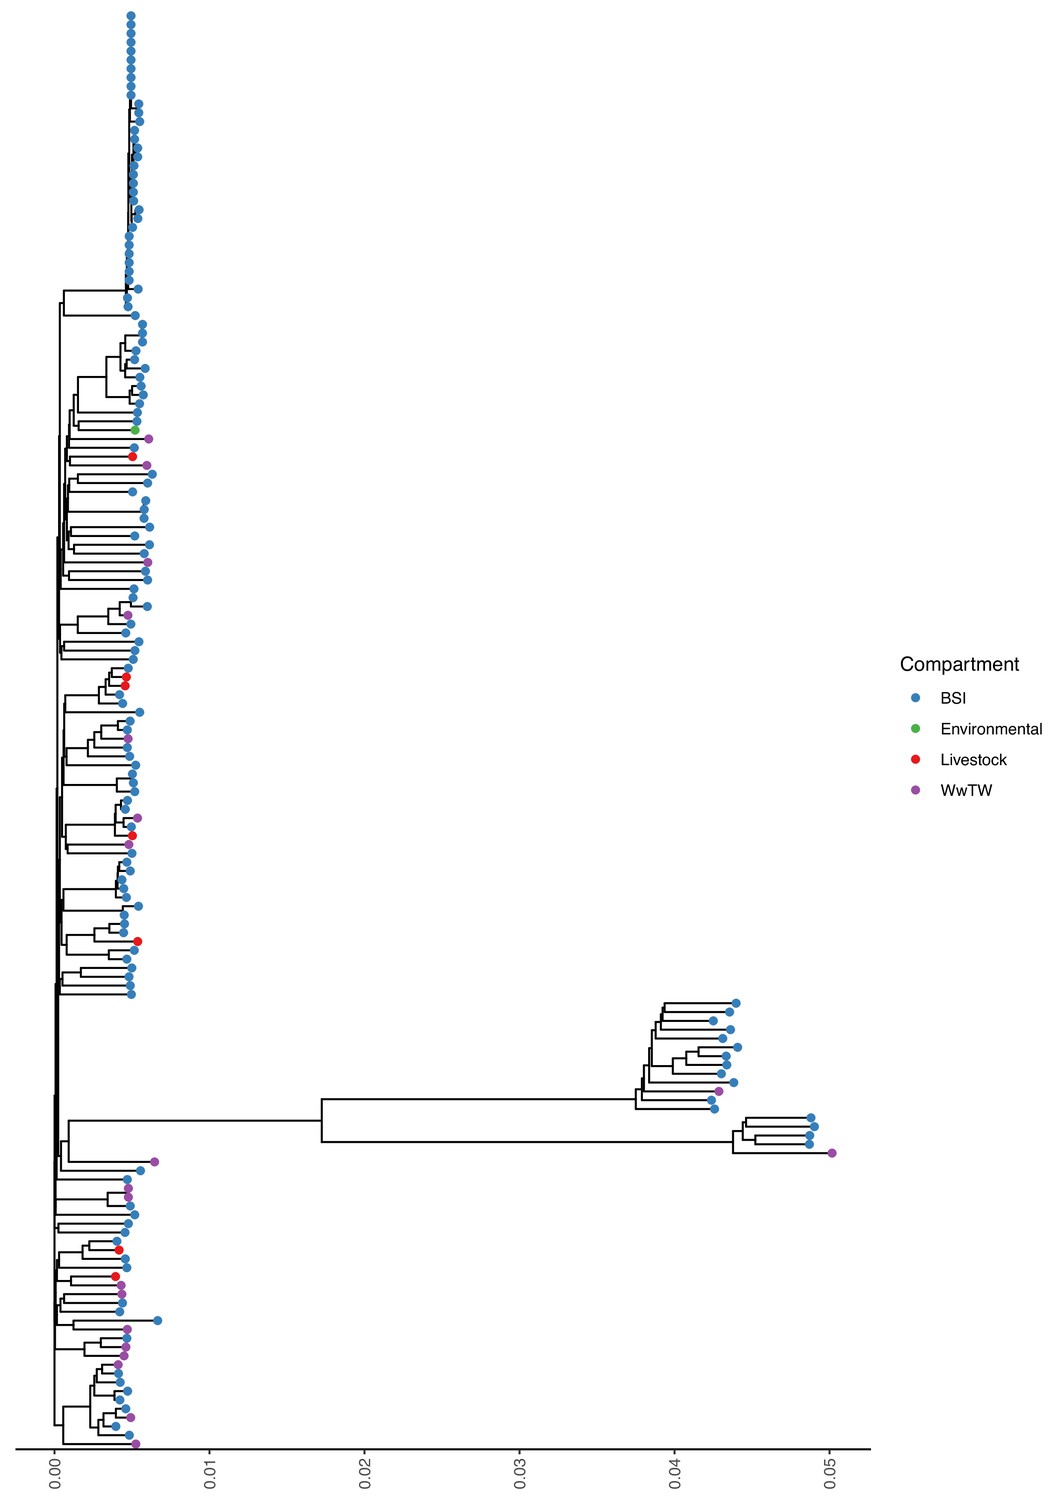
Mash tree for n=163 K. pneumoniae chromosomes.
Tree tips are coloured by sampling compartment, scale is Mash distance.
Appendix 1—figure 3
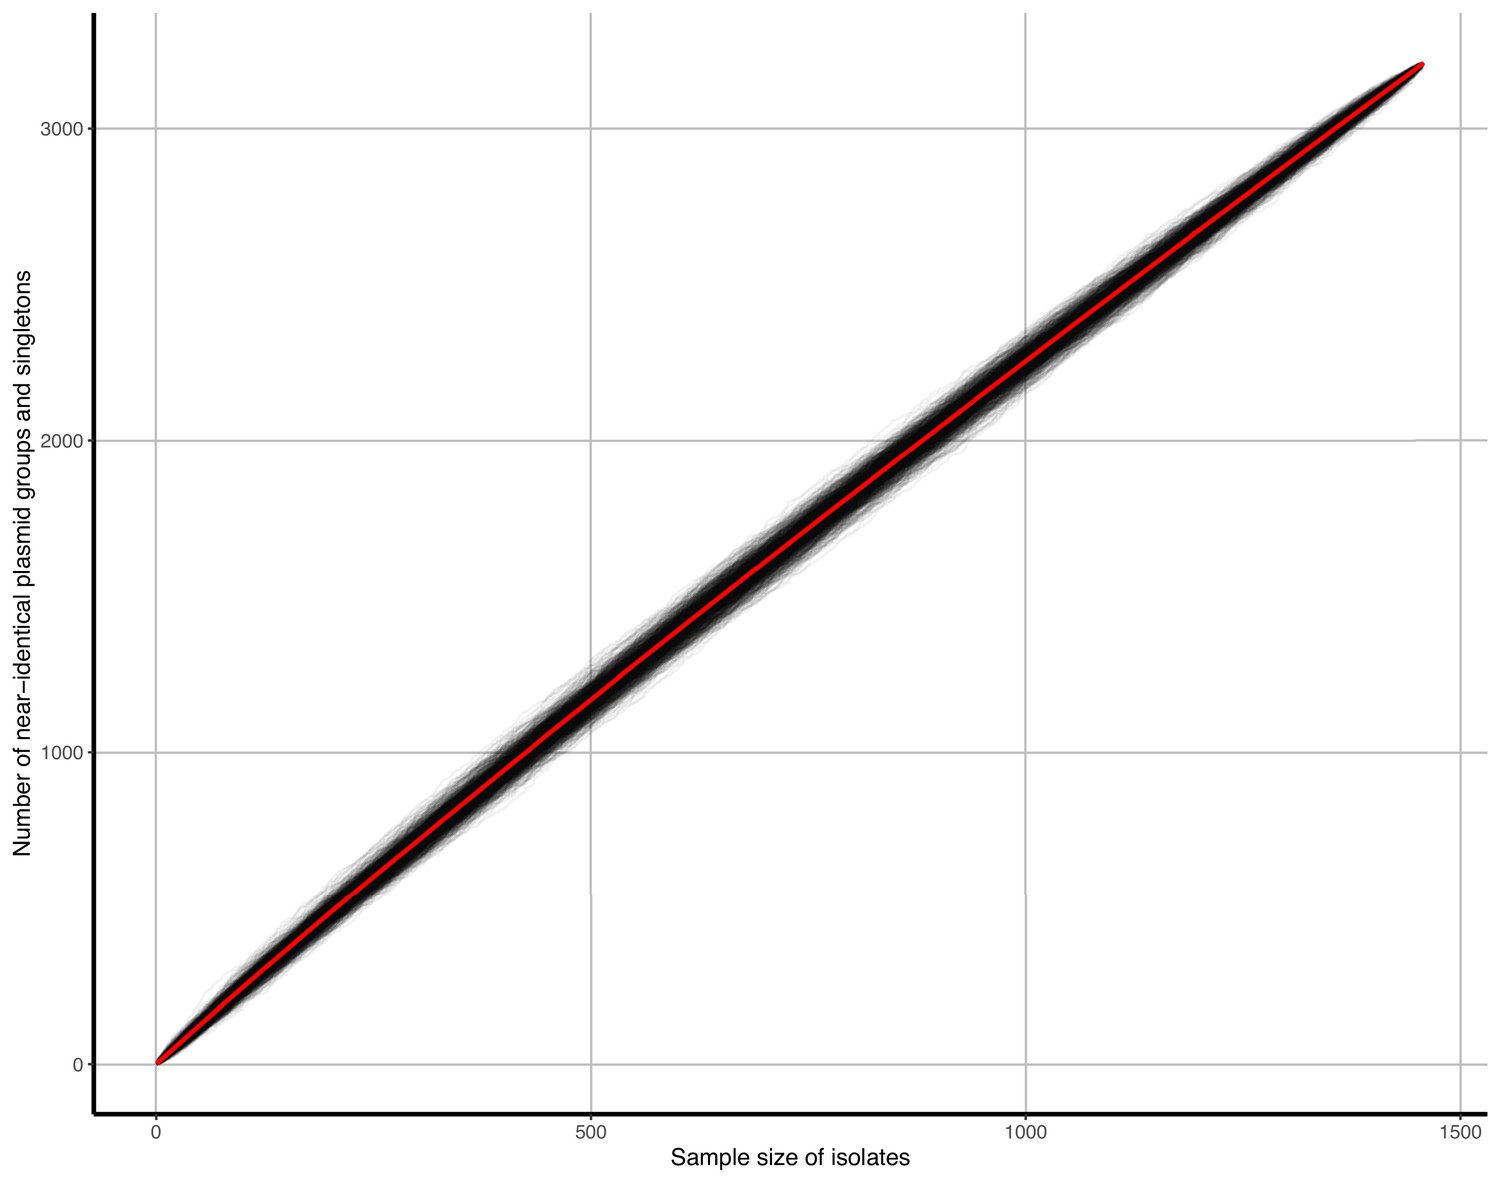
Accumulation curves of near-identical plasmid groups and singletons against isolate sample size.
Black lines represent b=1000 bootstrap simulations, the red line represents their average.
Appendix 1—figure 4
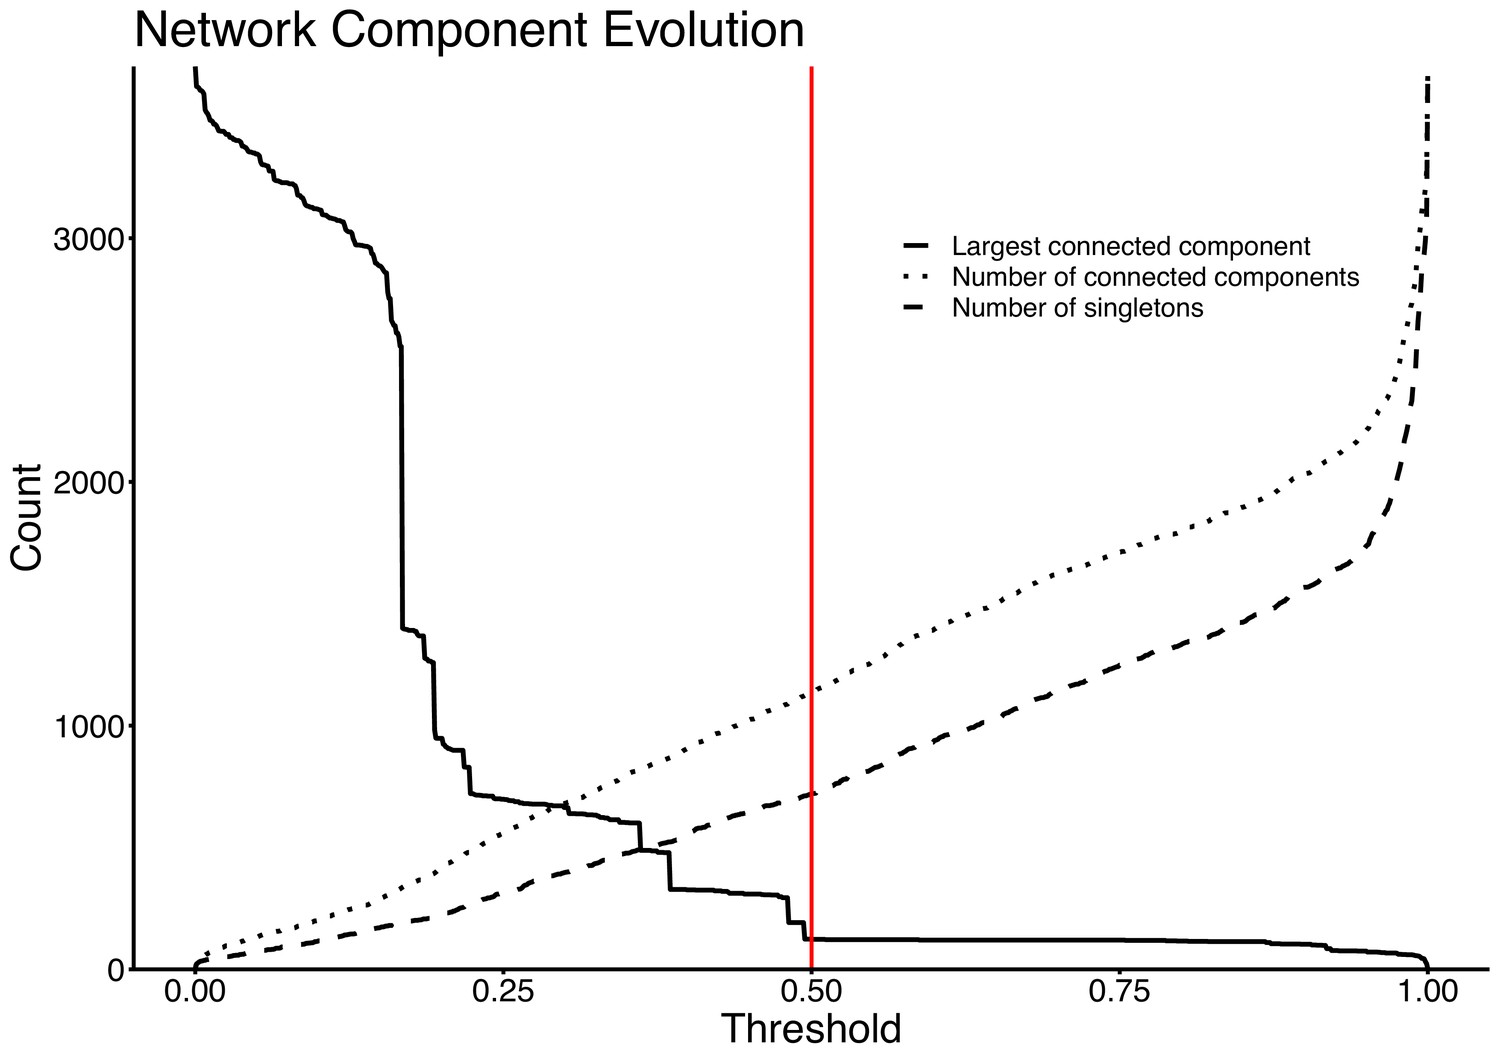
Network evolution of largest connected component, number of connected components, and number of singletons, as edges are removed at increasing JI thresholds.
The vertical red line represents the chosen threshold of JI=0.5.
Appendix 1—figure 5
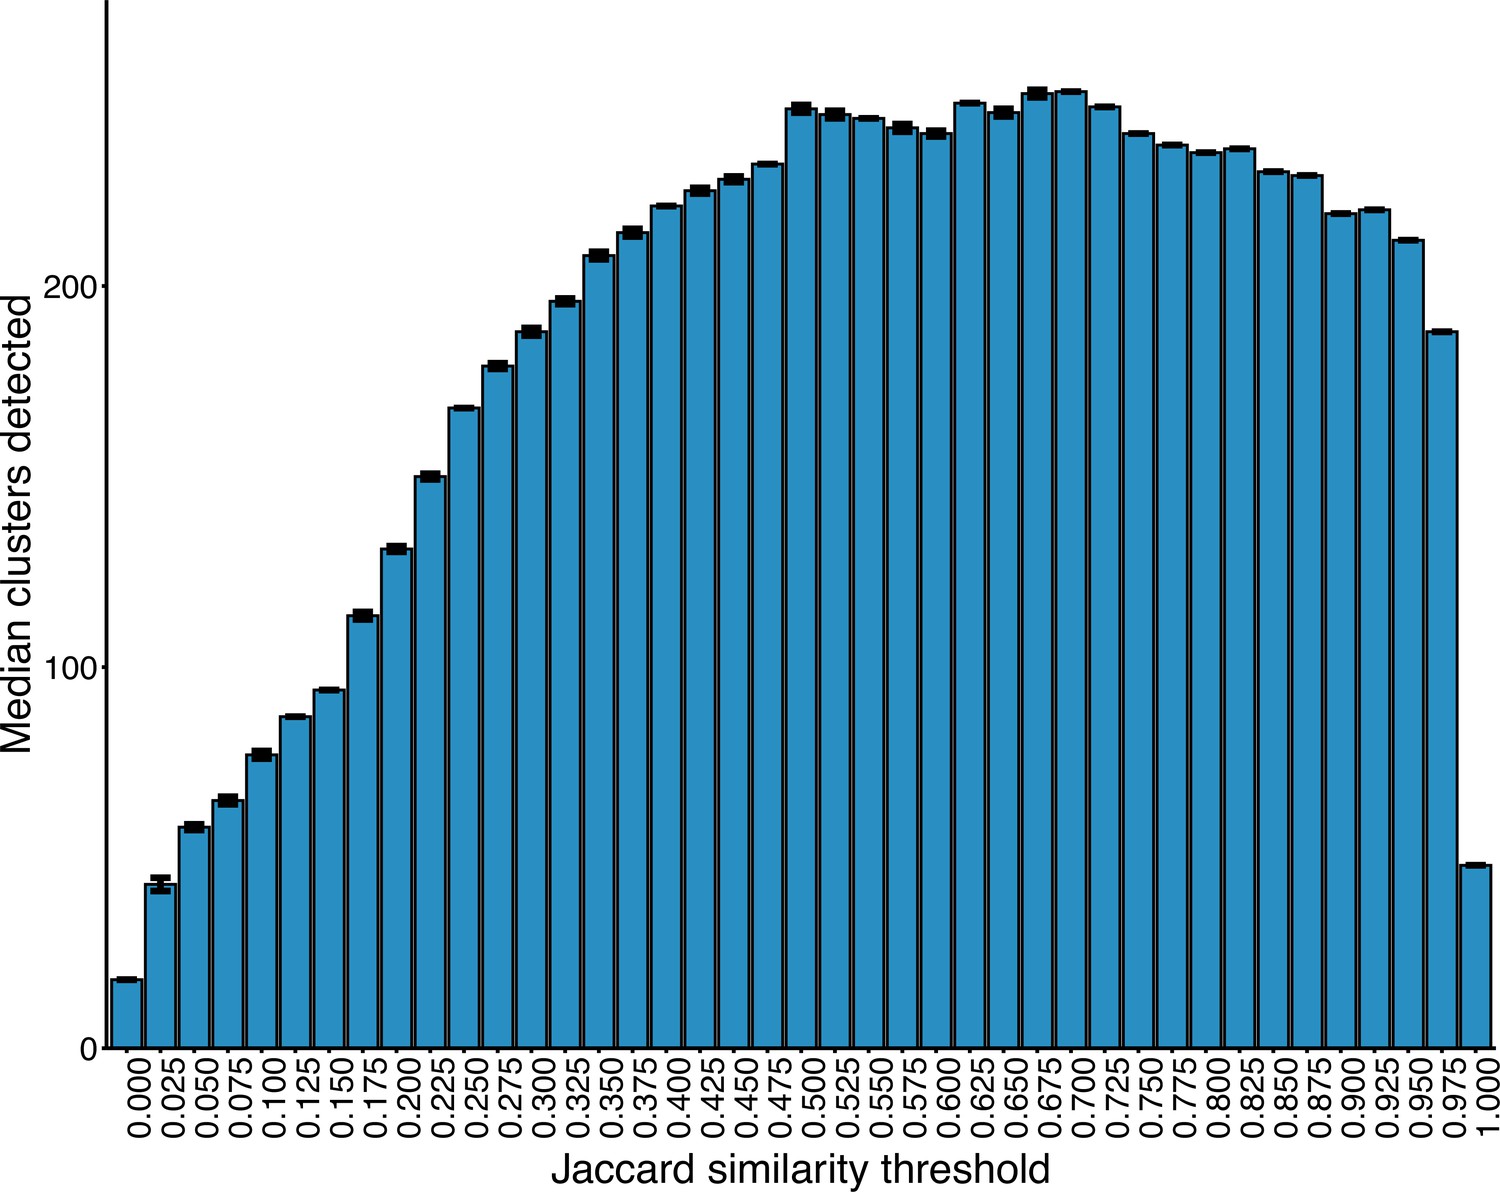
Number of clusters detected within the plasmid network at increasing JI thresholds.
Interval bars represent the IQR in cluster number at a given threshold over 50 runs of the Louvain algorithm.
Appendix 1—figure 6
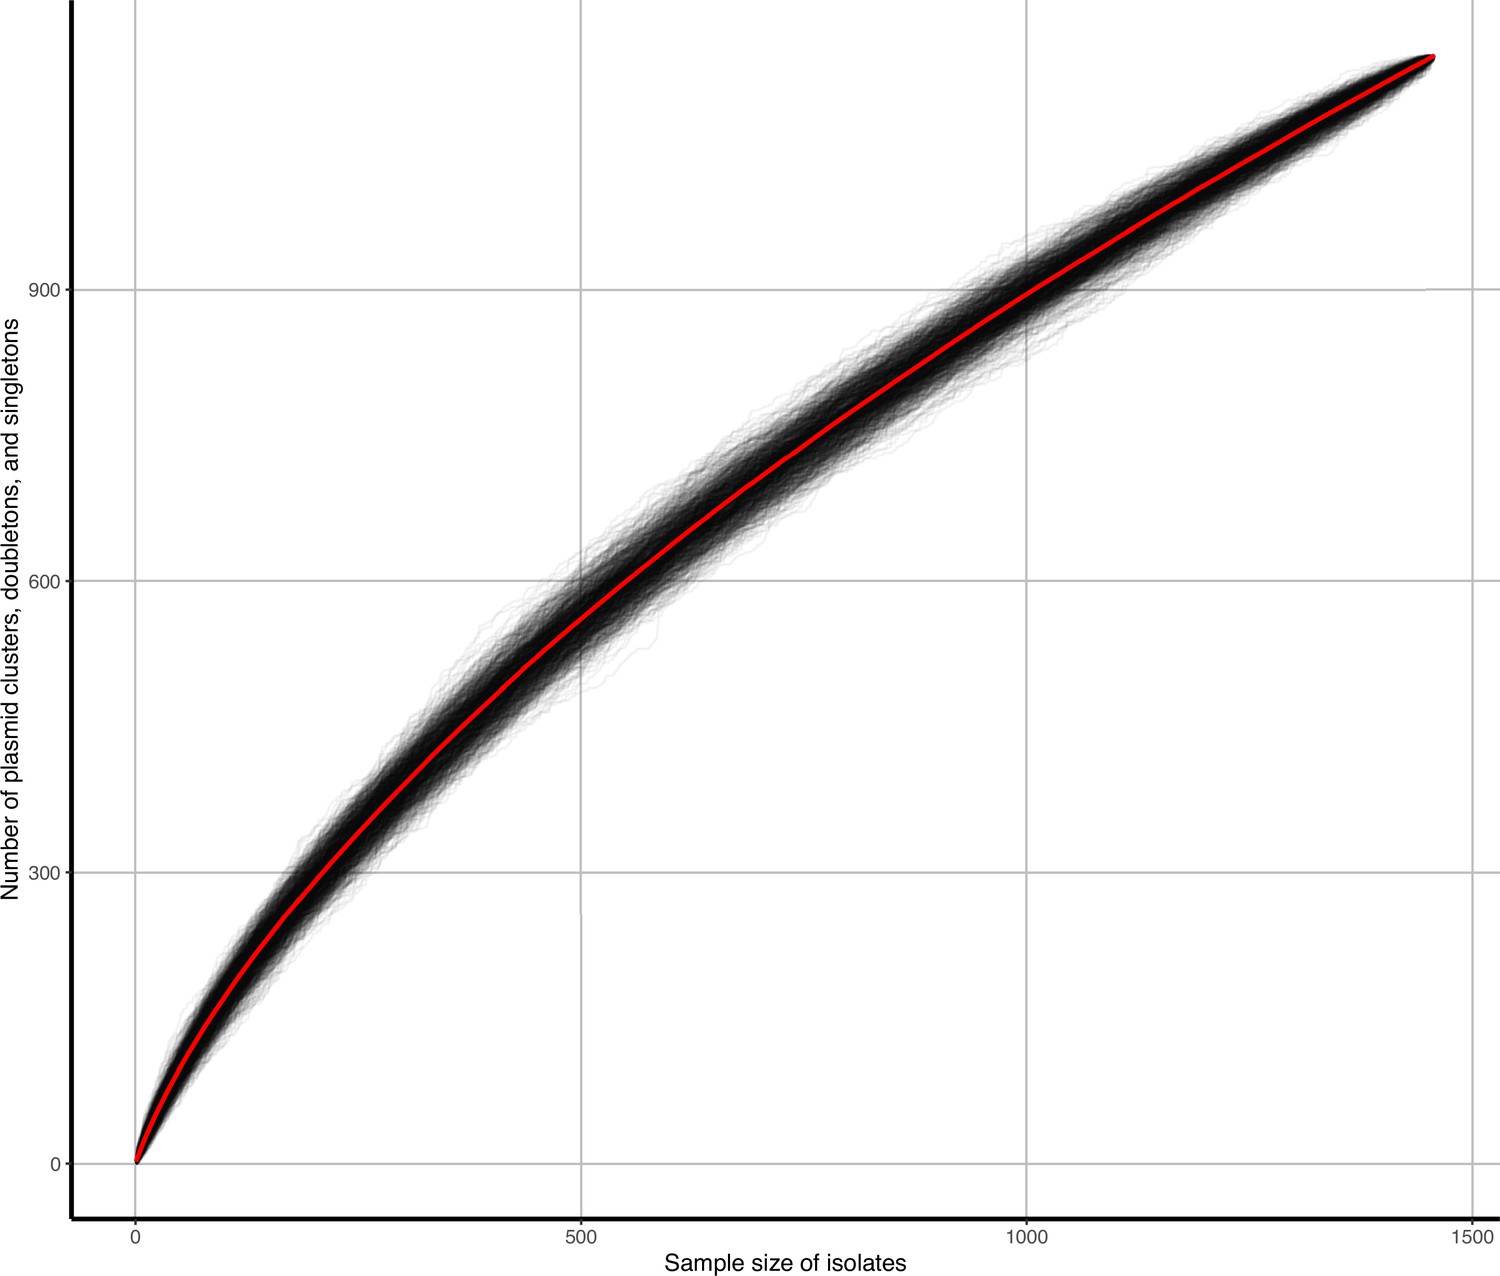
Accumulation curves of plasmid clusters, doubletons, and singletons against isolate sample size.
Black lines represent b=1000 bootstrap simulations, red line represents their average.
Appendix 1—figure 7
Plasmid clusters containing blaTEM-1 carry more AMR genes.
Each point is one plasmid cluster. n=247 clusters are shown, with panels facetted by the number of niches the plasmid cluster represented. p-values are from the Wilcoxon test.
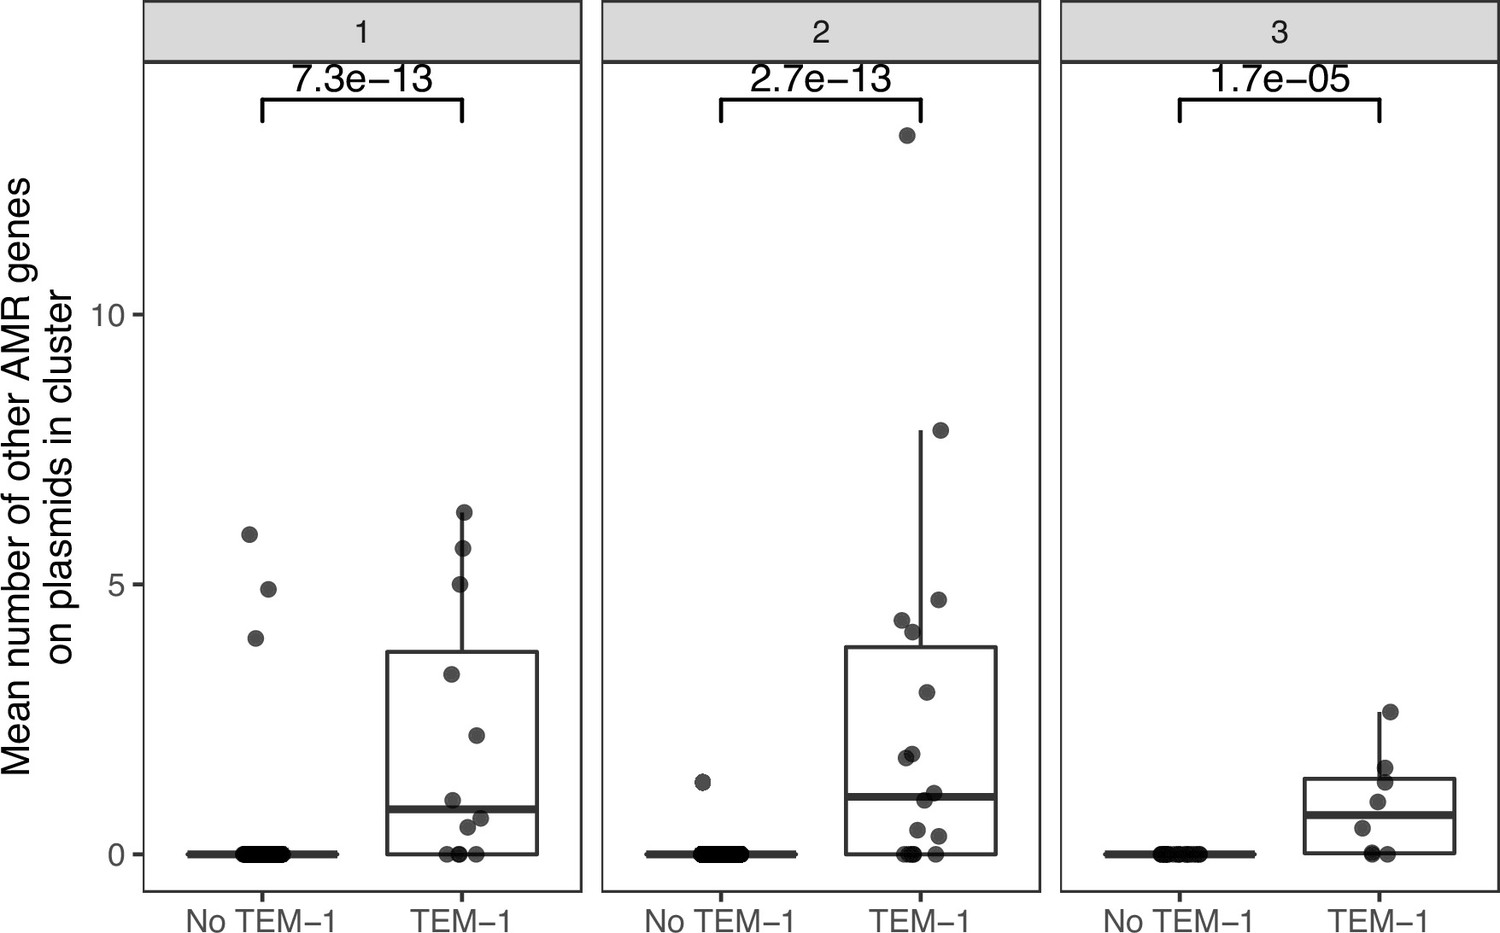
Appendix 1—figure 8
Plasmid accessory gene presence/absence Jaccard distance against core-gene cophenetic distance.
Presented are data points from 27/247 clusters for which (i) all plasmids had at least 1 core gene, and (ii) the cluster contained at least 50 accessory genes. The red line is a statistically significant (p-value <2.2e-16) log-transformed linear regression.
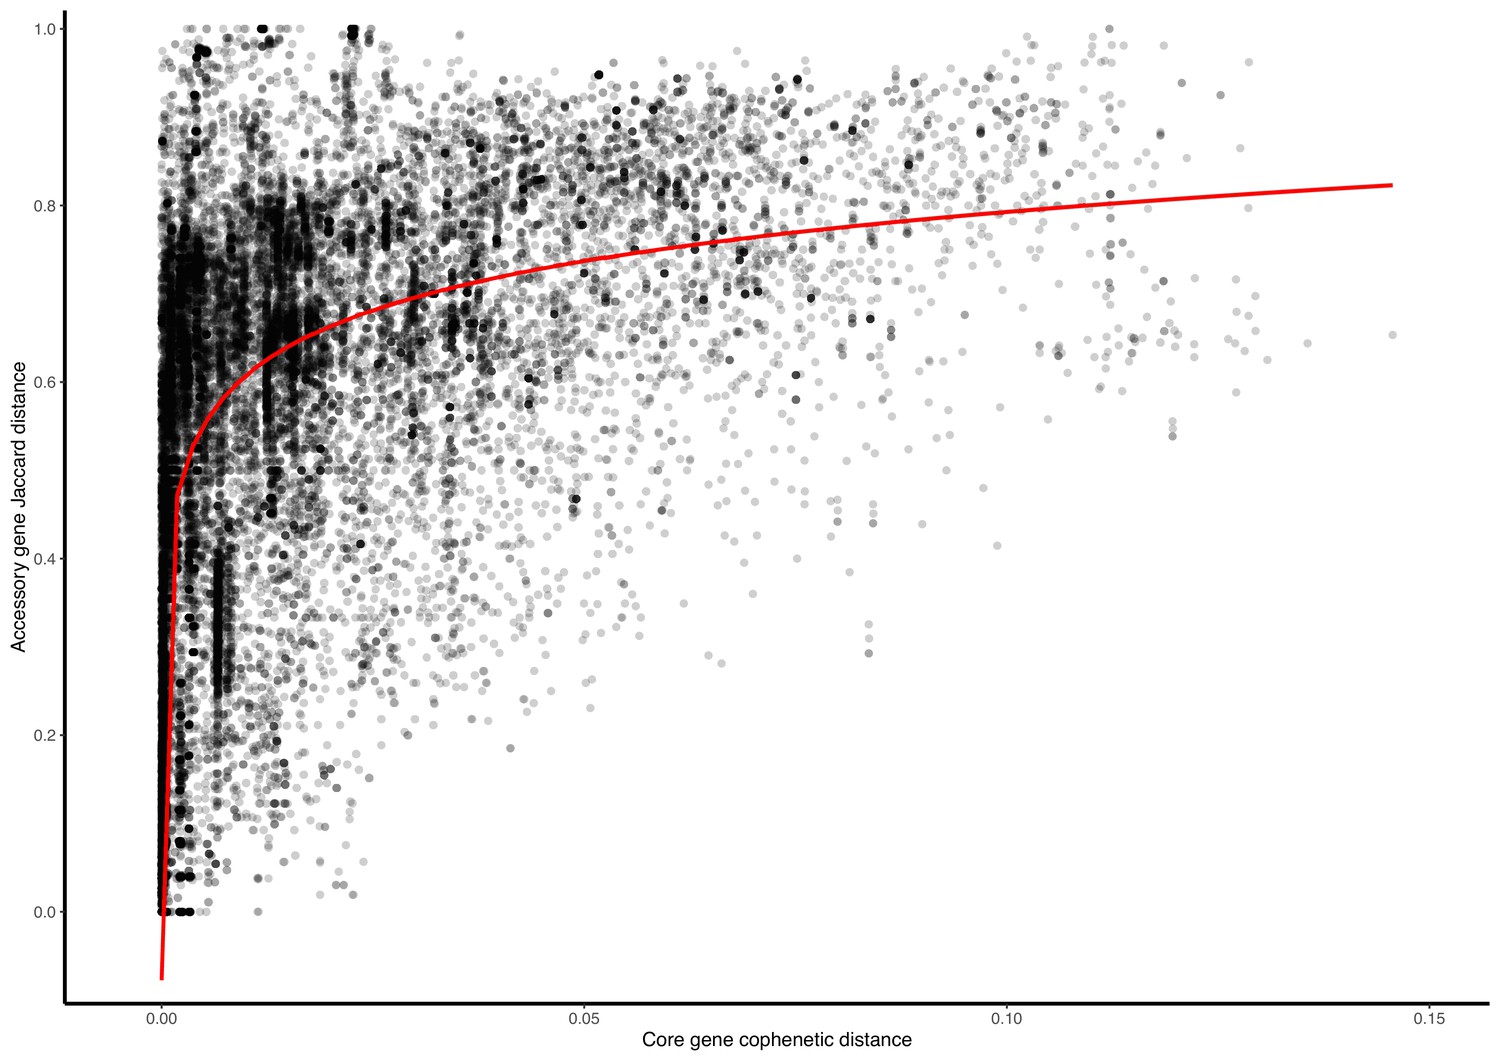
Appendix 1—figure 9
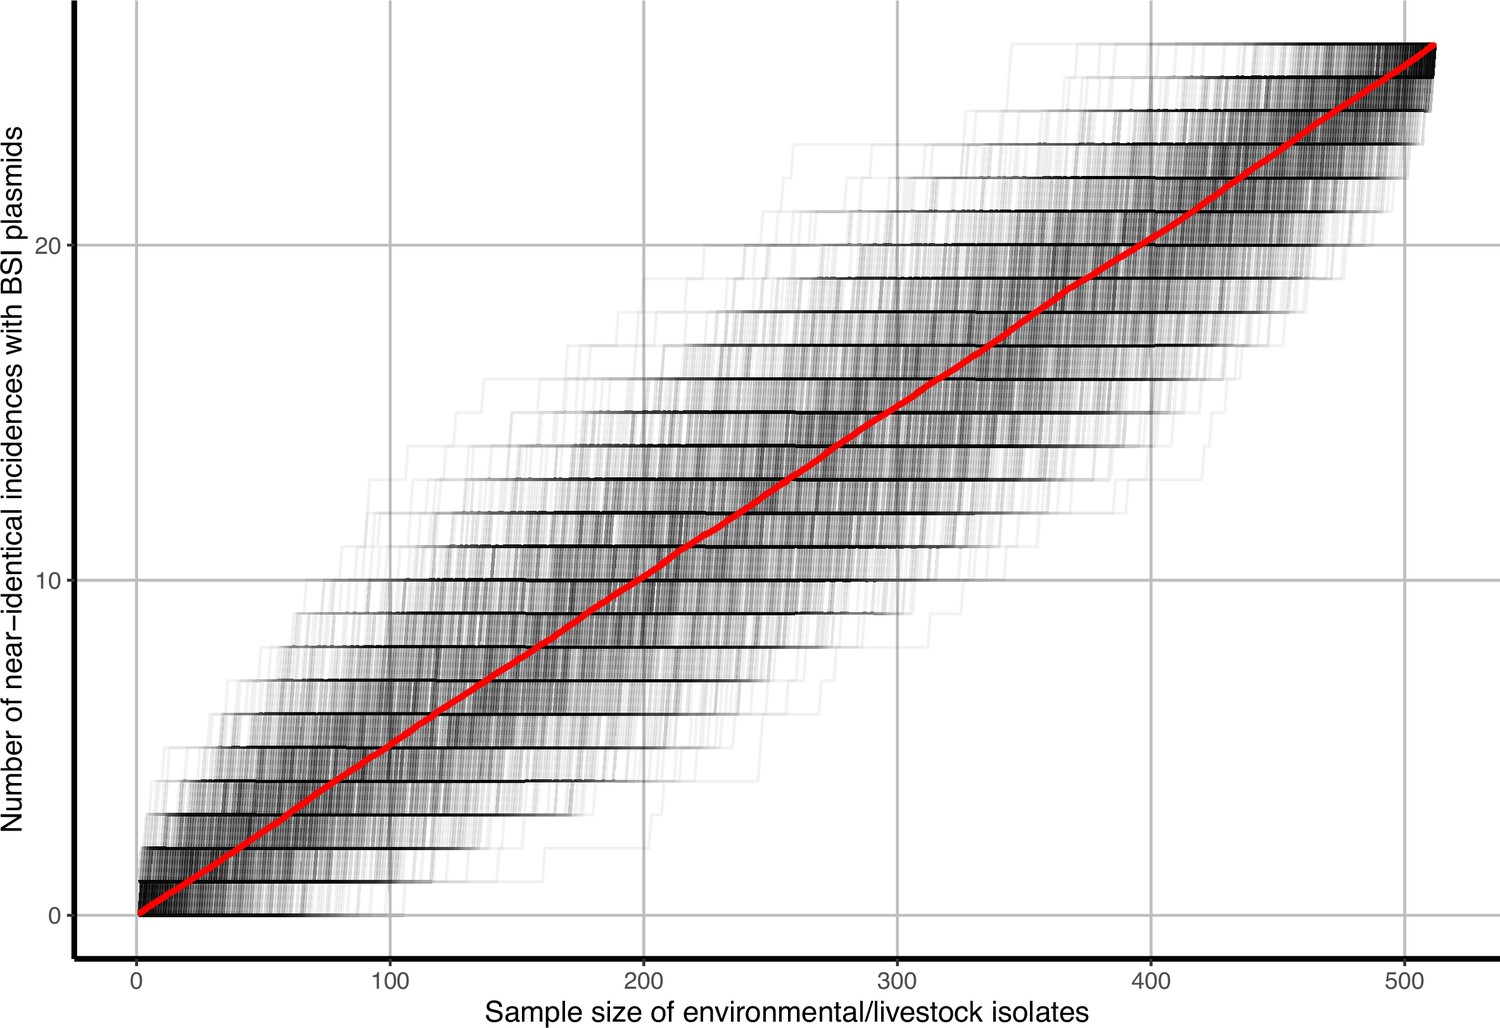
Accumulation curves of near-identical plasmid matches with bloodstream infection (BSI) plasmids and singletons against livestock-associated (environmental soils/livestock) isolate sample size.
Black lines represent b=1000 bootstrap simulations, red line represents their average.
Tables
Table 1
Isolate niche breakdown.
| Niche | Sample type(s) | No. isolates | No. plasmids |
|---|---|---|---|
| Bloodstream infections (BSIs) | Community, nosocomial, and other healthcare-associated infections | 738 | 1880 |
| Livestock-associated | Cattle faeces | 133 | 215 |
| Sheep faeces | 113 | 286 | |
| Pig faecesan | 104 | 352 | |
| Poultry faeces | 34 | 112 | |
| Soil surrounding livestock farms | 128 | 190 | |
| Wastewater treatment work (WwTW)-associated | Influent | 88 | 313 |
| Upstream waterways | 25 | 60 | |
| Effluent and downstream waterways | 95 | 289 | |
| Total | 1458 | 3697 | |
Table 2
Isolate genus breakdown.
| Niche | Isolate genus | Total | ||||
|---|---|---|---|---|---|---|
| Citrobacter | Enterobacter | Escherichia | Klebsiella | Other | ||
| Bloodstream infections (BSIs) | 6 | 11 | 547 | 161 | 13 | 738 |
| Livestock-associated | 54 | 10 | 433 | 14 | 1 | 512 |
| Wastewater treatment work (WwTW)-associated | 65 | 42 | 64 | 37 | 0 | 208 |
| Total | 125 | 63 | 1044 | 212 | 14 | 1458 |
Additional files
-
MDAR checklist
- https://cdn.elifesciences.org/articles/85302/elife-85302-mdarchecklist1-v2.docx
-
Supplementary file 1
In order, this file contains (i) a metadata table for all plasmid clusters where every plasmid has at least one core gene.
Presented are the cluster name, cluster size, mlst PubMLST genera of plasmid hosts, plasmid PlasmidFinder annotations, and plasmid NCBIAMRFinder annotations, and (ii) a core gene phylogeny and consensus gene synteny heatmap for all clusters in the metadata table, in cluster size decreasing order. Core gene phylogeny scales are in single nucleotide polymorphisms (SNPs).
- https://cdn.elifesciences.org/articles/85302/elife-85302-supp1-v2.zip
-
Supplementary file 2
Fritz and Purvis’ D estimates for the n=27/62 plasmid clusters that contained both bloodstream infection (BSI) and livestock-associated plasmids.
- https://cdn.elifesciences.org/articles/85302/elife-85302-supp2-v2.csv
-
Supplementary file 3
Isolate and assembly metadata.
- https://cdn.elifesciences.org/articles/85302/elife-85302-supp3-v2.csv
-
Supplementary file 4
Cluster 2 core and accessory pancontig gene annotations.
- https://cdn.elifesciences.org/articles/85302/elife-85302-supp4-v2.csv
Download links
A two-part list of links to download the article, or parts of the article, in various formats.
Downloads (link to download the article as PDF)
Open citations (links to open the citations from this article in various online reference manager services)
Cite this article (links to download the citations from this article in formats compatible with various reference manager tools)
Enterobacterales plasmid sharing amongst human bloodstream infections, livestock, wastewater, and waterway niches in Oxfordshire, UK
eLife 12:e85302.
https://doi.org/10.7554/eLife.85302


