Tryptophan metabolism determines outcome in tuberculous meningitis: a targeted metabolomic analysis
- Research Center for Care and Control of Infectious Diseases, Universitas Padjadjaran, Indonesia
- Department of Internal Medicine and Radboud Center of Infectious Diseases (RCI), Radboud University Medical Center, Netherlands
- The Broad Institute of MIT and Harvard, United States
- Oxford University Clinical Research Unit, Viet Nam
- Department of Neurology, Hasan Sadikin Hospital, Faculty of Medicine, Universitas Padjadjaran, Indonesia
- Department of Internal Medicine, Hasan Sadikin Hospital, Faculty of Medicine, Universitas Padjadjaran, Indonesia
- Department of Neurology, Cipto Mangunkusumo Hospital, Faculty of Medicine Universitas Indonesia, Indonesia
- Centre for Tropical Medicine and Global Health, Nuffield Department of Medicine, University of Oxford, United Kingdom
- London School of Hygiene and Tropical Medicine, United Kingdom
- Department of Medical Microbiology and Infection Prevention, Amsterdam University Medical Centre, Netherlands
- Hospital for Tropical Diseases, Viet Nam
- Pham Ngoc Thach Hospital for Tuberculosis and Lung Disease, Viet Nam
- Department of Biomedical Science, Faculty of Medicine, Universitas Padjadjaran, Indonesia
- Department of Computational Biology for Individualised Infection Medicine, Centre for Individualised Infection Medicine (CiiM) & TWINCORE, joint ventures between the Helmholtz-Centre for Infection Research (HZI) and the Hannover Medical School (MHH), Germany
- Oxford University Clinical Research Unit Indonesia, Faculty of Medicine Universitas Indonesia, Indonesia
Figures
Figure 1
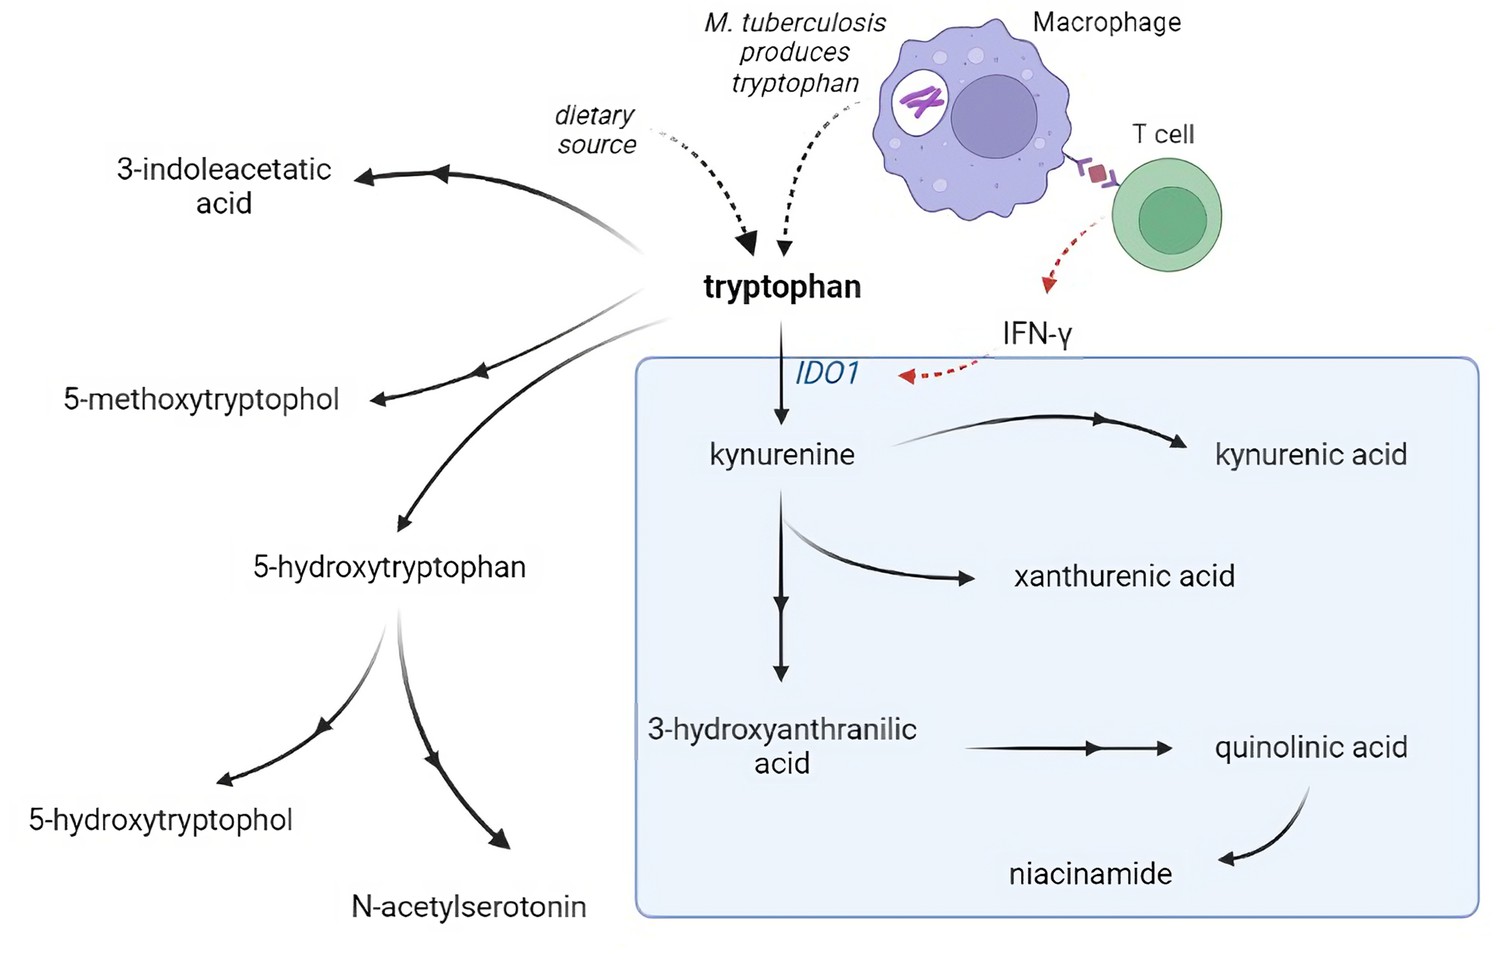
Tryptophan metabolism pathway.
Tryptophan is metabolized mainly through the kynurenine pathway through indoleamine 2,3-dioxygenase 1 (IDO1), generating kynurenine and its downstream metabolites (blue box). IDO1 is partly stimulated by M. tuberculosis-induced interferon gamma (IFN-γ) production by T helper 1cells.
Figure 2 with 5 supplements
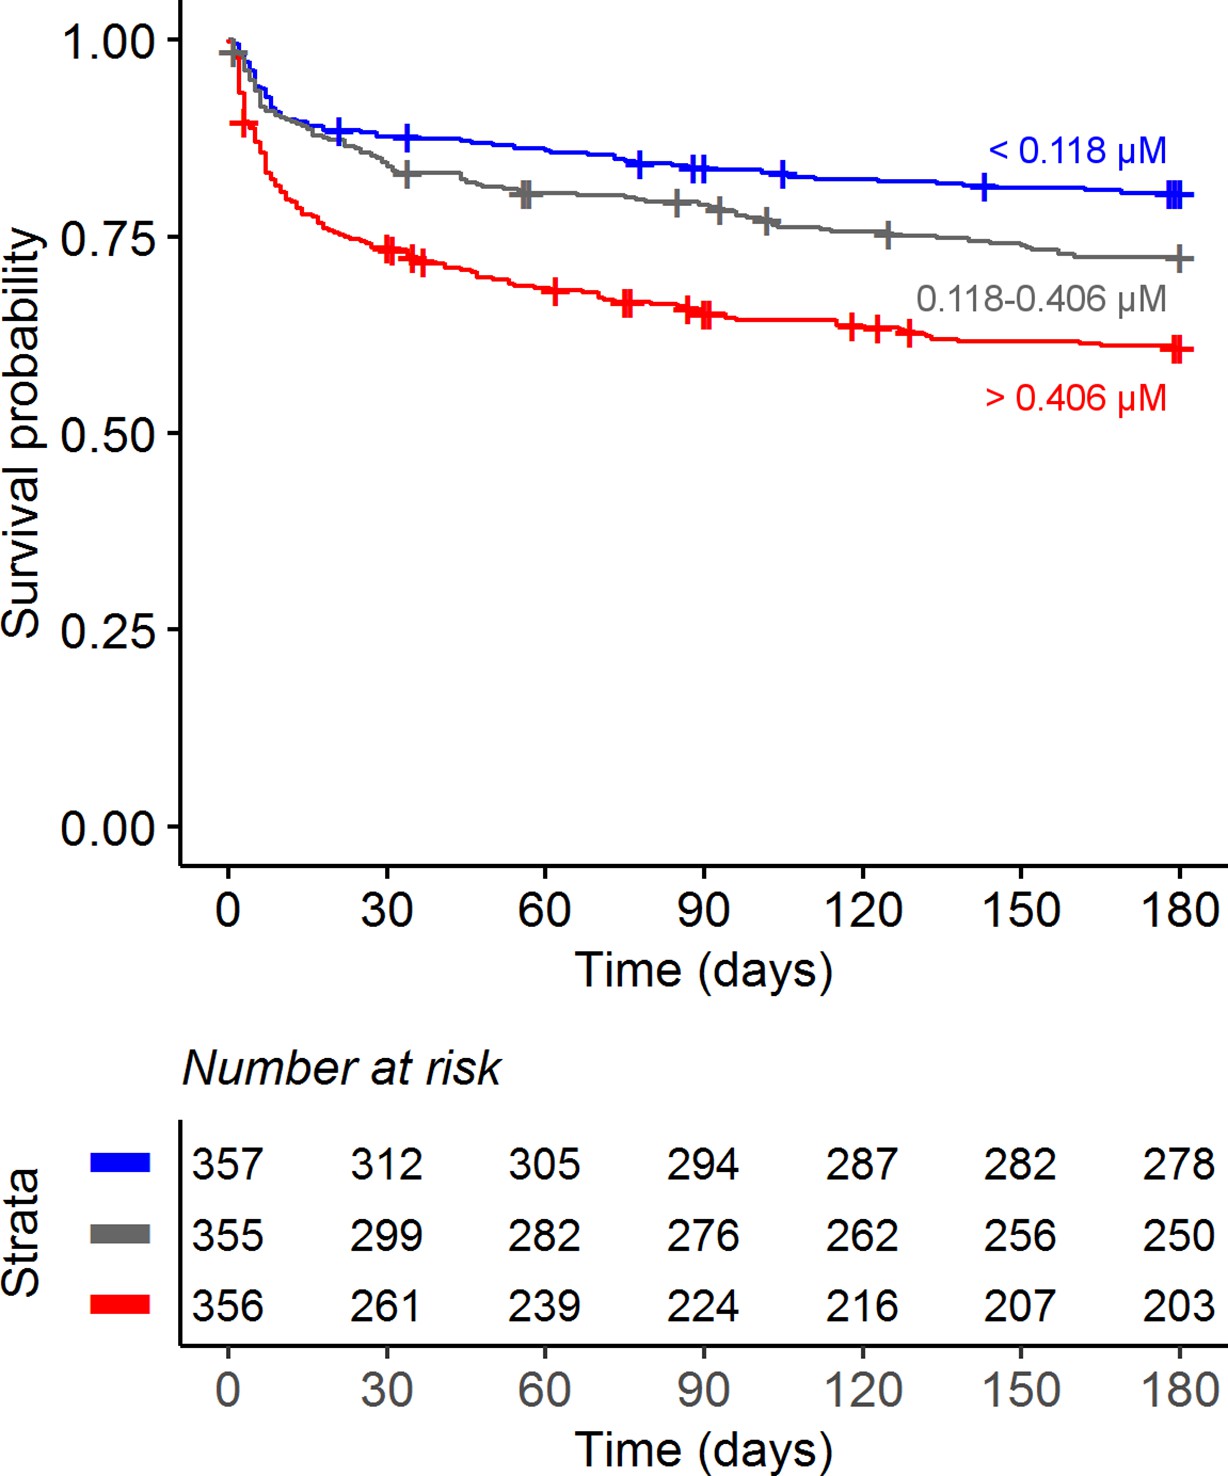
Six-month survival curve of tuberculous meningitis (TBM) patients.
Patients were stratified by cerebrospinal fluid (CSF) tryptophan concentrations tertiles.
Figure 2—figure supplement 1
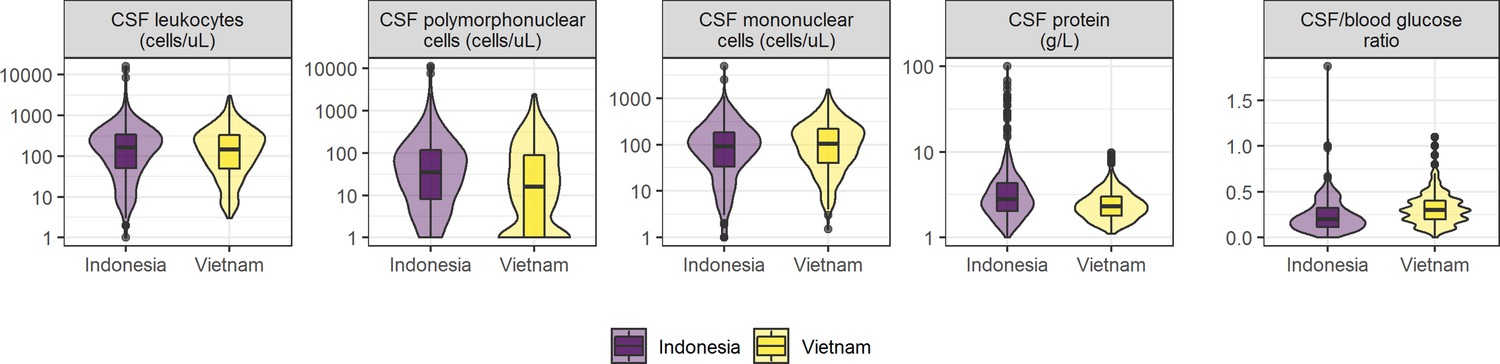
Cerebrospinal fluid (CSF) parameters of tuberculous meningitis (TBM) patients in Indonesia and Vietnam.
Distributions of leukocytes, polymorphonuclear cells, mononuclear cells, protein, and the ratio of CSF/blood glucose in Indonesian (purple) and Vietnamese (yellow) patients are depicted by violin plots.
Figure 2—figure supplement 2
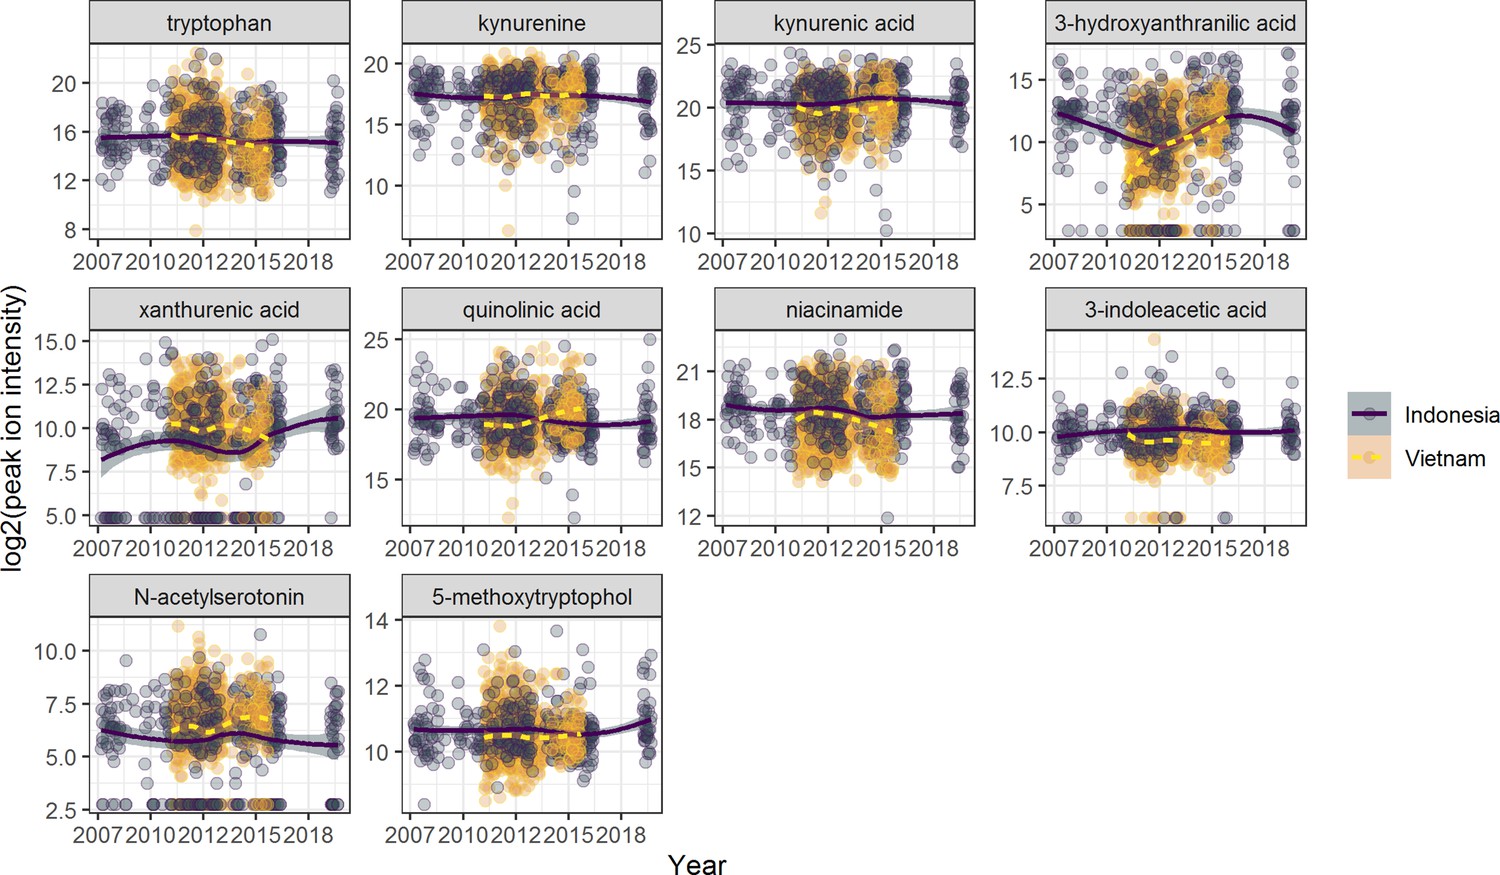
Stability of metabolites over-time.
The concentrations of tryptophan metabolites (in log2 scale) were measured in cerebrospinal fluid (CSF) samples from Indonesian (purple) and Vietnamese (yellow) tuberculous meningitis (TBM) patients were recruited between 2007 and 2018.
Figure 2—figure supplement 3
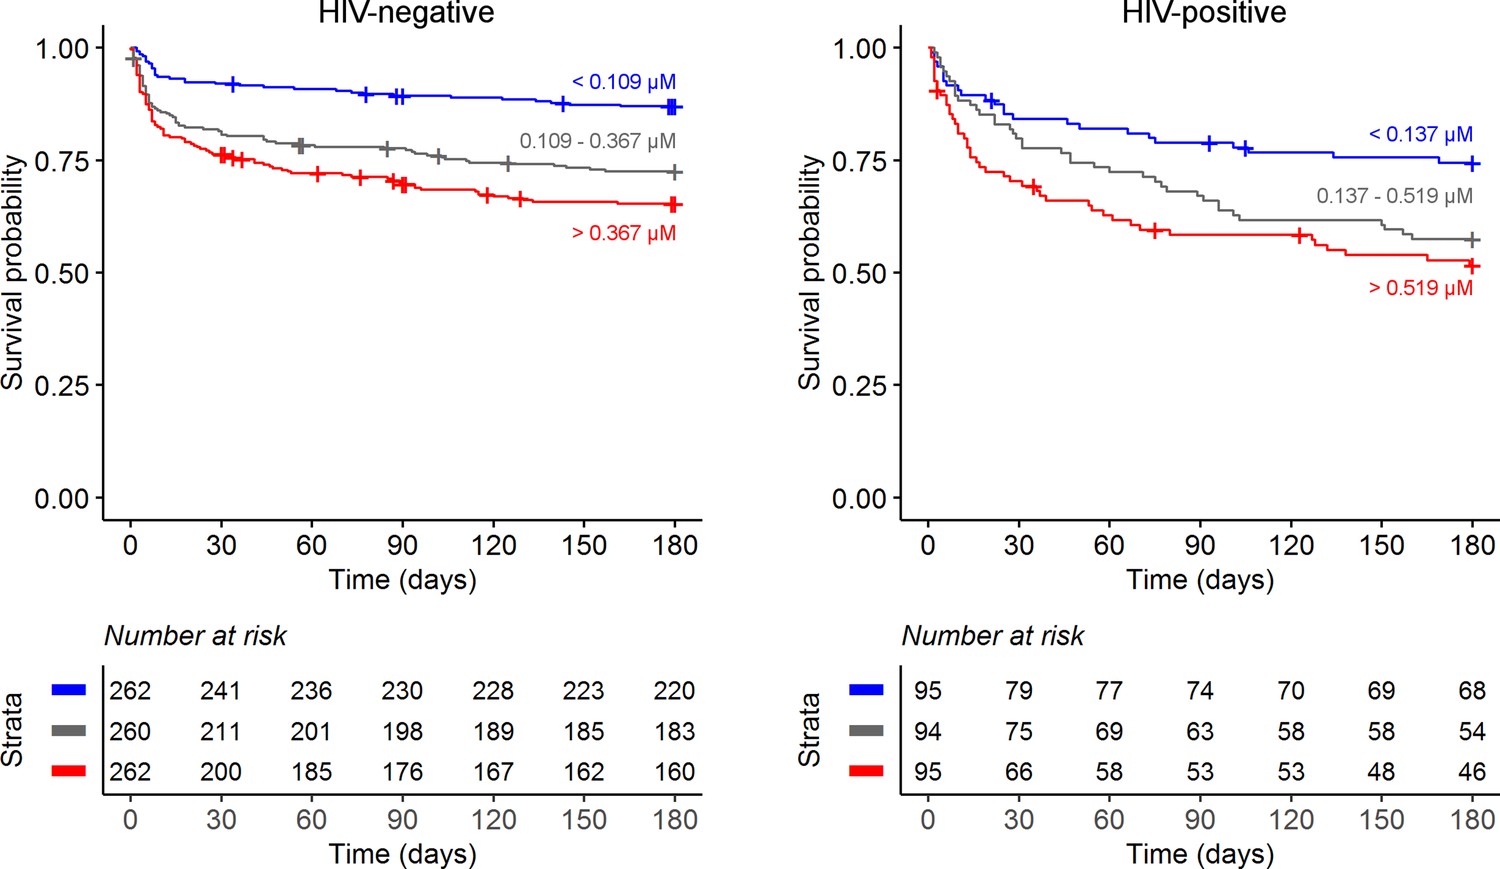
Six-month survival curve of tuberculous meningitis (TBM) patients stratified by HIV status.
Patients were stratified by tertiles based on cerebrospinal fluid (CSF) tryptophan concentrations (red = high tryptophan, gray = intermediate tryptophan, blue = low tryptophan).
Figure 2—figure supplement 4
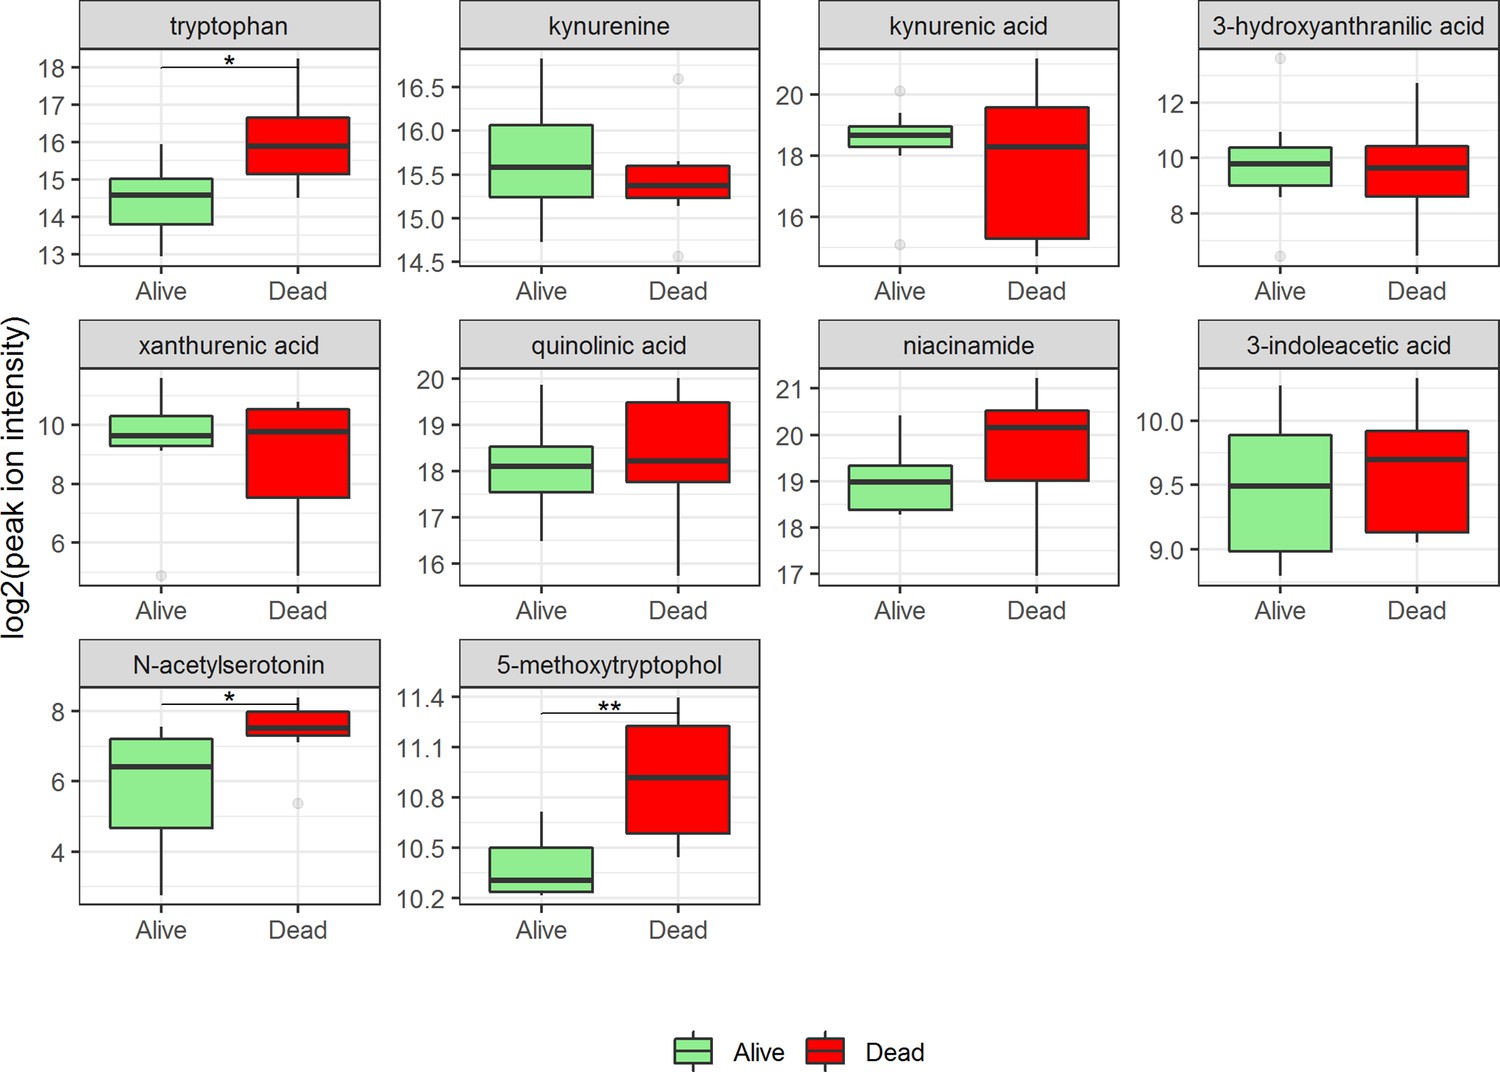
In-hospital mortality for 17 HIV-positive patients with cryptococcal meningitis.
Holm-adjusted Wilcoxon rank-sum test p-values are presented :*p<0.05, **p<0.01.
Figure 2—figure supplement 5
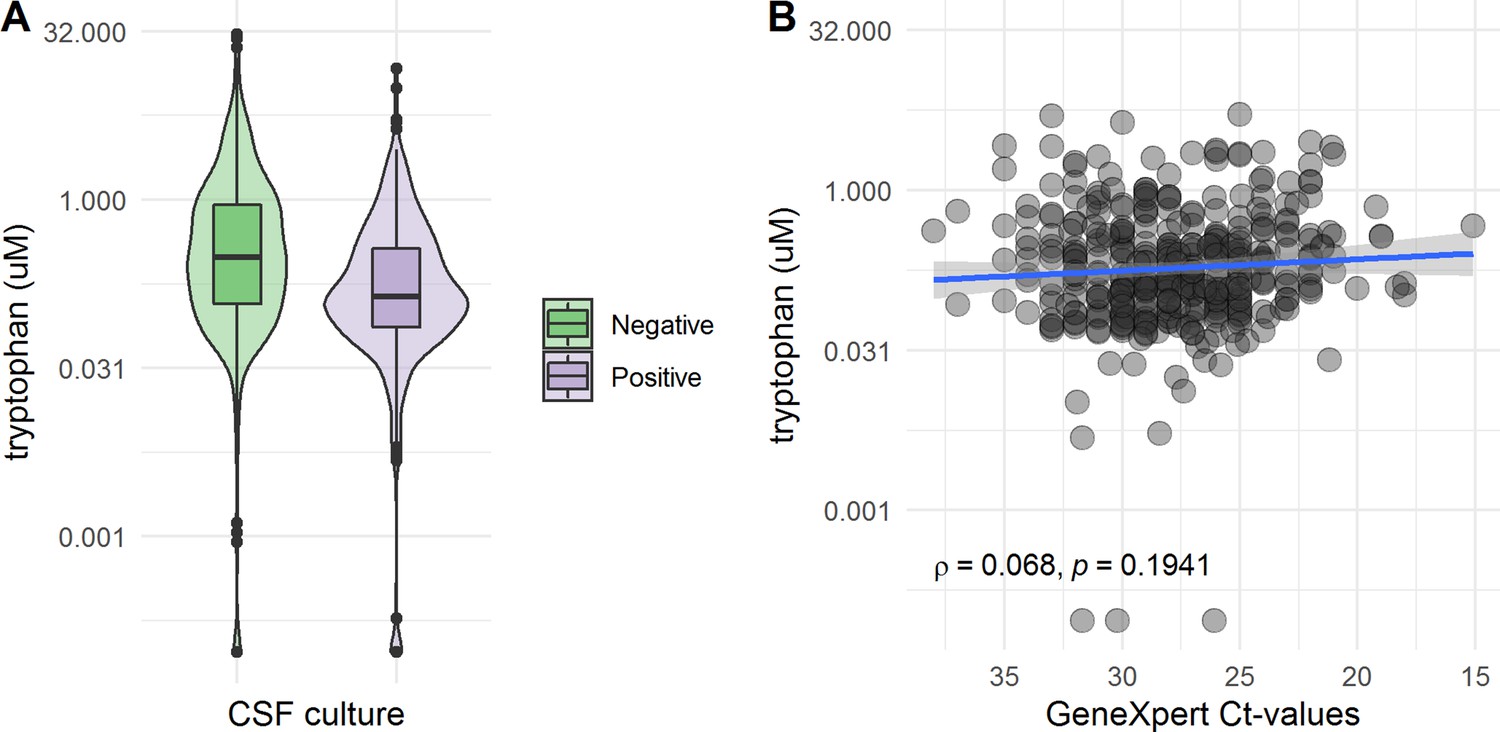
Cerebrospinal fluid (CSF) tryptophan distributions according to mycobacterial load.
(A) Comparing CSF culture-negative versus -positive patients and (B) among patients with a positive CSF Xpert, in culture-positive and -negative tuberculous meningitis (TBM) patients, CSF tryptophan was associated with CSF Xpert Ct-values from a low (high Ct-value) to low (low Ct-value) load.
Figure 3 with 1 supplement
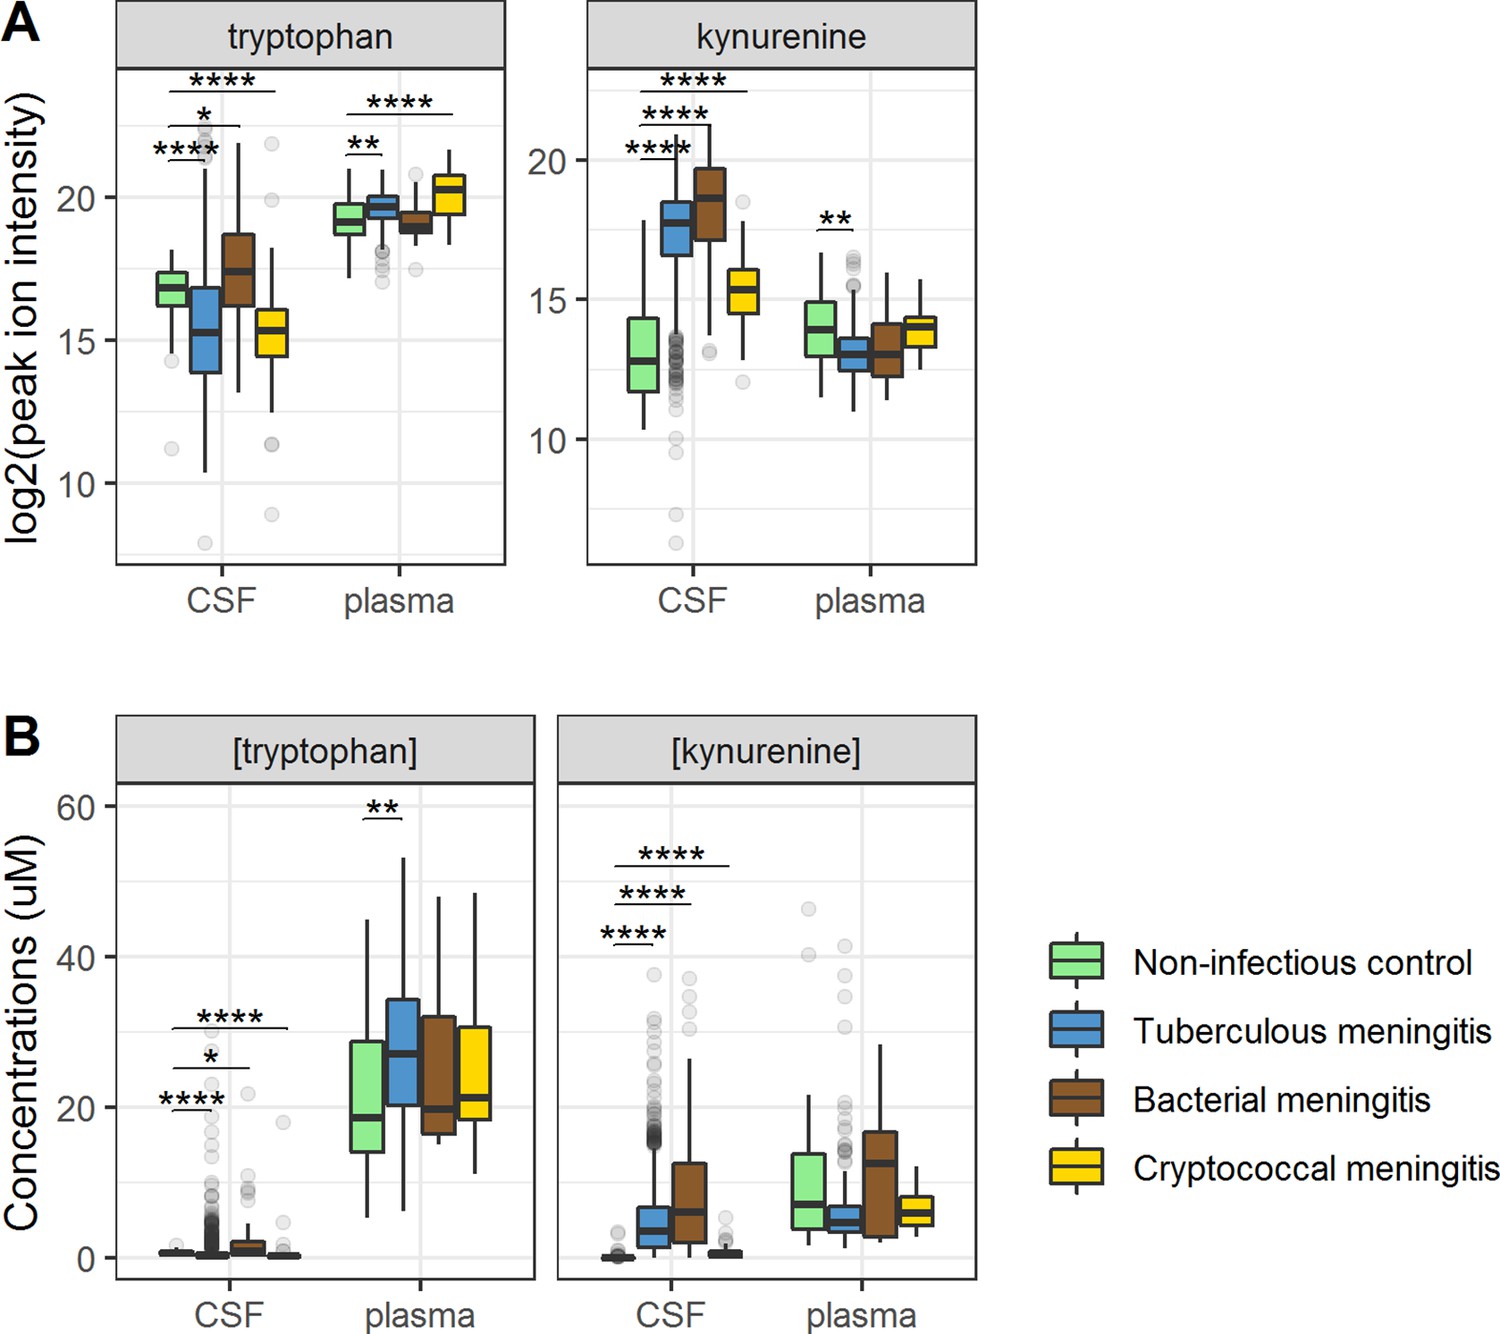
Cerebrospinal fluid and plasma metabolites concentrations in tuberculous meningitis (TBM) and all controls for the tryptophan metabolites associated with outcome: tryptophan and kynurenine.
(A) Relative concentrations based on peak ion intensity and (B) absolute concentrations in μM. Boxplots are shown with Holm-adjusted Wilcoxon rank-sum test p-values are presented: (*p<0.05, **p<0.01, ***p<0.001, ****p<0.0001). No measurements were excluded for these graphs. Note: plasma measurements were available for a subset of 300 TBM patients and all controls.
Figure 3—figure supplement 1
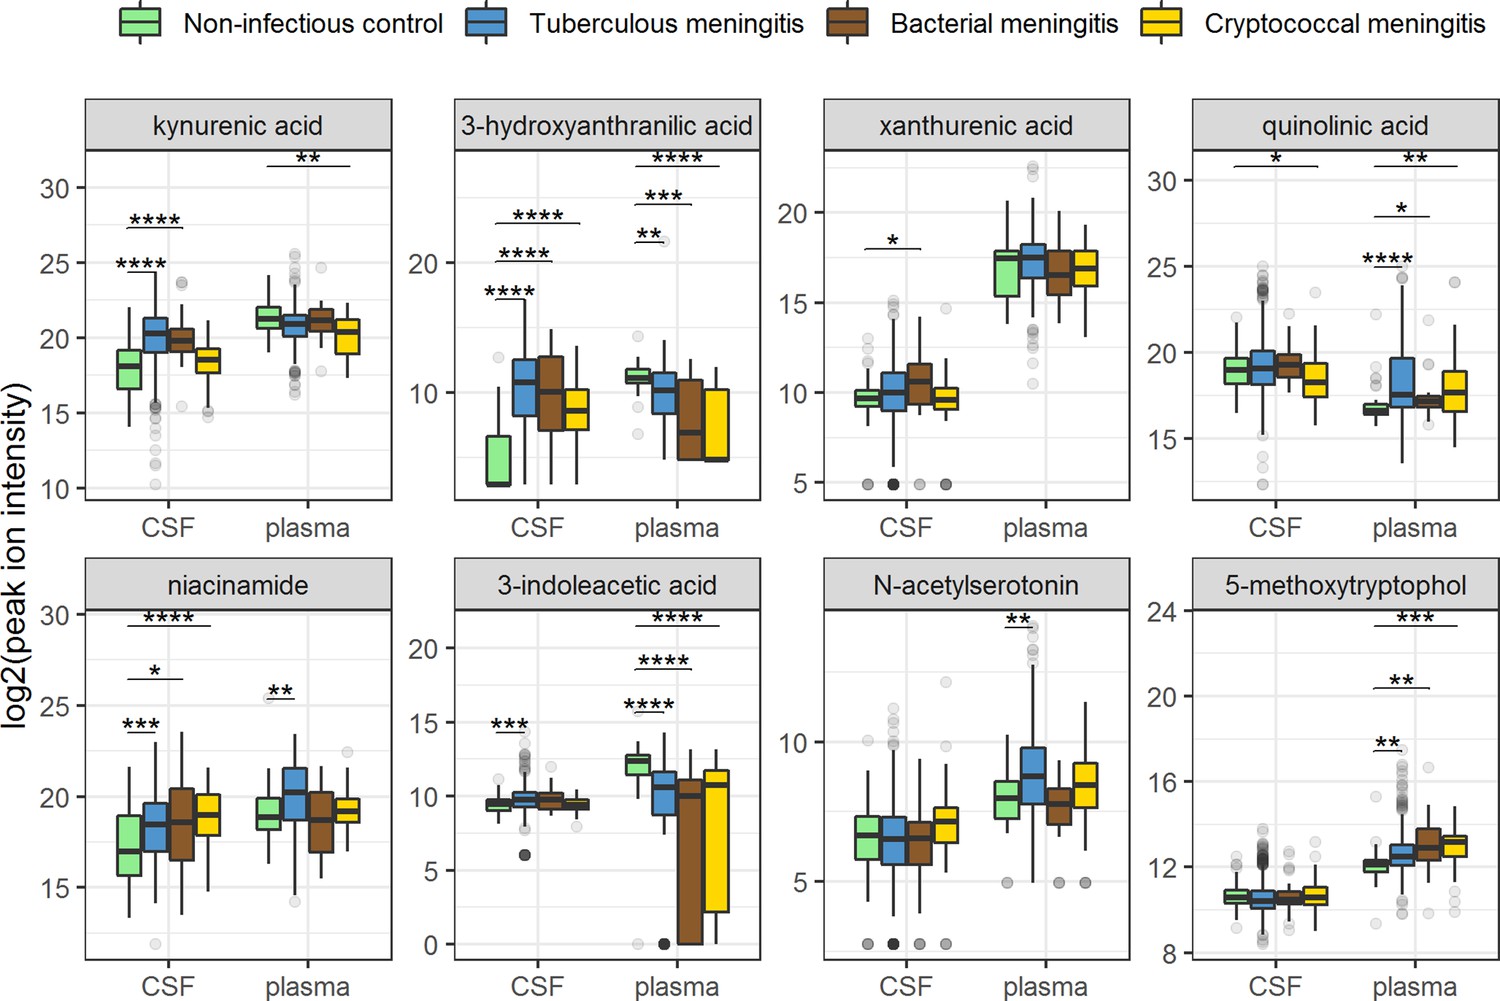
Boxplots of cerebrospinal fluid (CSF) and plasma metabolites concentrations in tuberculous meningitis (TBM) and controls.
Relative concentrations based on peak ion intensities are shown. CSF and plasma concentrations are not directly comparable. Boxplots are shown with Holm-adjusted Wilcoxon rank-sum test p-values are presented: *p<0.05, **p<0.01, ***p<0.001, ****p<0.0001. Note: plasma measurements were available for a subset of 300 TBM patients and all controls.
Figure 4 with 1 supplement
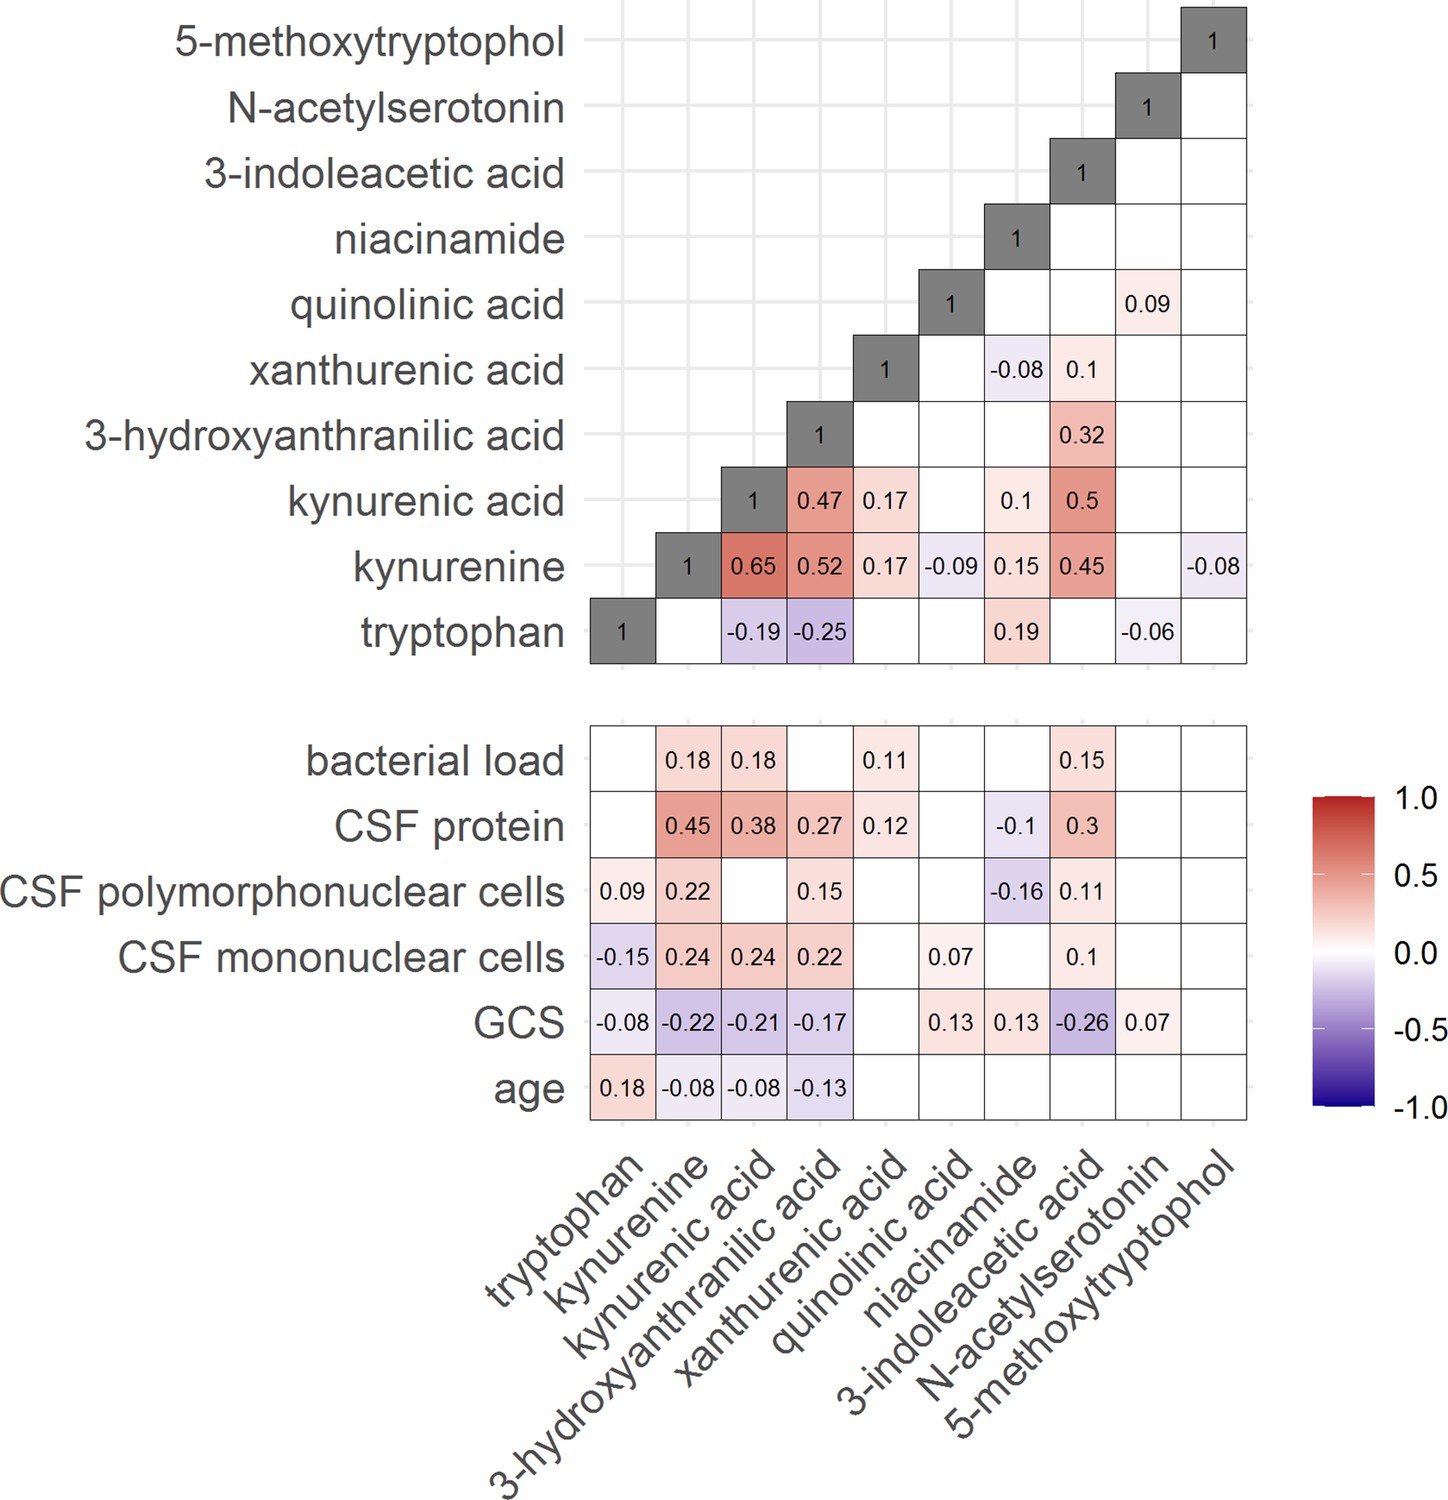
Correlation between tryptophan metabolites and with clinical and cerebrospinal fluid (CSF) parameters.
Significant Spearman’s correlation coefficients are presented in the correlation matrix, while the ones with not significant correlations were blank. Red indicates positive correlations, and blue indicates negative ones. The color gradient shows the strength of the associations.
Figure 4—figure supplement 1
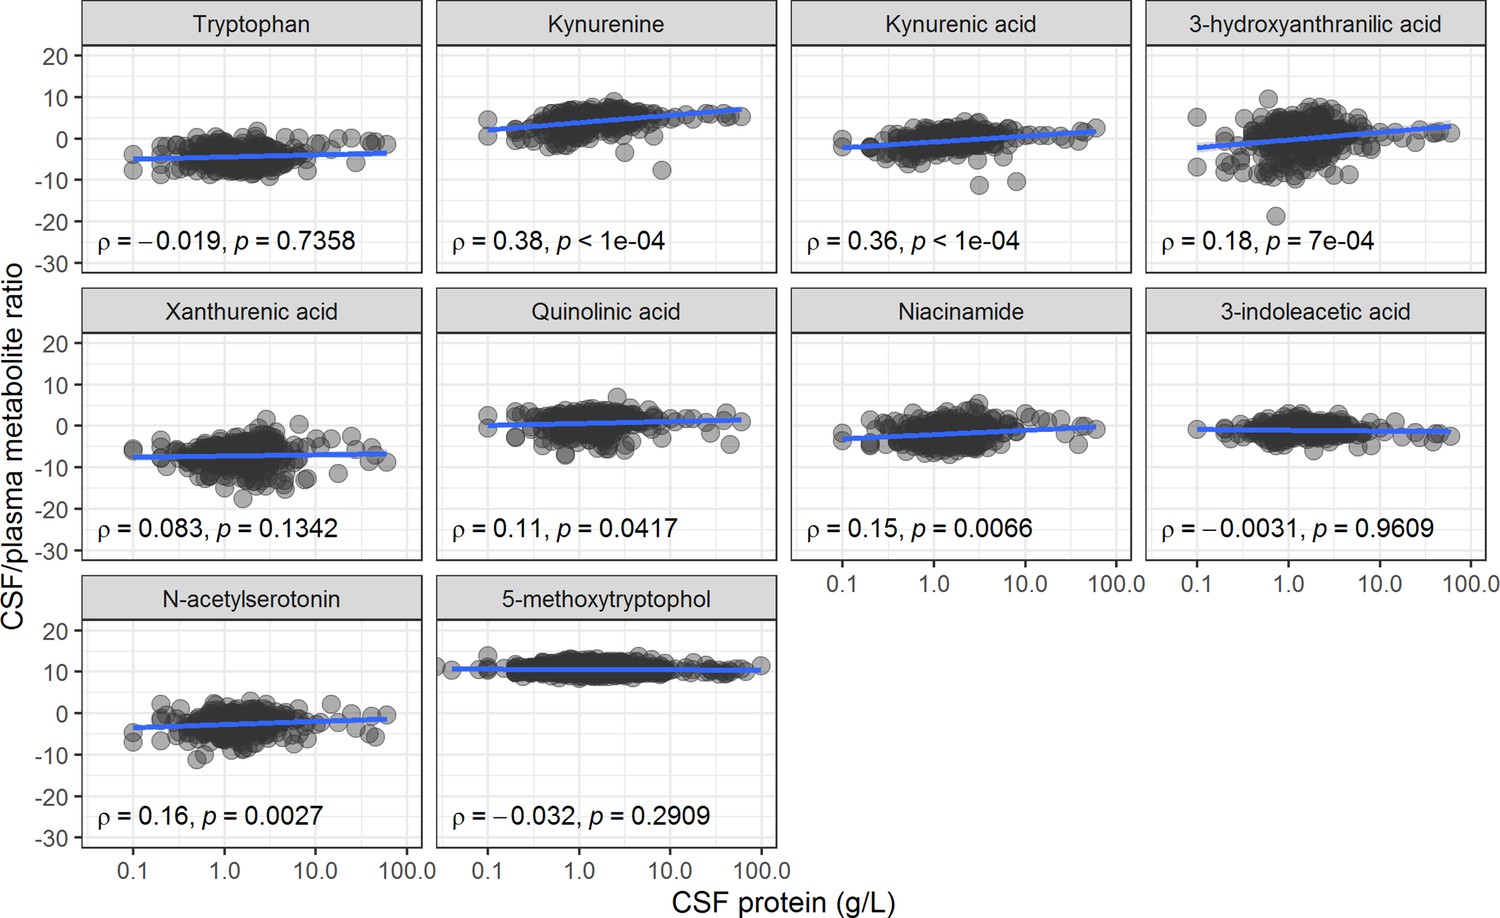
Associations between cerebrospinal fluid (CSF)/plasma metabolite ratios (y-axis) and CSF protein levels (as a proxy of CSF barrier leakage, x-axis).
Of note, 71 patients had undetectable plasma levels of 3-indolacetic acid and were removed from this graph.
Figure 5 with 1 supplement
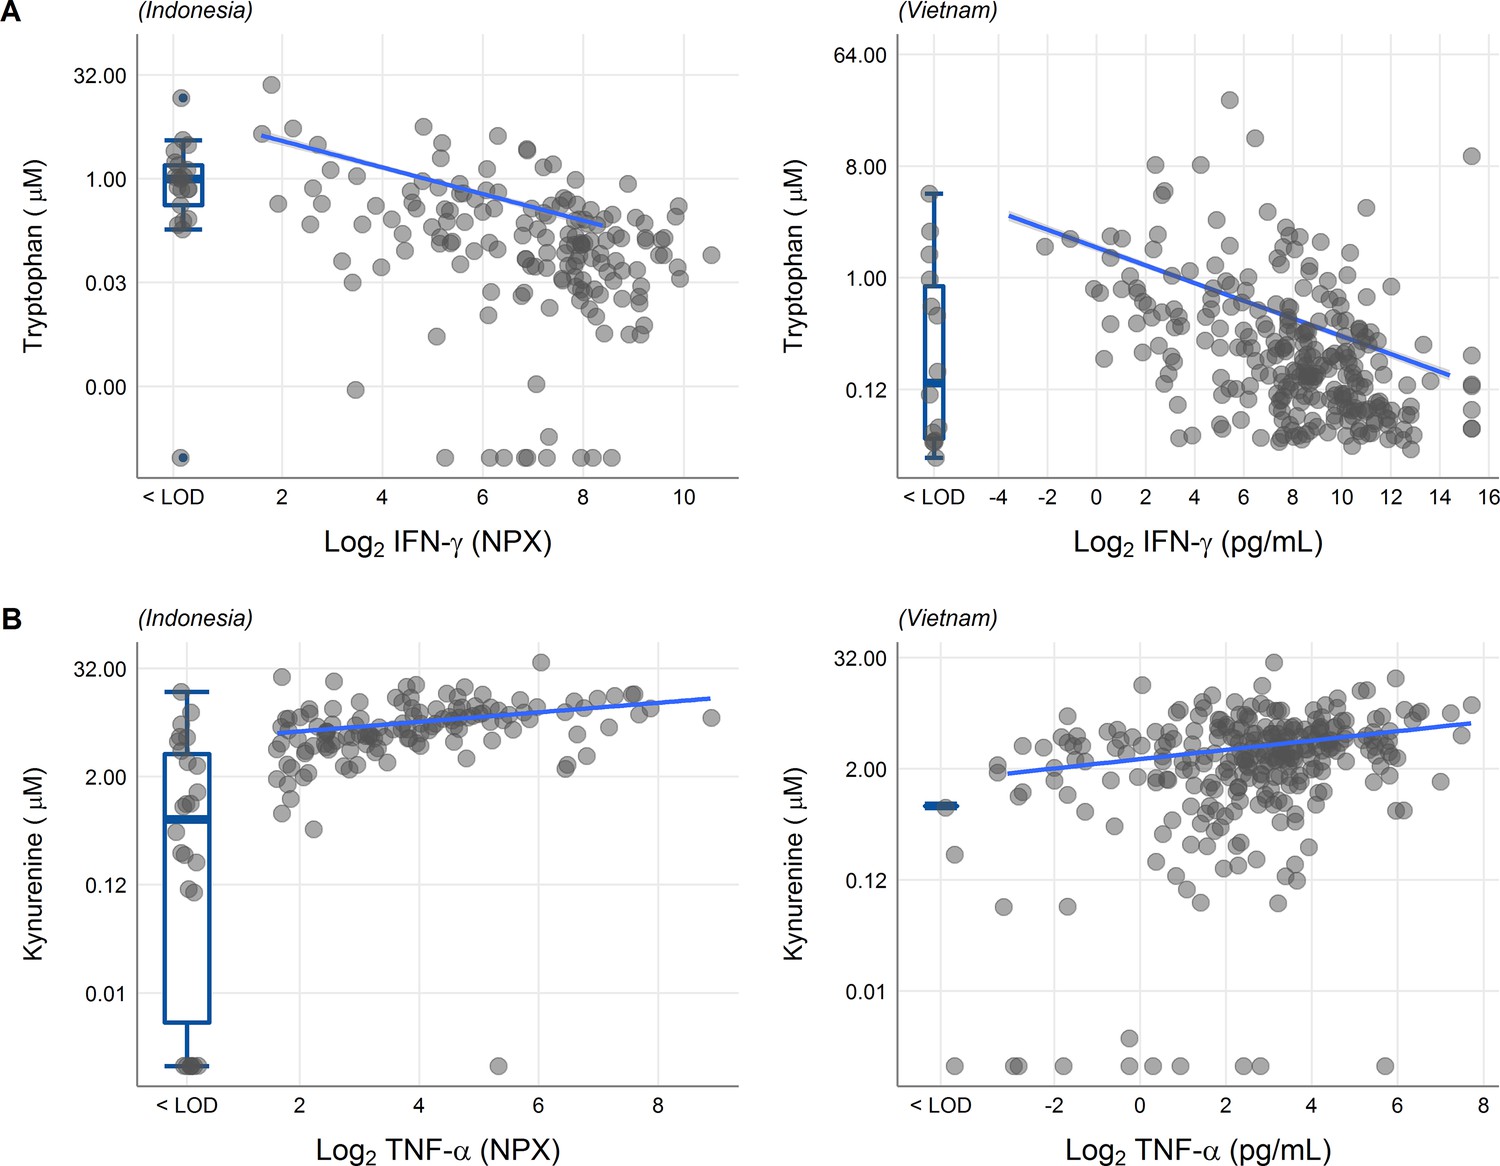
Associations of cerebrospinal fluid (CSF) tryptophan with IFN-γ (A) and with TNF-α (B) in 176 Indonesian (left) and 304 (Vietnamese) tuberculous meningitis (TBM) patients.
The boxplots on the left of each plot show the association of metabolites with cytokines below the detection limit. Abbreviations: IFN-γ: interferon gamma, TNF-α: tumor necrosis factor alpha, LOD: lower limit of detection.
Figure 5—figure supplement 1
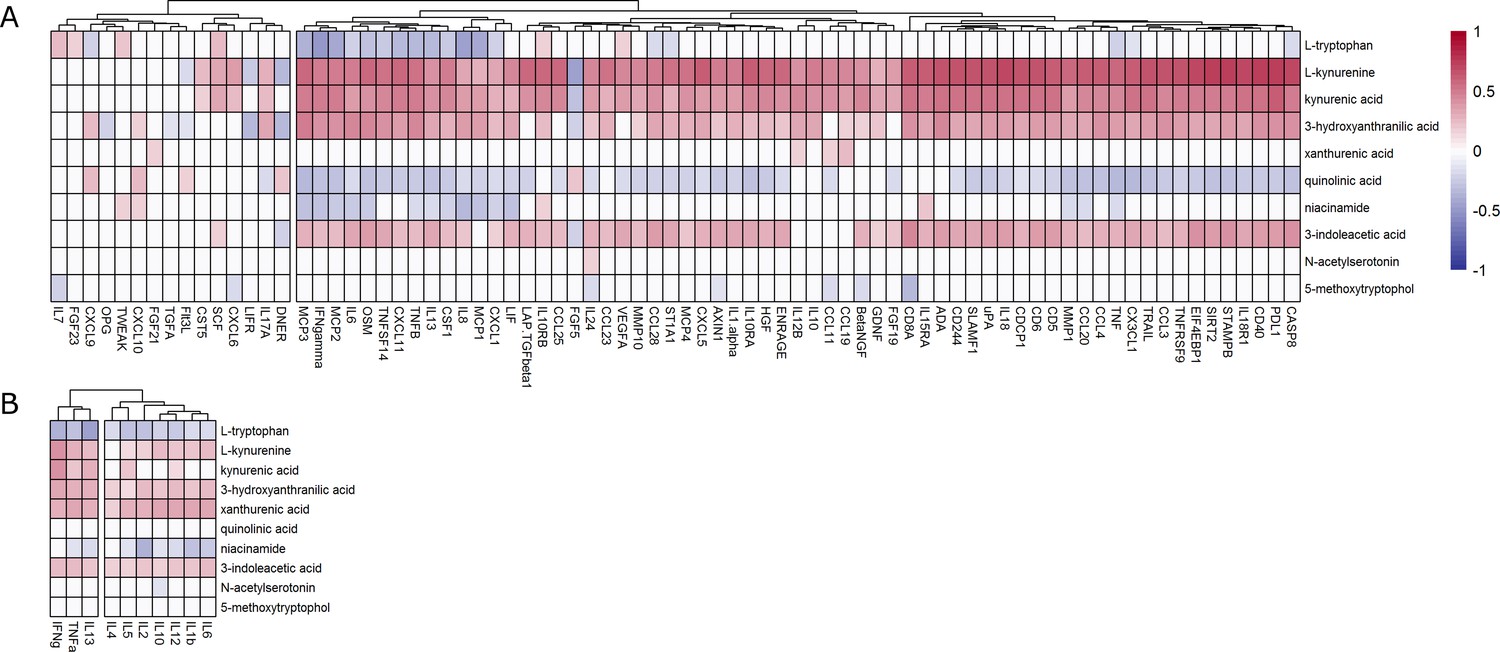
Correlation between cerebrospinal fluid (CSF) tryptophan metabolites and inflammatory markers measured with O-link in Indonesian (A) and Vietnamese (B) tuberculous meningitis patients.
Inflammatory markers were clustered based on their correlation coefficients using hierarchical clustering. Red indicates positive correlation, and blue indicated negative correlation.
Tables
Table 1
Patient baseline characteristics.
| Tuberculous meningitis | Non-infectious control | Bacterial meningitis* | Cryptococcal meningitis* | |
|---|---|---|---|---|
| (n = 1069) | (n = 54) | (n = 50) | (n = 60) | |
| Clinical features | ||||
| Age, years | 34 (27–44) | 35 (25–44) | 46 (34–57) | 33 (27–37) |
| Sex, % male | 700 (65.5%) | 30 (55.6%) | 12 (60.0%) | 26 (78.8%) |
| Glasgow Coma Scale | 14 (12–15) | 15 (12–15) | 13 (9–14) | 15 (13–15) |
| HIV, % positive | 284 (26.6%) | 11 (20.4%) | 0 (0%) | 60 (100%) |
| Tuberculous meningitis grade (%) | ||||
| Grade I | 287 (27.3%) | - | - | - |
| Grade II | 584 (55.6%) | - | - | - |
| Grade III | 179 (17.0%) | - | - | - |
| Cerebrospinal fluid features | ||||
| Leukocytes, cells/μl | 150 (49–336) | 2 (1–3) | 1900 (739–5460) | 86 (24–192) |
| Neutrophils, cells/μl | 22 (3–99) | 1 (0–1) | 1527 (538–4986) | 17 (6–109) |
| Mononuclear cells, cells/μl | 98 (38–207) | 2 (1–3) | 307 (134–646) | 31 (6–89) |
| Protein, g/l | 1.46 (0.90–2.40) | 0.40 (0.26–0.59) | 1.90 (1.10–3.80) | 0.76 (0.58–1.60) |
| CSF to blood glucose ratio | 0.28 (0.17–0.40) | 0.60 (0.56–0.70) | 0.46 (0.17–1.00) | 0.50 (0.30–1.00) |
| M. tuberculosis culture or ZN staining or GeneXpert positive | 686 (64.17%) | - | - | - |
| Outcomes | ||||
| Outcome at day 60 | ||||
| Alive | 825 (77.2%) | - | - | - |
| Deceased | 231 (21.6%) | - | - | - |
| Lost to follow-up | 13 (1.2%) | - | - | - |
| Outcome at day 180 | ||||
| Alive | 731 (68.4%) | - | - | - |
| Deceased | 304 (28.4%) | - | - | - |
| Lost to follow-up | 34 (3.2%) | - | - | - |
-
Categorical variables are presented in N (%); continuous variables are presented in median (IQR). Abbreviation: CSF = cerebrospinal fluid.
-
*
Clinical metadata available for 40% of bacterial meningitis and 56% of cryptococcal meningitis patients.
Table 2
Univariate Cox regression for influence of cerebrospinal fluid (CSF) metabolites on 60-day mortality.
| Metabolites | HR* | 95% CI* | p-value | FDR† |
|---|---|---|---|---|
| Tryptophan | 1.16 | 1.10, 1.24 | <0.001 | <0.001 |
| Kynurenine | 1.00 | 0.93, 1.07 | >0.9 | >0.9 |
| Kynurenic acid | 1.00 | 0.93, 1.07 | 0.9 | >0.9 |
| 3-Hydroxyanthranilic acid | 1.01 | 0.97, 1.05 | 0.6 | 0.9 |
| Xanthurenic acid | 0.95 | 0.90, 1.00 | 0.05 | 0.2 |
| Quinolinic acid | 0.92 | 0.85, 1.00 | 0.038 | 0.2 |
| Niacinamide | 1.03 | 0.95, 1.11 | 0.5 | 0.8 |
| 3-Indoleacetic acid | 1.11 | 0.96, 1.29 | 0.2 | 0.4 |
| N-Acetylserotonin | 1.01 | 0.94, 1.09 | 0.7 | 0.9 |
| 5-Methoxytryptophol | 1.11 | 0.93, 1.32 | 0.3 | 0.5 |
-
Baseline cerebrospinal fluid (CSF) metabolites were measured in 1069 TBM patients. Cox regression models were stratified by cohort and adjusted by sex, age, and HIV status. Hazard ratio (HR) was calculated per twofold increase in metabolite concentration. Bold: False Discovery Rate (FDR) < 0.05.
-
*
HR = hazard ratio, CI = confidence interval.
-
†
FDR = false discovery rate; Benjamini and Hochberg correction for multiple testing.
Table 3
Univariate Cox regression for influencen of baseline cerebrospinal fluid (CSF) metabolites on early and late mortality.
| Metabolite | Early mortality (days 0–14) | Late mortality (days 14–180) | ||||||
|---|---|---|---|---|---|---|---|---|
| HR* | 95% CI* | p-value | FDR† | HR* | 95% CI* | p-value | FDR† | |
| Tryptophan | 1.14 | 1.06, 1.23 | <0.001 | 0.005 | 1.17 | 1.08, 1.26 | <0.001 | <0.001 |
| Kynurenine | 1.03 | 0.95, 1.13 | 0.4 | 0.6 | 1 | 0.91, 1.10 | >0.9 | >0.9 |
| Kynurenic acid | 1.05 | 0.96, 1.14 | 0.3 | 0.5 | 0.95 | 0.86, 1.04 | 0.3 | 0.5 |
| 3-Hydroxyanthranilic acid | 1.02 | 0.97, 1.06 | 0.5 | 0.6 | 1.01 | 0.96, 1.06 | 0.6 | 0.7 |
| Xanthurenic acid | 0.96 | 0.90, 1.03 | 0.2 | 0.5 | 0.96 | 0.89, 1.04 | 0.3 | 0.5 |
| Quinolinic acid | 0.89 | 0.81, 0.98 | 0.02 | 0.1 | 0.9 | 0.81, 1.00 | 0.052 | 0.2 |
| Niacinamide | 1.02 | 0.92, 1.12 | 0.7 | 0.7 | 1.05 | 0.95, 1.16 | 0.3 | 0.5 |
| 3-Indoleacetic acid | 1.1 | 0.92, 1.32 | 0.3 | 0.5 | 1.18 | 0.97, 1.43 | 0.093 | 0.2 |
| N-Acetylserotonin | 1.05 | 0.96, 1.14 | 0.3 | 0.5 | 0.96 | 0.88, 1.06 | 0.4 | 0.5 |
| 5-Methoxytryptophol | 1.09 | 0.87, 1.35 | 0.5 | 0.6 | 1.29 | 1.04, 1.59 | 0.02 | 0.1 |
-
Baseline cerebrospinal fluid (CSF) metabolites were measured in 1069 TBM patients. Cox regression models were stratified by sites and adjusted by age, sex, and GCS. Bold: False Discovery Rate (FDR) < 0.05.
-
*
HR = hazard ratio, CI = confidence interval.
-
†
Benjamini and Hochberg correction for multiple testing.
Table 4
Univariate Cox regression for influence of baseline plasma metabolites on 60-day mortality.
| Metabolite | HR* | 95% CI* | p-value | FDR† |
|---|---|---|---|---|
| Tryptophan | 0.8 | 0.56, 1.16 | 0.2 | 0.4 |
| Kynurenine | 1.54 | 1.22, 1.93 | <0.001 | 0.002 |
| Kynurenic acid | 1.2 | 1.01, 1.43 | 0.036 | 0.2 |
| 3-Hydroxyanthranilic acid | 1.13 | 1.00, 1.28 | 0.045 | 0.2 |
| Xanthurenic acid | 1.11 | 0.98, 1.25 | 0.1 | 0.3 |
| Quinolinic acid | 0.99 | 0.88, 1.12 | 0.9 | 0.9 |
| Niacinamide | 0.92 | 0.79, 1.07 | 0.3 | 0.4 |
| 3-Indoleacetic acid | 1.04 | 0.97, 1.12 | 0.3 | 0.4 |
| N-Acetylserotonin | 1.05 | 0.91, 1.22 | 0.5 | 0.6 |
| 5-Methoxytryptophol | 1.04 | 0.85, 1.28 | 0.7 | 0.8 |
-
Baseline plasma tryptophan metabolites were measured in a subset 300 patients. Cox regression models were stratified by sites and adjusted by age, sex, and GCS. Bold: False Discovery Rate (FDR) < 0.05.
-
*
HR = hazard ratio, CI = confidence interval.
-
†
Benjamini and Hochberg correction for multiple testing.
Additional files
-
MDAR checklist
- https://cdn.elifesciences.org/articles/85307/elife-85307-mdarchecklist1-v2.docx
-
Source data 1
The source data includes clinical metadata and LC-MS data before pre-processing.
- https://cdn.elifesciences.org/articles/85307/elife-85307-data1-v2.xlsx
-
Reporting standard 1
- https://cdn.elifesciences.org/articles/85307/elife-85307-repstand1-v2.doc
Download links
A two-part list of links to download the article, or parts of the article, in various formats.
Downloads (link to download the article as PDF)
Open citations (links to open the citations from this article in various online reference manager services)
Cite this article (links to download the citations from this article in formats compatible with various reference manager tools)
Tryptophan metabolism determines outcome in tuberculous meningitis: a targeted metabolomic analysis
eLife 12:e85307.
https://doi.org/10.7554/eLife.85307


