The structural basis of the multi-step allosteric activation of Aurora B kinase
- Centre for Molecular Medicine Norway (NCMM), Nordic EMBL Partnership, Faculty of Medicine, Norway
- Department of Biosciences, University of Oslo, Norway
- Hylleraas Centre for Quantum Molecular Sciences, University of Oslo, Norway
- Department of Biochemistry and Biophysics, Penn Center for Genome Integrity, Epigenetics Institute, Perelman School of Medicine, University of Pennsylvania, United States
- Department of Chemistry, University of Oslo, Norway
Figures
Figure 1 with 4 supplements
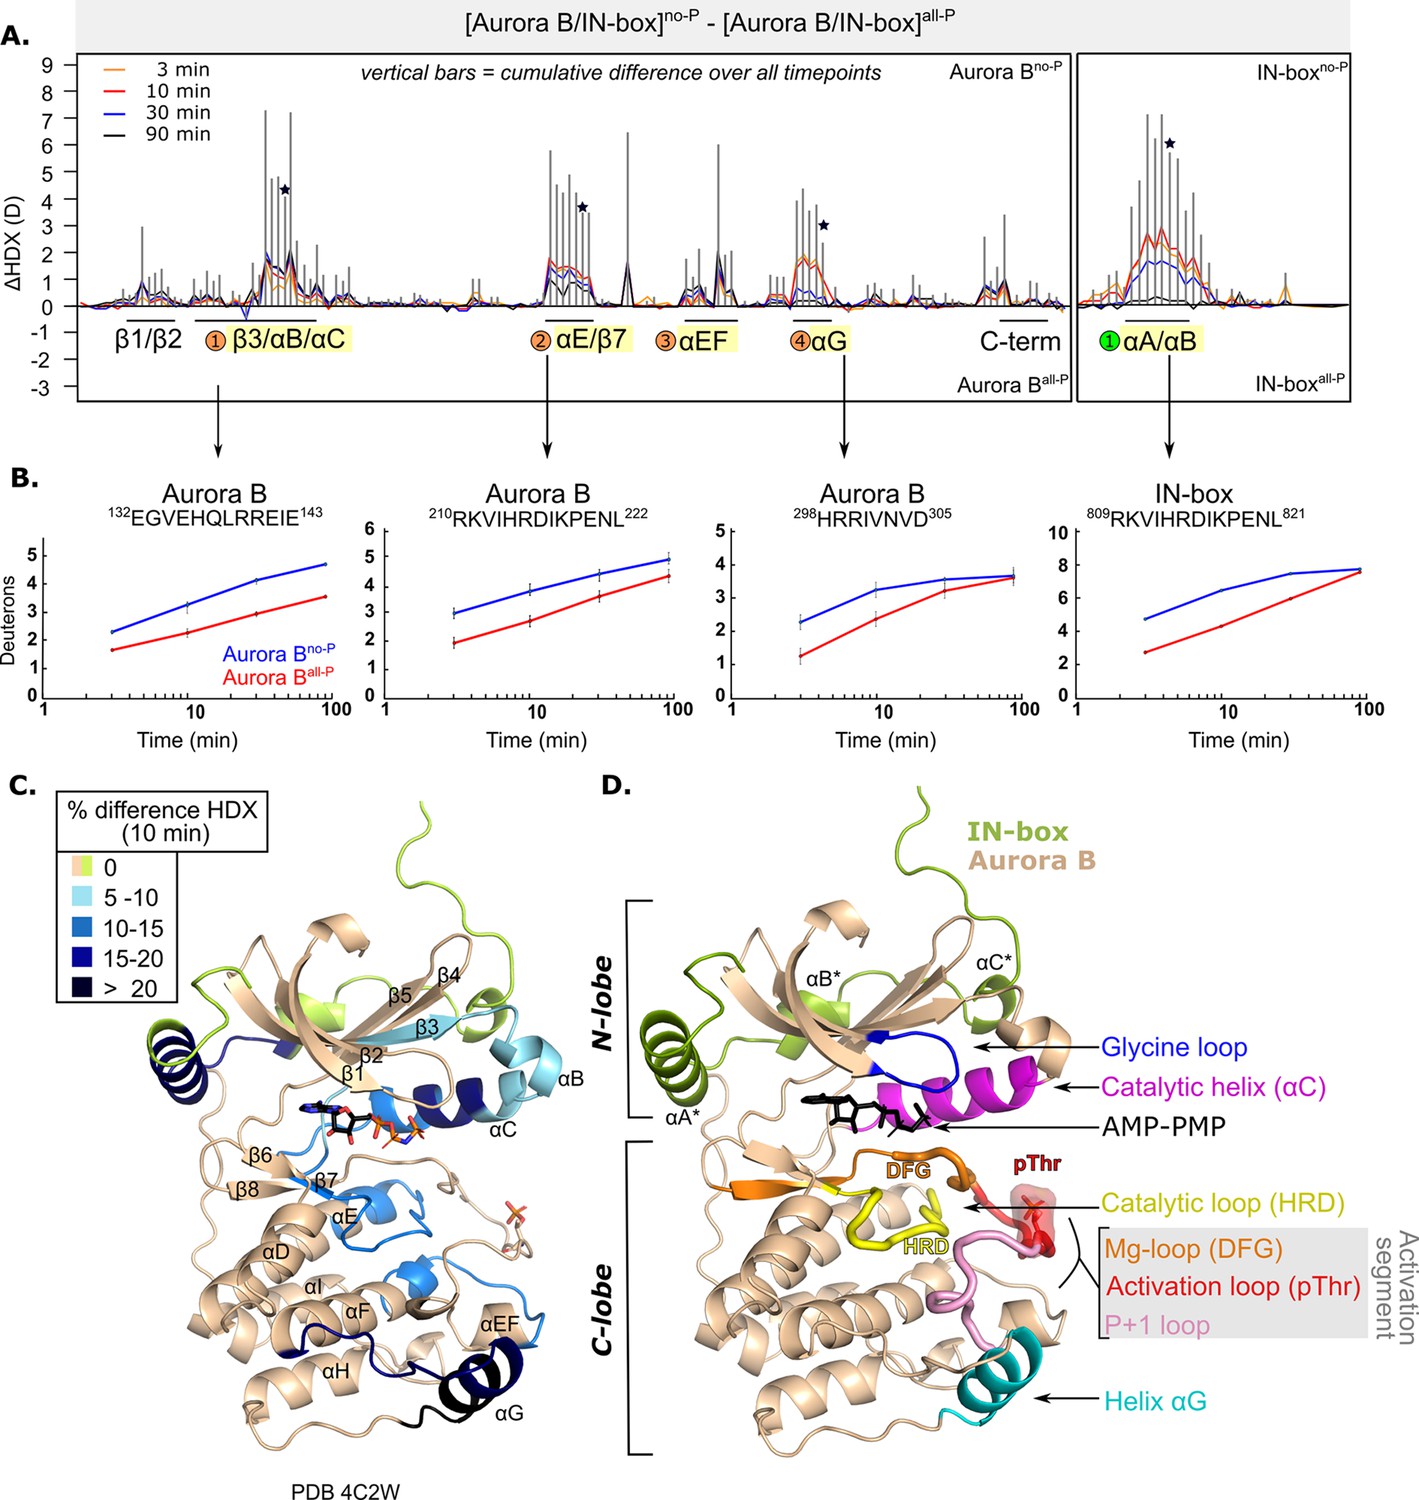
After phosphorylation, the [Aurora B/IN-box] complex becomes more rigid.
(A) Butterfly-difference plot for a comparison of H/D exchange (HDX) differences between [Aurora B/IN-box]no-P and [Aurora B/IN-box]all-P, measured over four time points (orange - 3 min; red - 10 min; blue - 30 min; black - 90 min). Each of the vertical bars represents a single peptide arranged according to its position from the N- to the C-terminus. The size of the vertical bars represents the cumulative difference ([Aurora B/IN-box]all-P - [Aurora B/IN-box]no-P) or ΔHDX over all time points. It is noticeable that the difference in deuterium uptake is mainly positive, indicating an overall faster exchange and more flexible structure in [Aurora B/IN-box]no-P than in [Aurora B/IN-box]all-P for both Aurora B and IN-box. Secondary structural elements that are encompassed by peptides with significant differences in deuterium uptake are indicated below the baseline. Structural elements containing peptides with highest cumulative ΔHDX are highlighted in yellow and indicated with orange circles for Aurora B and green circle for the IN-box. The asterisk indicates representative peptides for which uptake plots are shown in (B) (B). The uptake plots for representative peptides with high uptake differences. (C) HDX differences between [Aurora B/IN-box]no-P and [Aurora B/IN-box]all-P captured after 10 min of exchange and mapped on ribbon diagram of the [Aurora B/IN-box] complex (PDB 4C2W). The Aurora B secondary structure elements are labeled. (D) Ribbon diagram of [Aurora B/IN-box] with Aurora B in beige and IN-box in green. The secondary structure elements of the IN-box (αA*, αB* and αC*) are labeled. The important catalytic and regulatory elements of Aurora B are highlighted: glycine loop (blue), catalytic helix αC (magenta), catalytic loop with histidine-arginine-aspartic acid (HRD) motif (yellow), and helix αG (cyan). The active segment consists of an Mg-loop with DFG motif (aspartic acid-phenylalanine-glycine) (orange), an activation loop with phosphorylated threonine (red), and a P+1 loop (pink) involved in peptide substrate binding.
Figure 1—figure supplement 1
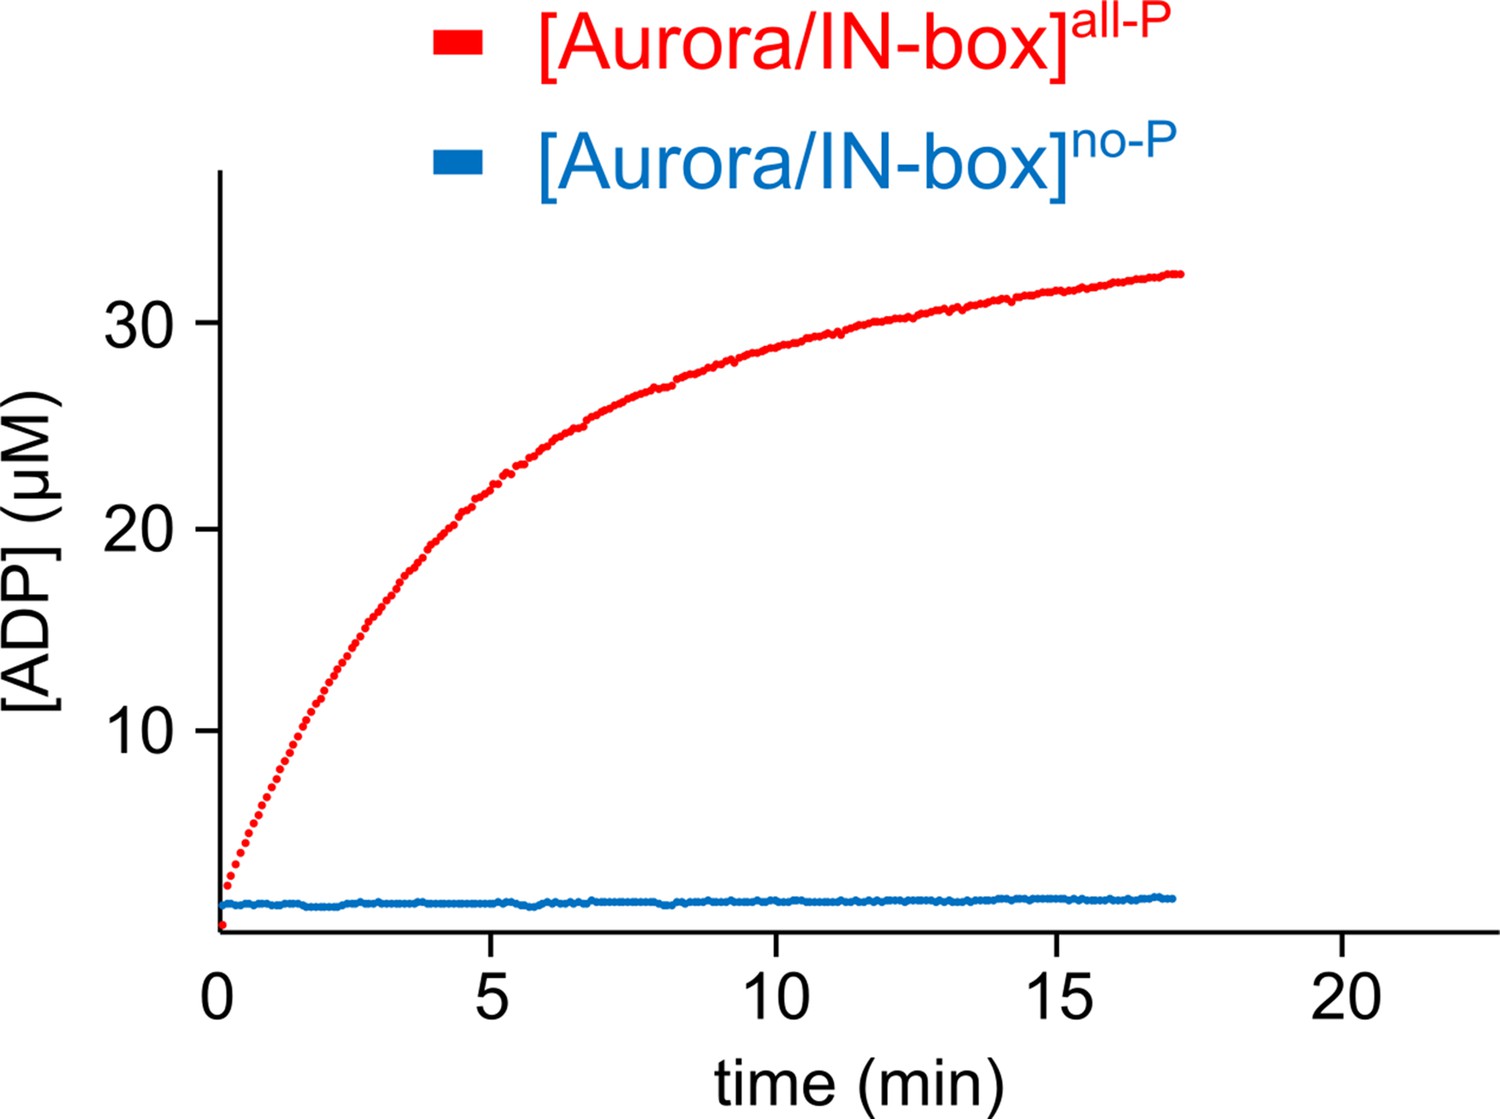
Time course of product formation.
[Aurora B/IN-box]no-P (blue) and [Aurora B/IN-box]all-P (red). The [Aurora B/IN-box]no-P and [Aurora B/IN-box]all-P concentration in the assay were identical (20 nM) while peptide substrate concentration was 40 μM. The experiment was performed multiple times with high reproducibility (as already reported by Zaytsev et al., 2016).
Figure 1—figure supplement 2
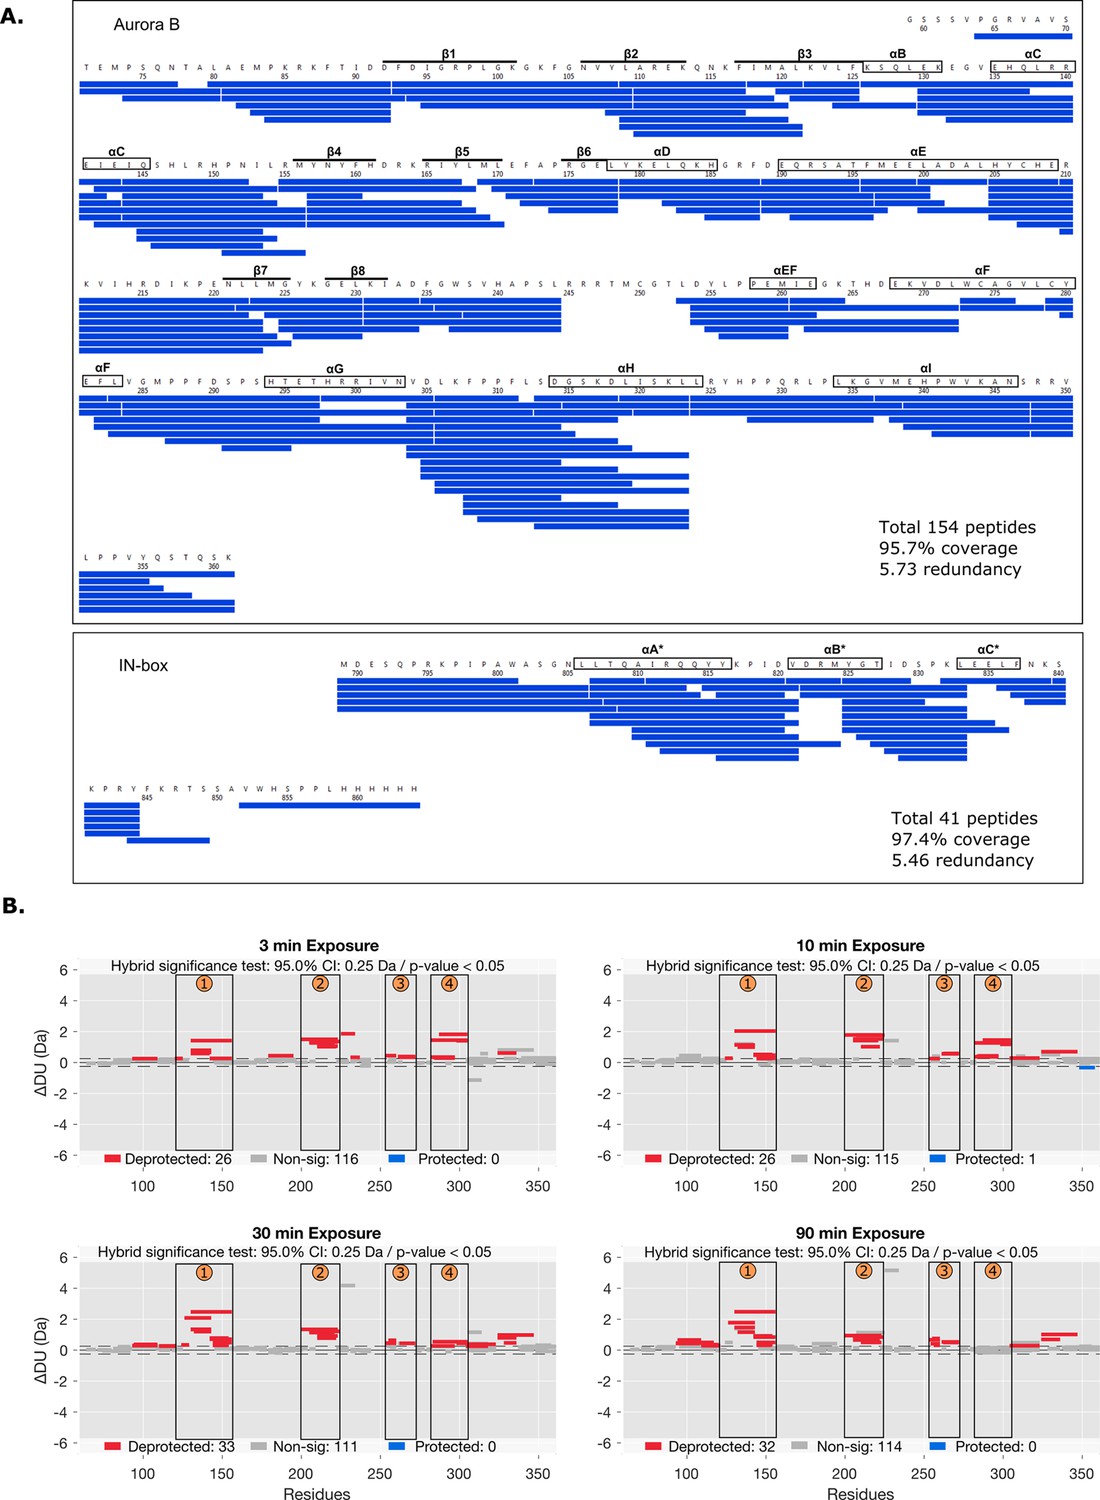
Peptide coverage map and statistical analysis of deuterium uptake.
(A) The hydrogen-deuterium exchange (HDX) peptide coverage map for Aurora B and IN-box in HDX experiments. Each blue rectangle represents a unique peptide. (B) Differential HDX, ΔDU, (Wood plots) for Aurora B in [Aurora B/IN-box]no-P and [Aurora B/IN-box]all-P with statistical analysis. Each horizontal bar represents a unique peptide; 95% confidence intervals are shown as gray dotted lines. The gray bars show peptides with non-significant ΔHDX between two samples, the red bars are peptides with higher deuterium incorporation in [Aurora B/IN-box]no-P. All measurements were performed at least in triplicate. The four regions with the highest cumulative ΔHDX values are labeled with numbers as in Figure 1.
Figure 1—figure supplement 3
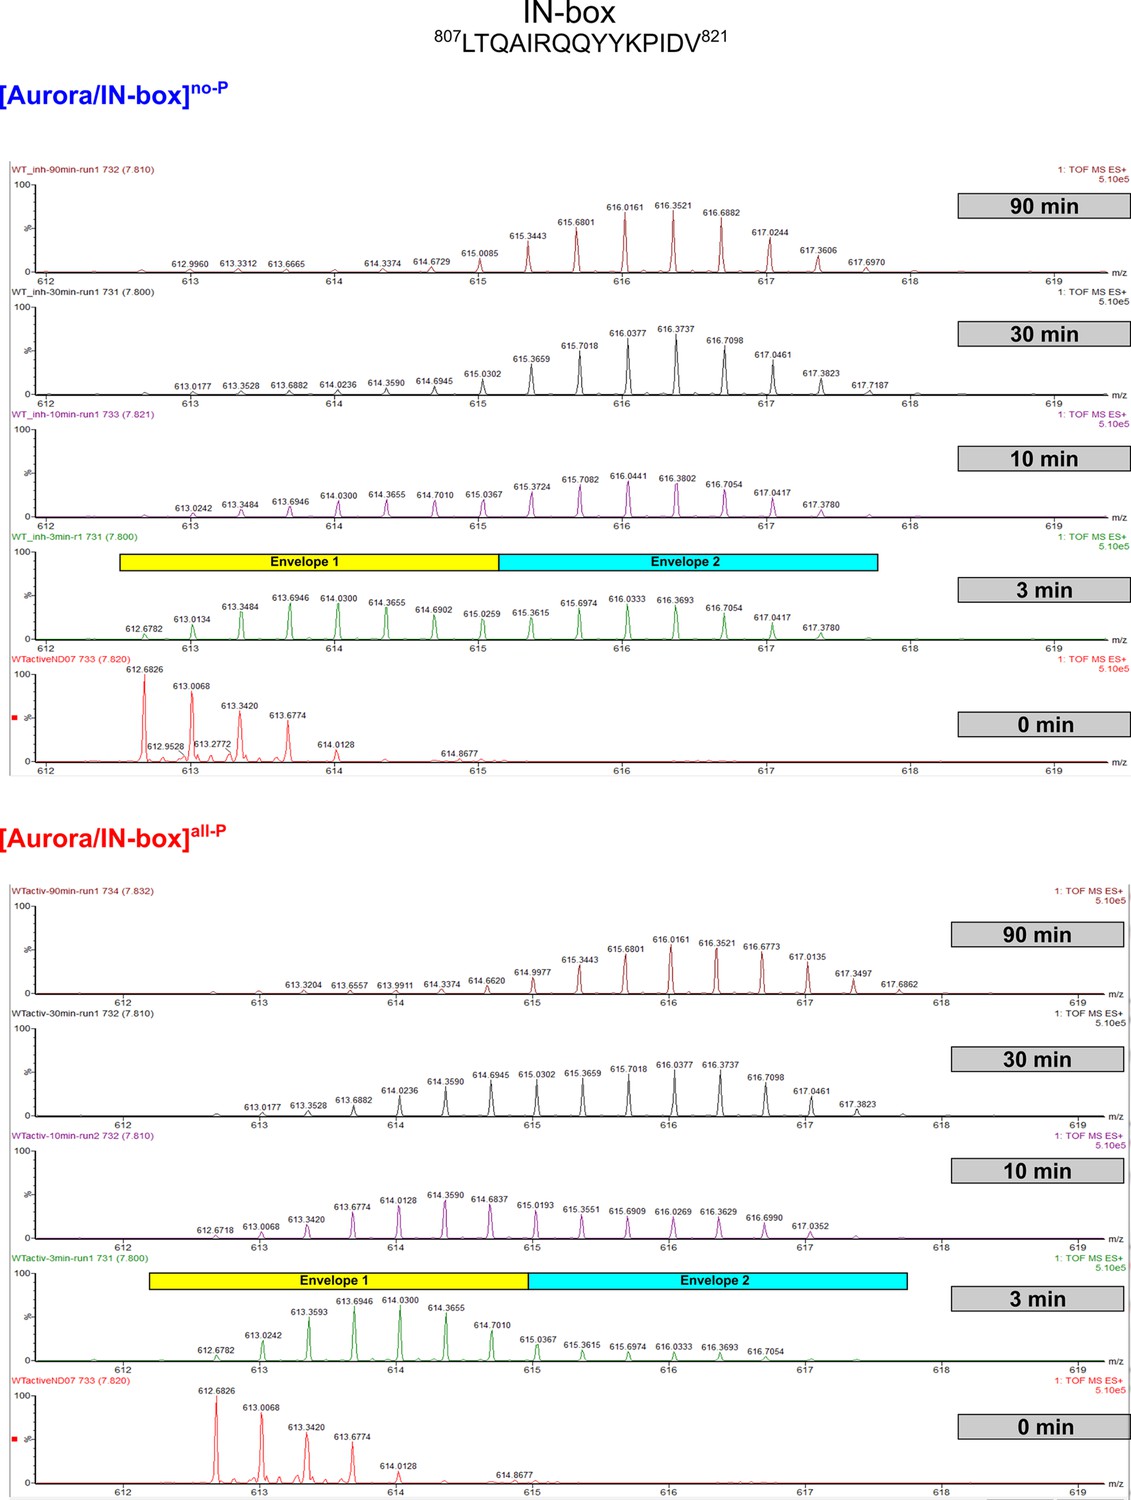
EX1 kinetics observed in IN-boxαA, peptide 807LTQAIRQQYYKPIDV821, in [Aurora B/IN-box]no-P, and [Aurora B/IN-box]all-P.
The horizontal rectangles in the 3 min deuterated sample indicate the bimodal distribution of deuteration. The yellow rectangle is above the envelope with the lower m/z center of mass, representing molecules in which the IN-boxαA undergoes slow H/D exchange (HDX) and the cyan rectangle is above the envelope with the higher M/Z center of mass, where HDX occurs simultaneously throughout the helix due to an unfolding event. Note that at the 3 min time point, the population with the higher m/z center is equal to the population with lower m/z center in [Aurora B/IN-box]no-P, whereas in [Aurora B/IN-box]all-P the population with the lower m/z center of mass dominates, indicating a more stable IN-boxαA in [Aurora B/IN-box]all-P.
Figure 1—figure supplement 4
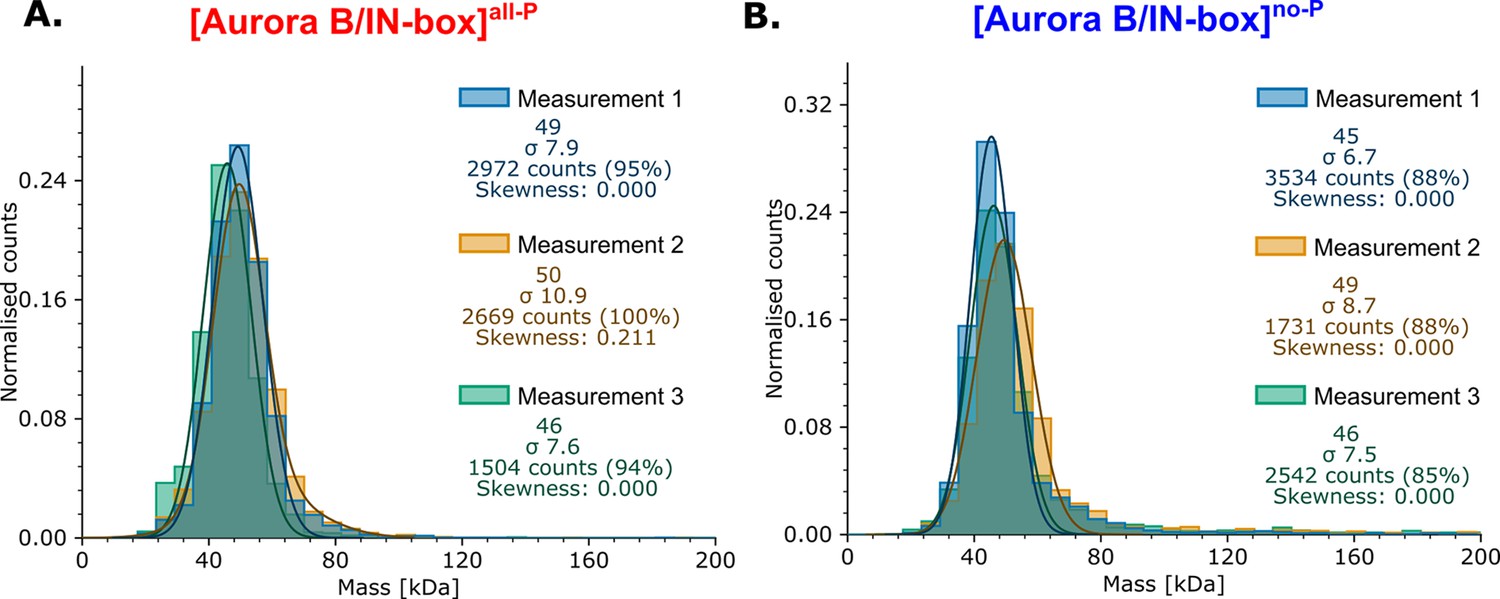
Mass photometry analysis for phosphorylated and unphosphorylated enzyme complex.
(A) [Aurora B/IN-box]all-P (B) [Aurora B/IN-box]no-P.
Figure 2 with 2 supplements
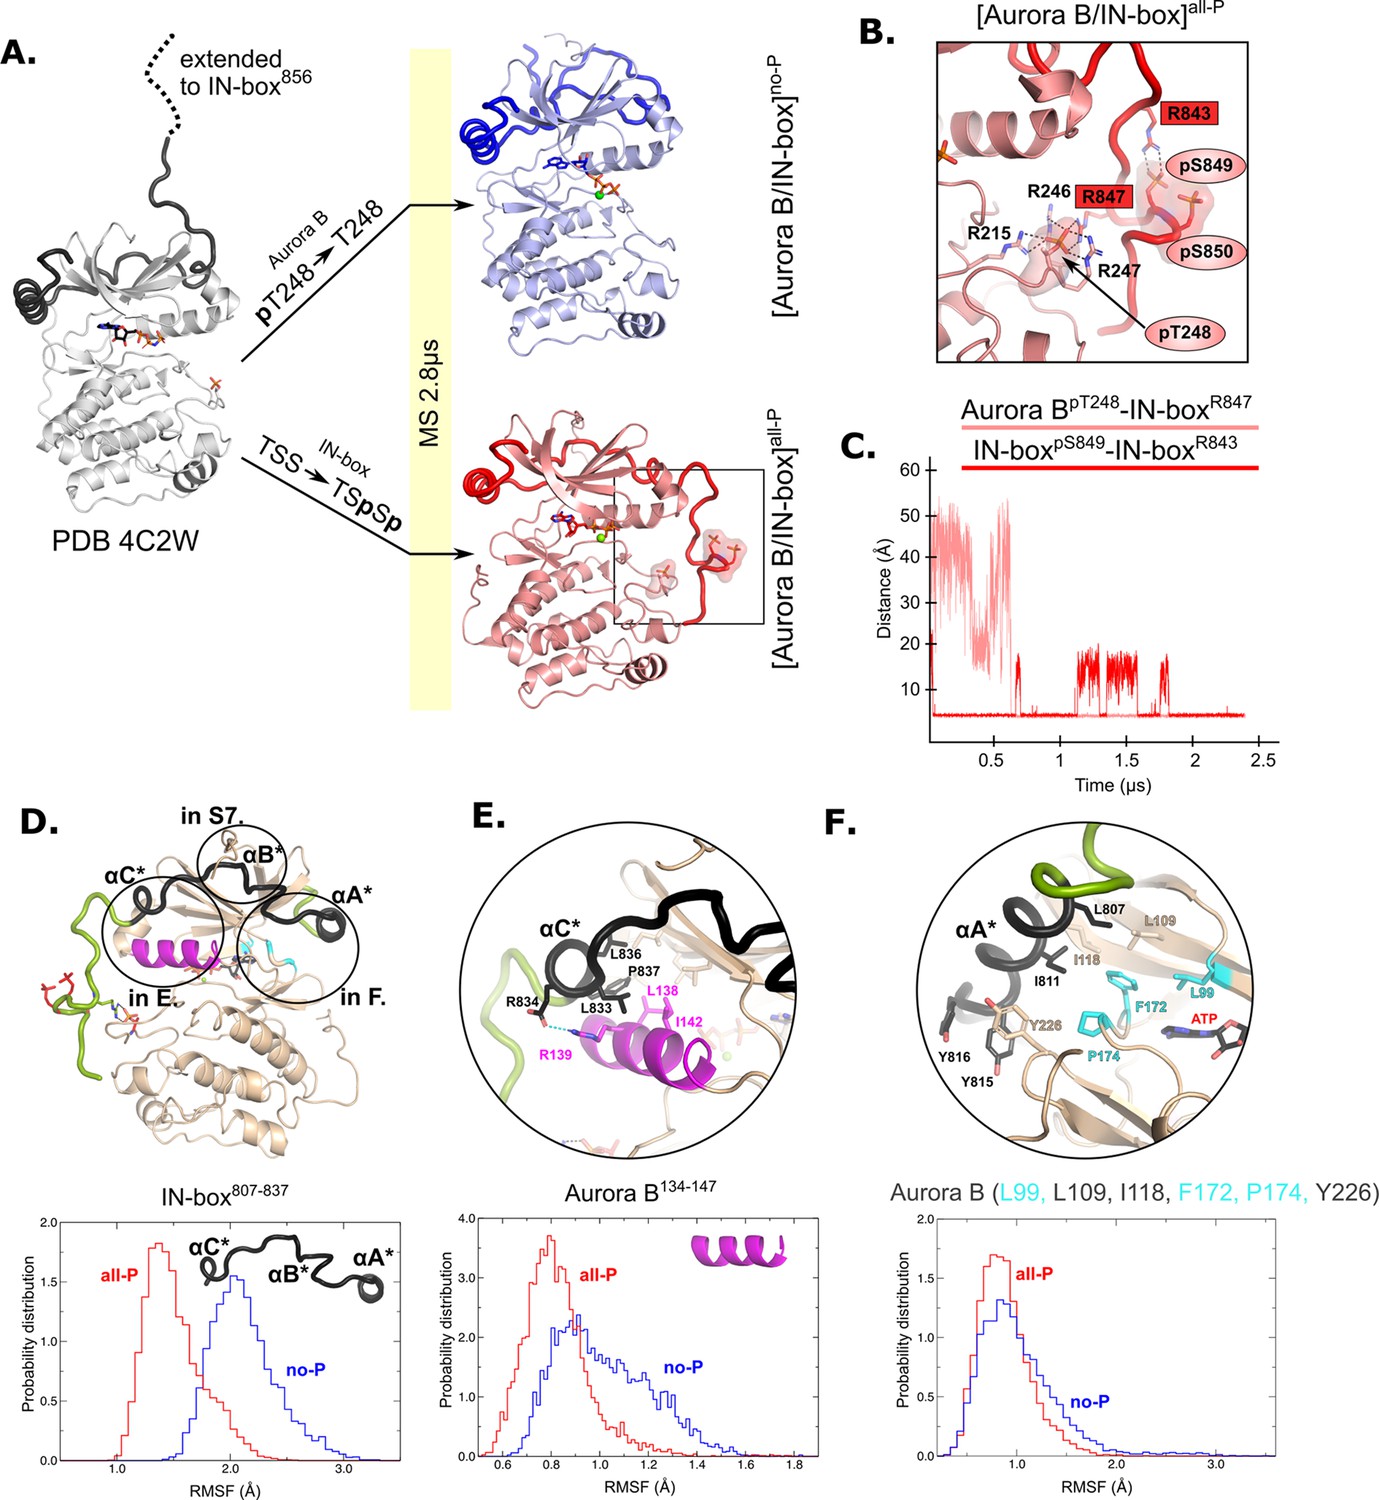
Molecular dynamics (MD) simulation of [Aurora B/IN-box]no-P and [Aurora B/IN-box]all-P reveals large conformational changes in the C-terminal part of IN-box and dynamic coupling between IN-box and the Aurora B catalytic helix.
(A) Initial models for MD stimulation were generated from PDB 4C2W (ribbon diagram in gray; IN-box is shown as a black coil). The C-terminal part of IN-box was extended to the end (to include up to IN-box856; dotted line), AppNHp was replaced by ATP-Mg and for [Aurora B/IN-box]no-P, the phosphate group of Aurora BpT248 was removed. For [Aurora B/IN-box]all-P, phosphates were added to IN-boxSer849 and IN-boxSer850. Simulations for both phosphorylation states were run for 2.8 μs and the ribbon diagram for the final structure for [Aurora B/IN-box]no-P is shown in blue and the final structure for [Aurora B/IN-box]all-P is shown in red (IN-box is shown as coil in a darker color). The interactions within the boxed region of the [Aurora B/IN-box]all-P structure are shown in (B). (B) Enlarged view showing the interactions of Aurora BpThr248 with residues in Aurora B and IN-box in the final MD confirmation of [Aurora B/IN-box]all-P. (C) The distance between the phosphorus atom in Aurora BpThr248 and the Cζ atom in IN-boxArg847 (pink) and between the phosphorus atom in IN-boxpSer849 and the Cζ atom in IN-boxArg843 (red) during the MD simulation. The Cζ atom was chosen for the distance measurements because it is bonded to all three nitrogen atoms in the arginine residue, which can form a hydrogen bond with phosphate. (D) The ribbon diagram of the [Aurora B/IN-box]all-P structure (rotated 180° compared to the orientation in A). Aurora B is in beige and IN-box is in green. The N-terminal part of IN-box, IN-box807-837, which contains well-defined structural elements, αA*, αB*, αC*, is colored black. Parts of Aurora B that interact with this N-terminal IN-box and are important for catalysis are in magenta (Aurora BαC) and cyan (residues forming the ATP-binding site). The interfaces between three parts of the IN-box are circled and shown in more detail in panels (E, F) and Figure 2—figure supplement 2. Below is the plot of probability density in the y axis versus the root mean square fluctuations (RMSF) for IN-box807-837. RMSF in [Aurora B/IN-box]all-P is in red and [Aurora B/IN-box]no-P is in blue. (E) Interface between IN-boxαC* and Aurora B. Below is the plot of probability density distribution versus RMSF for Aurora BαC with same labeling as in (D). (F) Interface between IN-boxαA* and Aurora B. Three residues in Aurora B that form the ATP-binding site are cyan. Below is the same type of plot as is (D, E) for Aurora B (Leu99, Leu109, Ile118, Phe172, Pro174, and Tyr226).
Figure 2—figure supplement 1
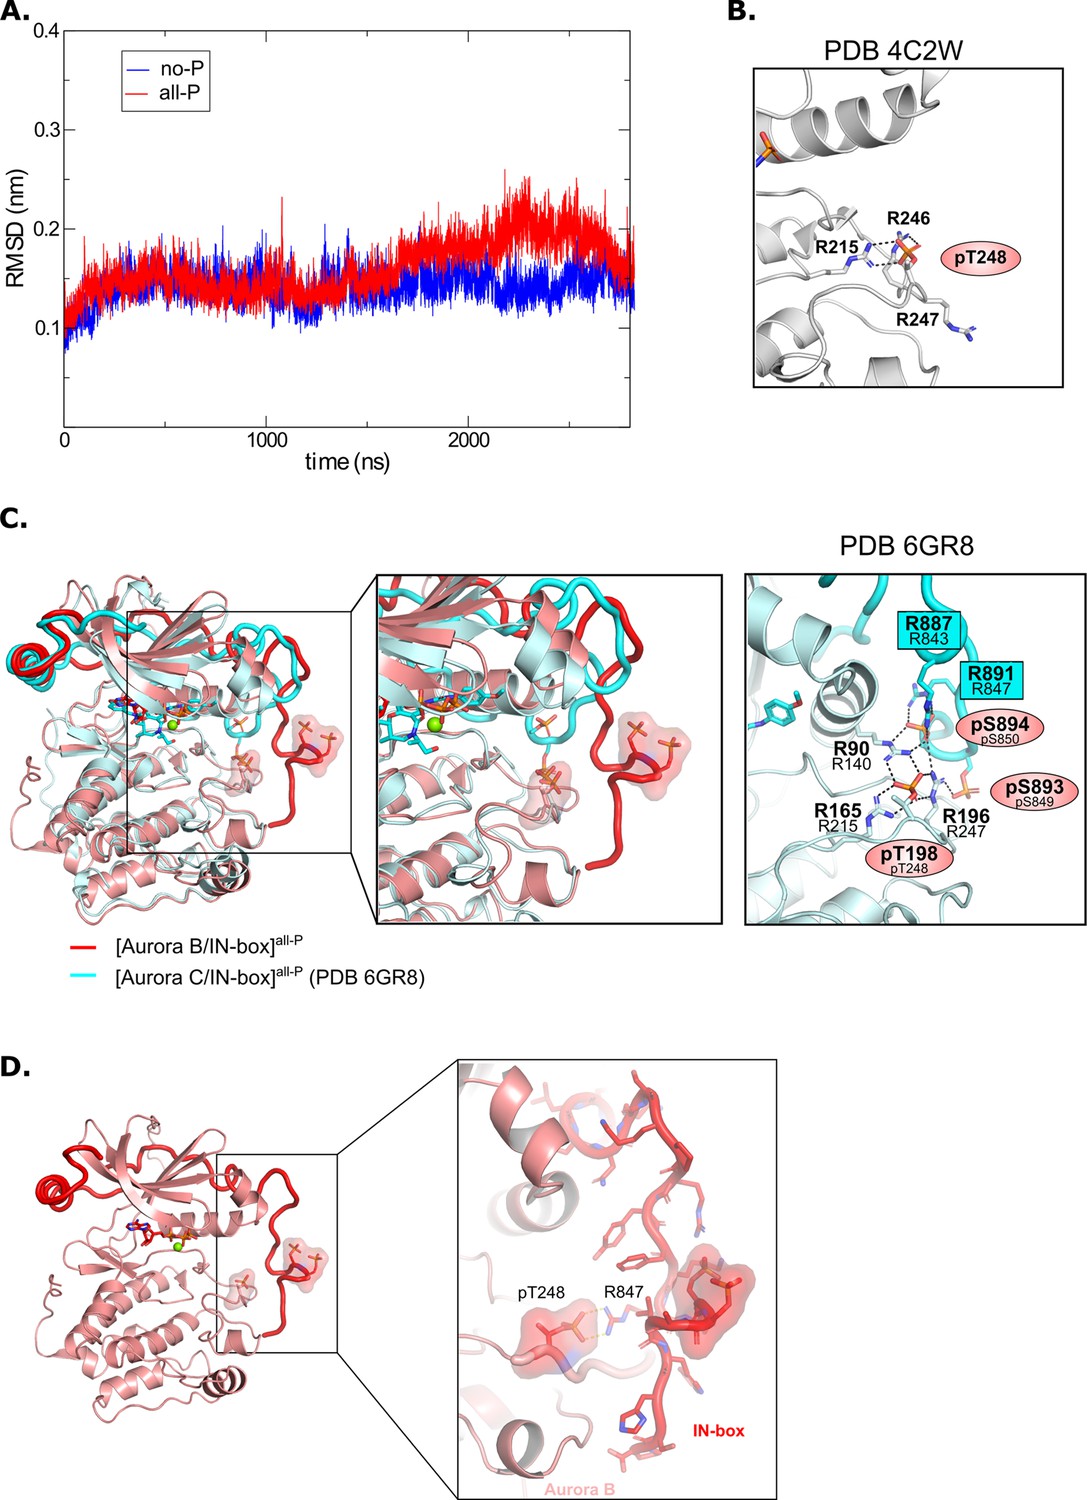
Molecular dynamics analysis and comparison with crystal structures.
(A) Root mean square deviation (RMSD) for [Aurora B/IN-box]no-P (blue) and [Aurora B/IN-box]all-P (red) complexes during 2800 ns molecular dynamics (MD) simulations. (B) Zoomed view of the electrostatic and hydrogen bonding network around Aurora BpThr248 as seen in the initial crystal structure (PDB 4C2W). (C) (Left) Best overall overlay between MD model from our simulation, [Aurora B/IN-box]all-P (red), and the crystal structure of phosphorylated human [Aurora C/IN-box] (cyan). (Middle) Zoom views of the activation loop illustrating similarities/differences between the two structures. (Right) Hydrogen bonding network around Aurora BpThr198 (analogous to Aurora BpThr248 in X. laevis Aurora B) observed in the crystal structure of phosphorylated human [Aurora C/IN-box]. Numbers of residues corresponding to the X. laevis construct are given below the numbers in the human complex. (D) Magnified view of the C-terminal part of the IN-box in the final MD conformation of [Aurora B/IN-box]all-P showing that despite the Aurora Bp248-IN-boxArg847 electrostatic interaction, the main-chain hydrogen atoms are available for H/D exchange with the solvent.
Figure 2—figure supplement 2
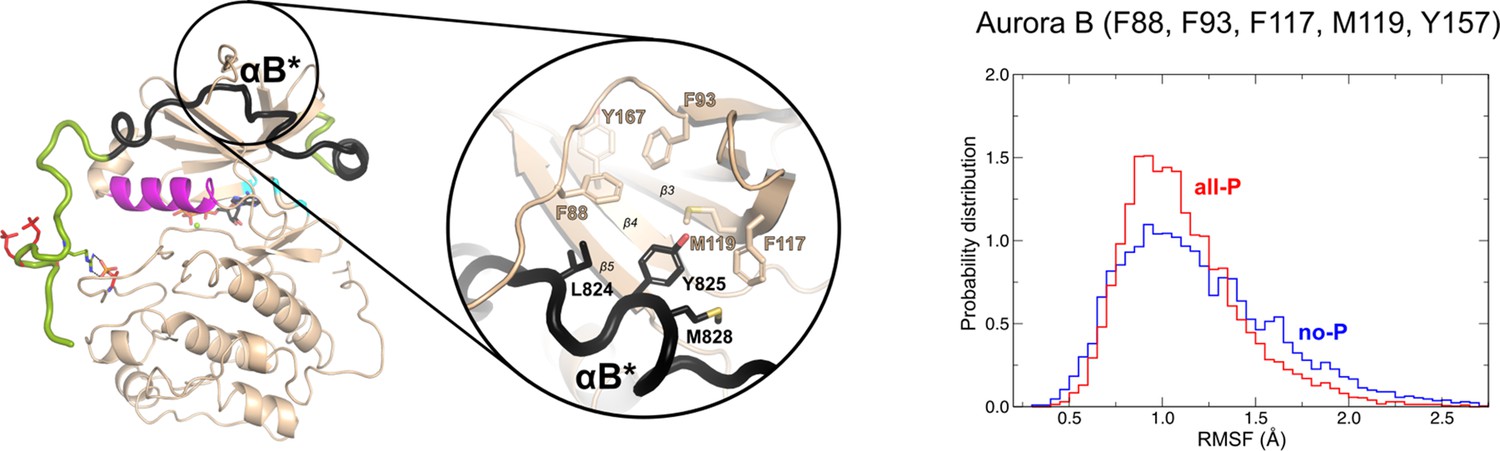
The ribbon diagram of the [Aurora B/IN-box]all-P structure (oriented and colored as in Figure 2).
The interface between IN-boxαB* and Aurora B is circled and shown in more detail. On the right is the plot of the root mean square fluctuations (RMSF) for Aurora B (Phe88, Phe93, Phe117, Met119, and Tyr157) with probability distribution versus RMSF. Red traces are for [Aurora B/IN-box]all-P and [Aurora B/IN-box]no-P is in blue.
Figure 3 with 3 supplements
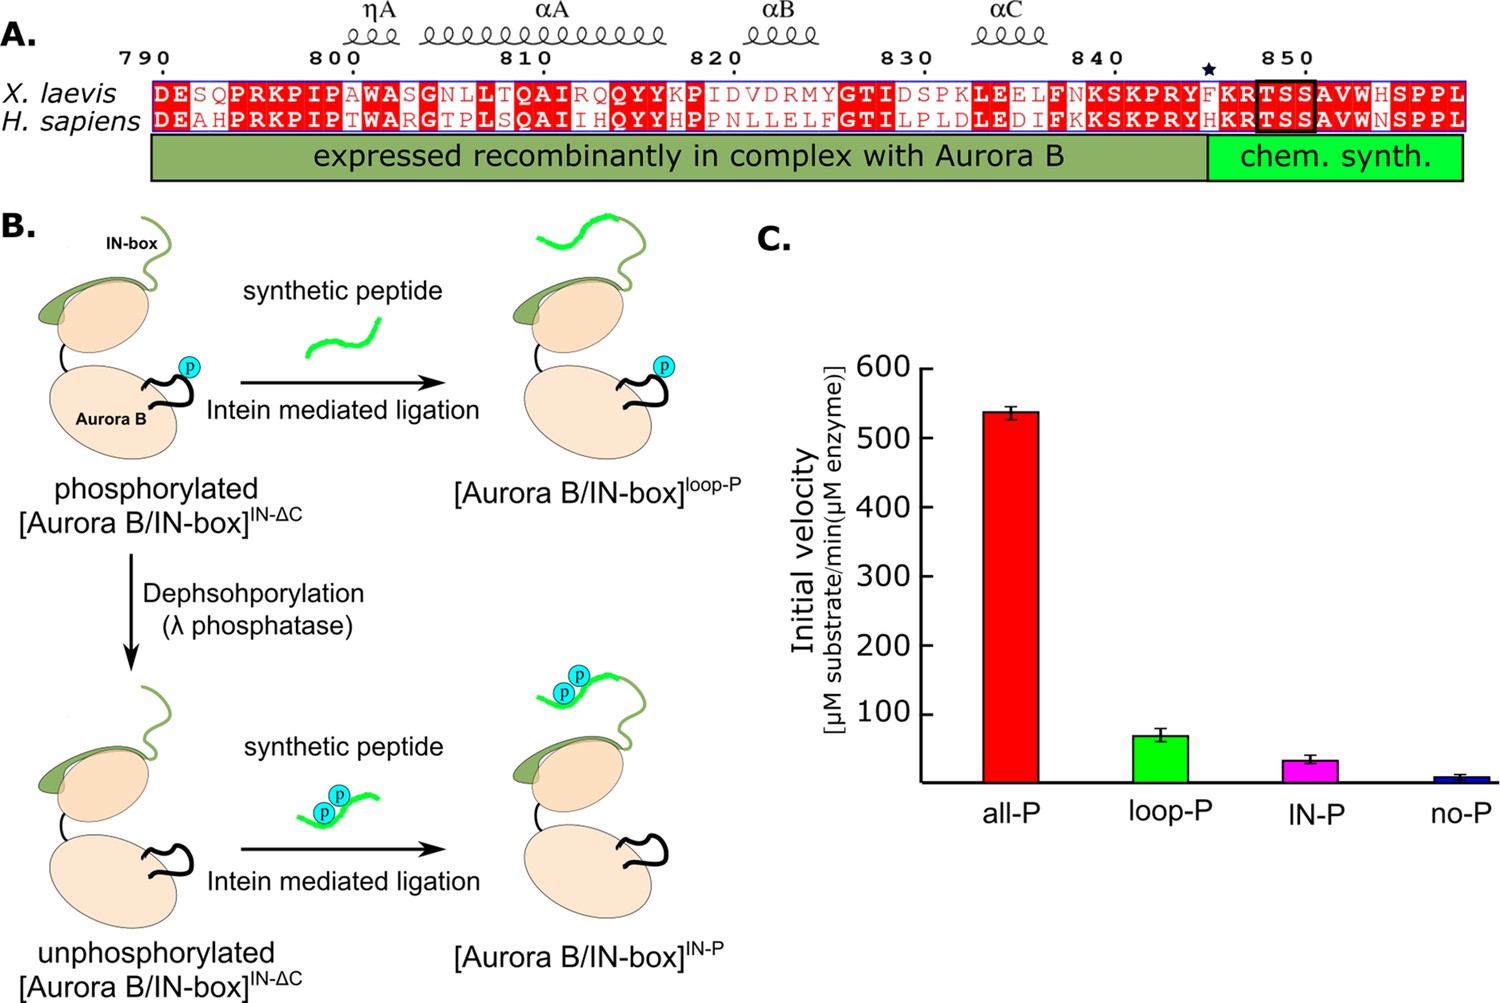
Design and kinetic analysis of the partially phosphorylated [Aurora B/IN-box] complex.
(A) Sequence overlay of the IN-box, region of INCENP, from Homo sapiens and X. laevis. The conserved amino acids are shown in red and the elements of the secondary structure are at the top. Residues 790–844 (dark green) are expressed together with Aurora B, in a bicistronic construct, giving rise to [Aurora B/IN-box]IN-ΔC, which is then ligated to a synthetic peptide containing residues 846–858 (light green). The synthetic peptide contains a TSS motif that can be phosphorylated (black box). The Aurora BPhe845 (indicated by asterisks) is converted to Cys during ligation. (B) The schematic shows the steps to prepare [Aurora B/IN-box]loop-P and [Aurora B/IN-box]IN-P using [Aurora B/IN-box]IN-ΔC and synthetic peptides. (C) Enzymatic activity determined from initial velocities for [Aurora B/IN-box]all-P (red), [Aurora B/IN-box]loop-P (green), [Aurora B/IN-box]IN-P(magenta), and [Aurora B/IN-box]no-P (blue).
Figure 3—figure supplement 1
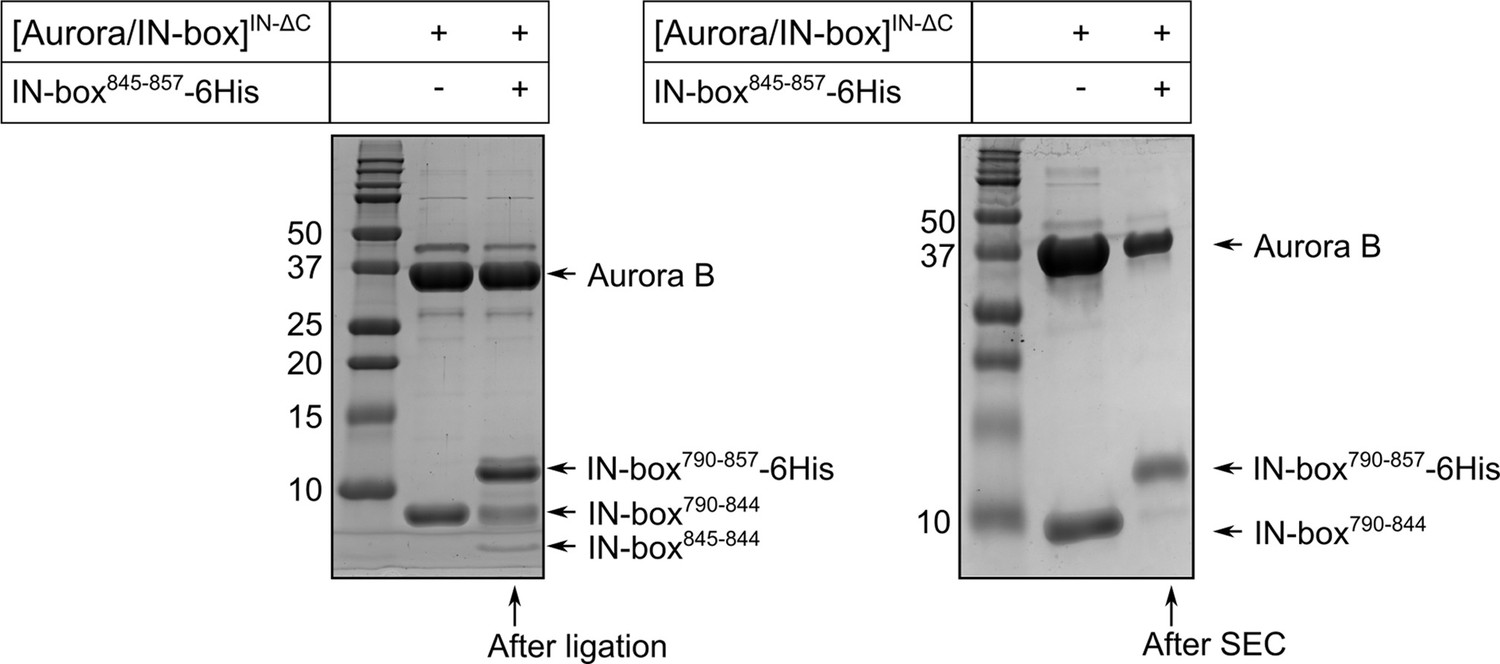
SDS-PAGE gel showing purification of partially phosphorylated [Aurora B/IN-box] enzymes.
The left gel shows the species present in the solution during the ligation process. The right gel shows [Aurora B/IN-box]loop-P after ligation and size exclusion chromatography. For reference, the first lane on both gels shows the [Aurora B/IN-box]ΔC complex. Molecular weights of marker are shown on the left of each gel in kD.
-
Figure 3—figure supplement 1—source data 1
Original uncropped gels shown in Figure 3—figure supplement 1.
- https://cdn.elifesciences.org/articles/85328/elife-85328-fig3-figsupp1-data1-v2.zip
Figure 3—figure supplement 2
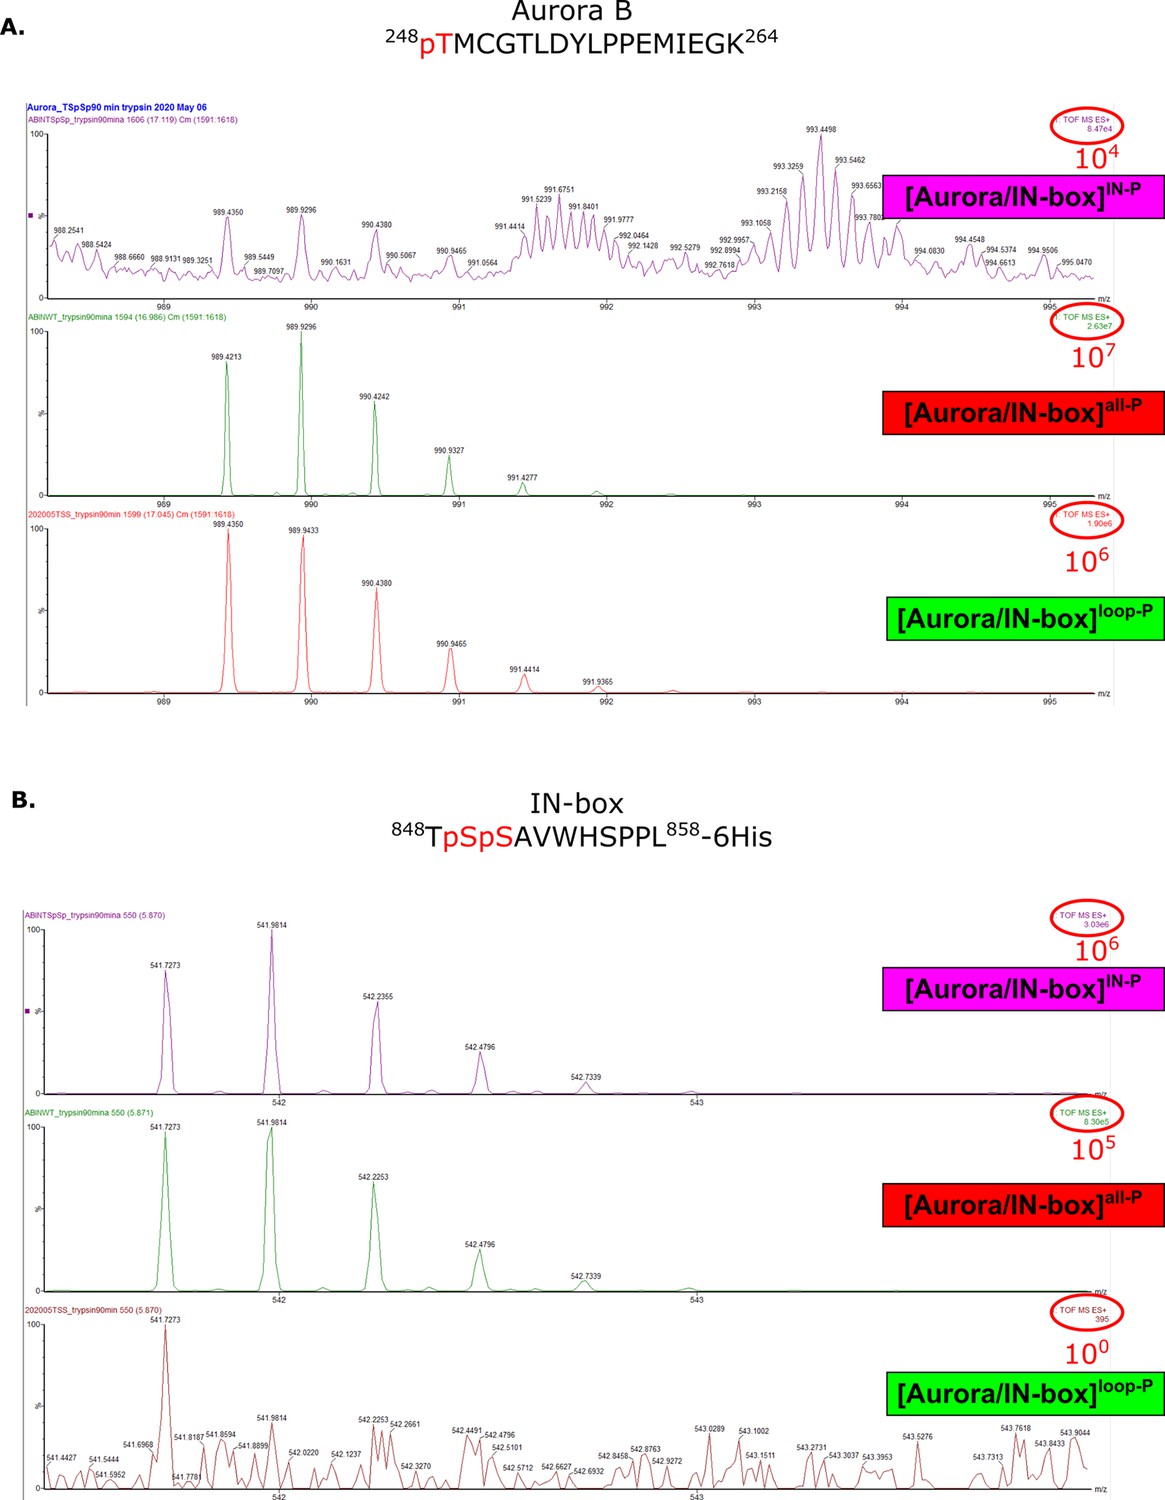
Mass spectra confirming presence or absence of phosphates in peptides Aurora B (248-264) and IN-box (848-858) for different phosphorylaton forms of the complex.
Mass spectra of peptides containing Aurora BThr248 (A) or IN-boxSer849 and IN-boxSer850 (B) show the presence or absence of phosphorylation in different [Aurora B/IN-box] complexes.
Figure 3—figure supplement 3
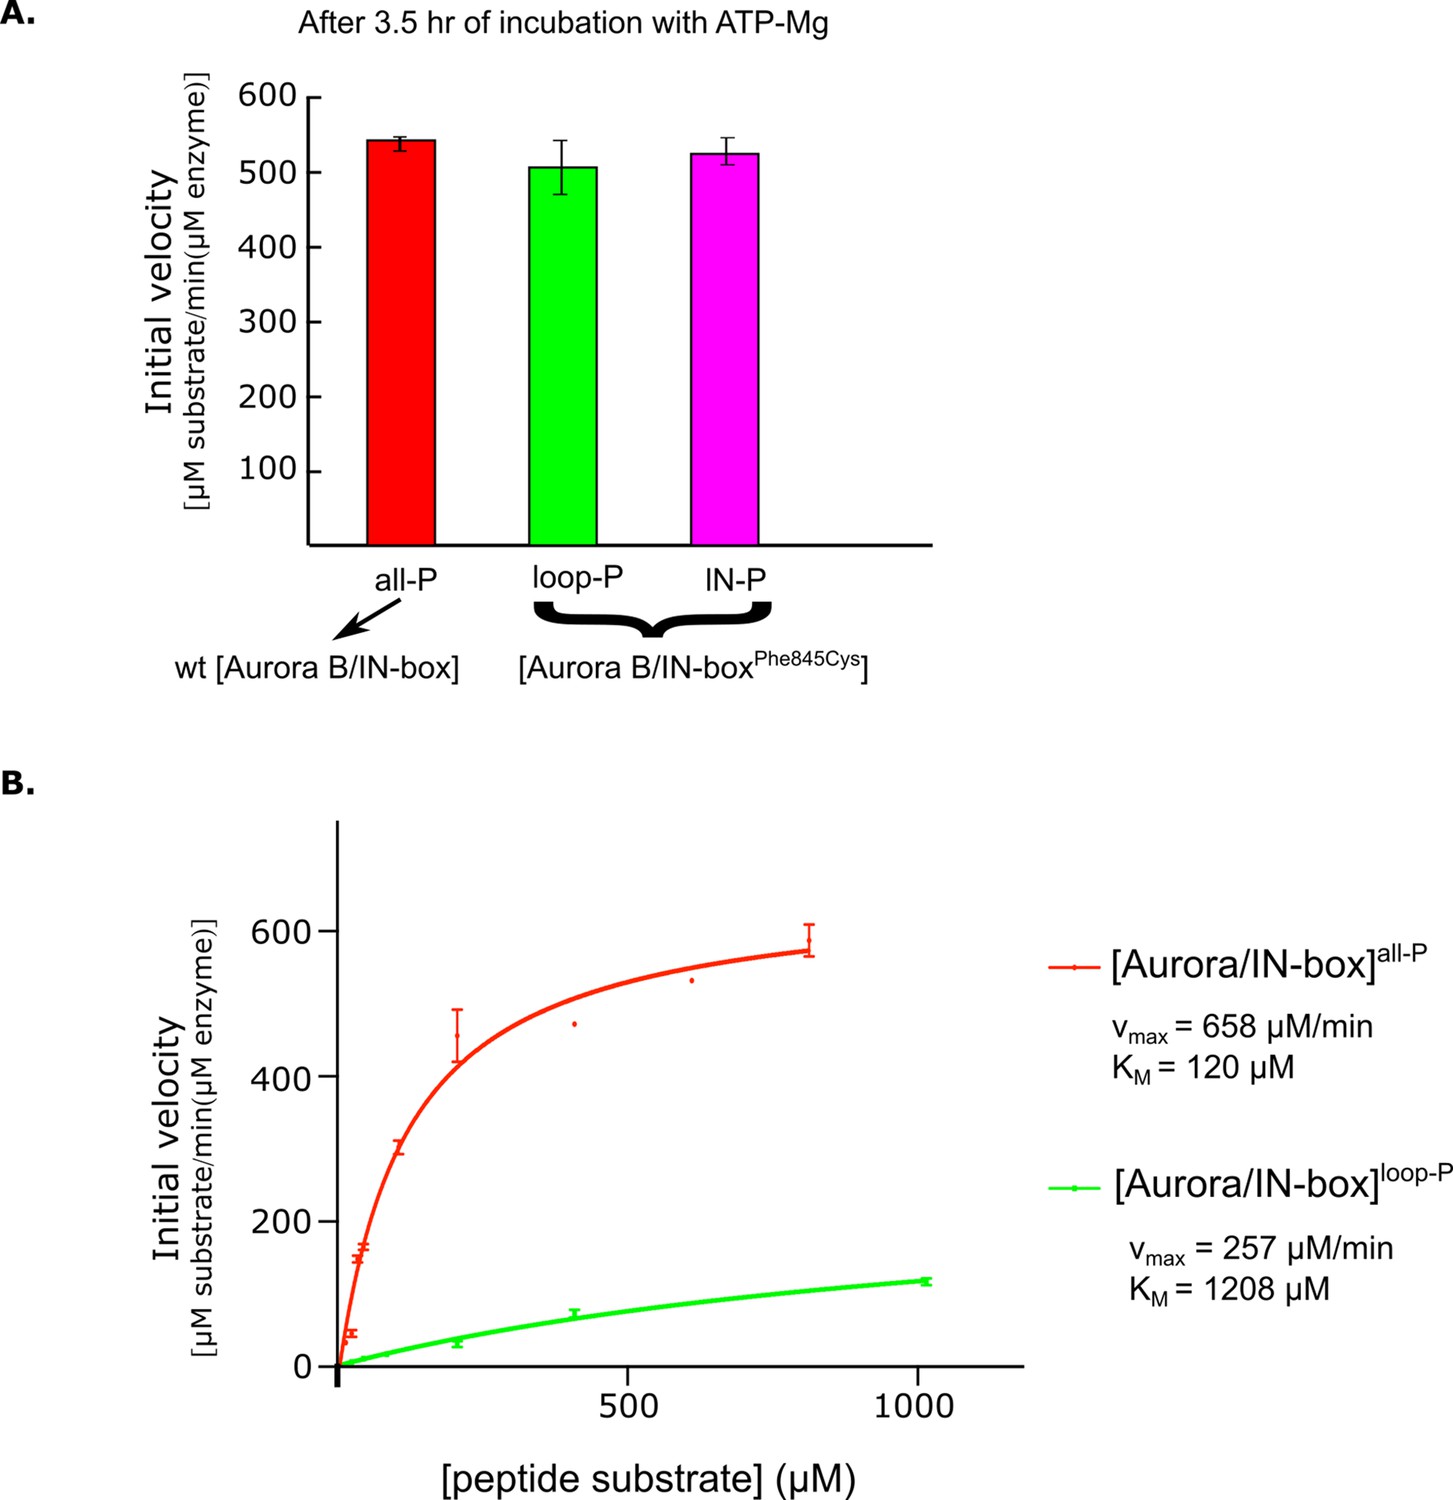
Kinetic analysis of partially phosphorylated enzyme complex forms.
(A) After 2.5 hr incubation with ATP-Mg, semisynthetic constructs with the IN -boxPhe845Cys mutation show the same enzymatic activity as the non-mutated (wt) active [Aurora B/IN-box]. (B) Dependence of enzyme rate on substrate peptide concentration for [Aurora B/IN-box]all-P (red) and [Aurora B/ IN -box]loop-P (green). Standard deviation for experiment done in triplicate is shown.
Figure 4 with 5 supplements
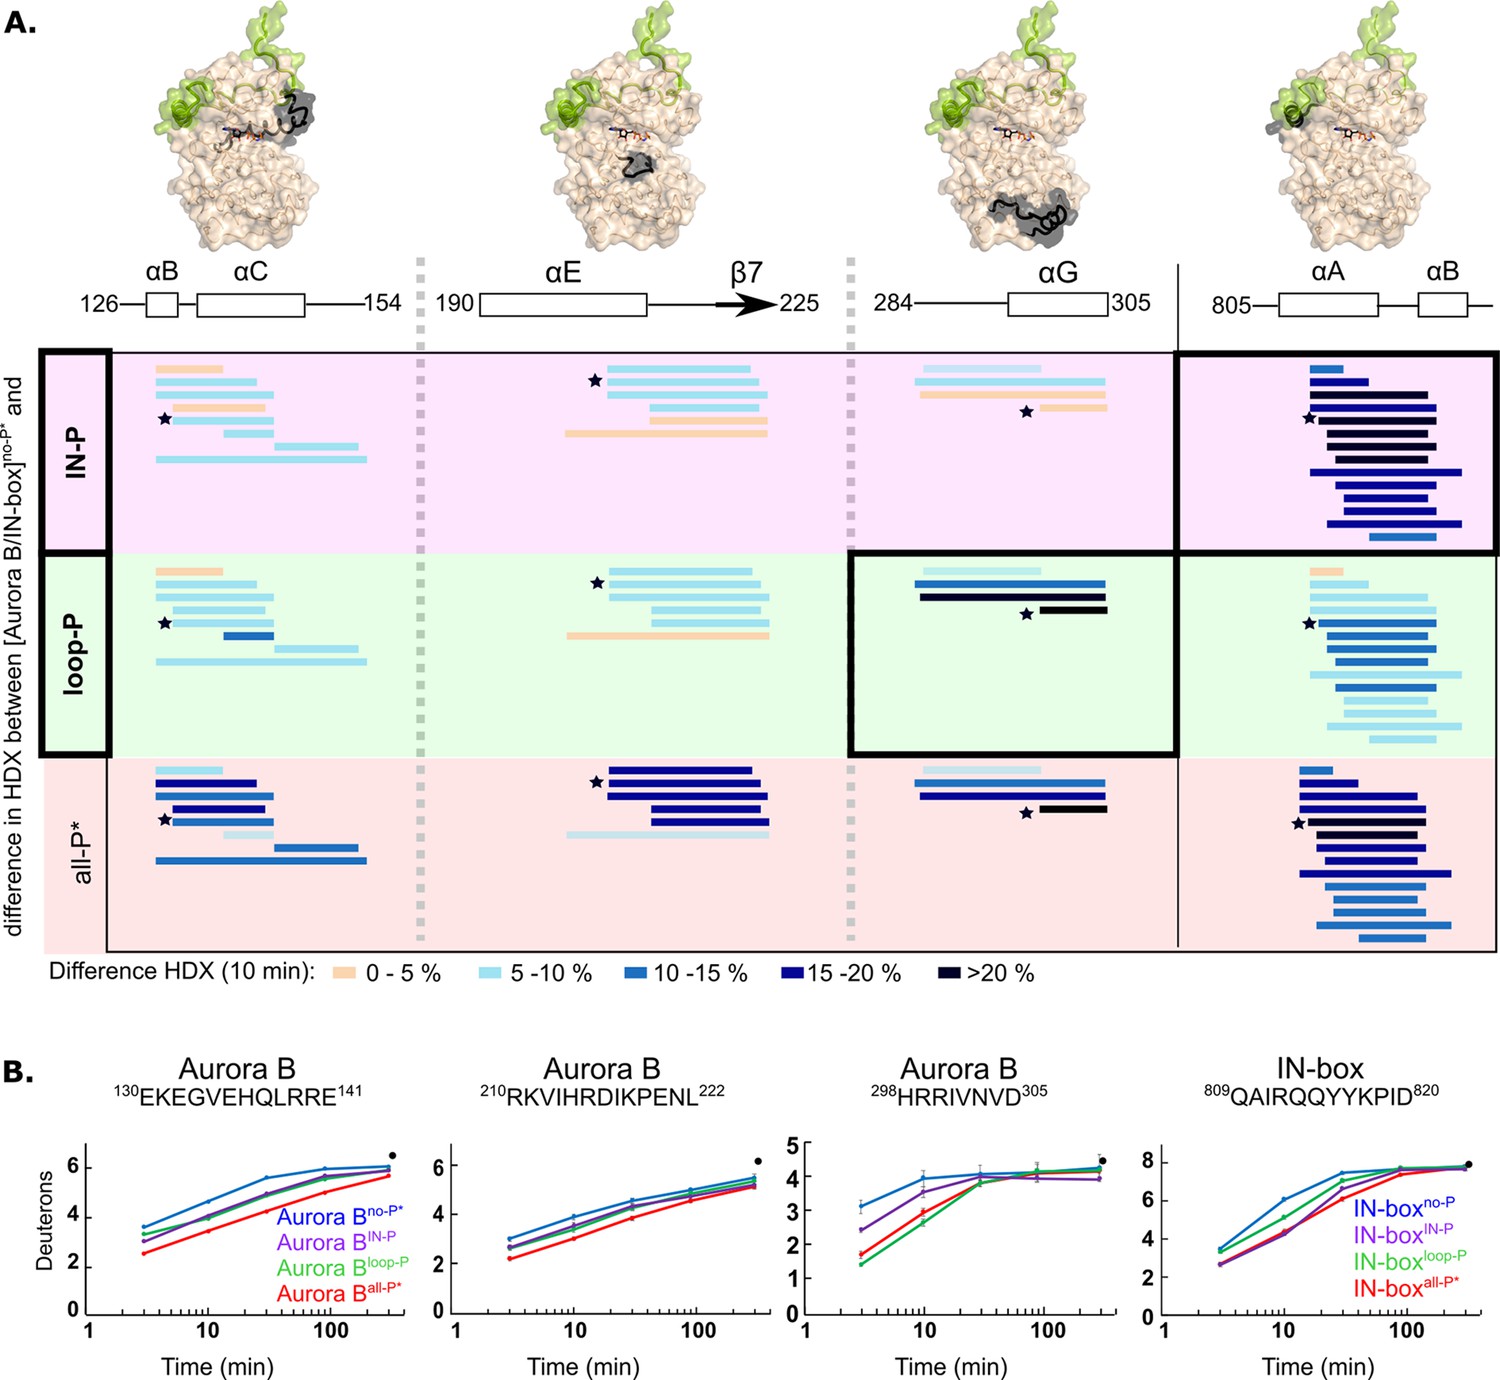
Two phosphorylations are required for maximal hydrogen-deuterium exchange (HDX) protection in [Aurora B/IN-box] with only two exceptions in Aurora BαG and IN-boxαA-αB.
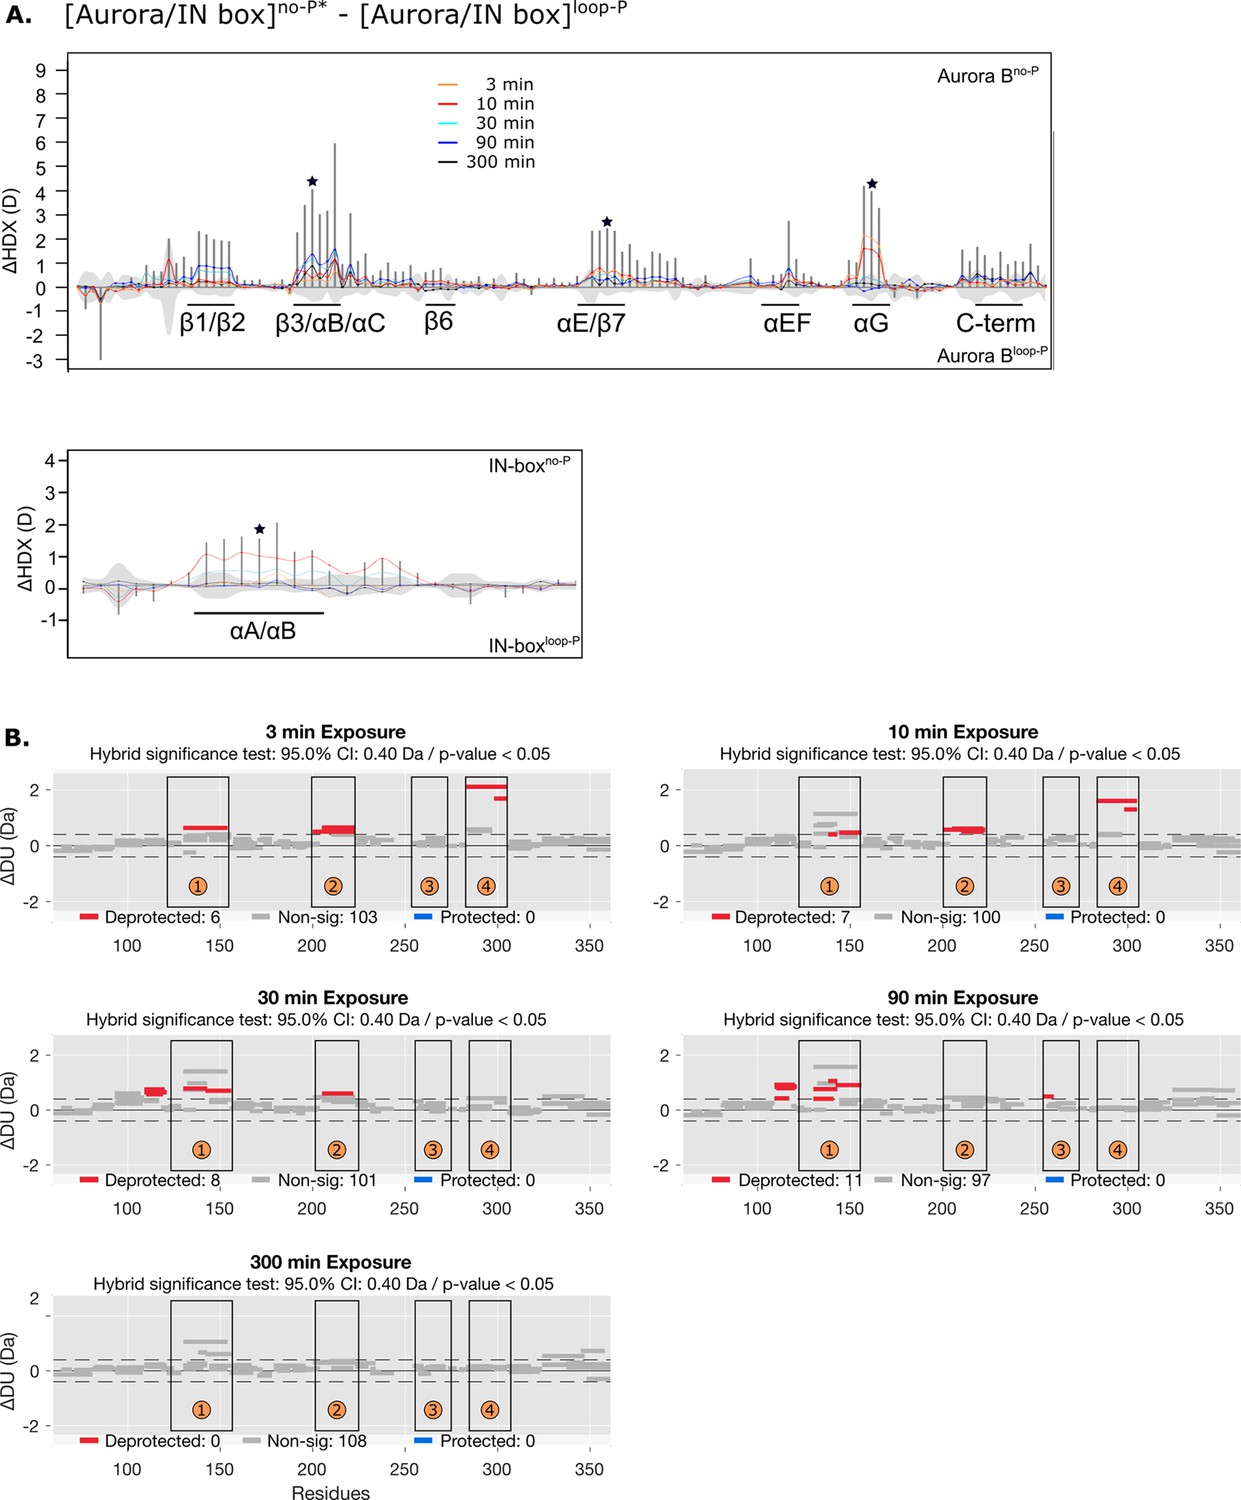
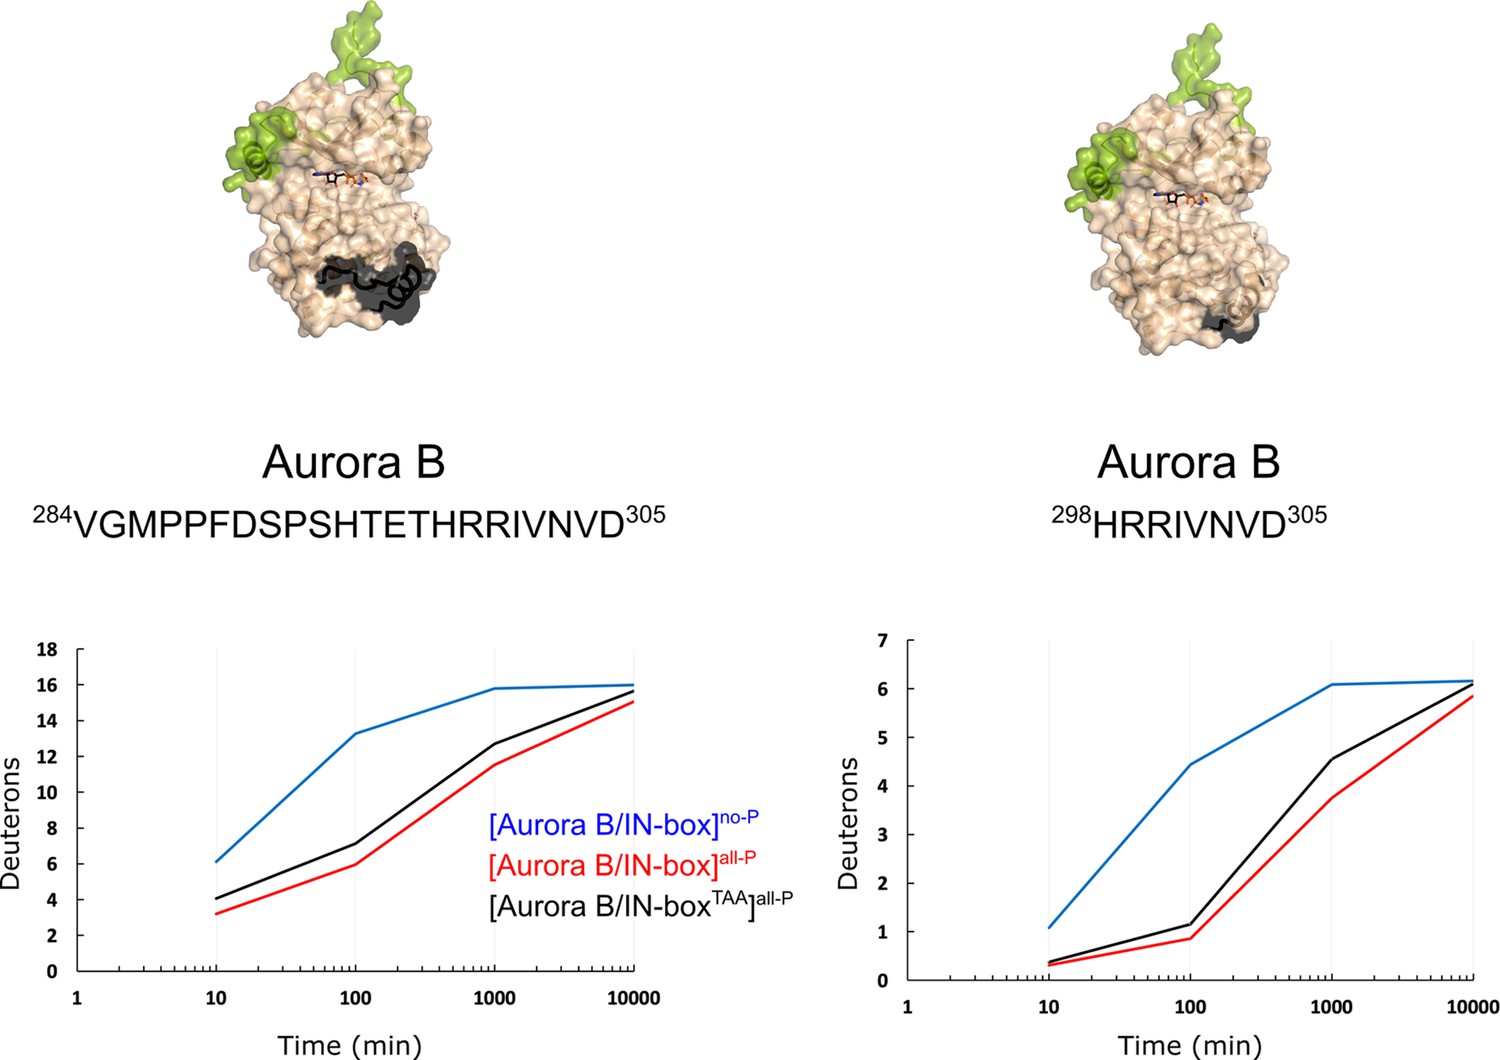
(A) Surface representation of the [Aurora B/IN-box] molecule (PDB 4C2W), with regions where HDX differences were detected shown in black. A difference plot of HDX uptake between [Aurora B/IN-box]no-P* and either [Aurora B/IN-box]loop-P (second row) or [Aurora B/IN-box]IN-P (first row) after 10 min is shown for peptides in three different regions of Aurora B and one region in IN-box (these regions show the largest differences and are the same as in Figure 1). For reference, the differences in HDX uptake between [Aurora B/IN-box]no-P* and [Aurora B/IN-box]all-P* are shown in the third row (they both carry the same ‘scar’ mutation as partially phosphorylated intermediates to calibrate for the effects of the mutation on enzyme dynamics). Peptides are shown as horizontal lines and colored according to differences in deuterium uptake (see legend below). The asterisks indicate representative peptides for which uptake plots are shown in (B). Note that in [Aurora B/IN-box]loop-P only Aurora BαG shows HDX protection comparable to [Aurora B/IN-box]all-P, while in [Aurora B/IN-box]IN-P this is only true for IN-boxαA. (B) The uptake plots for representative peptides from (A). The black dot is showing HDX for fully deuterated peptide under same experimental condition.
Figure 4—figure supplement 1
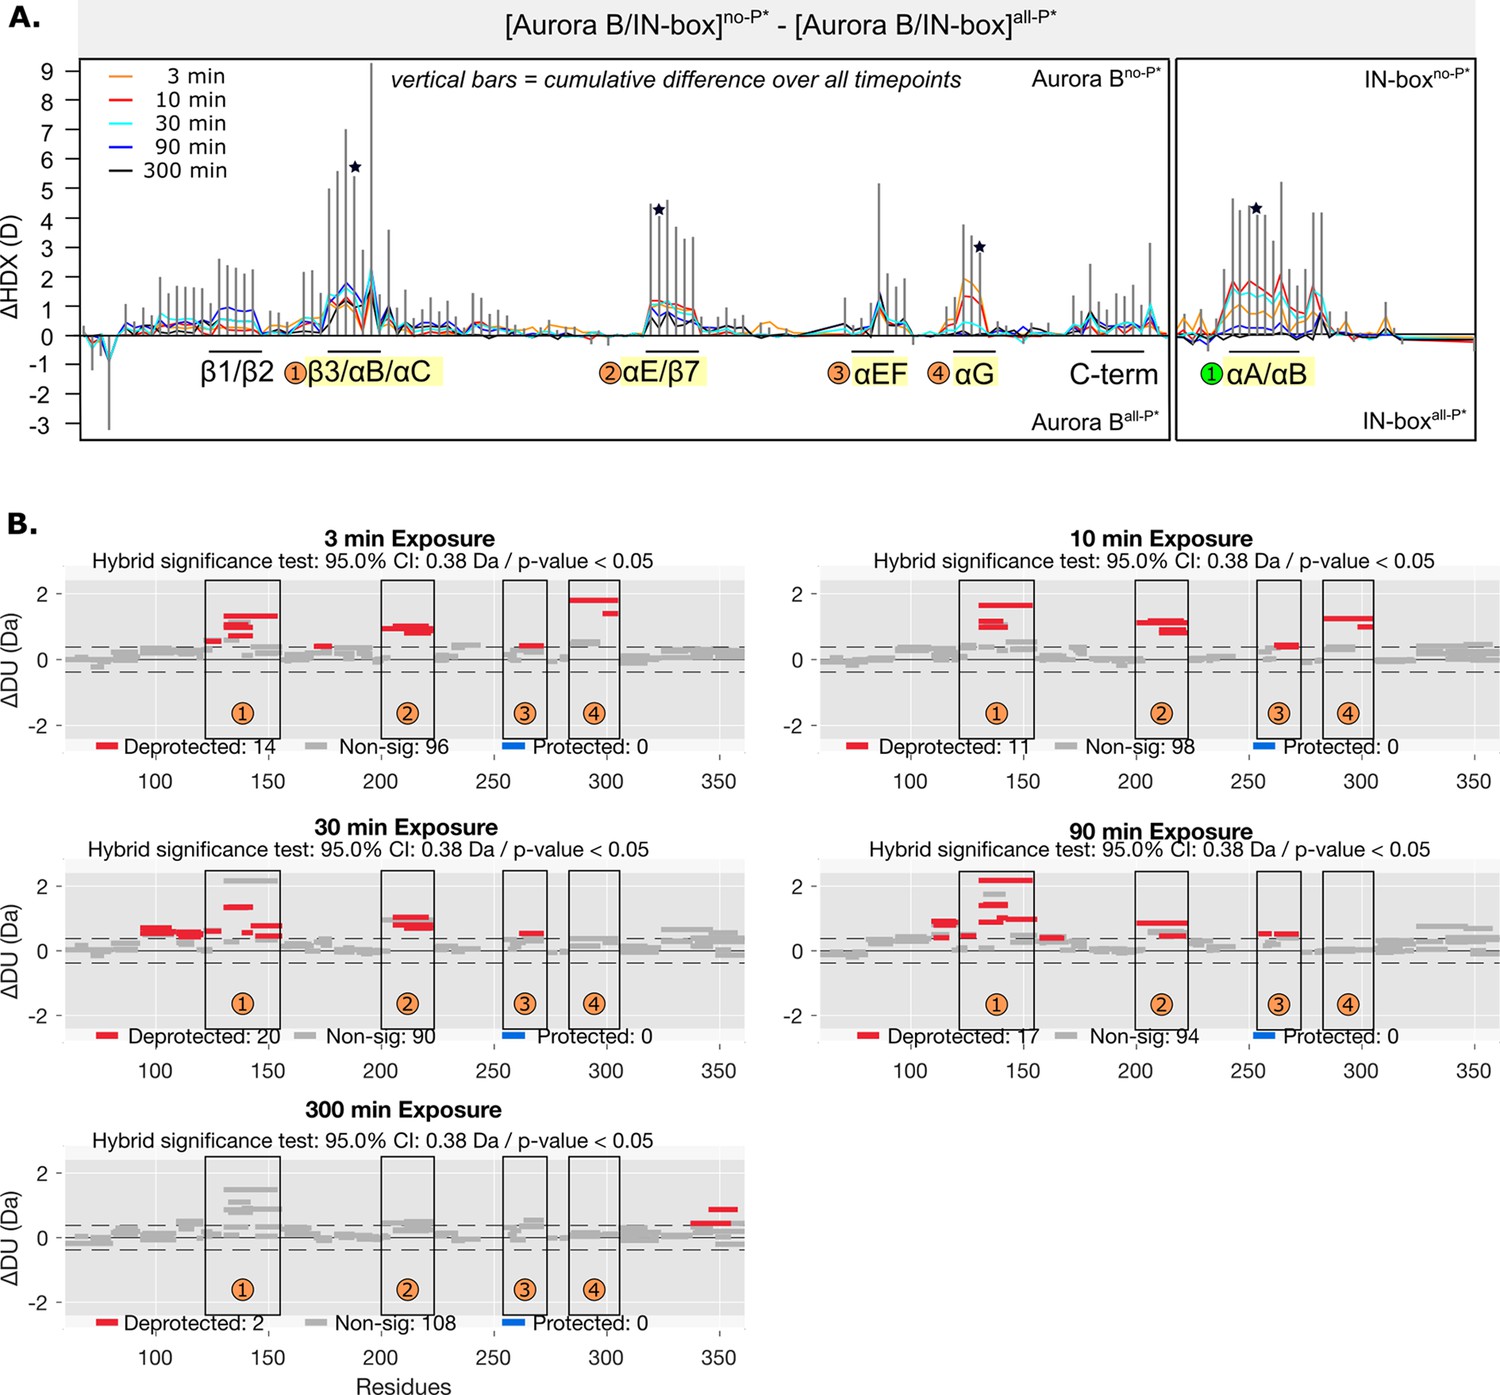
HDX comparison of unphosphorylated and fully phosphorylated [Aurora B/IN-box] complex where IN-box carries the Phe845Cys mutation.
(A) Butterfly-difference plot for a comparison of H/D exchange (HDX) differences between [Aurora B/IN-box]no-P* and [Aurora B/IN-box]all-P*. The asterisk denotes presence of mutation, IN-boxPhe845Cys in the complex. (B) Differential HDX, ΔDU, (Wood plots) for Aurora B in [Aurora B/IN-box]no-P* and [Aurora B/IN-box]all-P* with statistical analysis. Each horizontal bar represents a unique peptide; 95% confidence intervals are shown as gray dotted lines. The gray bars show peptides with non-significant ΔHDX between two samples, the red bars are peptides with higher deuterium incorporation in [Aurora B/IN-box]no-P*. All measurements were performed at least in duplicate. The four regions with the highest cumulative ΔHDX values in wt complex are labeled with numbers as in Figure 1 and Figure 1—figure supplement 2.
Figure 4—figure supplement 2
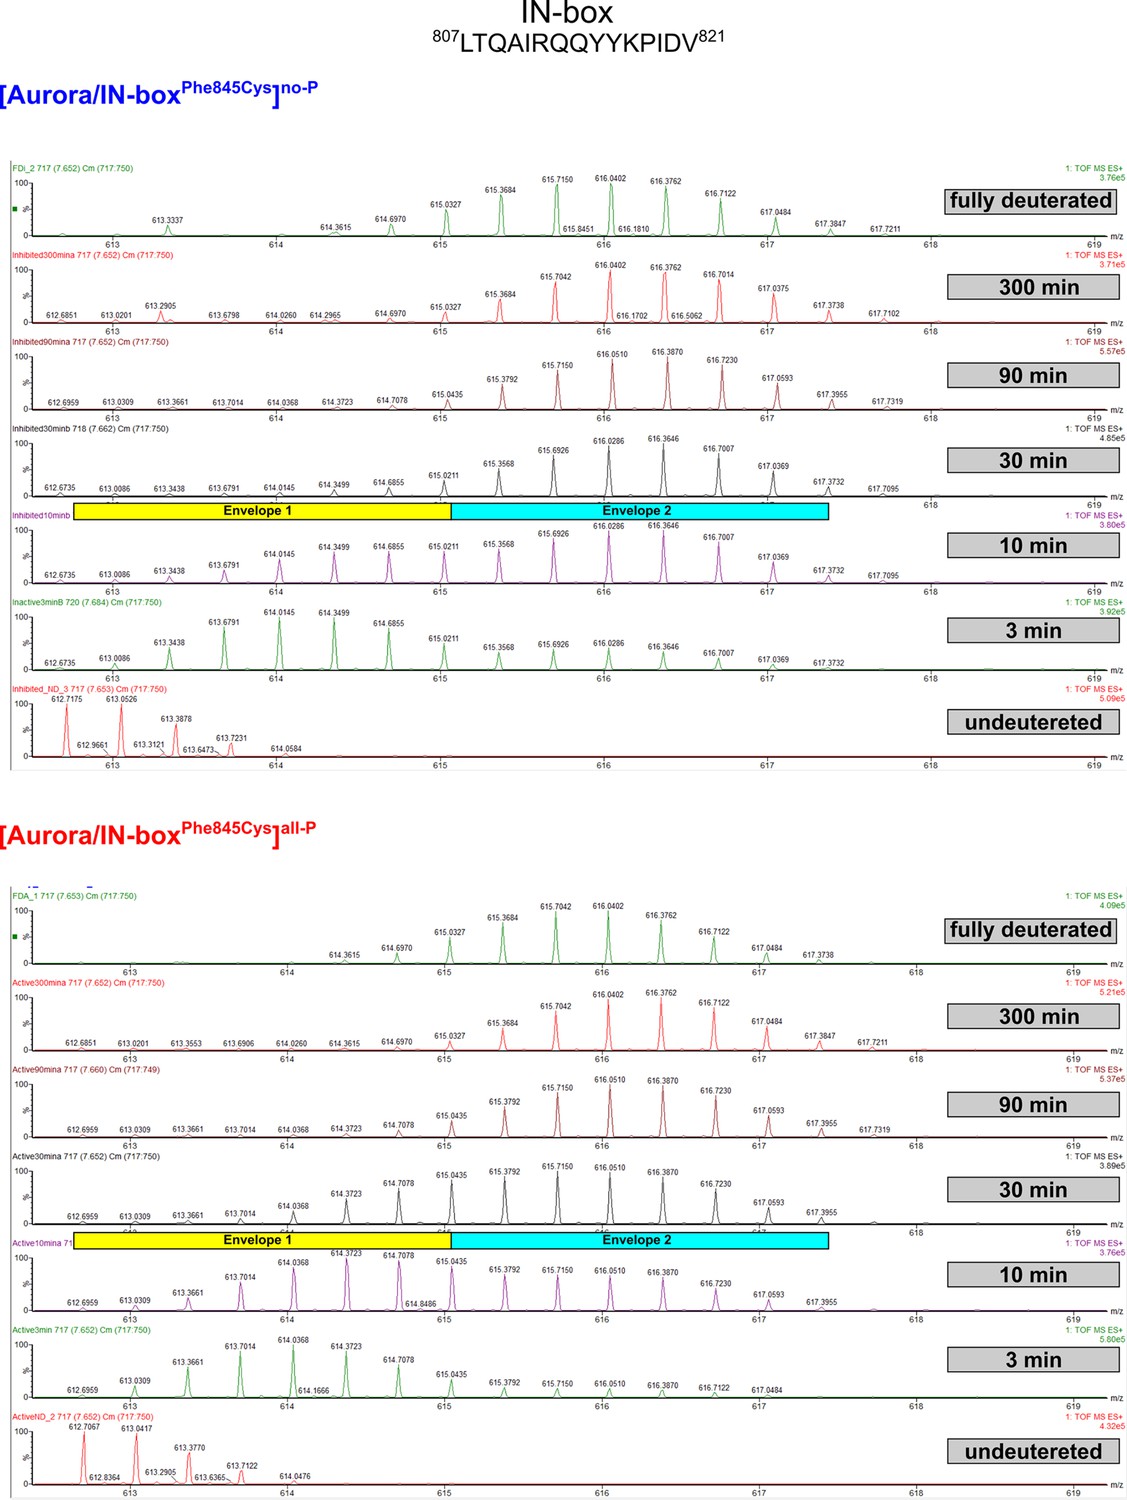
EX1 kinetics observed in IN-boxαA, peptide 807LTQAIRQQYYKPIDV821, in [Aurora B/IN-boxPhe845Cys]no-P and [Aurora B/IN-boxPhe845Cys]all-P.
Comparable with Figure 1—figure supplement 3.
Figure 4—figure supplement 3
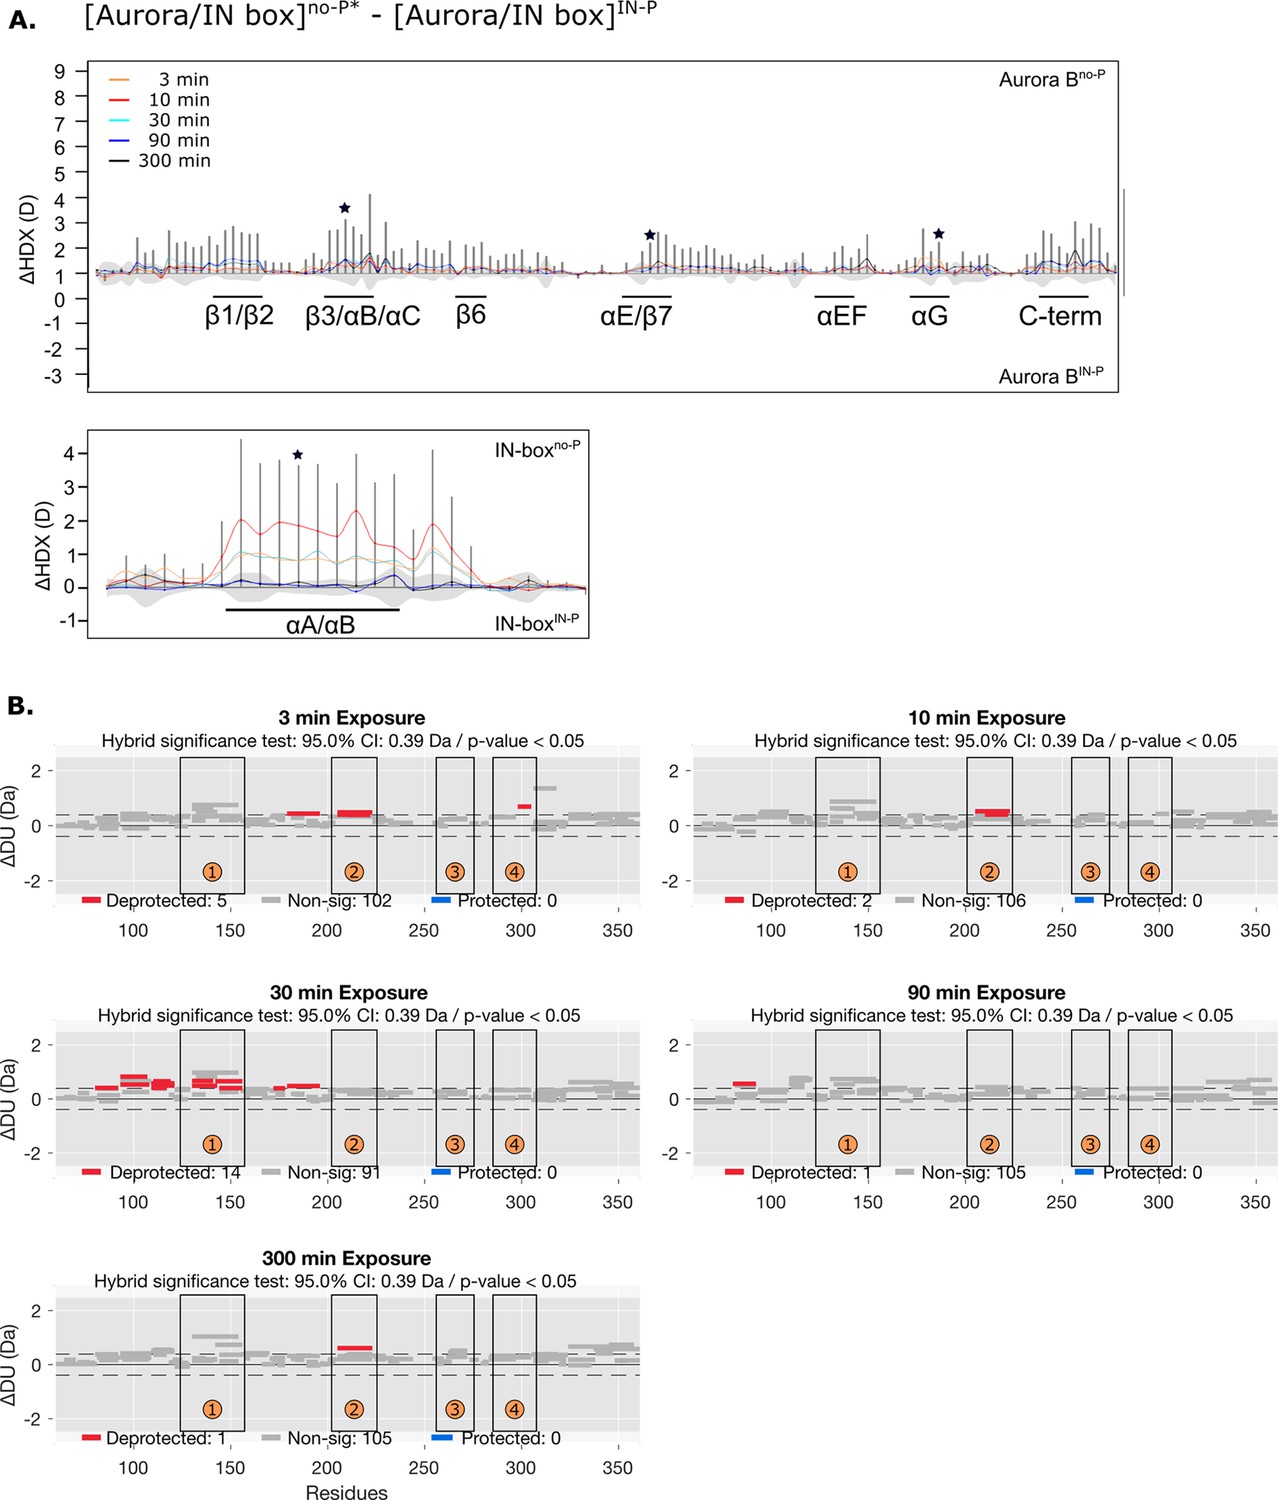
HDX comparison of unphosphorylated [Aurora B/IN-box] with the IN-box mutation Phe845Cys and the [Aurora B/IN-box] IN-P intermediate.
(A) Difference plot showing the difference in hydrogen-deuterium exchange (HDX), ΔDU, between [Aurora B/IN-box]no-P* and [Aurora B/IN-box]IN-P over five time points (orange - 3 min; red - 10 min; cyan - 30 min; blue - 90 min; black - 300 min), as in Figure 1. The asterisk indicates representative peptides for which uptake plots are shown in Figure 4B (purple traces). Note that [Aurora B/IN-box]no-P* carries the same ‘scar’ mutation as [Aurora B/IN-box]IN-P to calibrate for the effects of the mutation on enzyme dynamics. (B) Differential HDX (Wood plots) for Aurora B in [Aurora B/IN-box]no-P* and [Aurora B/IN-box]IN-P with statistical analysis. Each horizontal bar represents a unique peptide; 95% confidence intervals are shown as gray dotted lines. The gray bars show peptides with non-significant ΔHDX between two samples, the red bars are peptides with higher deuterium incorporation in [Aurora B/IN-box]no-P*. All measurements were performed at least in duplicate. The four regions with the highest cumulative ΔHDX values in wt complex are labeled with numbers as in Figure 1 and Figure 1—figure supplement 2.
Figure 4—figure supplement 4
Differences in deuterium uptake between [Aurora B/IN-box]no-P* and [Aurora B/INbox]loop-P.
(A) Difference plot showing the difference in hydrogen-deuterium exchange (HDX), ΔDU, between [Aurora B/IN-box]no-P* and [Aurora B/IN-box]loop-P over five time points (orange - 3 min; red - 10 min; cyan - 30 min; blue - 90 min; black - 300 min), as in Figure 1. The asterisk indicates representative peptides for which the uptake plots are shown in Figure 4B (green). Note that [Aurora B/IN-box]no-P* carries the same ‘scar’ mutation as [Aurora B/IN-box]loop-P to calibrate for the effects of the mutation on enzyme dynamics. (B) Differential HDX (Wood plots) for Aurora B in [Aurora B/IN-box]no-P* and [Aurora B/IN-box]loop-P. Each horizontal bar represents a unique peptide; 95% confidence intervals are shown as gray dotted lines. The gray bars show peptides with non-significant ΔHDX between two samples, the red bars are peptides with higher deuterium incorporation in [Aurora B/IN-box]no-P*. All measurements were performed at least in duplicate. The four regions with the highest cumulative ΔHDX values in wt complex are labeled with numbers as in Figure 1 and Figure 1—figure supplement 2.
Figure 4—figure supplement 5
Structuring of Aurora BαG is independent of phosphorylation in the IN-box TSS motif.
The dynamics of the exchange for two peptides covering the Aurora BαG region of the enzyme complex in which the IN-box TSS motif is mutated to TAA so that it cannot be phosphorylated, [Aurora B/IN-boxTAA], shows a comparable level of protection upon enzyme complex phosphorylation as identical peptides in the phosphorylated wt enzyme complex.
Figure 5 with 2 supplements
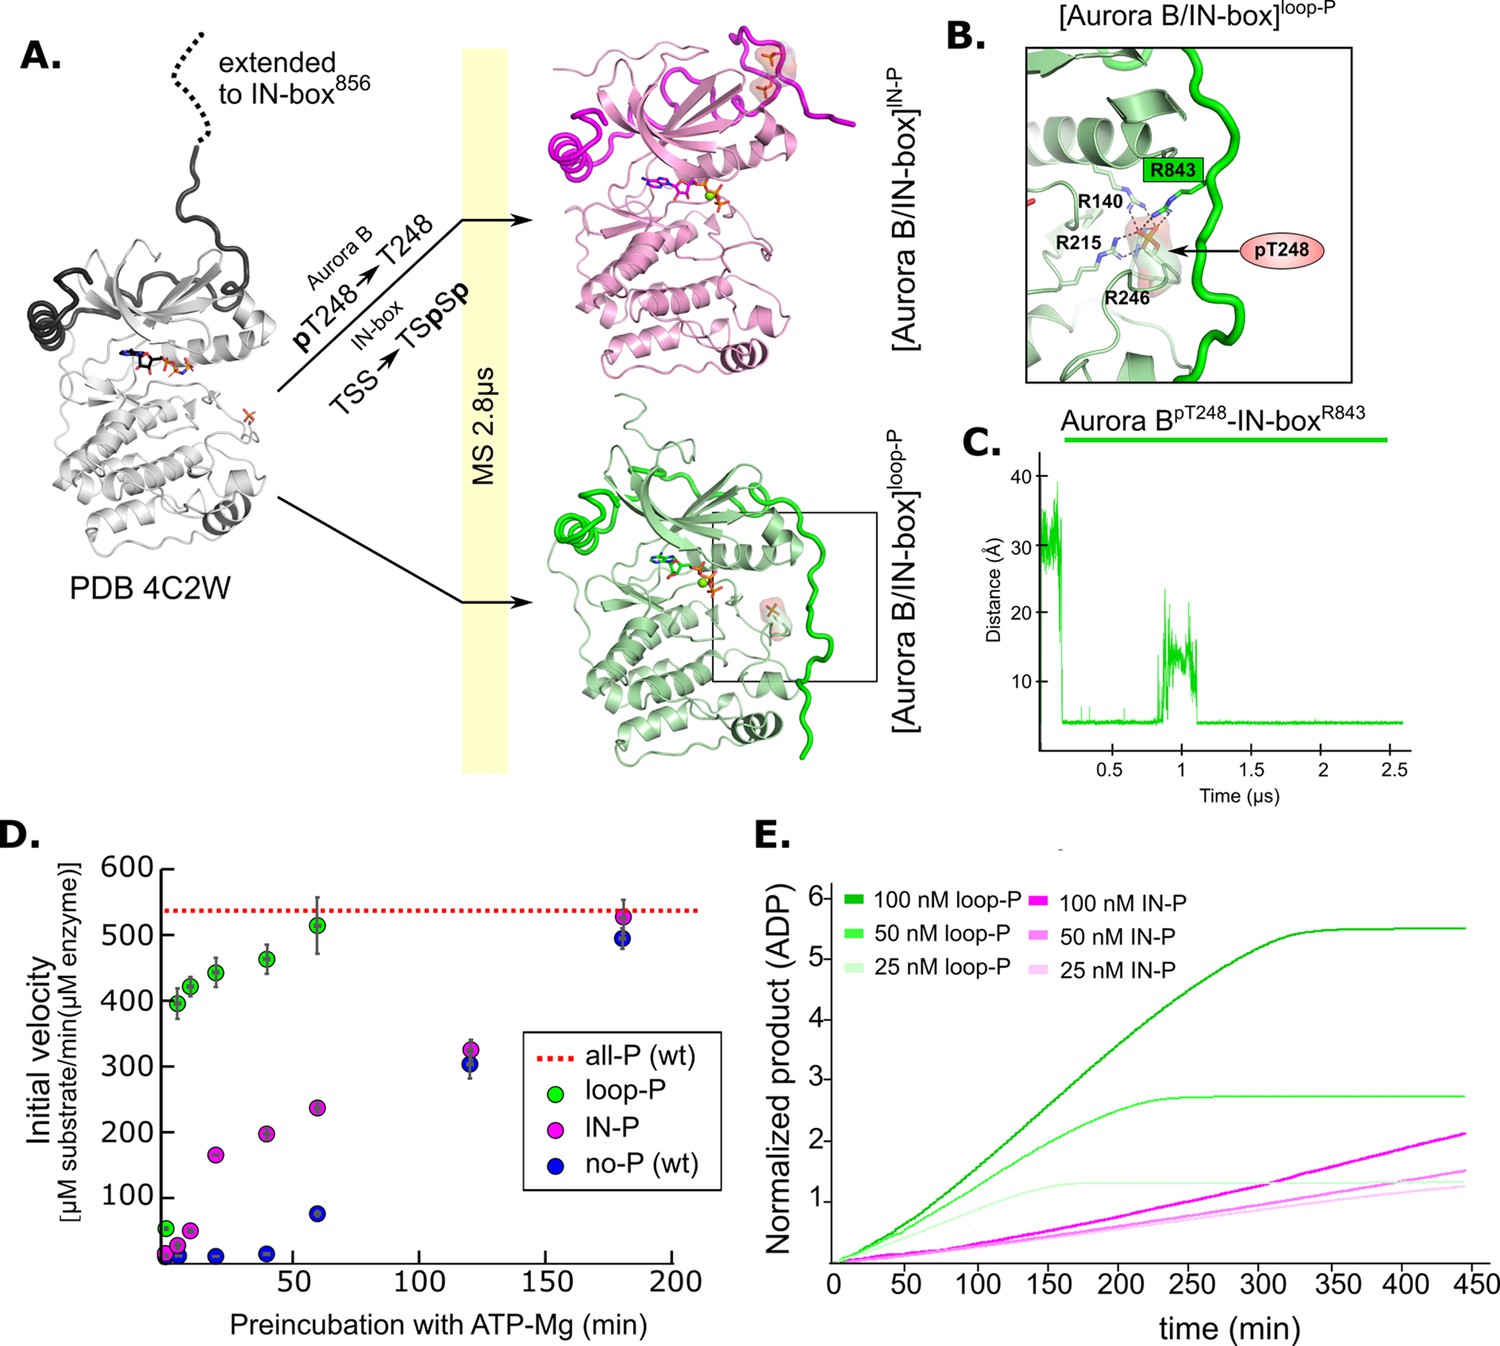
Molecular dynamics (MD) simulation and kinetic experiments show that phosphorylation of the Aurora B activation loop triggers a conformational change in the C-terminal region of the IN-box priming the [Aurora B/IN-box] complex for the activation.
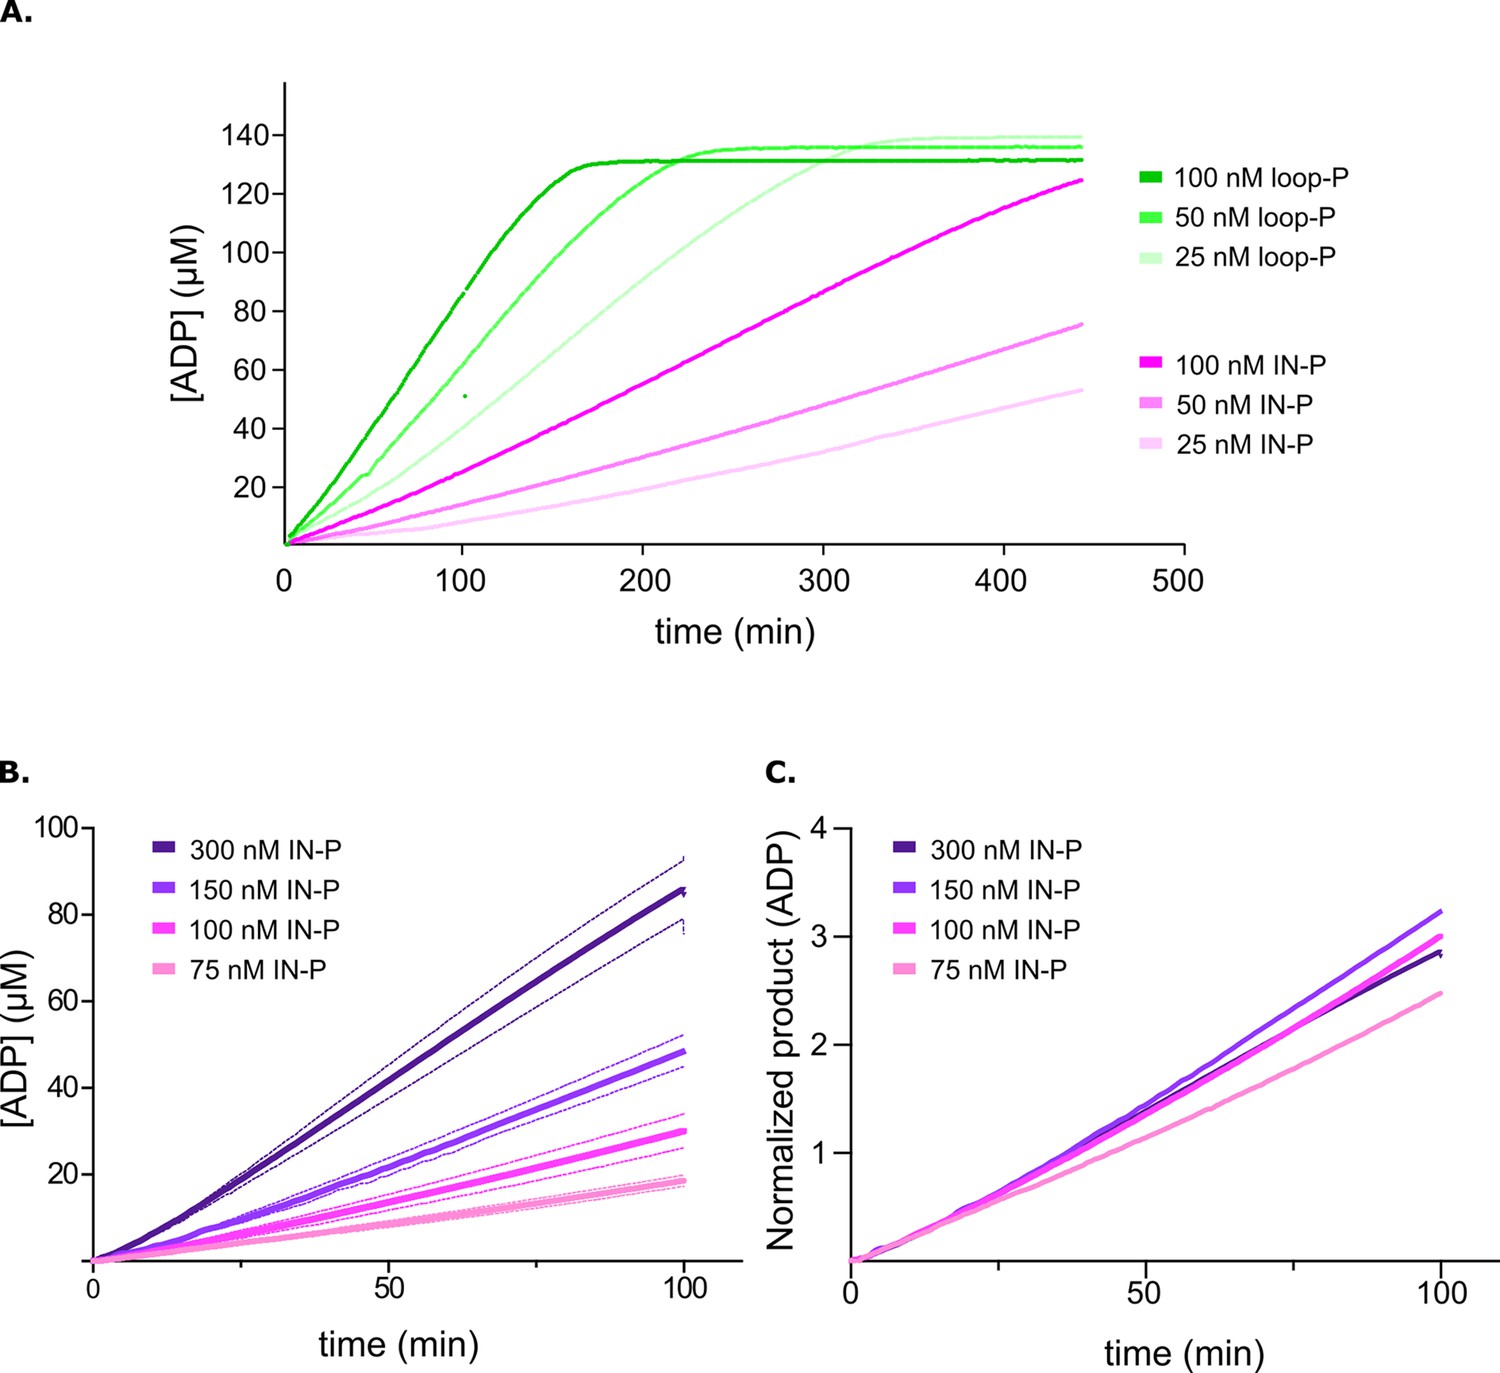
(A) Initial models for MD stimulation were generated as previously described (see legend to Figure 2). For [Aurora B/IN-box]IN-P, the phosphate group of Aurora BpT248 was removed, and phosphates were added to IN-boxSer849 and IN-boxSer850. For [Aurora B/IN-box]loop-P, no phosphates needed to be added or removed because the initial structure already contained Aurora BpThr248. Simulations were run for 2.8 μs and ribbon diagram of the final structure for [Aurora B/IN-box]IN-P is shown in magenta and the final structure for [Aurora B/IN-box]loop-P is shown in green (IN-box is shown as a coil in a darker color). The interactions, within the boxed region of the [Aurora B/IN-box]loop-P structure, are shown in (B). (B) Enlarged view showing the interactions of Aurora BpThr248 with residues in Aurora B and IN-box in the final MD confirmation of [Aurora B/IN-box]loop-P. (C) The change in the distance between the phosphorus atom in Aurora BpThr248 and the Cζ atom in IN-boxArg843 during the MD simulation. (D) Autoactivation assay for unphosphorylated or partially phosphorylated complexes. The enzyme was first preincubated with ATP-Mg at different times, followed by an enzymatic assay to determine the initial rate of substrate peptide phosphorylation. The plot shows the initial rates of enzymatic activity as a function of incubation time with ATP for [Aurora B/IN-box]no-P (blue), [Aurora B/IN-box]loop-P (green), and [Aurora B/IN-box]IN-P (magenta). The full enzymatic activity of [Aurora B/IN-box]all-P is shown as a red dotted line. Initial velocity measurements after different ATP preincubation times were performed in three independent experiments, and the standard deviation is indicated for each time point. (E) Dodson kinetic test. Normalized product release curves for [Aurora B/IN-box]loop-P (green) and [Aurora B/IN-box]IN-P (magenta) at 25, 50, and 100 nM concentration in the presence of the peptide substrate and ATP. Note that the pink traces overlap during the first ~50 min of incubation, indicating that phosphorylation of the activation loop is an intramolecular, concentration-independent, reaction.
Figure 5—figure supplement 1
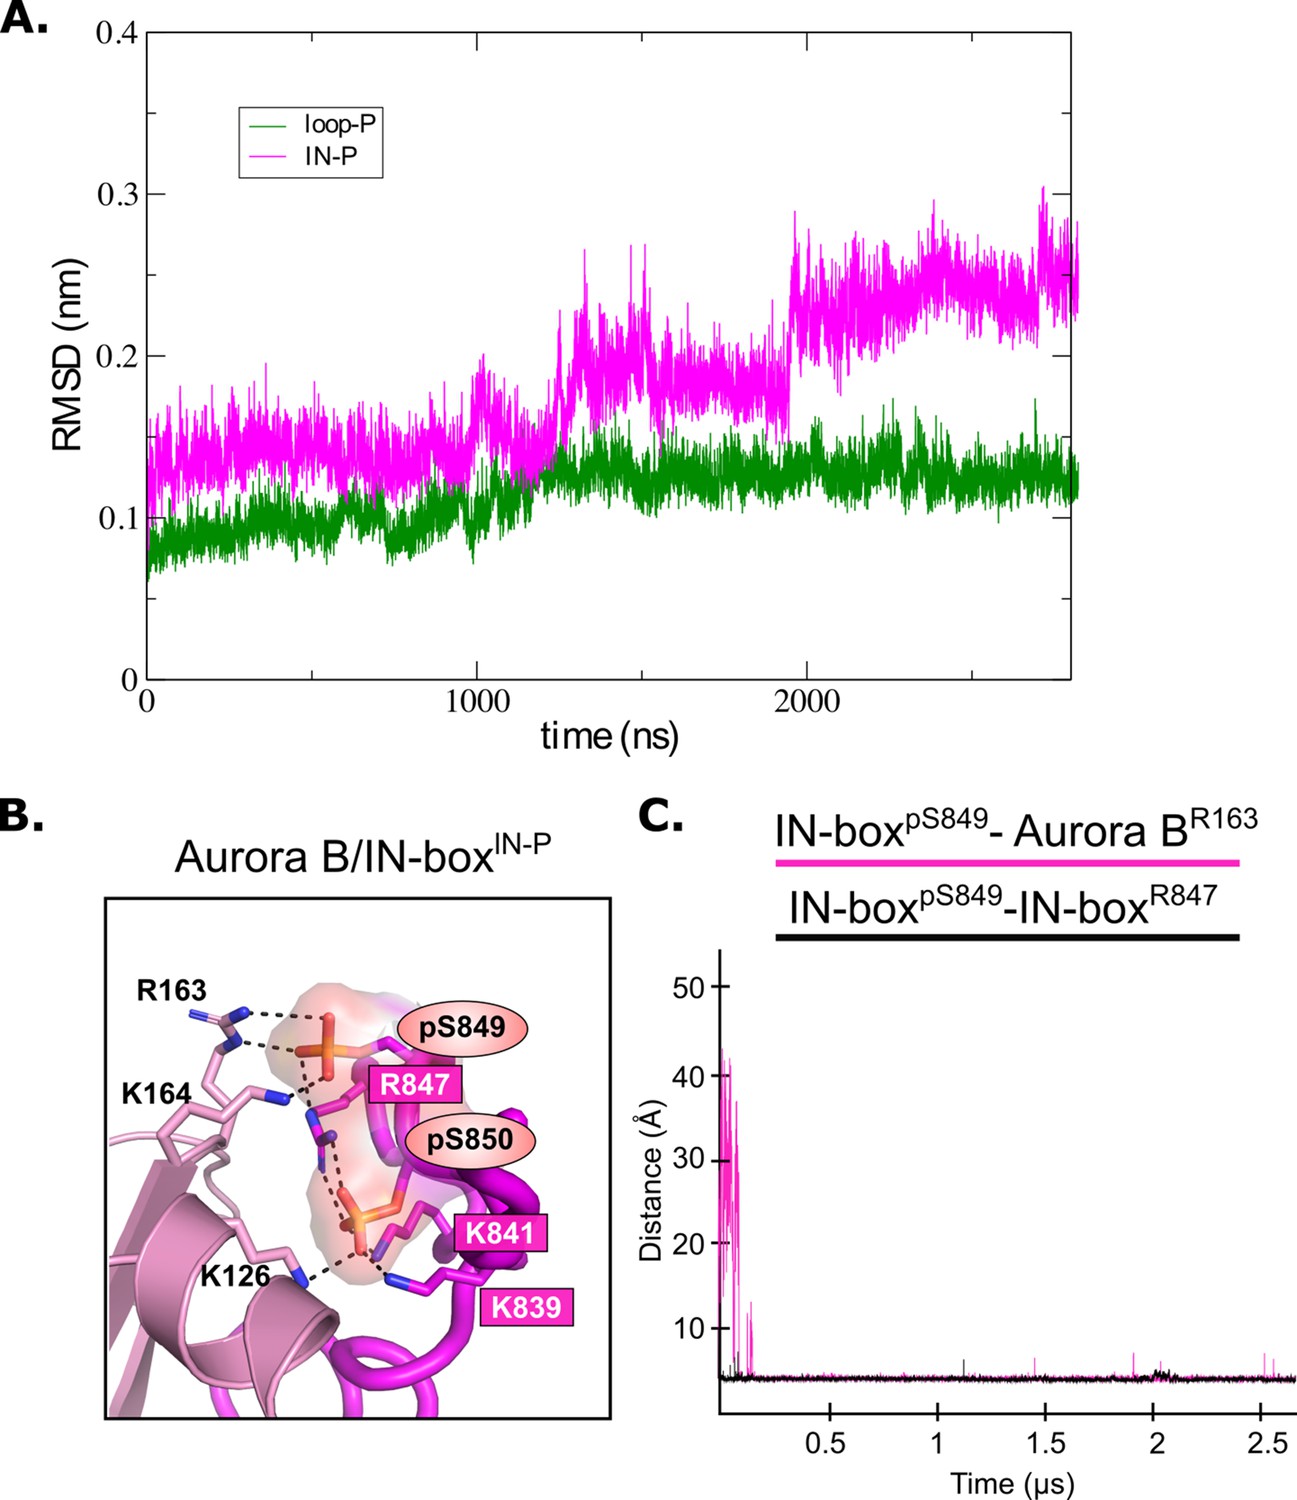
Analysis of MD for [Aurora B/IN-box] phosphorylated intermediates.
(A) Root mean square deviation (RMSD) for [Aurora B/IN-box]IN-P (magenta) and [Aurora B/IN-box]loop-P (green) complexes during 2800 ns molecular dynamics (MD) simulations. (B) Magnified representation of the interactions between the phosphorylated TSS motif (IN-boxSer849-P and IN-boxSer850-P) and the lysines and arginines of Aurora B (dark pink labels) and the N-terminal lobe of Aurora B (left) for [Aurora B/IN-box]IN-P. Right: The change in distance between the phosphorus atom in IN-boxpSer249 and the Cζ atom in Aurora BArg163 (pink) and the change in distance between the phosphorus atom in IN-boxpSer249 and the Cζ atom in IN-boxArg847 (black) during the MD simulation.
Figure 5—figure supplement 2
Phosphorylation in the activation loop is the intramolecular initial step in activation.
(A) Product release curves for [Aurora B/IN-box]loop-P (green) and [Aurora B/IN-box]IN-P (magenta) in the presence of the peptide substrate and ATP at 25–100 nM enzyme concentrations (see legend). (B) Product release curves for [Aurora B/IN-box]IN-P in the presence of the peptide substrate and ATP at 75–300 nM enzyme concentrations (see legend). Standard deviation from three measurements is indicated with the dotted line in the same color. (C) The curves from (B) were normalized to the enzyme concentration. The traces overlap during the initial phase, indicating that phosphorylation of the activation loop is intramolecular (concentration-independent) reaction.
Figure 6 with 1 supplement
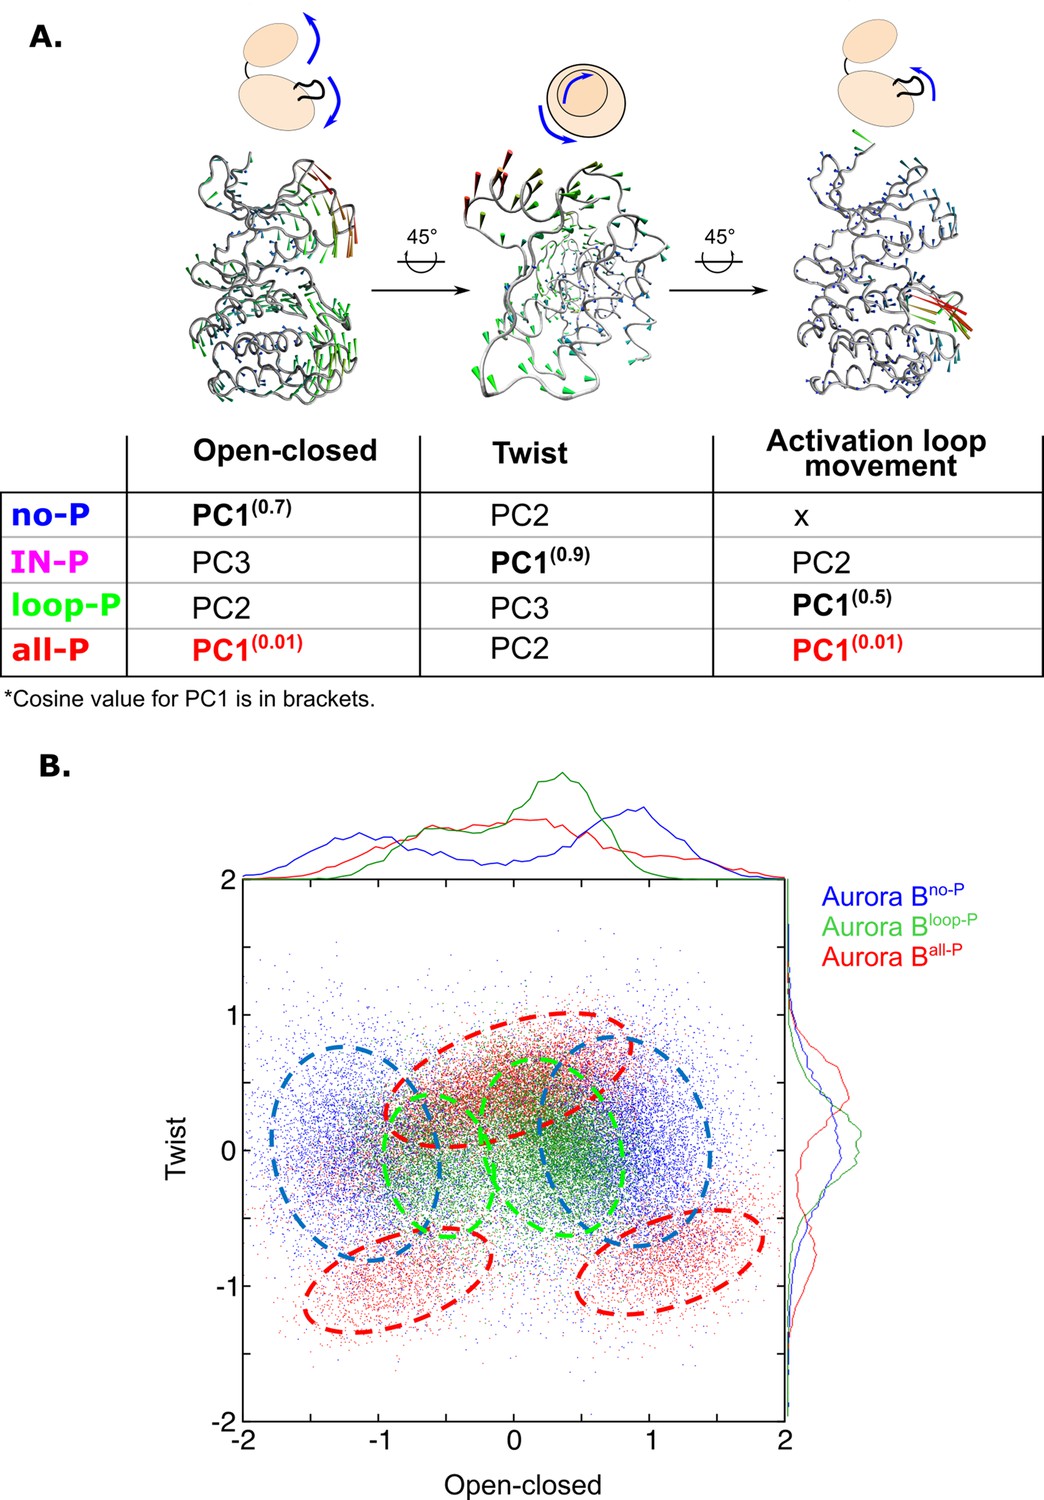
Principal component analysis (PCA) shows that only fully phosphorylated [Aurora B/IN-box] achieves coordinated movements between opening/closing, twisting, and movements in the activation loop.
(A) Protein movements in the different phosphorylation forms of the [Aurora B/IN-box] complex in PC1 are illustrated by porcupine diagrams (opening/closing movement, twisting movement, movement in the activation loop). The needle tip indicates the direction of the vector and the magnitude, while the color (blue-green-red) corresponds to the increasing magnitude. The table summarizes the results of PCA for different phosphorylation forms of the complex. The cosine value close to 0, indicating an ordered movement, was obtained only for PC1 of [Aurora B/IN-box]all-P, implying a coordinated movement of opening and closing and a restructuring of the activation loop. (B) Correlation between ‘opening/closing’ and ‘twist’ for [Aurora B/IN-box]no-P (blue), [Aurora B/IN-box]loop-P (green), and [Aurora B/IN-box]all-P (red).
Figure 6—figure supplement 1
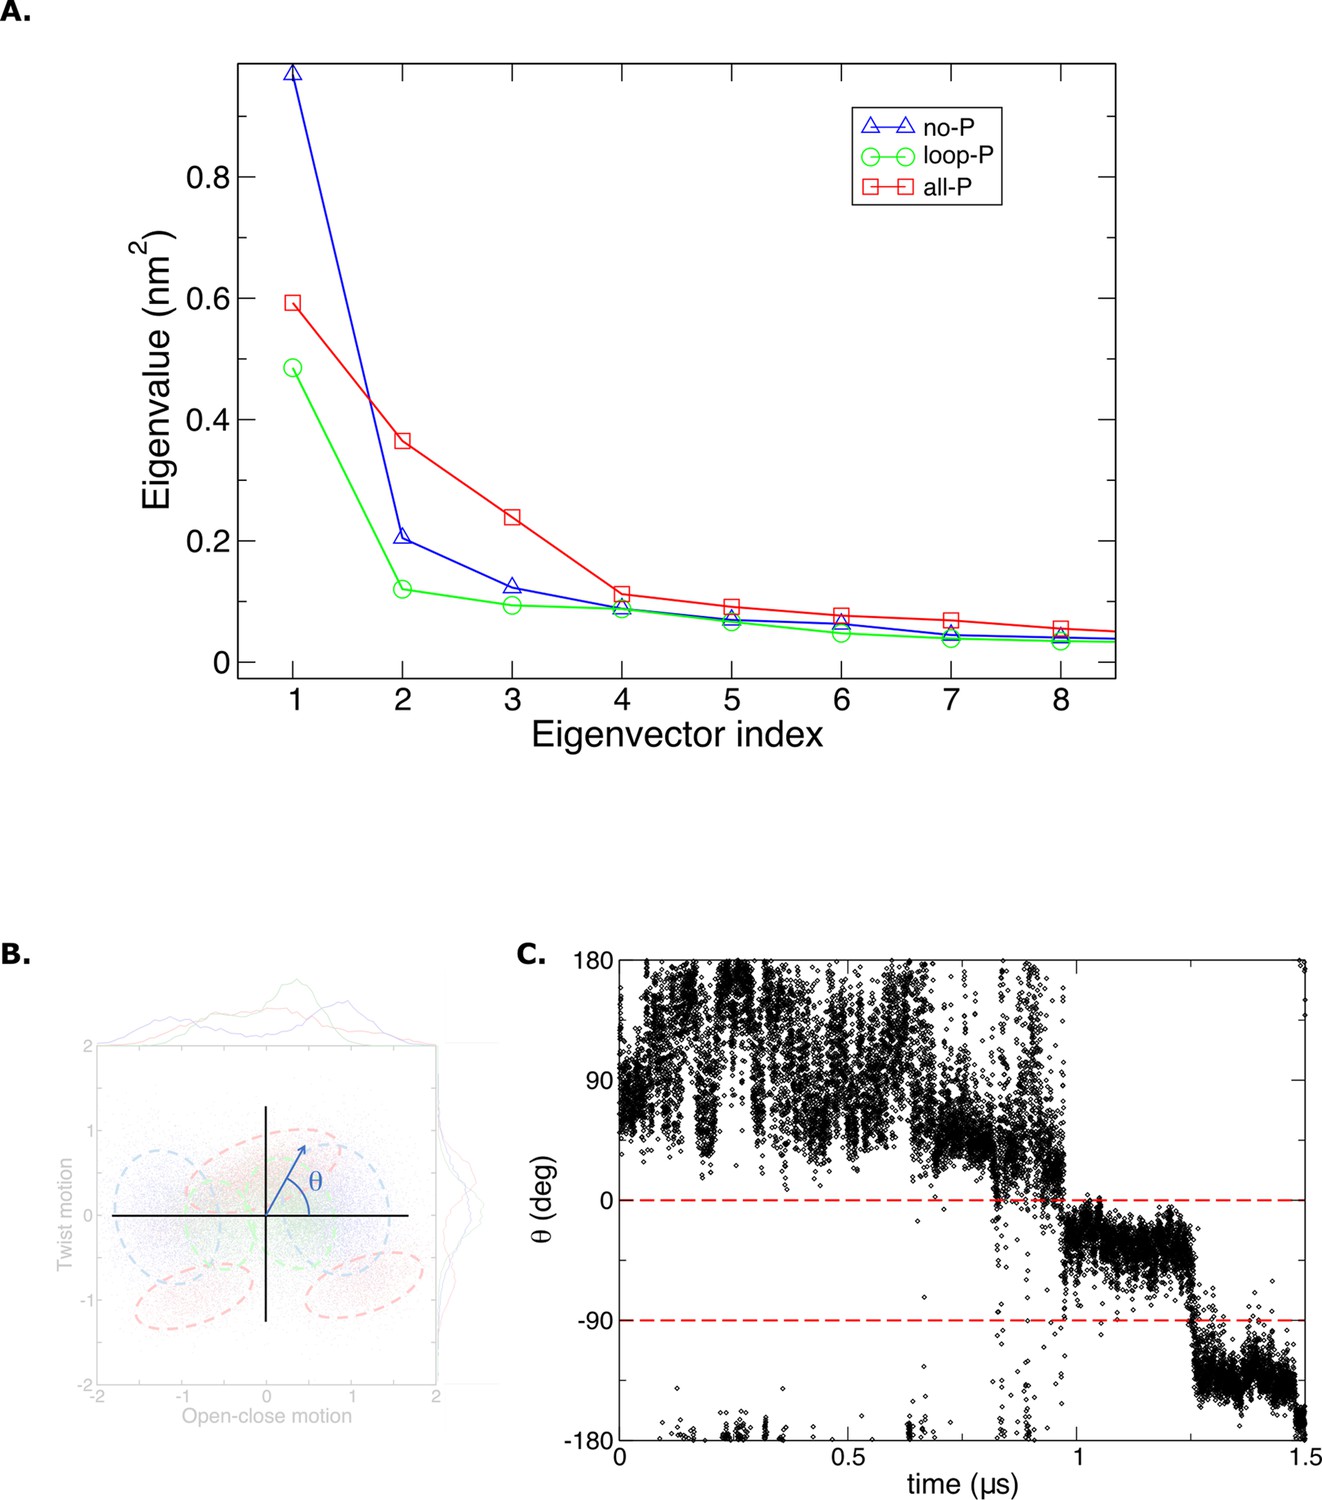
Principal components MD data analysis.
(A) Eigen values obtained from molecular dynamics (MD) trajectories. (B) The order parameter ‘theta’ is defined as an angle in the Cartesian plane where the (x, y) coordinates are determined by the projections of the structures from MD over the first two principal modes of the protein scaffold. (C) Time evolution of the order parameter ‘theta’ in the last 1.5 μs of MD simulations for the [Aurora B/IN-box]all-P.
Figure 7 with 1 supplement

Model summarizing the autoactivation mechanism of [Aurora B/IN-box].
In the absence of phosphorylation, the [Aurora B/IN-box]no-P, the enzyme complex is very flexible. The activation segment and Aurora BαG are disorganized, Aurora BαC is not in catalytic position and the two lobes of the kinase are more separated. The IN-box is disorganized and its C-terminal region does not interact with Aurora B. This enzyme can autophosphorylate its own activation loop in a slow intramolecular process. Once the activation loop is phosphorylated, [Aurora B/IN-box]loop-P, Aurora BαG is stabilized and the IN-box C-terminal region is closer to the C-lobe of Aurora B. This leads to the stabilization of Aurora BαC and partial formation of the substrate binding site around the phosphorylated activation loop. This intermediate is further phosphorylated in the IN-box in a faster intermolecular process. In the fully phosphorylated form of the enzyme complex, [Aurora B/IN-box]all-P, the IN-box stably interacts with the phosphorylated loop; Aurora BαC is in the productive position and the peptide binding site is fully formed. The enzyme complex now has all functional elements in place and synchronization of key global motions of the kinase lobes ensures efficient catalysis.
Figure 7—figure supplement 1
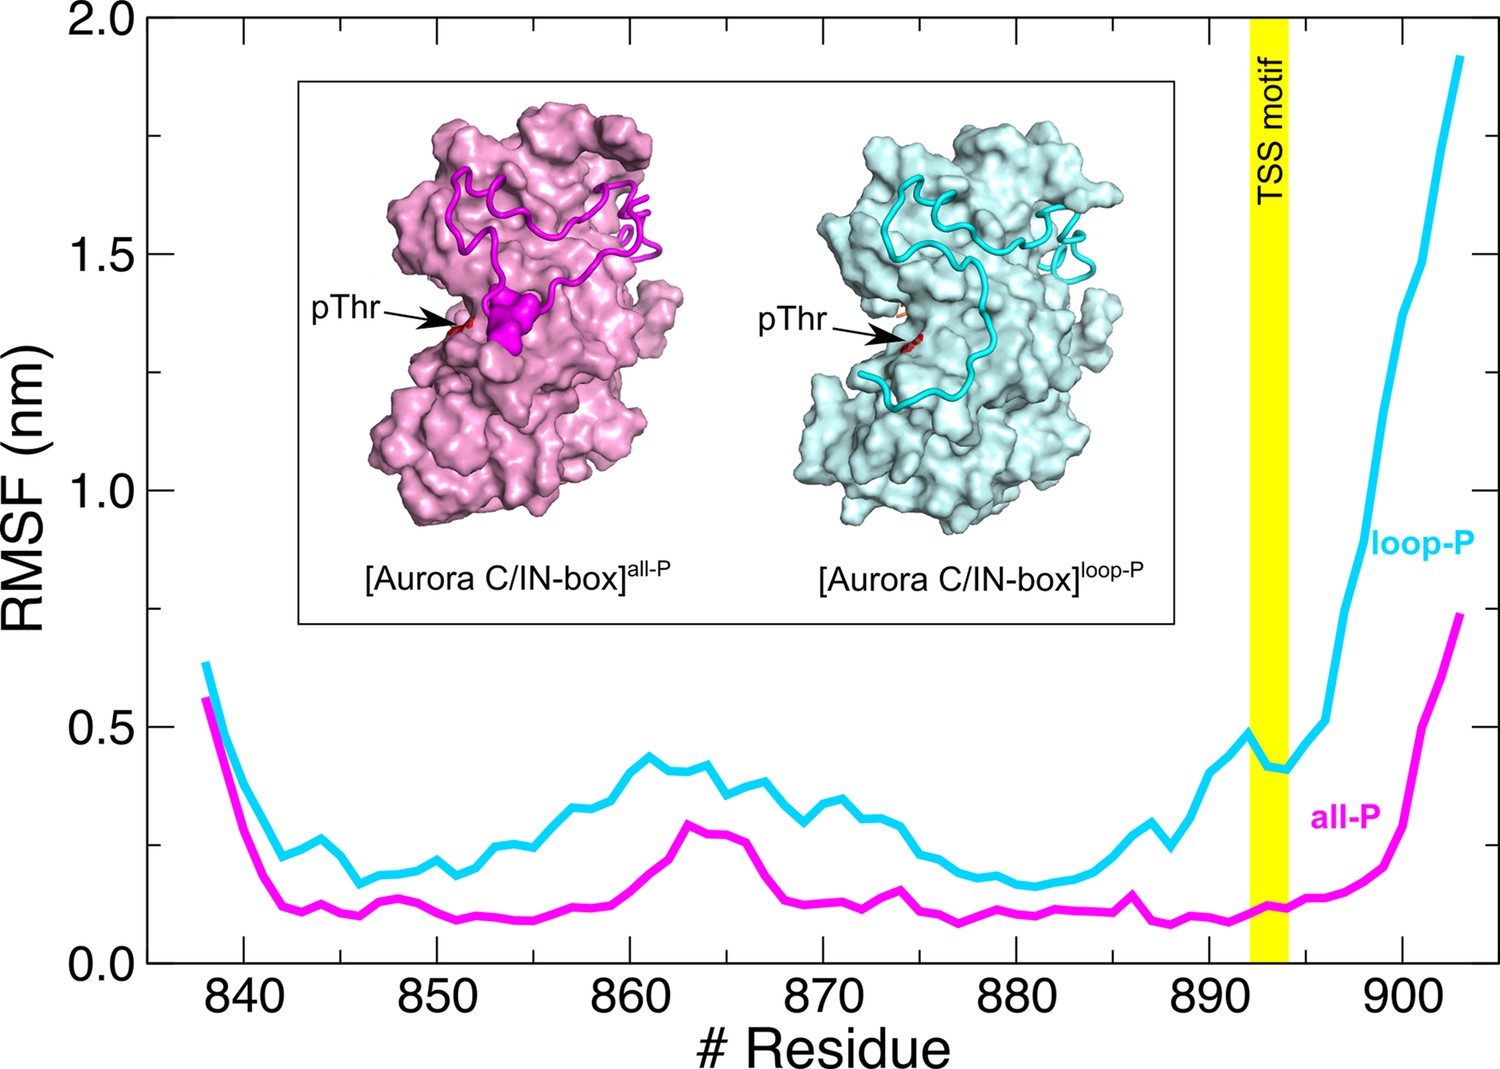
Root mean square fluctuations (RMSFs) for IN-box chain in the context of [Aurora C/IN-box]all-P (magenta) are more stable than in the [Aurora C/IN-box]loop-P (cyan).
Note also that in the absence of IN-box phosphorylation, the entire C-terminal part of the IN-box, including the TSS motif (position marked with a yellow stripe), has a very high RMSF, which is due to the absence of IN-box-Aurora CpThr198 interactions. Inset: Final structure of molecular dynamics (MD) simulation with [Aurora C/IN-box]all-P (magenta) and the [Aurora C/IN-box]loop-P (cyan). Aurora C is shown as surface and IN-box as coil (phosphorylated serines in IN-box are shown as surfaces). Position of phosphorylated Aurora CThr198 is indicated with an arrow.
Author response image 1
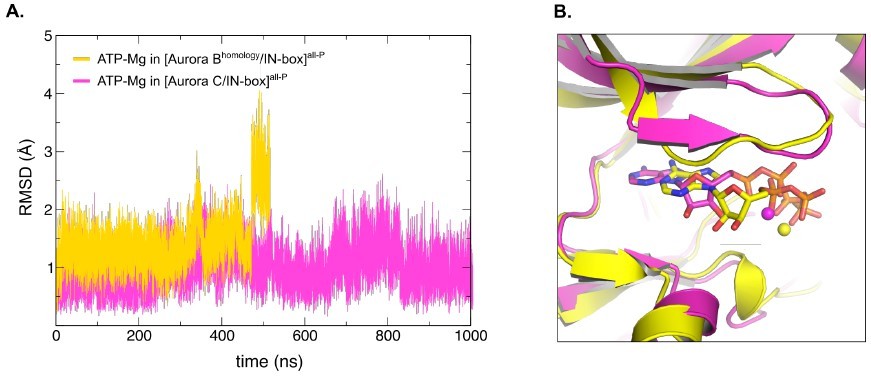
Homology model of X.
laevis [Aurora B/IN-box] based on the crystal structure of H. sapiens [Aurora C/IN-box], [Aurora Bhomology/IN-box]all-P, shows unstable ATP-Mg binding during MD simulation. (A) Graph showing root-mean-square deviations (RMSD) for modelled ATP-Mg duringMD simulation in the active site of [Aurora C/IN-box]all-P (magenta) and [Aurora Bhomology/IN-box]all-P (yellow). For Aurora Bhomology/IN-box all-P ATP-Mg RMSD jumps from ~1.5 Å to ~2.75 Å after 440 ns indicating detaching from the active site. In difference, ATP-Mg in [Aurora C/IN-box]all-P remains stabled for full 1000 ns of MD simulation. (B) Overlay of the final position of the ATP-Mg in the active site of [Aurora C/IN-box]all-P (magenta) and [Aurora Bhomology/IN-box]all-P (yellow). ATP is shown in sticks and Mg is a ball.
Videos
Video 1
2.8 μs molecular dynamics (MD) simulation trajectory of [Aurora B/IN-box]no-P.
Video 2
2.8 μs molecular dynamics (MD) simulation trajectory of [Aurora B/IN-box]all-P.
Video 3
2.8 μs molecular dynamics (MD) simulation trajectory of [Aurora B/IN-box]IN-P.
Video 4
2.8 μs molecular dynamics (MD) simulation trajectory of [Aurora B/IN-box]loop-P.
Video 5
PC1 for [Aurora B/IN-box]all-P: coordinated motions of open-closed/twist and activation loop movements.
Tables
Table 1
Kinetic constants for [Aurora B/IN-box] complexes.
| Construct | kcat (s–1) | KM (μM) | kcat/KM (M–1 s–1) |
|---|---|---|---|
| [Aurora B/IN-box]all-P | 12 | 179 | 7×10⁴ |
| [Aurora B/IN-box]loop-P | 4 | 1208 | 0.3×10⁴ |
| [Aurora B/IN-box]IN-P | ~0.5* | ND | ND |
| [Aurora B/IN-box]no-P | ~0.08* | ND | ND |
| [Aurora B/IN-boxArg843Ala] | 7 | 260 | 3×10⁴ |
| [Aurora B/IN-boxArg847Ala] | 16 | 860 | 1.9×10⁴ |
-
ND - The KM value could not be determined due to the very high concentrations of peptide substrate required to produce measurable changes in the enzyme velocities.
-
*
The reported kcat is estimated based on the vmax values obtained by a non-linear fit to the Michaelis-Menten equation, using the GraphPad Prism software.
Additional files
-
Supplementary file 1
Hydrogen-deuterium exchange coupled to mass spectrometry (HDX-MS) summary table for [Aurora B/IN-box]all-P and [Aurora B/IN-box]no-P datasets.
- https://cdn.elifesciences.org/articles/85328/elife-85328-supp1-v2.xlsx
-
Supplementary file 2
Statistics of hydrogen-deuterium exchange (HDX) uptake for all peptides over time in [Aurora B/IN-box]all-P and [Aurora B/IN-box]no-P datasets.
- https://cdn.elifesciences.org/articles/85328/elife-85328-supp2-v2.xlsx
-
Supplementary file 3
Hydrogen-deuterium exchange coupled to mass spectrometry (HDX-MS) summary table for [Aurora B/IN-box]all-P*, [Aurora B/IN-box]no-P*, [Aurora B/IN-box]loop-P, and [Aurora B/IN-box]IN-P datasets.
- https://cdn.elifesciences.org/articles/85328/elife-85328-supp3-v2.xlsx
-
Supplementary file 4
Statistics of hydrogen-deuterium exchange (HDX) uptake for all peptides over time in [Aurora B/IN-box]all-P*, [Aurora B/IN-box]no-P*, [Aurora B/IN-box]loop-P, and [Aurora B/IN-box]IN-P datasets.
- https://cdn.elifesciences.org/articles/85328/elife-85328-supp4-v2.xlsx
-
Supplementary file 5
Full hydrogen-deuterium exchange (HDX) dataset for [Aurora B/IN-box]all-P* (red), [Aurora B/IN-box]IN-P (purple), [Aurora B/IN-box]loop-P (green), and [Aurora B/IN-box]no-P* (blue).
All collected peptides are shown with the standard error calculated based on two replicates. The black dot in the corner of the graph indicates the exchange of the fully deuterated control for the peptide of interest.
- https://cdn.elifesciences.org/articles/85328/elife-85328-supp5-v2.pdf
-
MDAR checklist
- https://cdn.elifesciences.org/articles/85328/elife-85328-mdarchecklist1-v2.pdf
Download links
A two-part list of links to download the article, or parts of the article, in various formats.
Downloads (link to download the article as PDF)
Open citations (links to open the citations from this article in various online reference manager services)
Cite this article (links to download the citations from this article in formats compatible with various reference manager tools)
The structural basis of the multi-step allosteric activation of Aurora B kinase
eLife 12:e85328.
https://doi.org/10.7554/eLife.85328


