Mutation of vsx genes in zebrafish highlights the robustness of the retinal specification network
- Centro Andaluz de Biología del Desarrollo (CSIC/UPO/JA), Spain
- Centre for Integrative Biology, Facultad de Ciencias, Universidad Mayor, Chile
- IRCCS SYNLAB SDN, Via E. Gianturco, Italy
- Department of Molecular Life Sciences, University of Zürich, Switzerland
- Champalimaud Research, Champalimaud Centre for the Unknown, Portugal
Figures
Figure 1 with 3 supplements

DNA-binding domain deletion of vsx genes affect neural retina formation and disrupt VBA reflex.
(a) CRISPR/Cas9 DNA editing tool was used to generate deletions (green box) in the highly conserved DBD from vsx1 (top) and vsx2 (bottom) TFs. Blue boxes represent gene exons, black boxes the location of sgRNAs used to guide Cas9 endonuclease and primers for screening are depicted as opposing arrowheads. b-d and f-h. Histological sections stained with nuclear marker DAPI and phalloidin-Alexa488 for actin filaments from WT (b-d, n≥8) and vsxKO central retinas (f-h, n≥10) at 48hpf (b, f), 72hpf (c, g) and 6dpf (d, h). (e, i). Head dorsal view from 6dpf WT (e) and vsxKO (i) larvae with insets showing their pigmentation pattern (white arrowhead). ONL: outer nuclear layer, INL: inner nuclear layer, GCL: ganglion cell layer, hpf: hours post-fertilization, dpf: days post-fertilization. Scale bar in (b-d) and (f-h): 50 µm, scale bar in e and i: 500 µm.
Figure 1—figure supplement 1
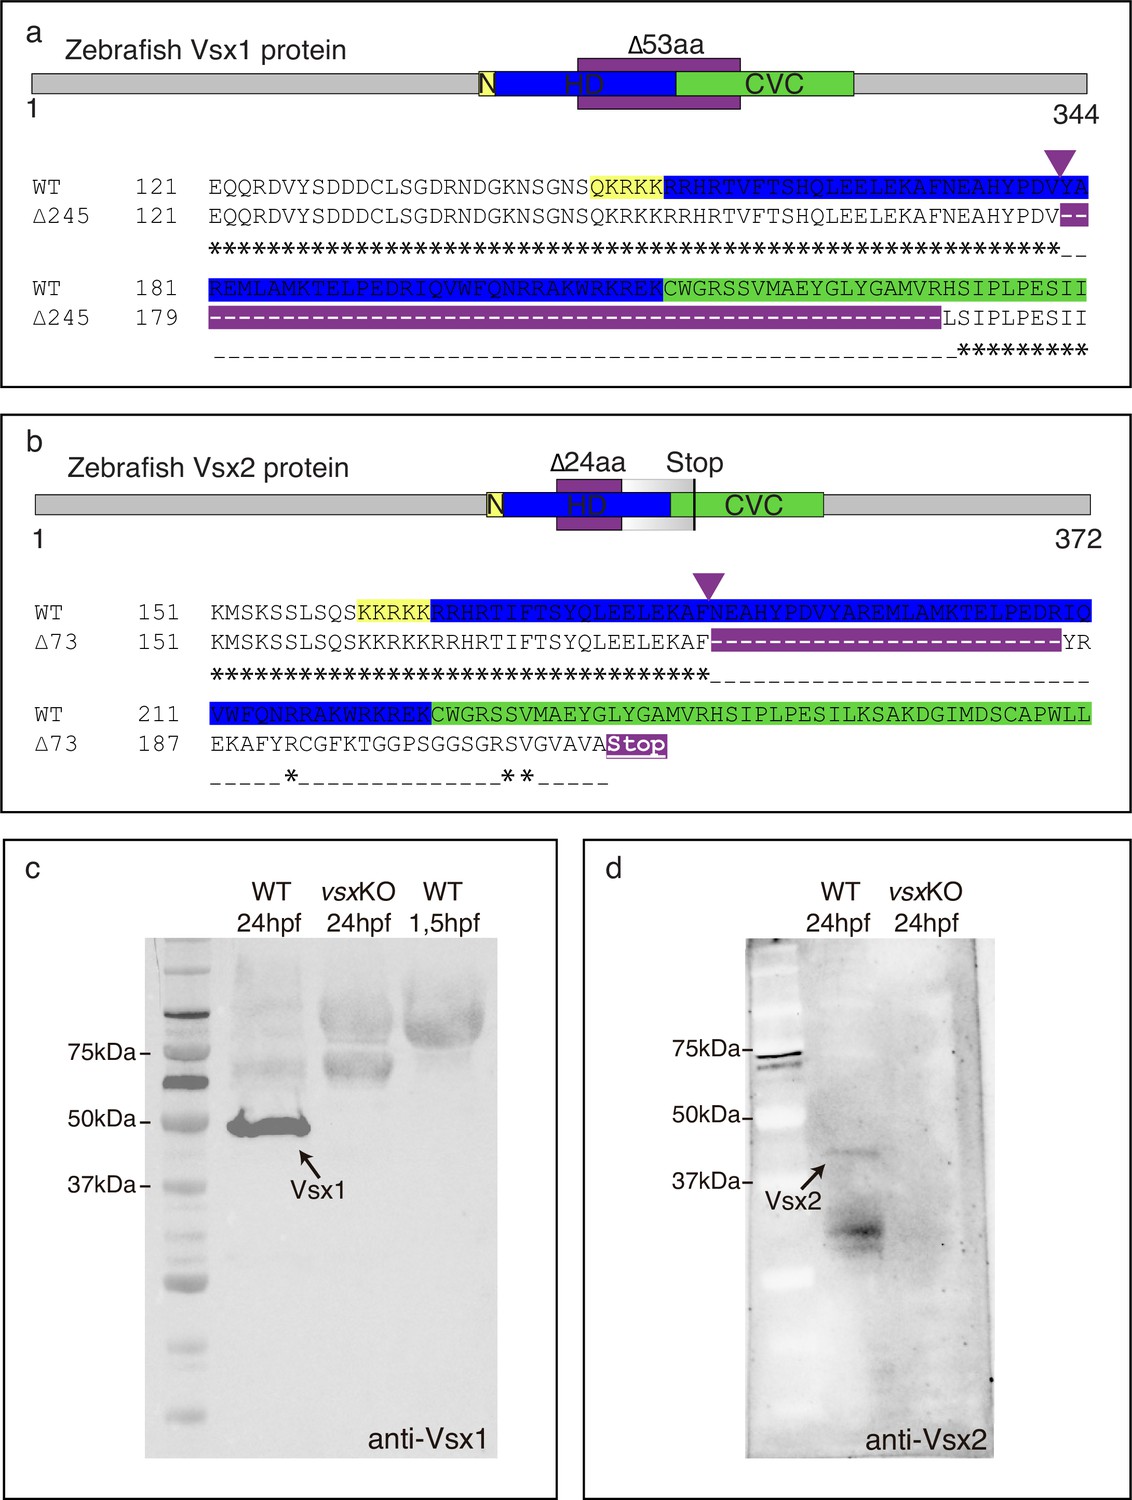
Zebrafish Vsx1 and Vsx2 proteins are disrupted in vsxKO animals.
(a, b). Scheme of zebrafish Vsx1 and Vsx2 peptides and protein alignments showing the nuclear localization signal (N, yellow), homeodomain (HD, blue) and CVC (green) regions. The starting of the mutation induced by CRISPR/Cas9 is indicated by a purple arrowhead. (a). The in-frame 53 amino acid deleted region in the vsx1 mutant is depicted by a purple color in the upper scheme and in the bottom protein alignment. (b). The 24 amino acid deleted region in the vsx2 mutant is depicted by a purple color in the upper scheme followed by a graded grey box indicating the frame-shift in the sequence and the premature stop codon generated in the CVC domain. Important to note is that the deletion in vsx2 comprised conserved critical amino acids that have been identified as causative mutations both in mice (ocular retardation model) and microphthalmic patients (R200Q/P and R227W mutations). (c). Western blot representative image using an anti-Vsx1 antibody showing the WT Vsx1 protein (black arrow). Note that Vsx1 protein is not detected either in vsxKO at 24hpf (middle lane) or in early (1.5hpf) wildtype embryos (right lane). (d). Western blot representative image using an anti-Vsx2 antibody showing the WT Vsx2 protein at 24hpf (black arrow). No Vsx2 protein is detectable in vsxKO heads at 24hpf.
Figure 1—figure supplement 2
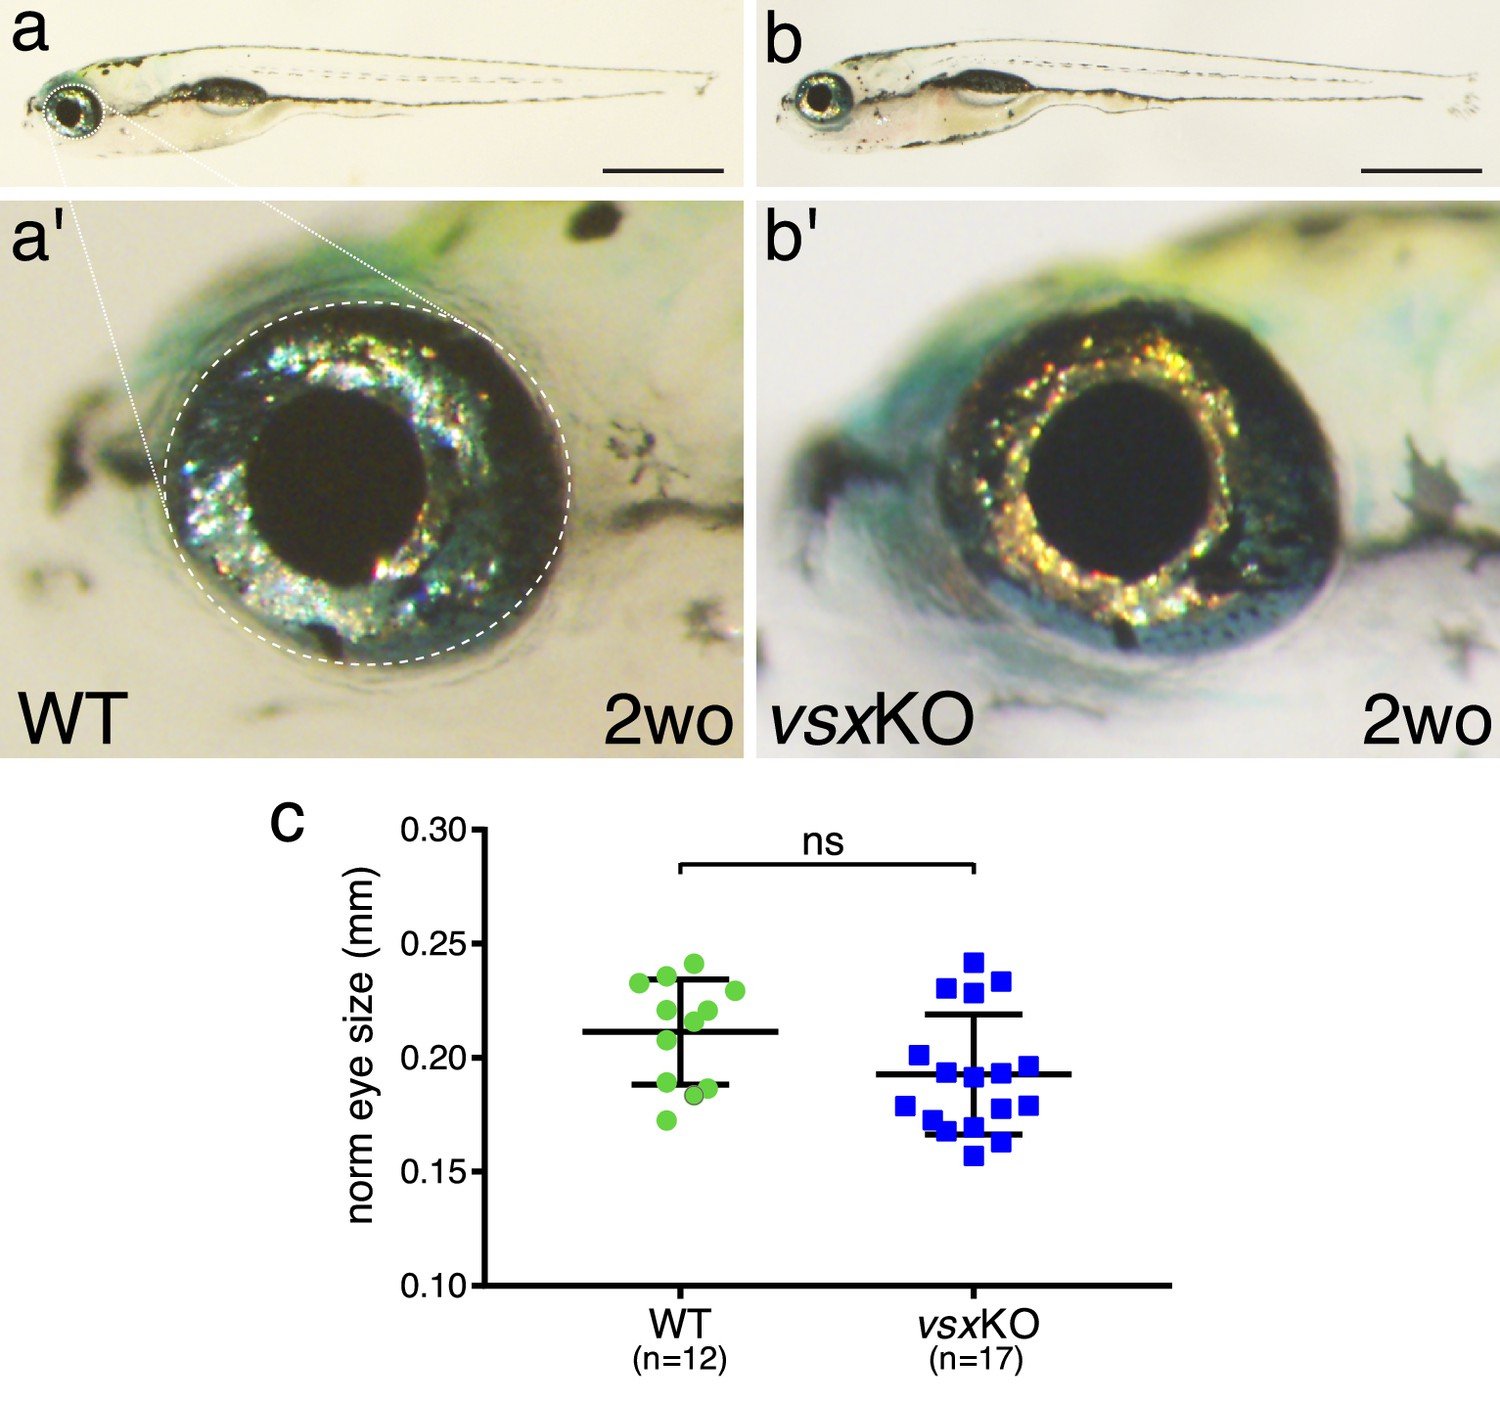
Eye size is normal in vsxKO juvenile fish.
(a, b). Lateral view of a 2-week-old wildtype (a) and vsxKO (b) fish. Note that vsxKO juvenile fish show no obvious morphological differences with wildtype siblings. (a', b'). High-magnification images from wildtype (a') and vsxKO (b') fish heads. No changes in eye shape or size were observed between mutant and wildtype siblings. (c). Quantification of eye lateral surface (normalized by fish antero-posterior length) in 2-week-old fish revealed no significant differences in eye size between wildtype (green circles) and vsxKO mutant fish (blue squares) using an unpaired t-test. Data are shown as mean ± SD. Scale bar in a and b: 1 mm.
Figure 1—figure supplement 3
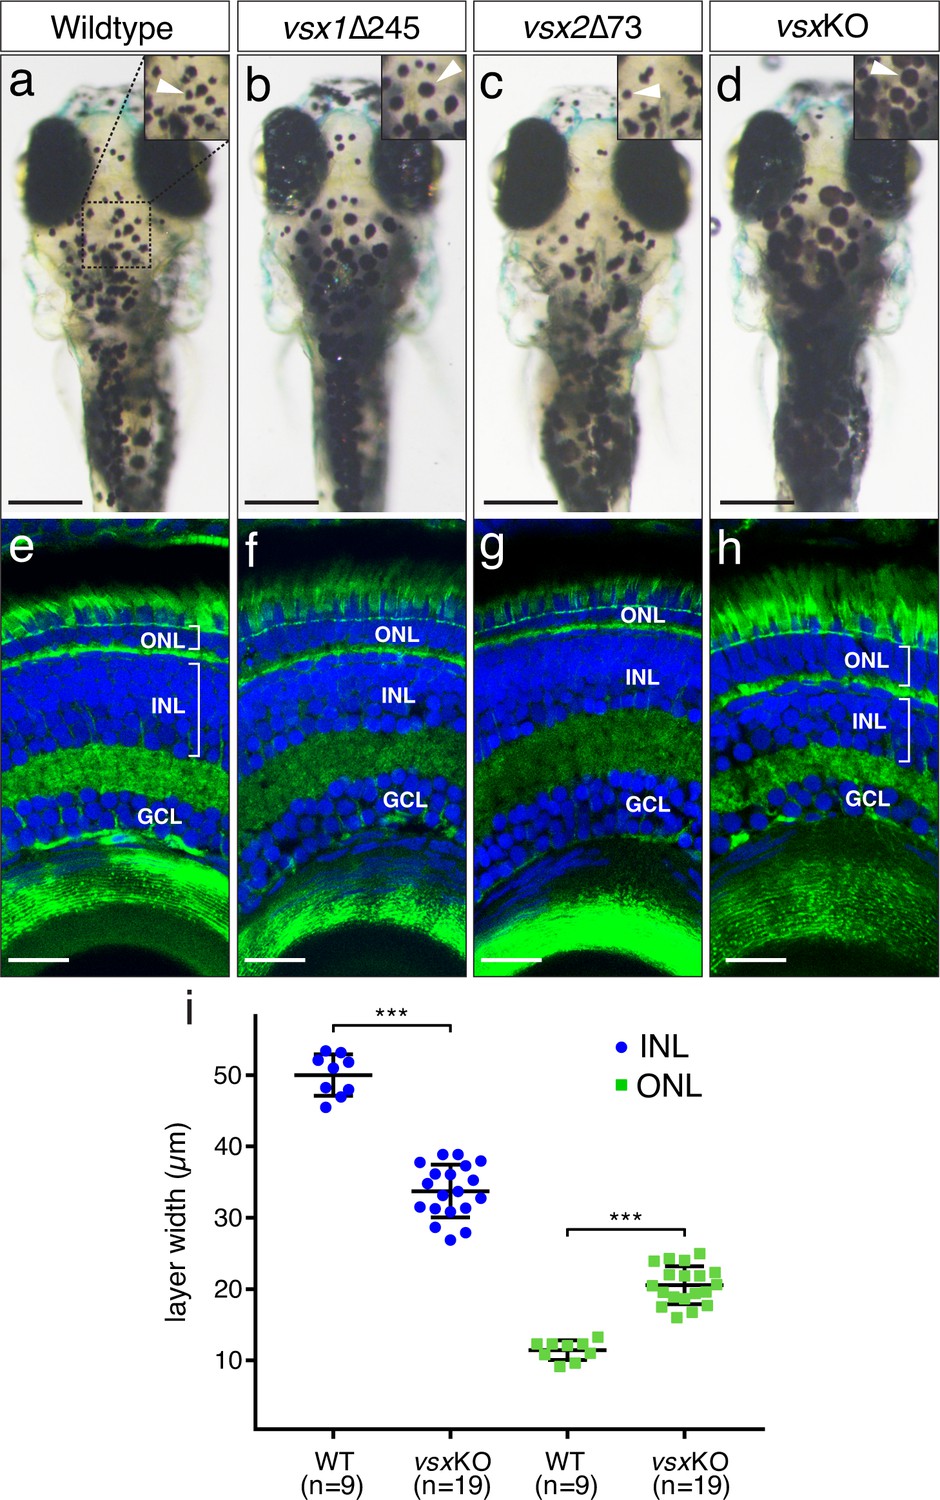
VBA and nuclear layers width are affected in vsx mutants.
(a-d). Dorsal view of wildtype (a), vsx1∆245 (b), vsx2∆73 (c), and vsxKO (d) animals at 6dpf. vsx1∆245 (b) and vsxKO (d) fish have problems sensing background light and appear darker than wildtype (a) and vsx2∆73 (c) larvae, as melanosomes are broadly distributed within melanophores (white arrowheads). (e-h). Histological sections of wildtype (e), vsx1∆245 (f), vsx2∆73 (g), and vsxKO (h) eyes at 6dpf. In the central retina of vsxKO double mutants (h), the INL width is reduced and the ONL thickness is expanded compared to wildtype (e), vsx1∆245 (f), or vsx2∆73 (g) samples. DAPI and phalloidin coupled to Alexa488 were used as nuclear and cytoskeletal (actin) markers, respectively. (i). Quantification of INL (blue circles) and ONL (green squares) width in central retinas at 6dpf using histological sections as in (e-h) panels. Significant reduction and expansion of the INL and ONL, respectively, was observed in vsxKO retinas when compared to wildtype (***p<0.0001) using an unpaired t-test. Data are shown as mean ± SD. ONL: outer nuclear layer, INL: inner nuclear layer, GCL: ganglion cell layer, µm: micrometres. Scale bar in (a-d): 500µm, scale bar in (e-h): 20µm.
Figure 2 with 1 supplement

ERG response is reduced in vsxKO larvae.
(a) Representative ERG tracks at maximum light intensity from WT (blue), vsx1∆245 (red), vsx2∆73 (green) and vsxKO double mutants (grey and yellow) at 5dpf. For vsxKO larvae, two typical recordings are shown (grey and yellow tracks). (b). Averaged ERG b-wave amplitudes from WT (blue), vsx1∆245 (red), vsx2∆73 (green) and vsxKO (yellow) larvae. No significant differences were observed between WT and vsx2∆73 samples. vsx1∆245 and vsxKO mutants produce a significant reduction of the ERG b-wave amplitude compared with both WT and vsx2∆73 larvae throughout all light intensities tested (***p<0.0001, ****p<0.00001). Data are shown as mean ± SEM. In (a) and (b), vsx1∆245 (red tracks) represents both vsx1∆245-/- and vsx1∆245-/-; vsx2∆73+/-genotypes, while vsx2∆73 (green tracks) represents both vsx2∆73-/- and vsx1∆245+/-; vsx2∆73-/- genotypes. Data were collected from five independent experiments. For statistical comparison, one way ANOVA test was used. ms: milliseconds, mV: millivolts.
Figure 2—figure supplement 1
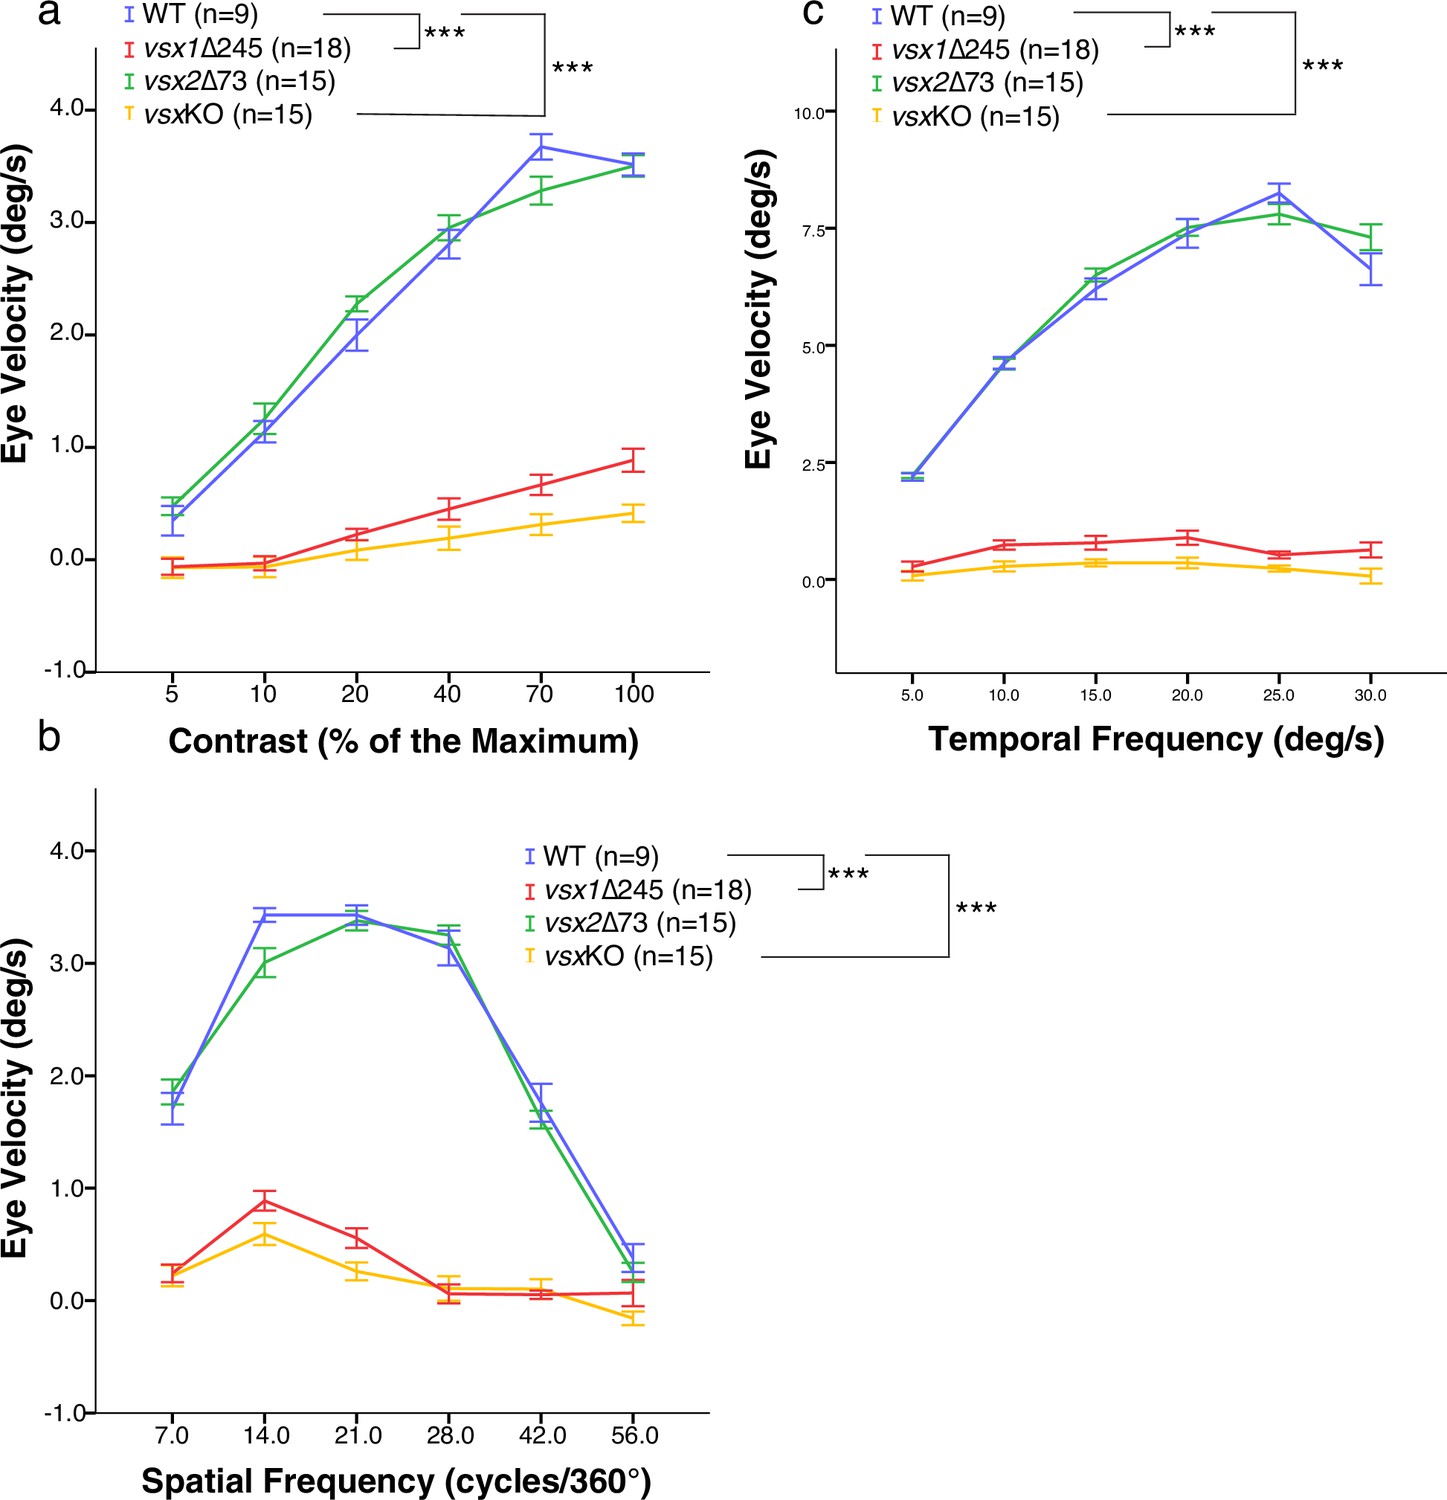
OKR measurements indicate decreased eye movement velocity in vsx mutants.
(a-c). OKR was recorded in wildtype (blue), vsx1∆245 (red), vsx2∆73 (green), and vsxKO double mutants (yellow) at 5dpf in response to different contrast (a), spatial frequency (b) and angular velocity (c). OKR is significantly reduced in vsx1∆245 and vsxKO double mutant larvae in comparison to WT siblings (***p<0.001) using a one-way ANOVA. Note that no differences in OKR were observed between WT and vsx2∆73 single mutant or between vsx1∆245 and vsxKO mutants (p>0.05). In (a-c), vsx1∆245 (red tracks) represents both vsx1∆245-/- and vsx1∆245-/-; vsx2∆73+/-genotypes, while vsx2∆73 (green tracks) represents both vsx2∆73-/- and vsx1∆245+/-; vsx2∆73-/- genotypes. In all panels, data is shown as mean ± SEM. deg: degrees, s: seconds.
Figure 3 with 1 supplement

Mitosis and apoptosis markers expression are increased in vsxKO retinas.
(a-f). Phospho-histone H3 (PH3) antibody staining reveals cell divisions in central retina cryosections from WT (a-c) and vsxKO (d-f) samples at three different developmental stages (48, 60, and 72hpf). Increased PH3 staining was observed in vsxKO retinas at 60hpf (white arrowheads in e) compared to WT samples (white arrowheads in b). (g-l). Caspase-3 (C3) antibody staining was used to evaluate cell death in central retina cryosections from WT (g-i) and vsxKO (j-l) samples at three different developmental stages (60, 72, and 96hpf). Aberrant C3 staining was observed in vsxKO retinas at 72 and 96hpf (white arrowheads in k and l) compared to WT samples (h and i). m. Quantification of PH3 positive cells in WT and vsxKO retinas at different stages. Using an unpaired t-test, a significant increase in PH3 positive cells was observed in vsxKO samples at 60hpf compared to WT (***p<0.0001) but no significant changes were observed at other stages analysed (48 and 72hpf). n. Quantification of C3 positive cells in WT and vsxKO retinas at different stages. Significant increase in C3-positive cells was observed in vsxKO samples at 72 and 96hpf compared to WT (***p<0.0001), but no change was observed at 60hpf using an unpaired t-test. Data is shown as mean ± SD. ONL: outer nuclear layer, INL: inner nuclear layer, GCL: ganglion cell layer, hpf: hours post-fertilization. Scale bar in (a-l): 50 µm.
Figure 3—figure supplement 1
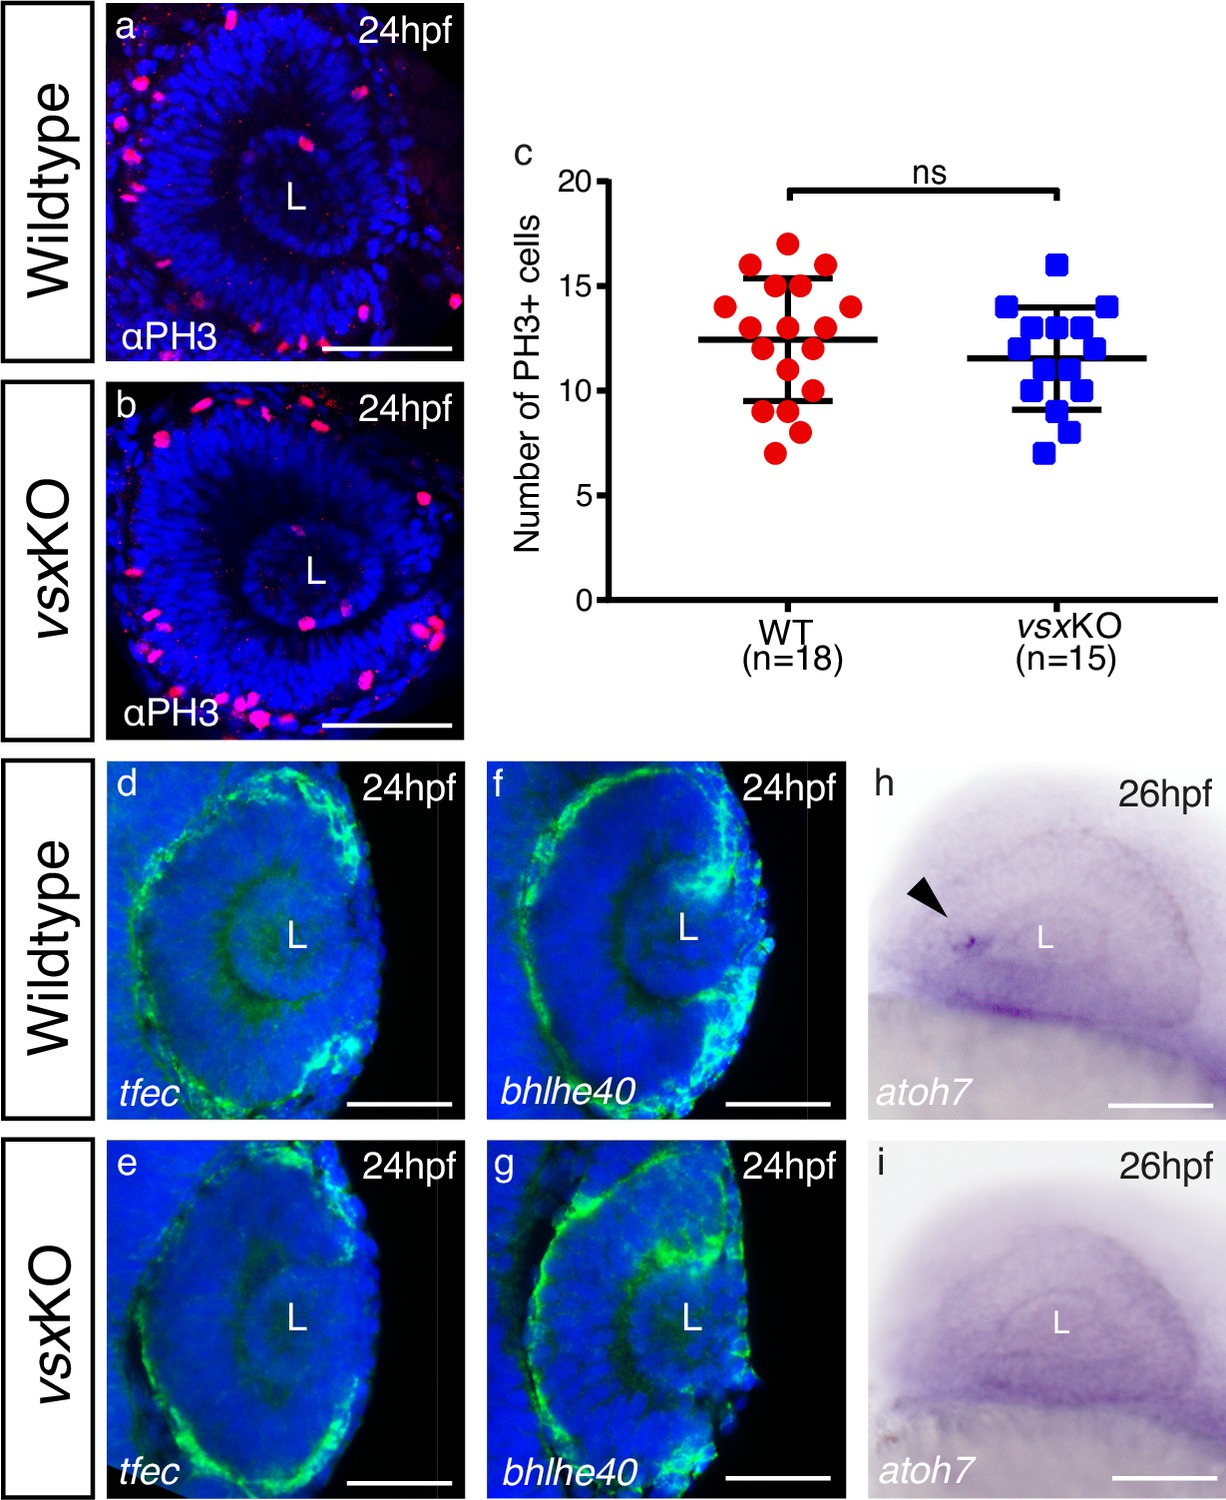
Delayed differentiation but normal RPE and proliferation in zebrafish vsxKO eyes at 24‐26hpf.
(a, b). Phospho‐histone H3 (PH3) antibody staining was used to evaluate proliferation in WT (a) and vsxKO (b) retinas at 24hpf. (c). Quantification of PH3 positive cells in WT and vsxKO retinas at 24hpf. No significant differences (p>0.05) were detected at that stage between both samples using an unpaired t-test. Data is shown as mean ± SD. (d-g). Confocal representative images of RPE markers tfec (d, e) and bhlhe40 (f, g) by fluorescent in situ hybridization at 24hpf. No major changes in the expression of both genes are detected in vsxKO embryos (e, g) compared to WT samples (d, f), n≥6. (h, i). Lateral view (anterior to the left) from 26hpf WT (h) and vsxKO (i) heads showing the expression of atoh7 gene by colorimetric in situ hybridization. The onset of atoh7 expression is delayed in mutant retinas compared to WT animals. Note an atoh7 positive cell in WT eye at that stage (black arrowhead) n≥12. L: lens, ns: not significant. Scale bar: 50µm .
Figure 4 with 3 supplements
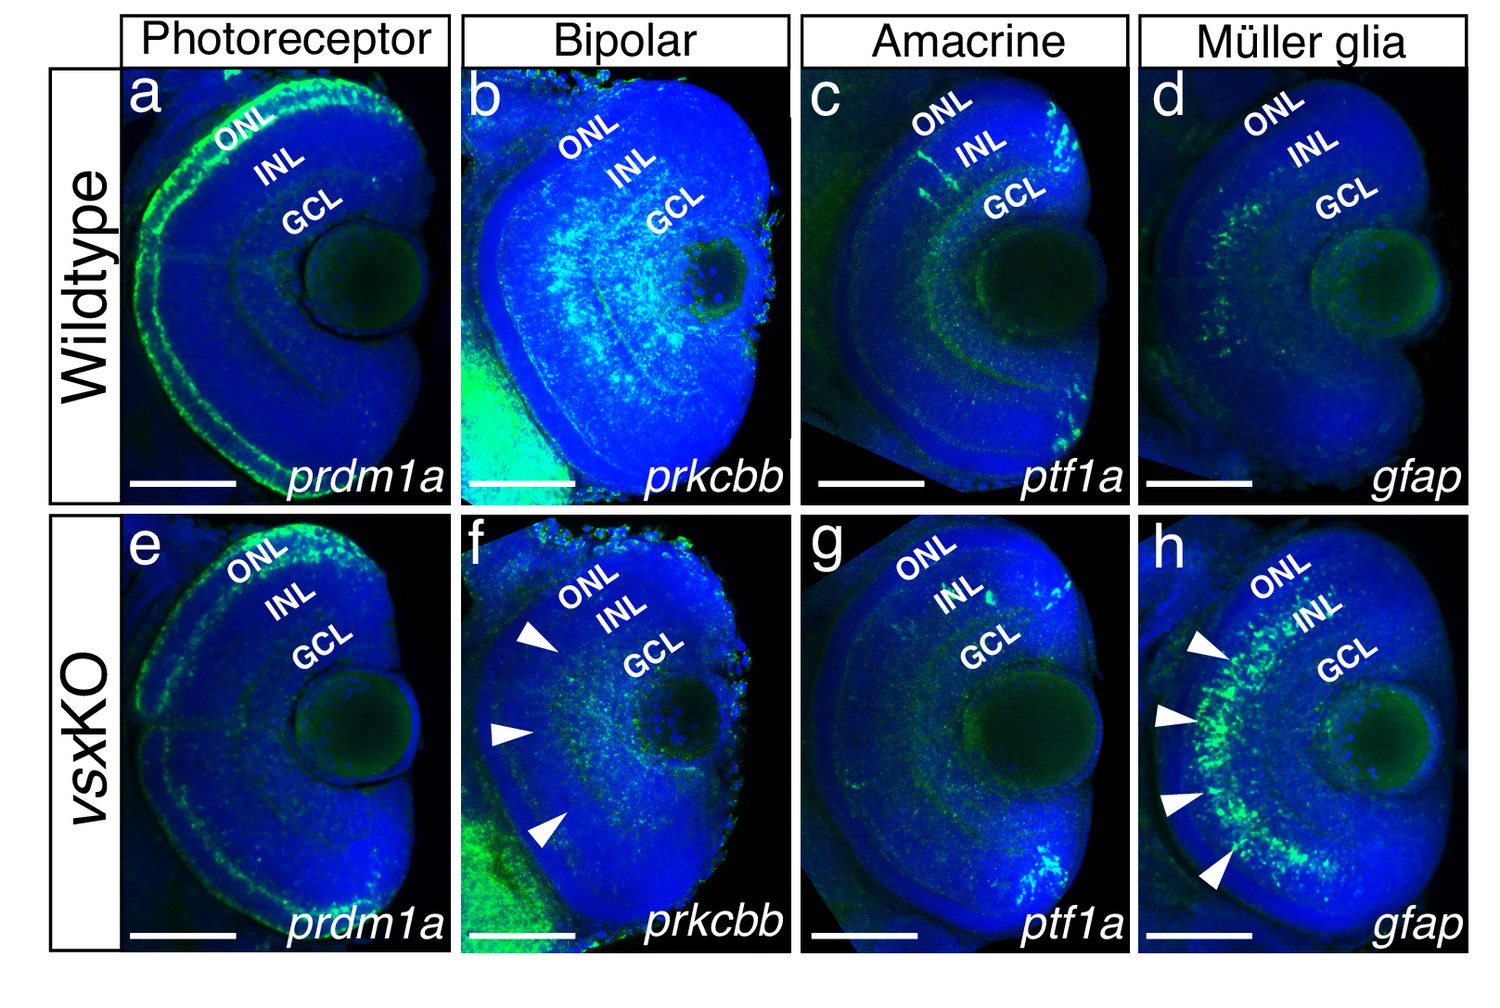
Altered expression of Bipolar and Müller glia cell markers in 3dpf vsx mutant fish.
(a-h). Confocal sections from in toto in situ hybridization experiments using specific fluorescent probes to label different cell types in wildtype and vsxKO retinas at 72hpf. No clear differences in the expression of the photoreceptor marker prdm1a were observed in ONL of wildtype (a) and mutant samples (e). Bipolar cell marker prkcbb expression (b, f) is considerably reduced in the INL of vsxKO mutant retinas (f, white arrowheads) compared to wildtype (b). Similar expression of the amacrine cell marker ptf1a is observed in the INL from wildtype (c) and vsxKO (g) retinas. Increased expression of the Müller glia cell marker gfap (d, h) is observed in the INL of vsxKO samples (h, white arrowheads) compared to wildtype (d) retinas. ONL: outer nuclear layer, INL: inner nuclear layer, GCL: ganglion cell layer. Scale bar in (a-h): 50 µm.
Figure 4—figure supplement 1
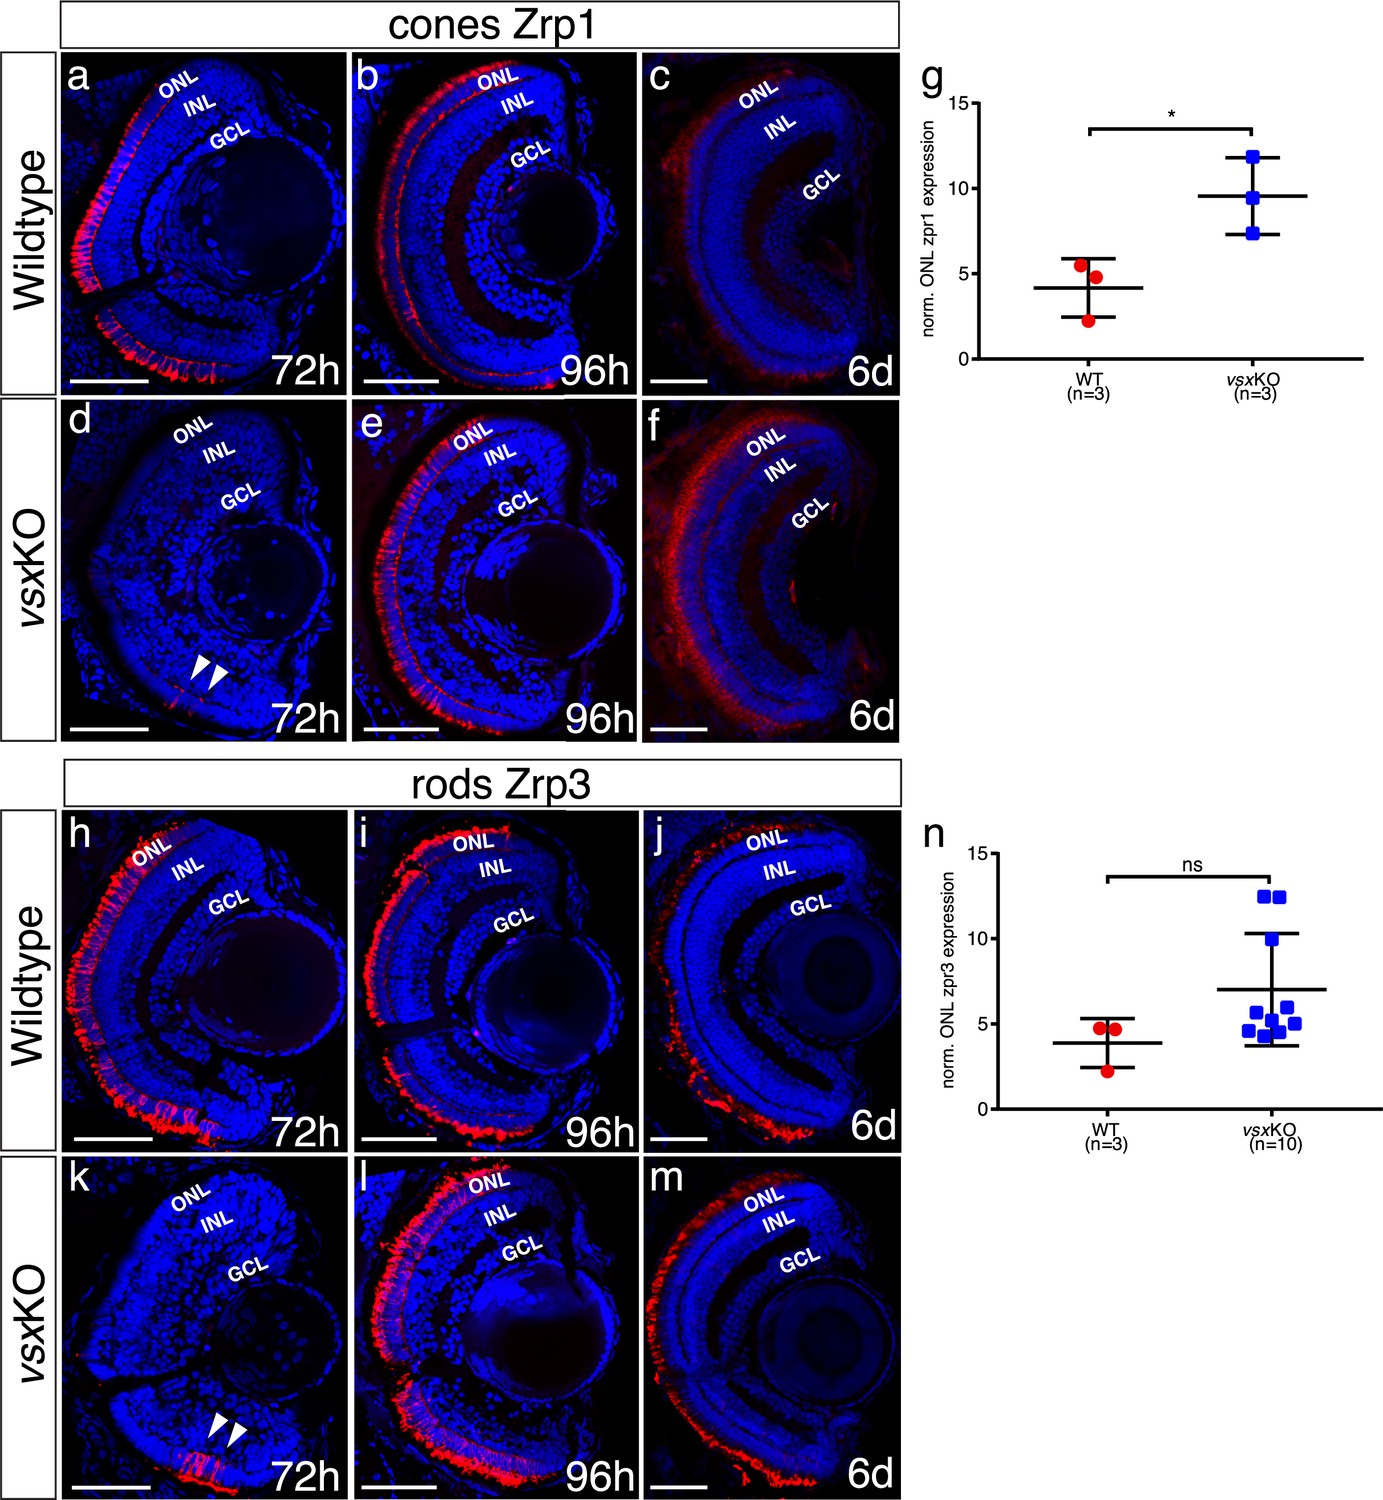
Delayed photoreceptor differentiation is observed in vsxKO retinas.
(a-f), (h-m). Cryosections of wildtype (a-c, h-j) and vsxKO retinas (d-f, k-m) stained with photoreceptor specific antibodies and DAPI as a nuclear marker. Cones and rods were visualized by using the Zpr1 (a-f) and Zpr3 (h-m) antibodies, respectively. Delayed cone and rod differentiation is observed in vsxKO mutants (d, k) compared to wildtype (a, h) samples at 72hpf (white arrowheads in d, k). At 96hpf, both markers are expressed in similar levels in wildtype (b, i) and double mutant retinas (e, l), but at 6dpf there is a significant increase of Zpr1 fluorescent intensity in vsxKO (f) compared to WT retinas (c) using an unpaired t-test (*p<0.05). No major differences were observed in rod stain intensity between WT (j) and vsxKO (m) at 6dpf (p>0.05). (g, n). Quantification of cones (g) and rods (n) label intensity between WT and vsxKO retinas were performed using Fiji software. Fluorescent measurements in the ONL were normalized by background signal from the INL. Data is shown as mean ± SD. For all conditions tested (except for c, f, j) n≥10. ONL: outer nuclear layer, INL: inner nuclear layer, GCL: ganglion cell layer, h: hours post-fertilization, d: days post-fertilization, ns: not significant.
Figure 4—figure supplement 2
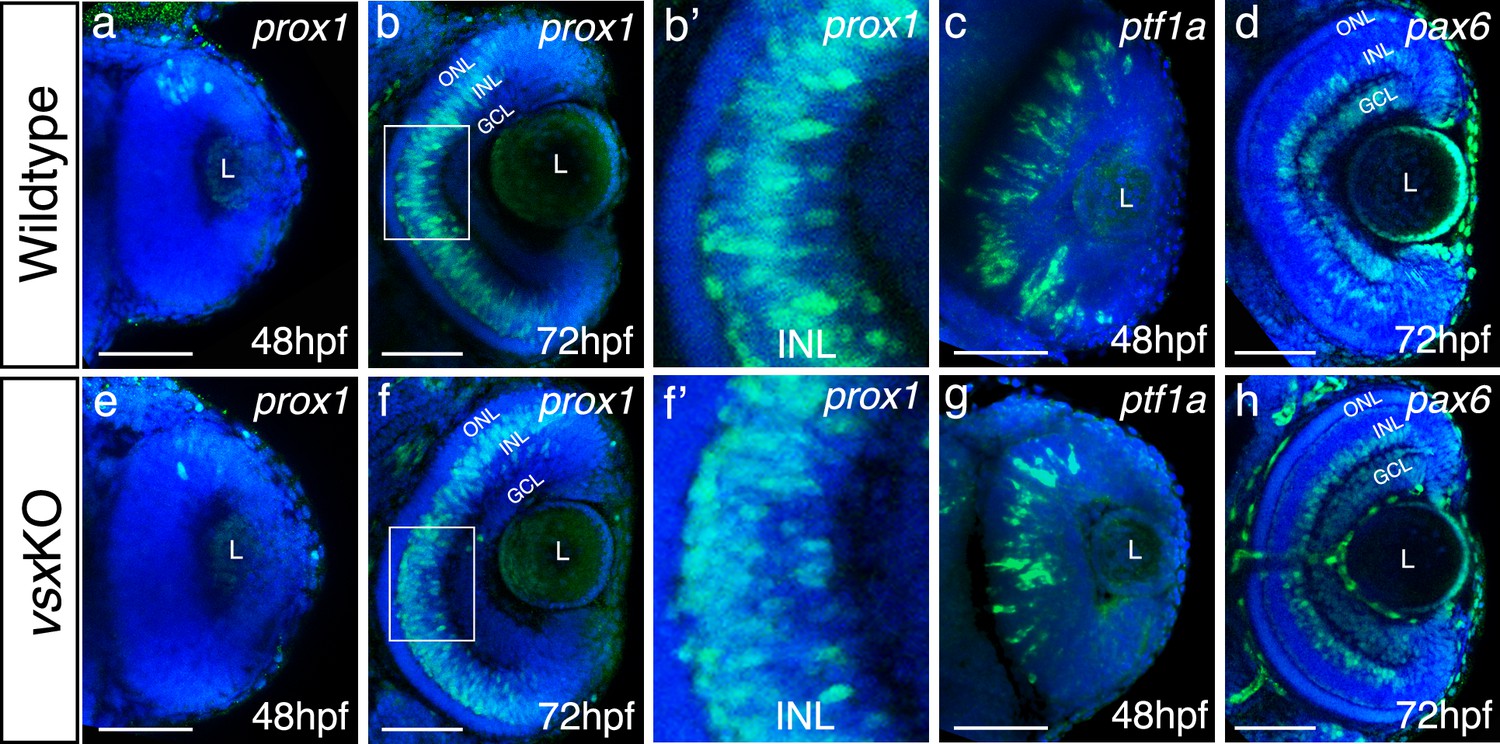
Analysis of INL markers prox1, ptf1a, and pax6 in WT and vsxKO retinas.
(a-h). Confocal representative images of genes expressed in the INL by fluorescent in situ hybridization at different stages. At 48hpf, no obvious change in the expression of prox1 was detected between WT (a) and vsxKO (e) retinas. At 72hpf, the distribution of prox1 expression in the INL is affected in vsxKO (f and inset f’) compared to WT retinas (b and inset b’). No major changes in the expression of the amacrine cell markers ptf1a (c, g) at 48hpf and pax6 (d, h) at 72hpf were observed between WT (c, d) and vsxKO samples (g, h). ONL: outer nuclear layer, INL: inner nuclear layer, GCL: ganglion cell layer, L: lens, hpf: hours post-fertilization. Scale bar:50 µm.
Figure 4—figure supplement 3
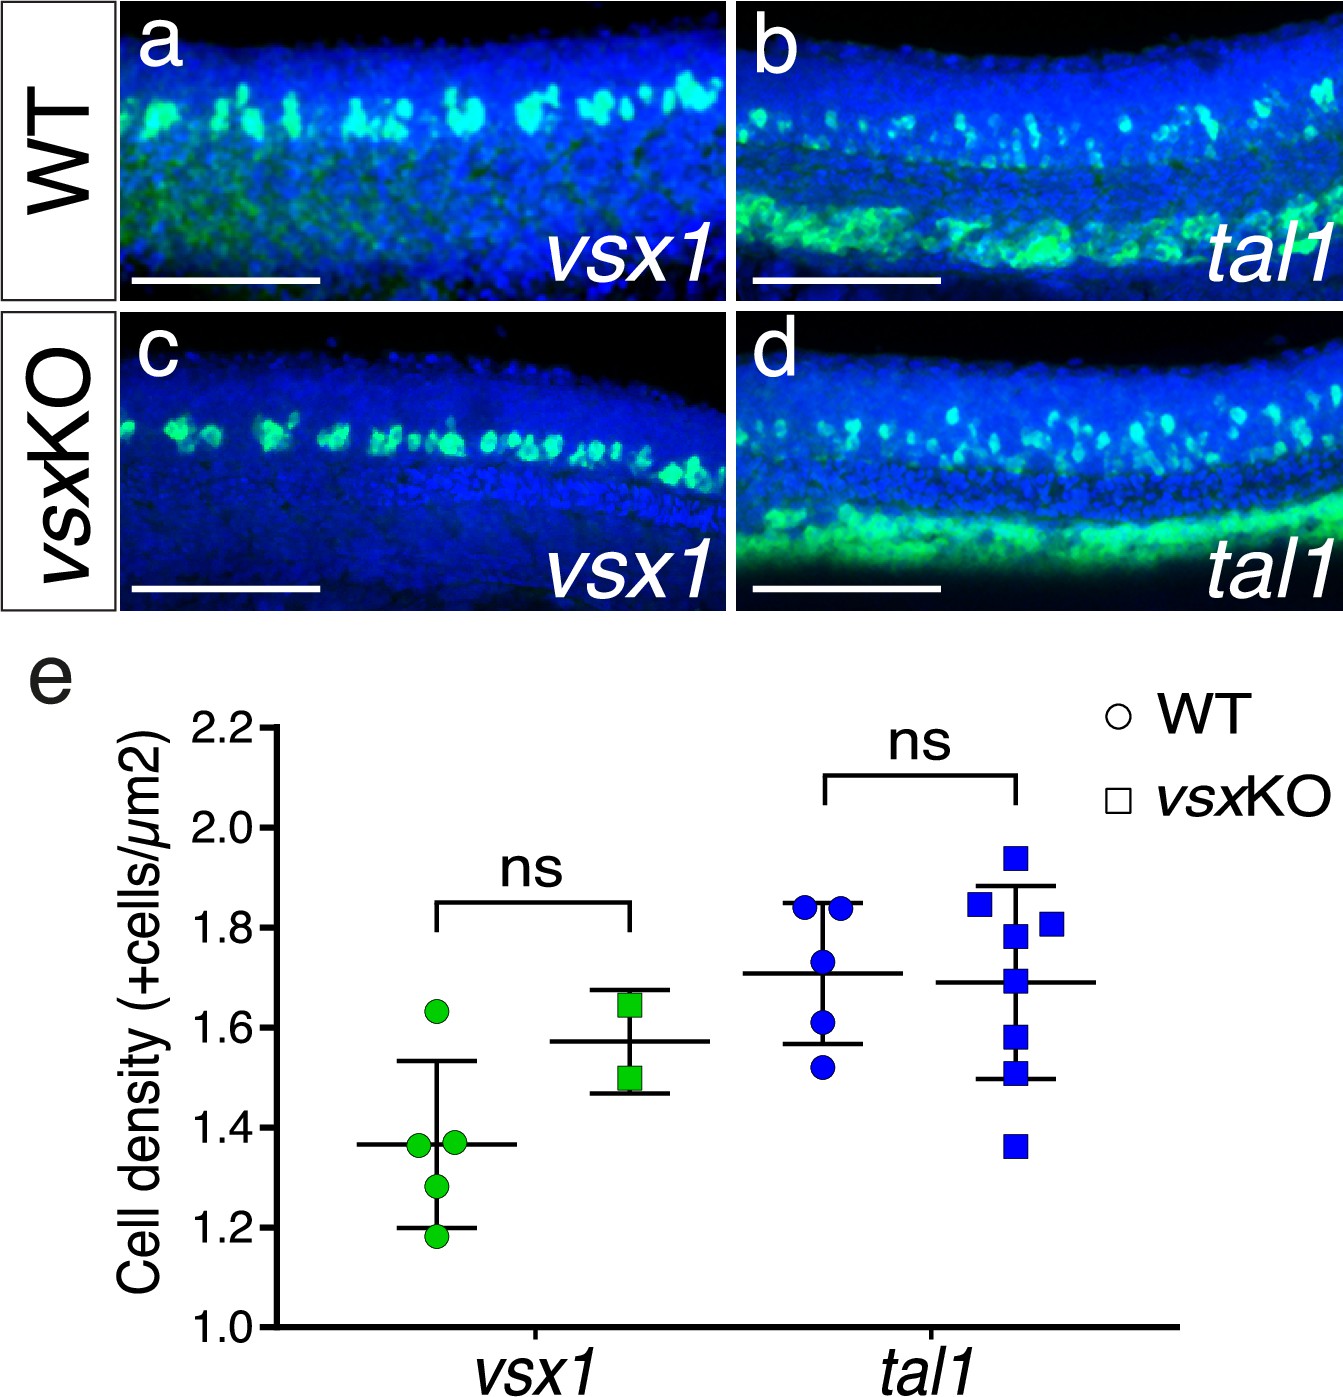
V2 spinal cord interneurons are not affected by the mutation of Vsx TFs.
(a-d). Fluorescent in situ hybridization lateral images from 24hpf wildtype (a, b) and vsxKO (c, d) mutants using vsx1 (a, c) and tal1 (b, d) probes to visualize V2a and V2b trunk interneurons, respectively. (e). The density of vsx1 (V2a) and tal1 (V2b) positive neurons was measured in wildtype (n=5 for vsx1 and n=5 for tal1) and vsxKO (n=2 for vsx1 and n=7 for tal1) mutant trunks at 24hpf. Using an unpaired t-test, no significant changes in the number of V2a and V2b neurons was observed between wildtype and vsxKO mutant animals at this stage (p>0.05). Data is shown as mean ± SD. ns: not significant. Scale bar in (a-d): 100 µm.
Figure 5 with 4 supplements
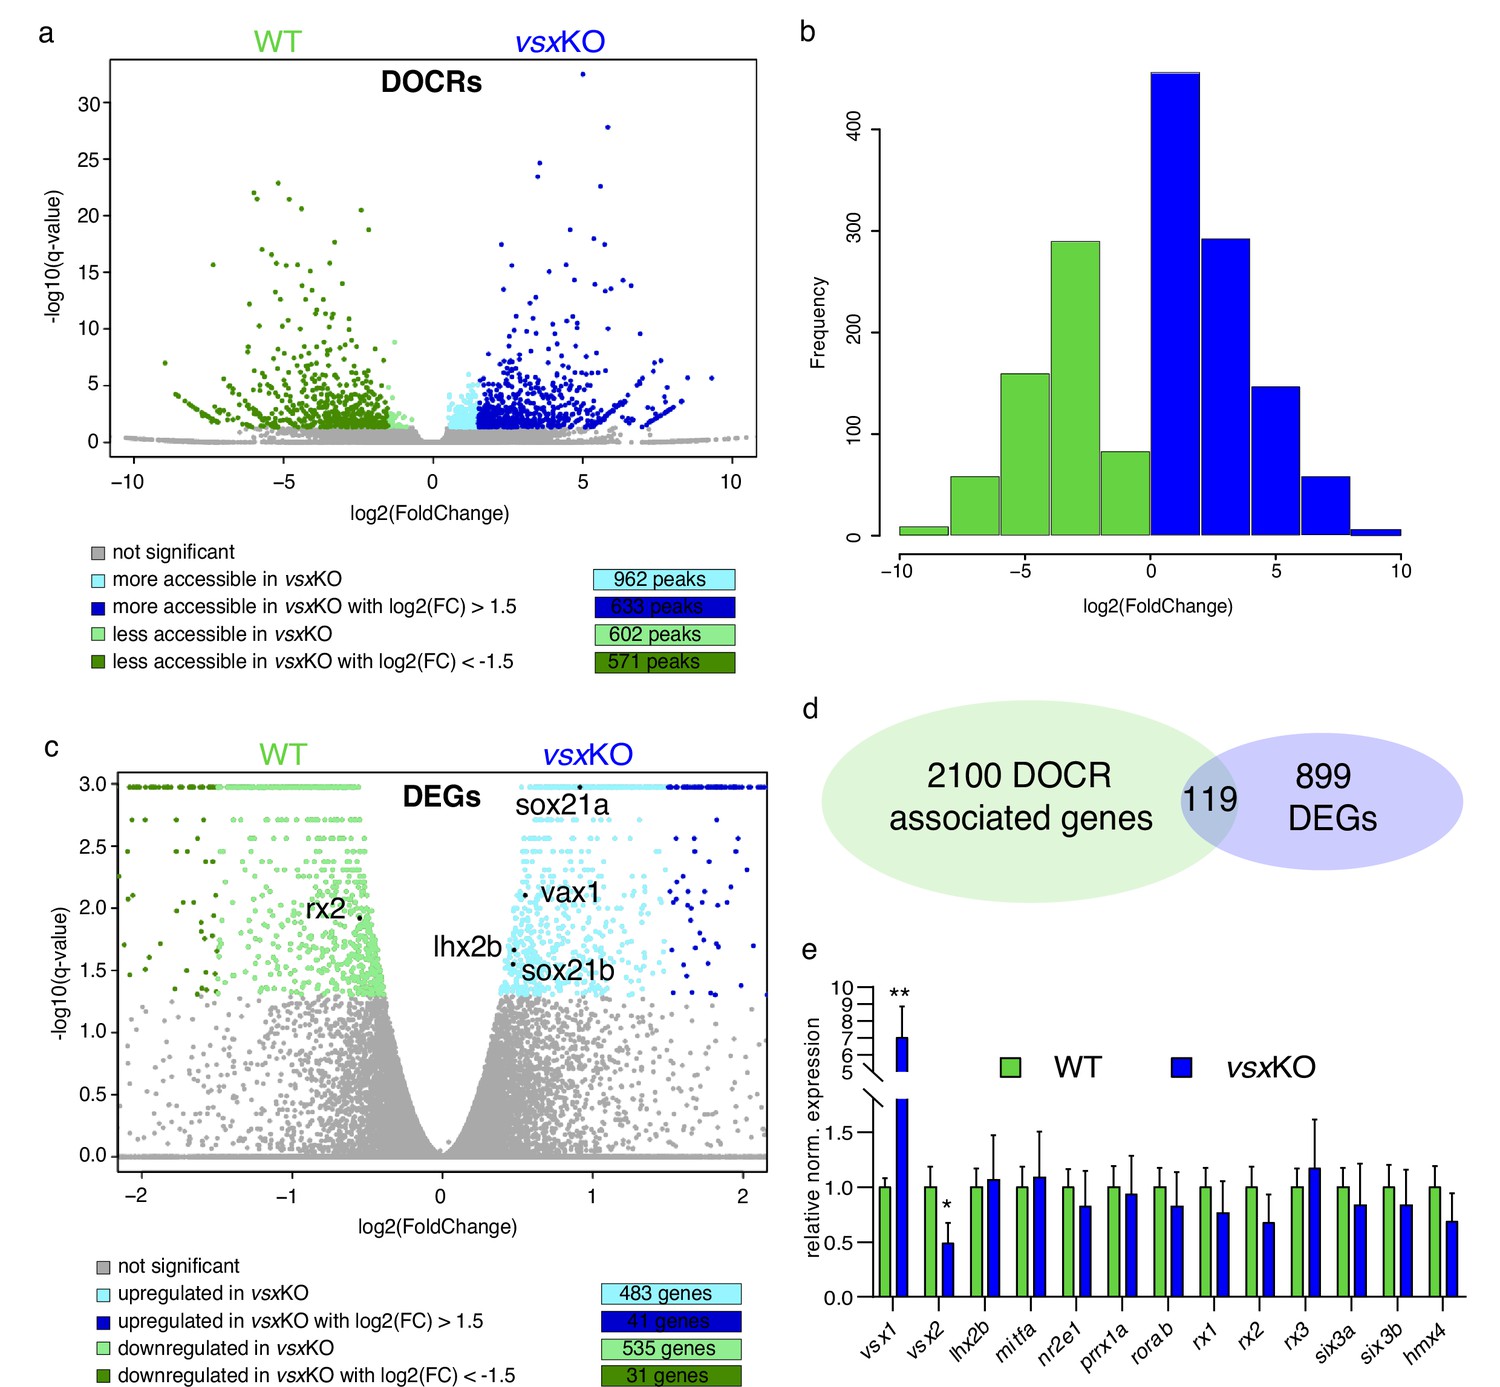
Lack of Vsx TFs in the forming retina is buffered by genetic redundancy.
(a) Volcano plots illustrating chromatin accessibility variations upon vsx1 and vsx2 mutation in zebrafish retina at 18hpf. Each dot corresponds to an ATAC-seq peak, that is an open chromatin region. Grey dots indicate not significant variations, whereas colored dots point out significant differentially open chromatin regions. (b). Frequency of DOCRs’ fold change values. (c). Transcriptome variations in vsxKO retina at 18hpf. The genes reported in the plot are the only known retinal regulators whose transcriptional levels are affected by the loss of Vsx factors, with a very modest fold change. Essentially, RNA-seq experiments did not highlight a remarkable change of the levels of the main TFs governing the retinal GRN. (d). Correspondence between genes associated with DOCRs from ATAC-seq and DEGs from RNA-seq. (e). qPCR of the main retinal TFs confirming the stability of the eye gene network expression after vsx1 and vsx2 loss (n=3). **p<0.001, *p<0.01 using one-way ANOVA. Data is shown as mean ± SD. DOCR: differentially open chromatin regions, DEG: differentially expressed genes.
-
Figure 5—source data 1
List of all ATAC-seq peaks with differential accessibility in vsxKO vs WT.
Worksheet #1. Table of contents. Worksheet #2. List of all ATAC-seq peaks upregulated in the vsxKO with adjusted p-value <0.05. Genes associated with the peak are reported in the last column. Worksheet #3. List of all ATAC-seq peaks downregulated in the vsxKO with adjusted <i>P-value <0.05. Genes associated with the peak are reported in the last column.
- https://cdn.elifesciences.org/articles/85594/elife-85594-fig5-data1-v1.xlsx
-
Figure 5—source data 2
Analysis of gene ontology terms for genes neighboring differentially opened regions in vsxKO.
Worksheet #1. Table of contents. Worksheet #2. Gene ontology terms enriched using as input the list of genes associated with differentially open chromatin region from ATAC-seq.
- https://cdn.elifesciences.org/articles/85594/elife-85594-fig5-data2-v1.xlsx
-
Figure 5—source data 3
List of differentially expressed genes between WT and vsxKO embryos and cross-listing between DEGs and DOCRs from WT and vsxKO.
Worksheet #1. Table of contents. Worksheet #2. List of differentially expressed genes (DEGs) with q-value <0.05 between WT and vsxKO embryos Worksheet #3. Cross-list between DEGs from worksheet #2 and differentially open chromatin regions (DOCRs) more accessible in the vsxKO. Every DEG may be associated with more than one DOCR (column M). Worksheet #4. Cross-list between DEGs from worksheet #2 and differentially open chromatin regions (DOCRs) less accessible in the vsxKO. Every DEG may be associated with more than one DOCR (column M).
- https://cdn.elifesciences.org/articles/85594/elife-85594-fig5-data3-v1.xlsx
-
Figure 5—source data 4
List of differentially expressed genes between WT vs vsx2MO and between vsxKO vs vsx2MO.
Worksheet #1. Table of contents. Worksheet #2. List of differentially expressed genes (DEGs) with q-value <0.05 between WT (uninjected) and vsx2-morpholino-injected embryos. Worksheet #3. List of differentially expressed genes (DEGs) with q-value <0.05 between vsx2-morpholino-injected and vsxKO embryos.
- https://cdn.elifesciences.org/articles/85594/elife-85594-fig5-data4-v1.xlsx
Figure 5—figure supplement 1
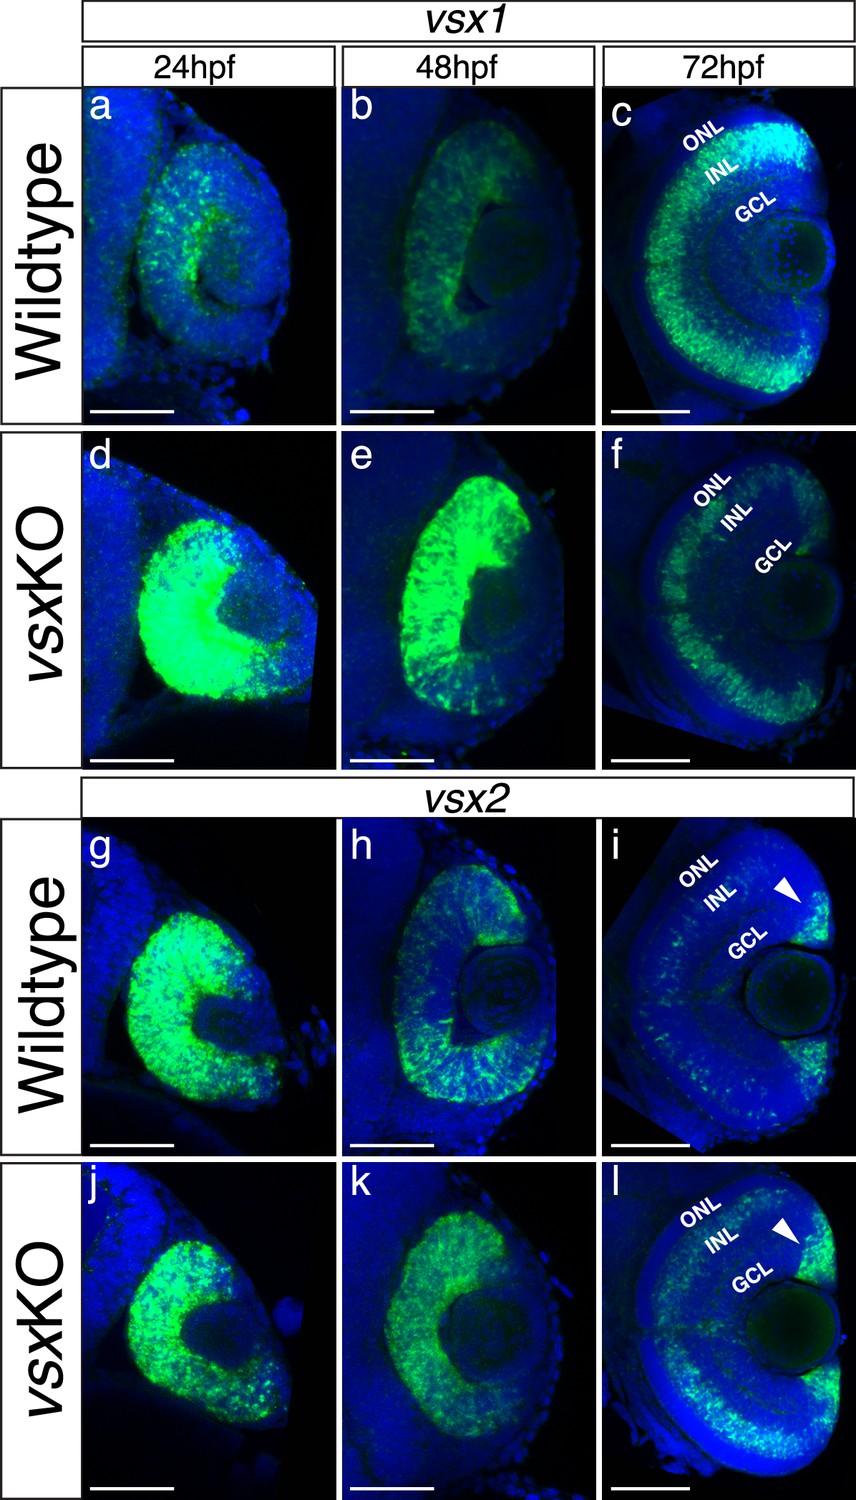
The expression pattern of vsx mutant transcripts is misregulated in vsxKO animals during retina development.
(a-l). Fluorescent in situ hybridization for vsx1 (a-f) and vsx2 (g-l) genes over retina formation in wildtype (a-c, g-i) and vsxKO (d-f) animals (j-l). In wildtype samples, vsx2 is strongly expressed than vsx1 in retinal precursors at earlier developmental stages (a, g) and the opposite effect is observed in INL bipolar cells at later stages (c, i). We found an overexpression of vsx1 at 24hpf (b) and 48hpf (e) and a reduction in the INL expression at 72hpf (c, f) in vsx mutant retinas compared to wildtype. For vsx2, no major differences between wildtype and mutant retinas were detected at 24hpf (g, j), but at 48 and 72hpf we found an increment of vsx2 in the retina and INL, respectively (h, k, i, l). Also, at 72hpf, there is a stronger expression of vsx2 in the ciliary marginal zone (CMZ) compared to WT. hpf: hours post fertilization, ONL: outer nuclear layer, INL: inner nuclear layer, GCL: ganglion cell layer. Scale bar in (a-l): 50 µm.
Figure 5—figure supplement 2
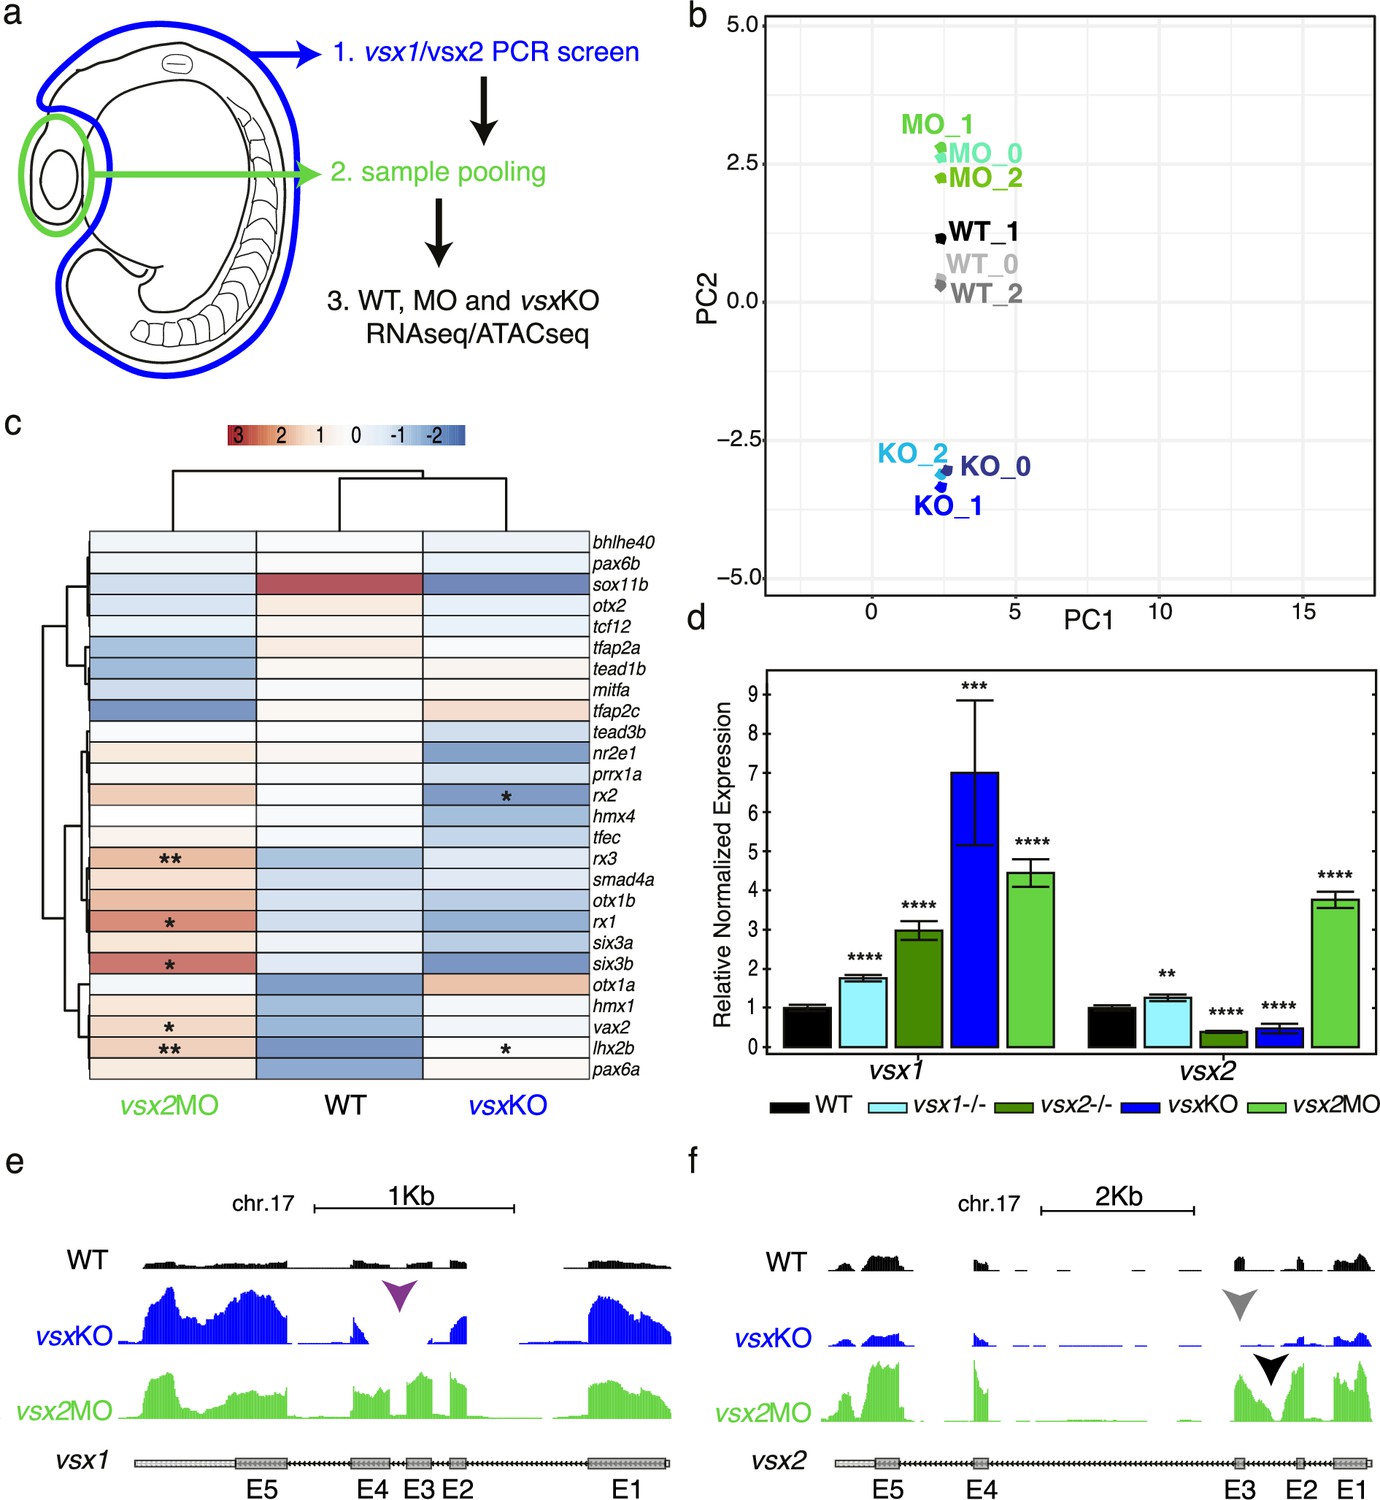
Transcriptomic divergence between vsxKO and vsx2 morphant samples.
(a) Experimental design. Zebrafish heads including both eyes were mechanically dissected at 18hpf from WT, vsxKO and vsx2MO samples. The trunk and tail (highlighted in blue) were used to extract DNA and genotyping of WT and vsxKO embryos. After genotyping, samples from individual embryos previously dissected were pooled and used for ATAC-seq and/or RNA-seq protocols. (b). RNA-seq PCA evaluation revealing the transcriptomic divergence between WT (black/grey), vsxKO (blue) and vsx2MO (green) samples. (c). Heatmap chart showing gene expression differences between WT, vsxKO and vsx2MO samples of the main retinal transcriptional regulators (*p<0.05; p**<0.01). (d). vsx1 and vsx2 expression levels analysed by real time PCR (n=3) in WT, vsx1∆245, vsx2∆73, vsxKO, and vsx2MO samples. All statistical comparisons are relative to the WT animals using one-way ANOVA (**p<0.01; ***p<0.001; ****p<0.0001; no label = no significant differences). Data is shown as mean ± SD. (e). Graphical visualization of RNA-seq tracks showing vsx1 gene expression in WT, vsxKO, and vsx2MO eyes. In vsxKO samples (blue track), the deletion generated by CRISPR/Cas9 is noticeable due to the lack of reads in part of the third and fourth exons (purple arrowhead). (f). RNA-seq tracks showing vsx2 expression in WT, vsxKO, and vsx2MO samples. In vsxKO samples (blue track), the deletion is evident by the lack of reads in the third exon (grey arrowhead). In vsx2 morphants (green track), a retention of the second intron due to the action of the morpholino can be appreciated.
Figure 5—figure supplement 3
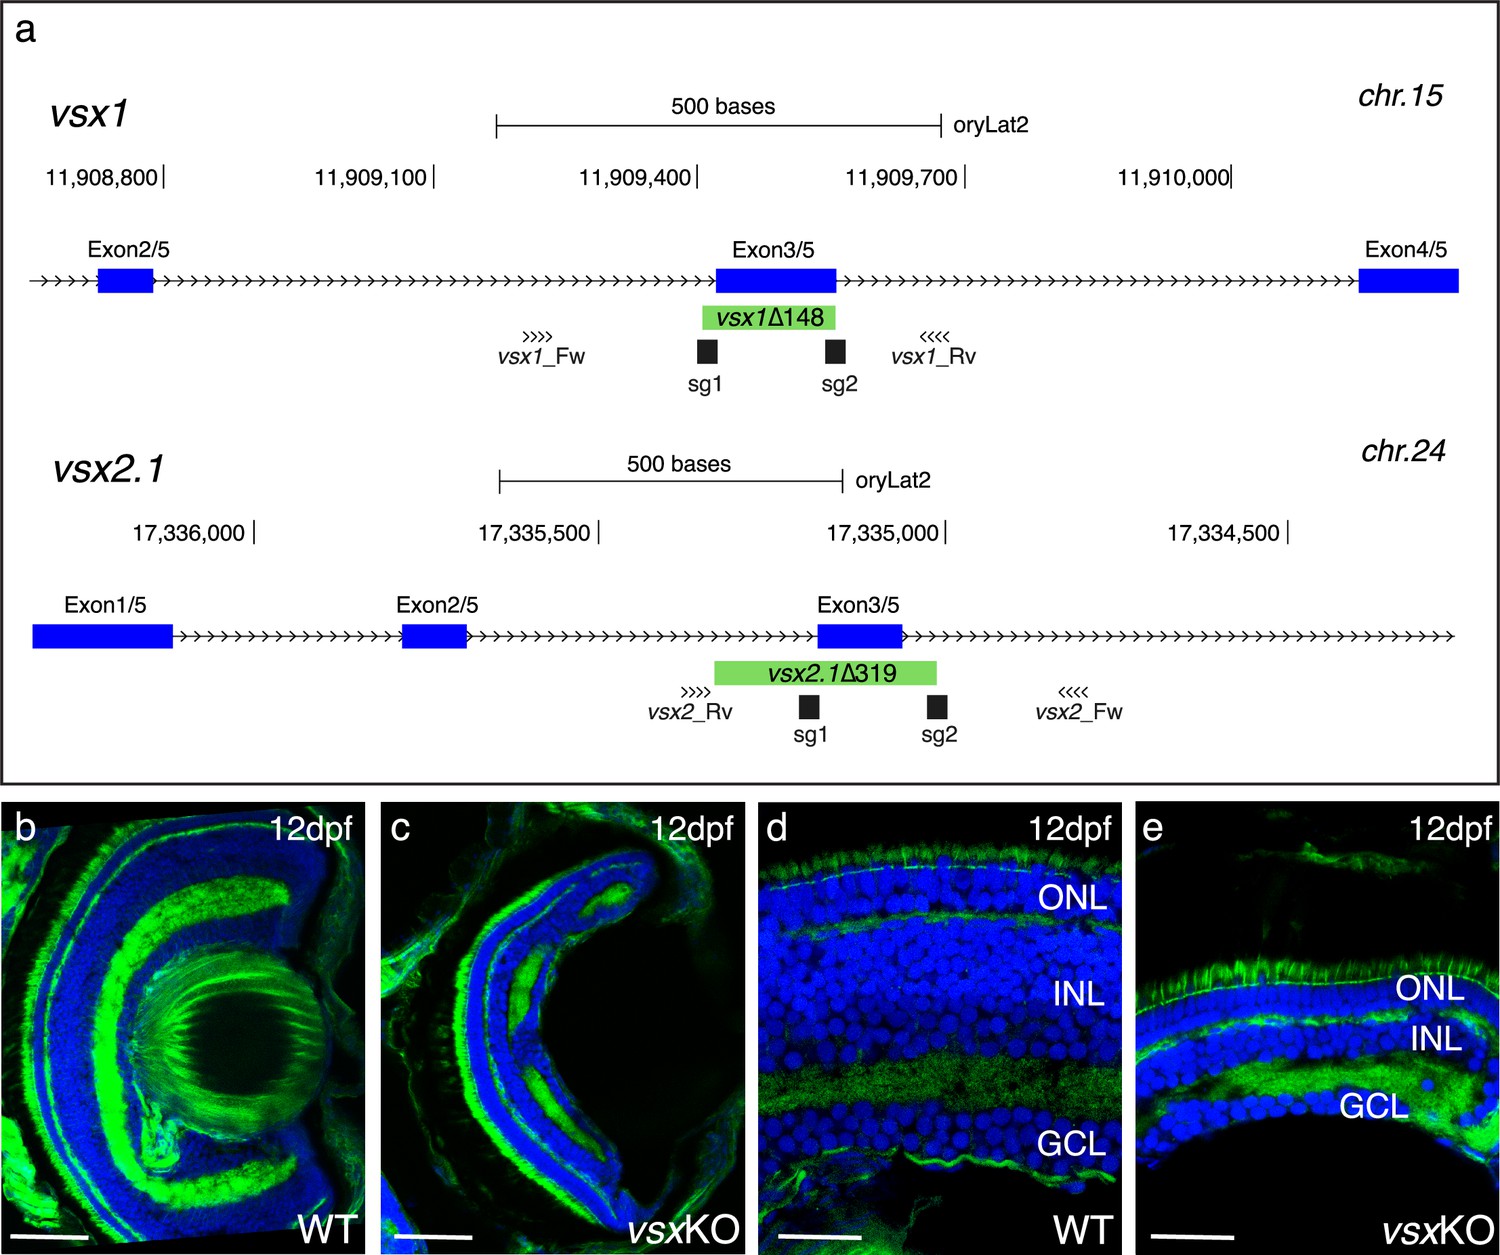
Mutation of vsx genes in medaka impairs INL differentiation and eye growth.
(a) CRISPR/Cas9 was used to eliminate (green box) the DBD from vsx1 (top) and vsx2.1 (bottom) TFs in medaka. Blue boxes represent exons, black boxes the location of sgRNAs used and primers for screening are depicted as opposing arrowheads. (b-e). Histological sections from WT (b, d, n=4) and vsxKO central retinas (c, e, n=5) at 12dpf. ONL: outer nuclear layer, INL: inner nuclear layer, GCL: ganglion cell layer, hpf: hours post-fertilization, dpf: days post-fertilization. Scale bar (b-c): 50 µm, (d-e): 20 µm.
Figure 5—figure supplement 4
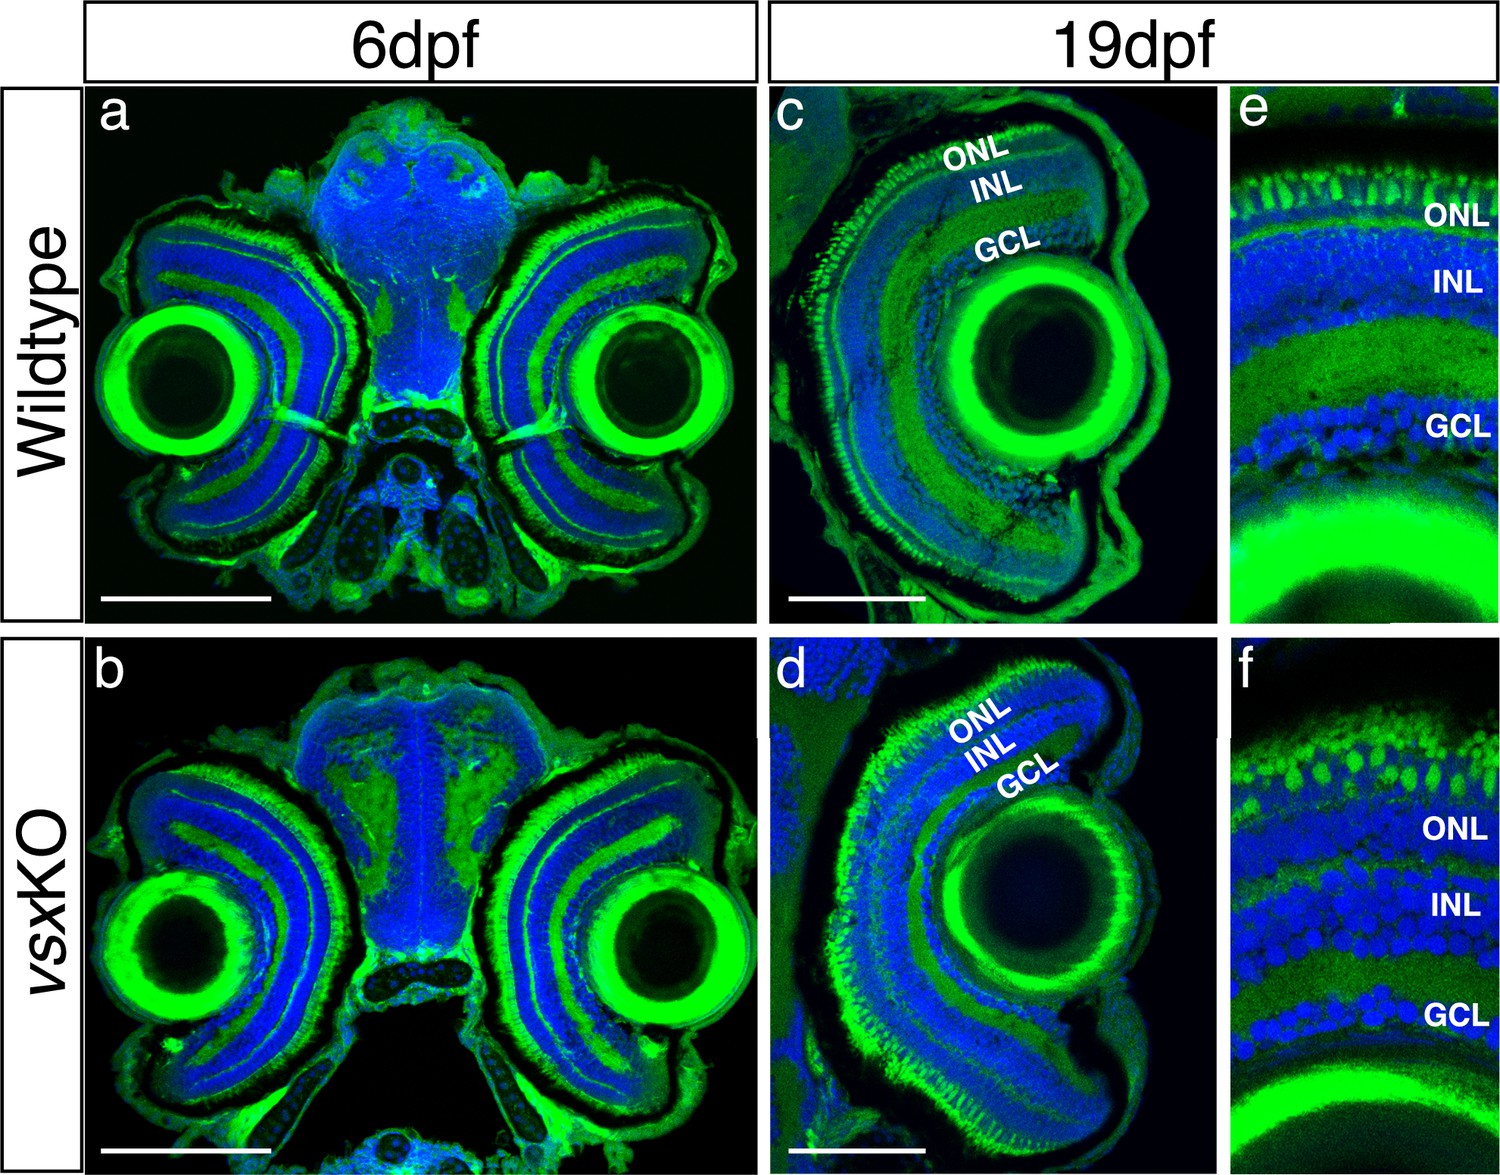
Normal eye size in vsxKO animals is observed at juvenile stages.
(a-f). Visual system histological sections stained with nuclear marker DAPI and phalloidin-Alexa488 for actin filaments from wildtype (a, c and e, n=5 for both stages) and vsxKO (b, d and f) animals at 6dpf (a, b, n=8), and 19hpf (c, e, d and f, n=6). No changes in eye size are observed but lamination in vsx mutants is severely affected at later stages compared to siblings (e, f). dpf: days post fertilization, ONL: outer nuclear layer, INL: inner nuclear layer, GCL: ganglion cell layer. Scale bar (a-d): 100 µm.
Author response image 1
Videos
Video 1
vsxKO larvae show normal GCL retinotectal projections.
(a, b). 3-D reconstructions of confocal stacks from zebrafish larval eyes injected with either DiO (green) or DiI (red) to label retinal ganglion cells and their projections to the optic tectum in wildtype (a, n=6) and vsxKO (b, n=8) at 6dpf. Note that vsxKO larvae show apparently normal retinotectal projections.
Tables
Table 1
Nucleotide sequence of oligos used in this work.
Organism, gene of interest, application and nucleotide sequence is described in each column. Note that the target site is bolded in CRISPR/Cas9 primers used for vsx disruption.
| Organism | Gene | Application | Oligo sequence (5’–3’) |
|---|---|---|---|
| Danio rerio | vsx1 | CRISPR/Cas9 | TAATACGACTCACTATAGGGTTCCTCAAGTTGATGGGGTTTTAGAGCTAGAA |
| Danio rerio | vsx1 | CRISPR/Cas9 | TAATACGACTCACTATAGGTTTACGCGAGAGAAATGCGTTTTAGAGCTAGAA |
| Danio rerio | vsx2 | CRISPR/Cas9 | TAATACGACTCACTATAGGTGCCGGAGGACAGAATACGTTTTAGAGCTAGAA |
| Danio rerio | vsx2 | CRISPR/Cas9 | TAATACGACTCACTATAGGTGGAGAAAGCTTTTAACGGTTTTAGAGCTAGAA |
| Danio rerio | vsx1 | Genotyping Fw | ATGACTGCCTTTCCGGTGAT |
| Danio rerio | vsx1 | Genotyping Rv | CTGCTGGCTCACCTAGAAGC |
| Danio rerio | vsx2 | Genotyping Fw | TCGTAATCTTTCCACTGATTCTGAT |
| Danio rerio | vsx2 | Genotyping Rv | TGTTCTAGAGCATATTGTCTGTTCC |
| Danio rerio | vsx1 | Cloning Fw | CGGGAAGAGAAGAAGCTACAGAT |
| Danio rerio | vsx1 | Cloning Rv | GCCTTCTCTTTTTCCTCTTTTGA |
| Danio rerio | vsx2 | Cloning Fw | CTGTTTTGTCGGAAAGTTTGAA |
| Danio rerio | vsx2 | Cloning Rv | CCAGCTGGTAAGATGTAAATATTGTT |
| Danio rerio | ptf1a | Cloning Fw | GGCTTAGACTCTTTCTCCTCCTC |
| Danio rerio | ptf1a | Cloning Rv | CGTAGTCTGGGTCATTTGGAGAT |
| Danio rerio | gfap | Cloning Fw | GTTCCTTCTCATCCTACCGAAAG |
| Danio rerio | gfap | Cloning Rv | GATCAGCAAACTTTGAGCGATAC |
| Danio rerio | pkcb1 | Cloning Fw | GCGCAGTAAGCACAAGTTCAAGG |
| Danio rerio | pkcb1 | Cloning Rv | CCCAGCCAGCATCTCATATAGC |
| Danio rerio | prdm1a | Cloning Fw | TCAAAACGGCATGAACATCTATT |
| Danio rerio | prdm1a | Cloning Rv | AGGGGTTTGTCTTTCAGAGAAGT |
| Danio rerio | tal1 | Cloning Fw | AGTATGATTTGCTCATCCTCCAA |
| Danio rerio | tal1 | Cloning Rv | TTTGTTTGTTTGCGCATTTAATA |
| Danio rerio | tfec | Cloning Fw | TATAAAGACCGGACGGGGACAAC |
| Danio rerio | tfec | Cloning Rv | CAGCTCCTGGATTCGTAGCTGGA |
| Danio rerio | bhlhe40 | Cloning Fw | TTGCAAATCGGCGAACAGGG |
| Danio rerio | bhlhe40 | Cloning Rv | GGAAACGTGCACGCAGTCG |
| Danio rerio | eef1a1l1 | qPCR Fw | TCCACCGGTCACCTGATCTAC |
| Danio rerio | eef1a1l1 | qPCR Rv | CAACACCCAGGCGTACTTGA |
| Danio rerio | vsx1 | qPCR Fw | TCTAGGTGAGCCAGCAGGAAT |
| Danio rerio | vsx1 | qPCR Rv | CCATGTCGTGTCGCTGTCTT |
| Danio rerio | vsx2 | qPCR Fw | GGGATTAATTGGGCCTGGAGG |
| Danio rerio | vsx2 | qPCR Rv | GCTGGCAGACTGGTTATGTTCC |
| Danio rerio | six3a | qPCR Fw | AAAAACAGGCTCCAGCATCAA |
| Danio rerio | six3a | qPCR Rv | AAGAATTGACGTGCCCGTGT |
| Danio rerio | six3b | qPCR Fw | TCCCCGTCGTTTTGTCTCTG |
| Danio rerio | six3b | qPCR Rv | AGAAGTTTAGGGTGGGCAGC |
| Danio rerio | lhx2b | qPCR Fw | AGGCAAGATTTCGGATCGCT |
| Danio rerio | lhx2b | qPCR Rv | TCTCTGCACCGAAAACCTGTA |
| Danio rerio | mitfa | qPCR Fw | CTGATGGCTTTCCAGTAGCAGA |
| Danio rerio | mitfa | qPCR Rv | GCTTTCAGGATGGTGCCTTT |
| Danio rerio | nr2e1 | qPCR Fw | CAAATCTGGCACACAGGGCG |
| Danio rerio | nr2e1 | qPCR Rv | CGACGAACCGTTCACCTCTT |
| Danio rerio | prrx1a | qPCR Fw | CTCACCGTCATACAGTGCCA |
| Danio rerio | prrx1a | qPCR Rv | AGAGTCTTTGACAGCCCAGC |
| Danio rerio | rorab | qPCR Fw | ACAAACCAGCACCAGTTCGG |
| Danio rerio | rorab | qPCR Rv | CCTCCTGAAGAAACCCTTGCAT |
| Danio rerio | rx1 | qPCR Fw | AAGAACTTGCATCGGACGGT |
| Danio rerio | rx1 | qPCR Rv | TCGGAAGCTTGCATCCAGTT |
| Danio rerio | rx2 | qPCR Fw | TCGGGACGCATAAAGTGGAC |
| Danio rerio | rx2 | qPCR Rv | CGGGTCTCCCAAATCTGCAT |
| Danio rerio | rx3 | qPCR Fw | CCGAGTACAGGTGTGGTTCC |
| Danio rerio | rx3 | qPCR Rv | GTCAACCAGGGCTCTAACGG |
| Danio rerio | hmx4 | qPCR Fw | TGTCGACCCGCTTCTTTGAA |
| Danio rerio | hmx4 | qPCR Rv | TGATGAAGACAGCCATCCCG |
| Oryzias latipes | vsx1 | CRISPR/Cas9 | TAATACGACTCACTATAGGCAGAGTGAGGTTCAGTGGGTTTTAGAGCTAGAA |
| Oryzias latipes | vsx1 | CRISPR/Cas9 | TAATACGACTCACTATAGGTAGGGCCTGACCTGGATTGTTTTAGAGCTAGAA |
| Oryzias latipes | vsx2.1 | CRISPR/Cas9 | TAATACGACTCACTATAGGGGATGATGAGAGTCAAGGGTTTTAGAGCTAGAA |
| Oryzias latipes | vsx2.1 | CRISPR/Cas9 | TAATACGACTCACTATAGGAAAAAATAACAGAATTGAGTTTTAGAGCTAGAA |
| Oryzias latipes | vsx1 | Genotyping Fw | AACAATAATTTAAAATGCGGAAAAA |
| Oryzias latipes | vsx1 | Genotyping Rv | GAAACTAAAATCCCATTCAGTGCT |
| Oryzias latipes | vsx2.1 | Genotyping Fw | ATATCACGGGAAATTAAAATGCTC |
| Oryzias latipes | vsx2.1 | Genotyping Rv | AAGTCAAATGTGCCATTGTTAGTC |
Additional files
Download links
A two-part list of links to download the article, or parts of the article, in various formats.
Downloads (link to download the article as PDF)
Open citations (links to open the citations from this article in various online reference manager services)
Cite this article (links to download the citations from this article in formats compatible with various reference manager tools)
Mutation of vsx genes in zebrafish highlights the robustness of the retinal specification network
eLife 12:e85594.
https://doi.org/10.7554/eLife.85594


