FAM76B regulates NF-κB-mediated inflammatory pathway by influencing the translocation of hnRNPA2B1
- Laboratory of Gene Therapy, Department of Biochemistry, College of Life Sciences, Shaanxi Normal University, China
- Translational Medicine Center, Northwest Women’s and Children’s Hospital, China
- Department of Pathology, University of Utah, United States
Figures
Figure 1 with 1 supplement
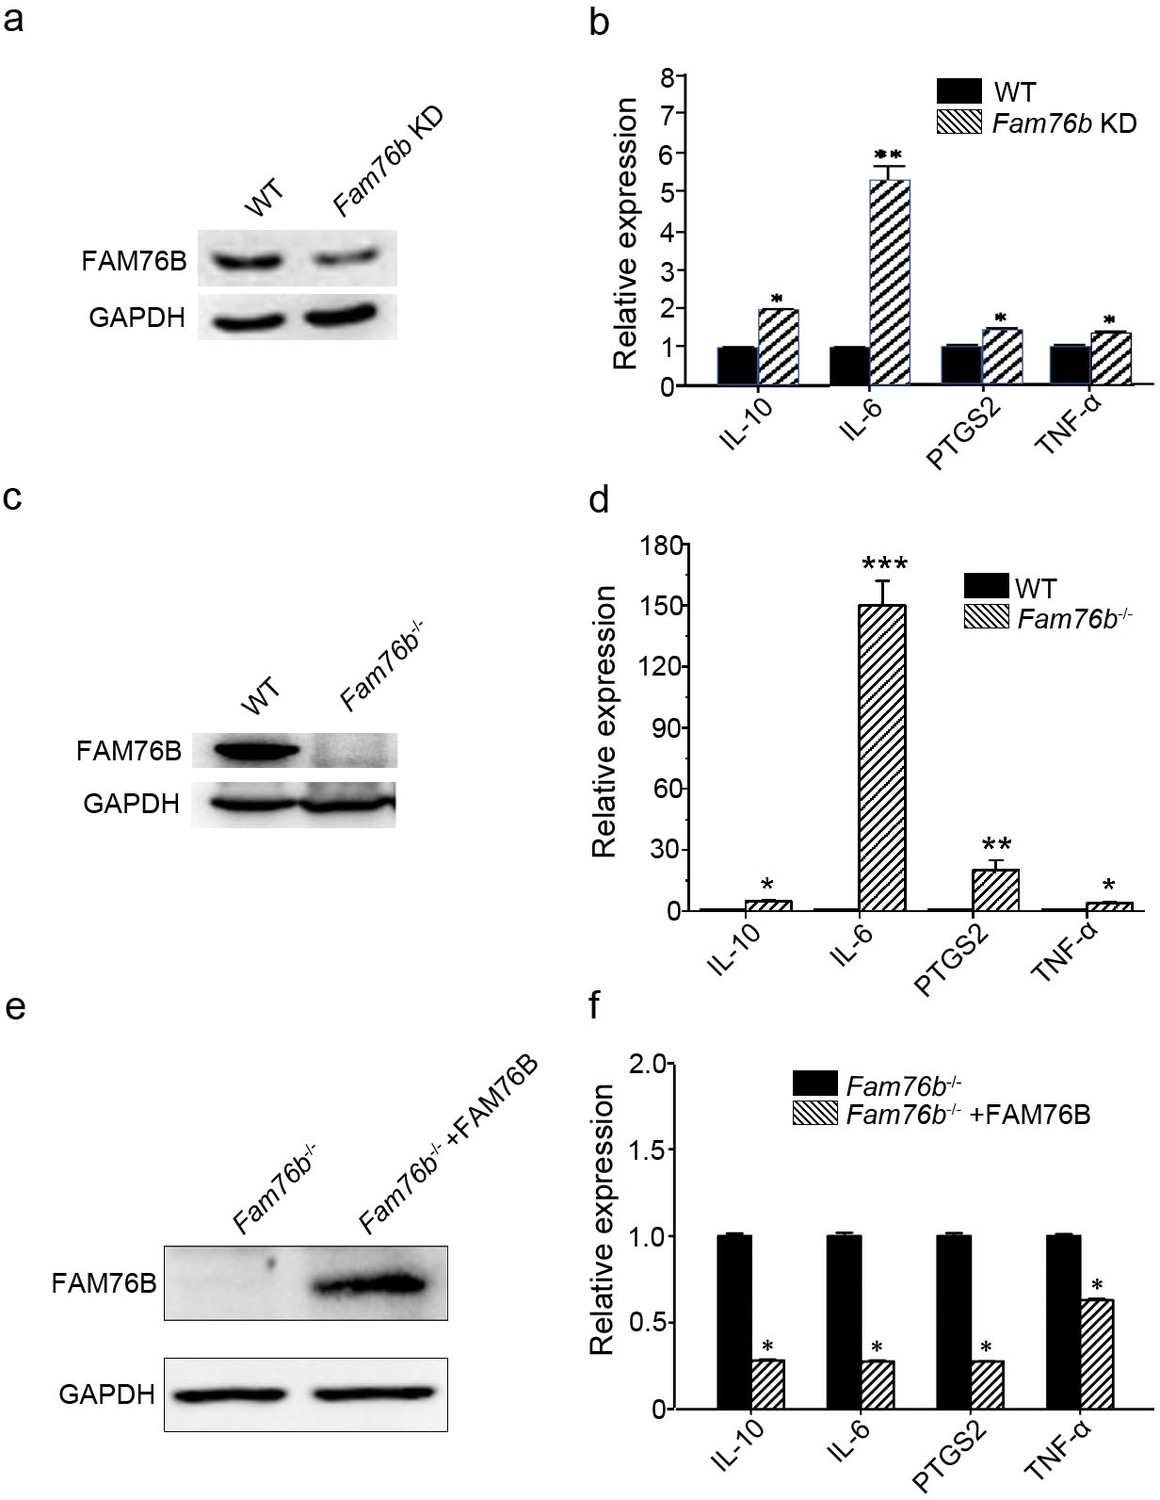
FAM76B regulates the expression of cytokines in U937 cells.
(a) Western blot for the detection of FAM76B expression in U937 with FAM76B knockdown cells (Fam76b KD) generated with the Cas9/sgRNA technique. (b) FAM76B knockdown in U937 increased the expression of IL6, PTGS2, TNFα and IL10, as determined by real-time PCR in the presence of PMA+LPS/IFNγ. (c) Western blot for the detection of FAM76B expression in U937 with FAM76B knockout cell line (Fam76b-/-) generated with the Cas9/sgRNA technique. (d) FAM76B knockout in U937 cells significantly enhanced the expression of IL6, PTGS2, TNFα and IL10, as determined by real-time PCR in the presence of PMA+LPS/IFNγ. (e) Western blot validated the rescued expression of FAM76B in the Fam76b-/- U937 cell line infected with the lentiviral vector expressing FAM76B. (f) The rescued expression of FAM76B in the U937 cell line with FAM76B knockout reduced the mRNA levels of cytokines in the presence of PMA +LPS/IFNγ. The experiments were performed at least three times. Values are mean ± SD; *p<0.05, **p<0.01, ***p<0.001, statistically significant.
-
Figure 1—source data 1
Labeled uncropped western blot images for Figure 1.
- https://cdn.elifesciences.org/articles/85659/elife-85659-fig1-data1-v2.zip
-
Figure 1—source data 2
Raw western blot images with tiff format source data for Figure 1.
- https://cdn.elifesciences.org/articles/85659/elife-85659-fig1-data2-v2.zip
Figure 1—figure supplement 1

Confirmation by sequencing of Cas9/sgRNA-mediated FAM76B knockout in the U937 cell line.
The sequencing of genomic DNA from the FAM76B knockout U937 cells (FAM76B-/-) showed that one allele contained a 1 bp deletion and the other allele contained an 11 bp addition, as compared to the U937 wild-type (WT) cell line.
Figure 2
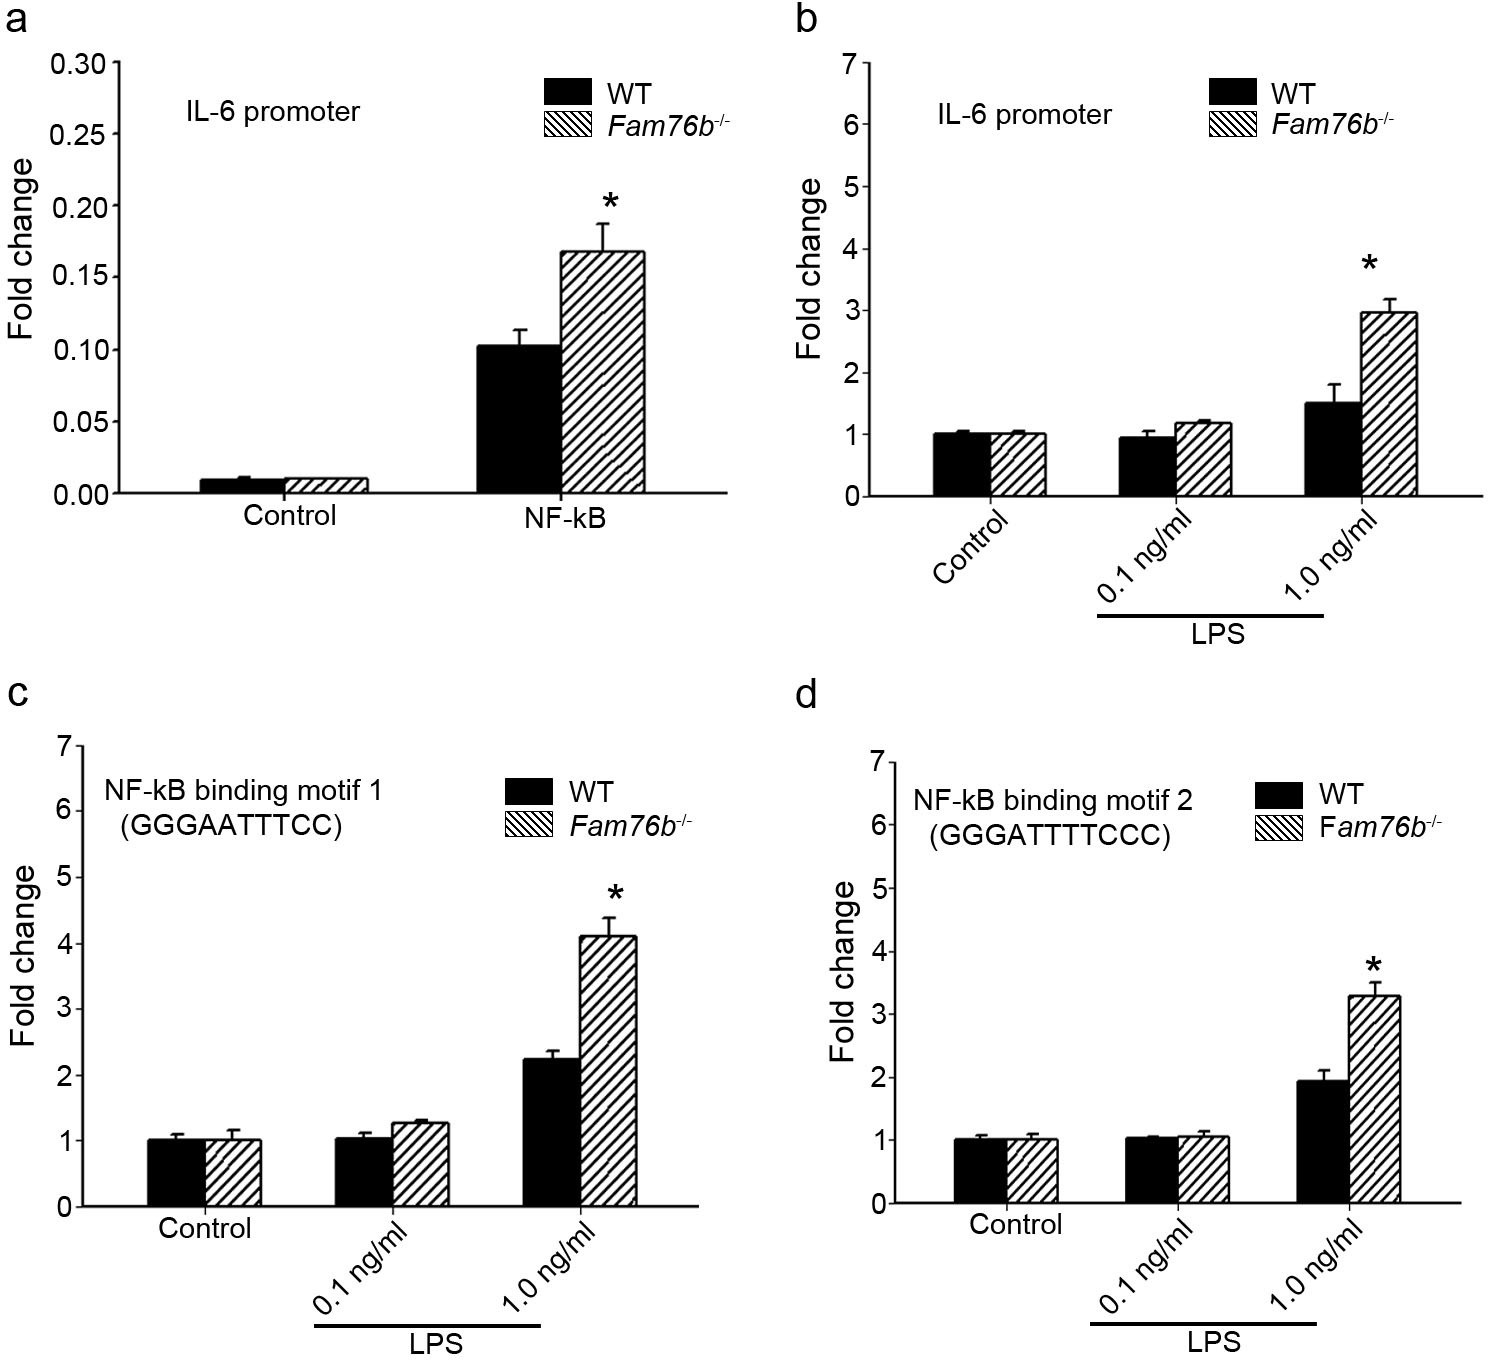
FAM76B regulates IL6 promoter activity by affecting the NF-κB pathway.
(a) The luciferase reporter vector of the IL6 promoter was tested in wild-type (WT) and FAM76B knockout (Fam76b-/-) HEK293 cells. The luciferase activity was low in both WT and FAM76B knockout HEK293 cells and significantly increased after transfecting the NF-κB-expressing vector. The increased activity of the IL6 promoter was more prominent in Fam76b-/- HEK293 cells than in WT cells. (b) The IL6 promoter was increased in WT and Fam76b-/- U937 cells, but was more prominent in the latter, after lipopolysaccharide (LPS) treatment. (c and d) Luciferase activity was increased in WT and Fam76b-/- U937 cells carrying NF-κB binding motifs 1 or 2 (and more prominently in the Fam76b-/- U937 cells), indicating that FAM76B inhibited NF-κB binding activity of IL6 promoter. The experiments were repeated at least three times. Values are mean ± SD; *p<0.05, statistically significant.
Figure 3
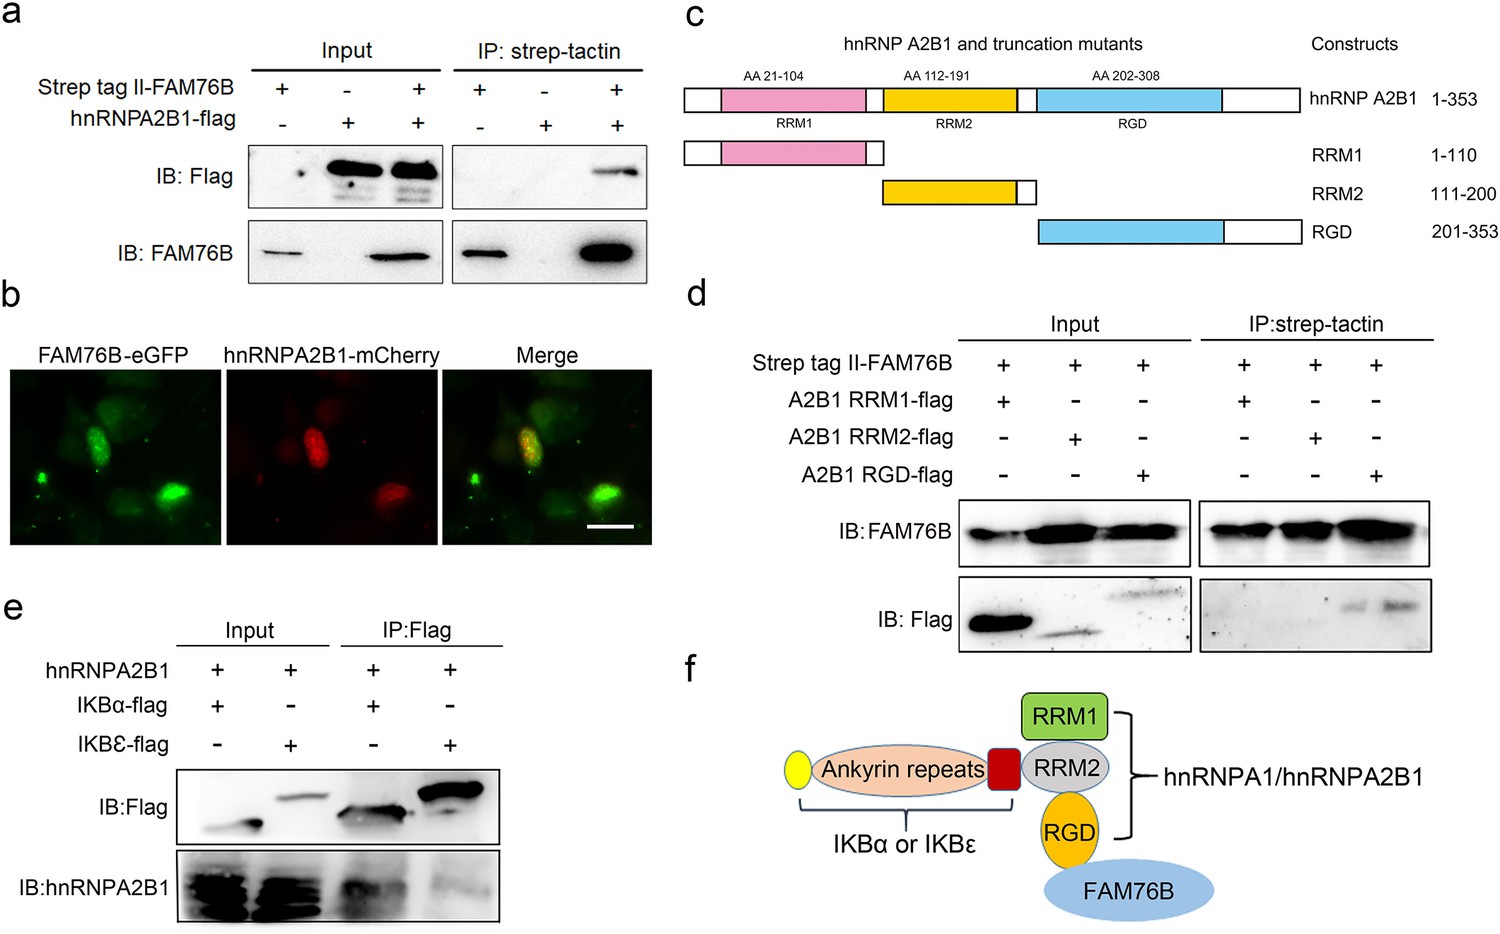
Validation of the interactions among FAM76B, hnRNPA2B1 and IκBs.
(a) The interaction between FAM76B and hnRNPA2B1 was revealed by co-immunoprecipitation. FAM76B-Strep-tag II and hnRNPA2B1-Flag were overexpressed in HEK293 cells, followed by co-immunoprecipitation of FAM76B and hnRNPA2B1 using whole cell lysate and western blot with anti-Flag or anti-FAM76B antibodies. (b) Confocal microcopy revealed the co-localization of FAM76B and hnRNPA2B1 in the nucleus of HEK293 cells transfected with plasmids expressing FAM76B-eGFP and hnRNPA2B1-mCherry, respectively. Scale bar, 20 µm. (c) An illustration of hnRNPA2B1 domains (RRM1, RRM2, and RGD) tagged with Flag generated for detecting the hnRNPA2B1 region(s) responsible for binding FAM76B. (d) Identification of the hnRNPA2B1 domains responsible for binding to FAM76B. Strep tag II-FAM76B and hnRNPA2/B1 domain-flag were transfected into HEK293 cells, followed by co-immunoprecipitation and western blot with anti-Flag or anti-FAM76B antibodies, which showed the interaction between the RGD domain of hnRNPA2B1 and FAM76B. (e) Similarly, the interaction between hnRNPA2B1 and IκBα-flag or IκBε-flag was detected by co-immunoprecipitation. (f) Schematic diagram of FAM76B, hnRNPA2B1 and IκB s’ protein complex formation: hnRNPA2B1 binds FAM76B by its RGD domain and binds IκBs by its RRM2 domain.
-
Figure 3—source data 1
Labeled uncropped western blot images for Figure 3.
- https://cdn.elifesciences.org/articles/85659/elife-85659-fig3-data1-v2.zip
-
Figure 3—source data 2
Raw western blot images with tiff format for Figure 3.
- https://cdn.elifesciences.org/articles/85659/elife-85659-fig3-data2-v2.zip
Figure 4 with 4 supplements
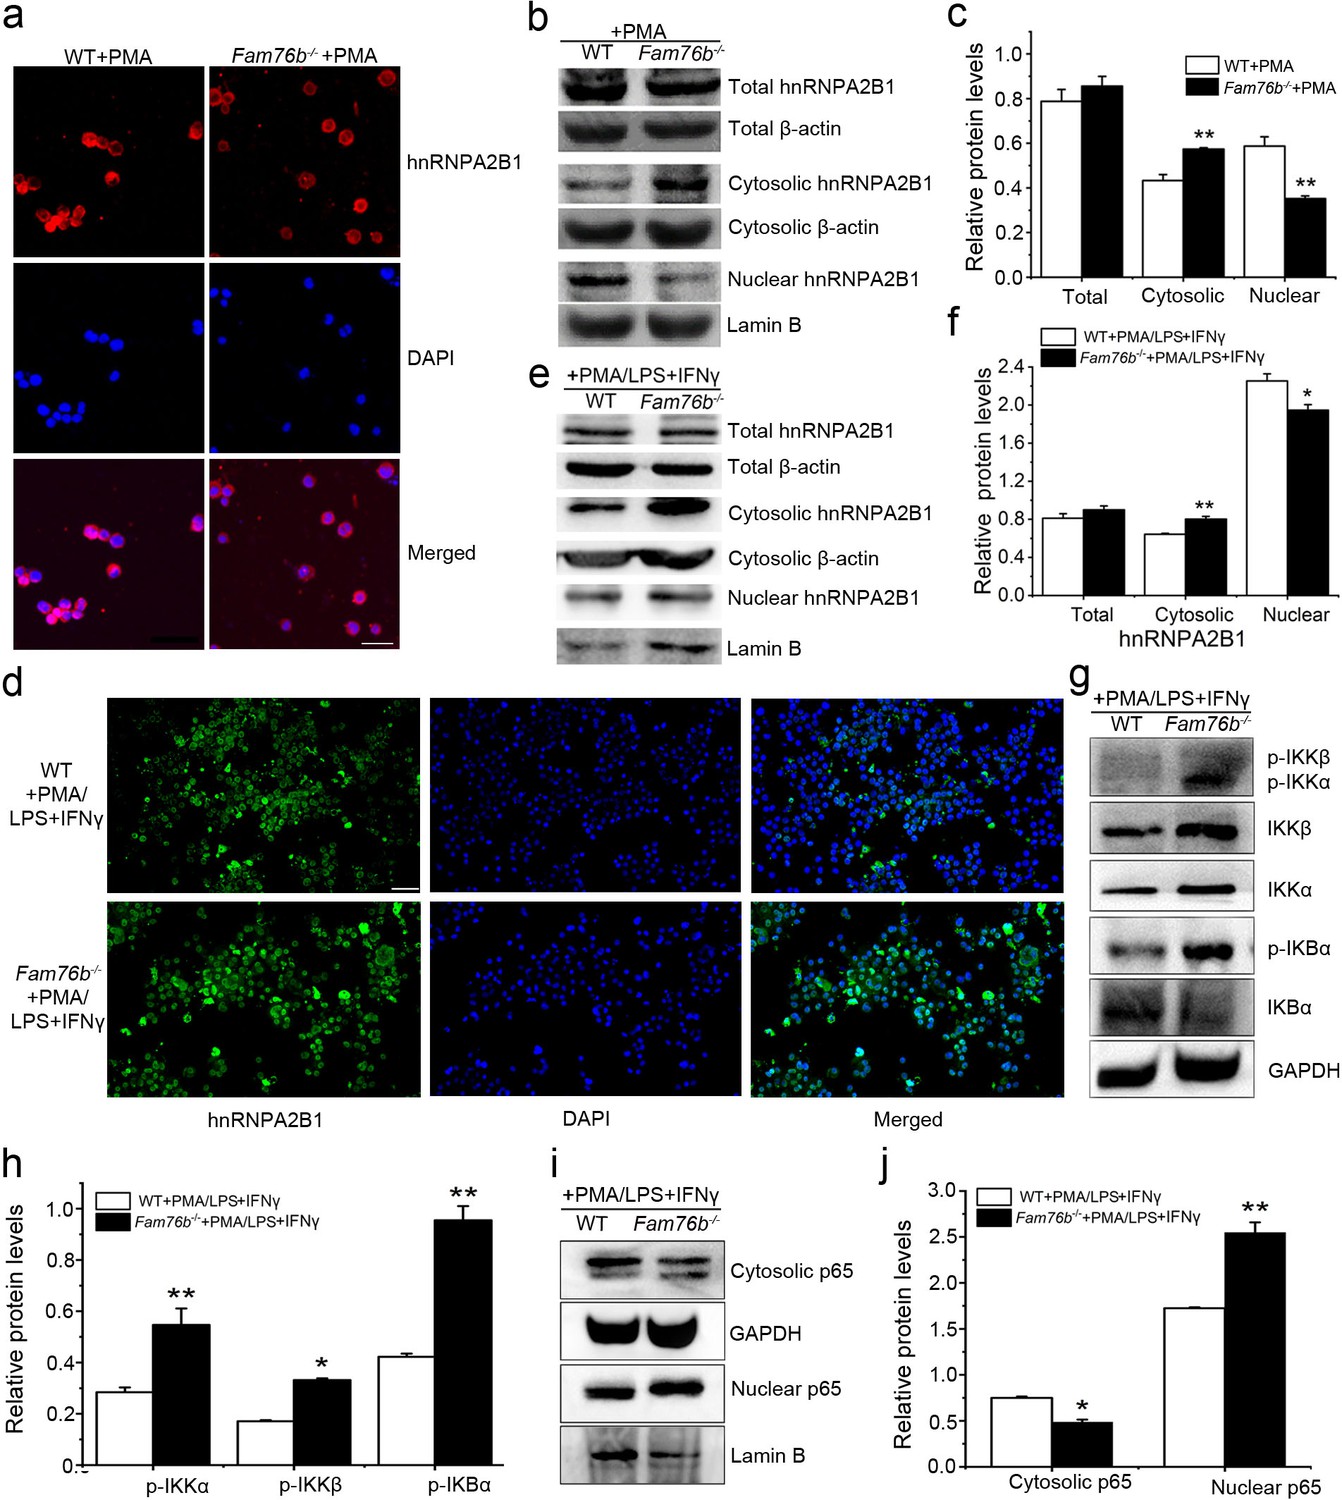
FAM76B regulates the NF-κB pathway via influencing the translocation of hnRNPA2B1.
(a) Immunofluorescence revealed increased cytoplasmic translocation of hnRNPA2B1 in U937 cells with FAM76B knockout (Fam76b-/-) stimulated with PMA for 48 hr. Scale bar, 20 µm. (b) Western blot confirmed the cytoplasmic translocation of hnRNPA2B1 in Fam76b-/- U937 cells stimulated with PMA for 48 hr. (c) The semiquantification of the results of western blot from (b). (d) Immunofluorescence revealed increased cytoplasmic translocation of hnRNPA2B1 in Fam76b-/- U937 cells stimulated with PMA followed by LPS+IFNγ. Scale bar, 50 µm. (e) Western blot confirmed the cytoplasmic translocation of hnRNPA2B1 in Fam76b-/- U937 cells stimulated with PMA followed by LPS+IFNγ. (f) The semiquantification of the results of western blot from (e). (g) Western blot revealed the increased phosphorylation of endogenous IKKα, IKKβ and IκBα in Fam76b-/- U937 cells with 1 ng/mL PMA followed by LPS+IFNγ treatment. (h) The semiquantification of the western blots result from (g). (i) Western blot showed the increased nuclear translocation of p65 in Fam76b-/- U937 cells stimulated with PMA followed by incubation with LPS+IFNγ. (j) The semiquantification of the western blot result from (i). The experiments were performed at least three times. Values are mean ± SD; *p<0.05, **p<0.01, statistically significant.
-
Figure 4—source data 1
Labeled uncropped western blot images for Figure 4.
- https://cdn.elifesciences.org/articles/85659/elife-85659-fig4-data1-v2.zip
-
Figure 4—source data 2
Raw western blot images with tiff format for Figure 3.
- https://cdn.elifesciences.org/articles/85659/elife-85659-fig4-data2-v2.zip
Figure 4—figure supplement 1
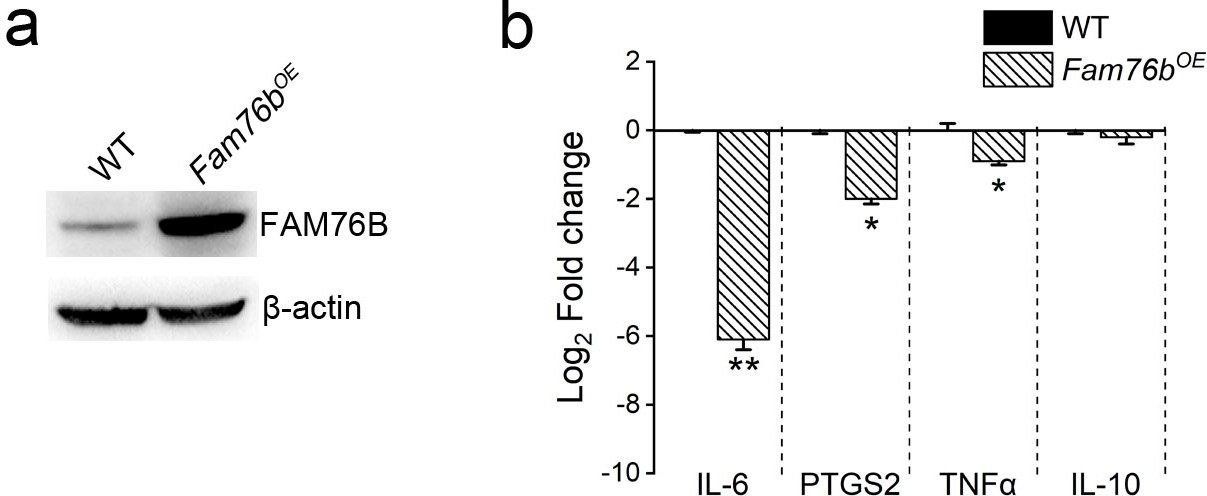
The downregulation of cytokines in FAM76B overexpressed U937 cells treated with PMA followed by LPS+IFNγ.
(a) The FAM76B overexpressing U937 cells (Fam76BOE) was generated by infecting U937 cells with lentiviruses carrying FAM76B. The expression levels of FAM76B were examined by western blot. (b) The mRNA levels of IL6, PTGS2, TNFα and IL10 in Fam76BOE cell line at 48 hr after treatment with PMA plus LPS/IFNγ. Gene expression is indicated as the mean log2 values of fold changes relative to wild-type (WT) U937 cells using real-time PCR. The experiments were performed at least three times. Values are mean ± SD; *p<0.05, **p<0.01, statistically significant.
-
Figure 4—figure supplement 1—source data 1
Labeled uncropped western blot images for Figure 4—figure supplement 1.
- https://cdn.elifesciences.org/articles/85659/elife-85659-fig4-figsupp1-data1-v2.pdf
-
Figure 4—figure supplement 1—source data 2
Raw western blot images with tiff format for Figure 4—figure supplement 1.
- https://cdn.elifesciences.org/articles/85659/elife-85659-fig4-figsupp1-data2-v2.zip
Figure 4—figure supplement 2
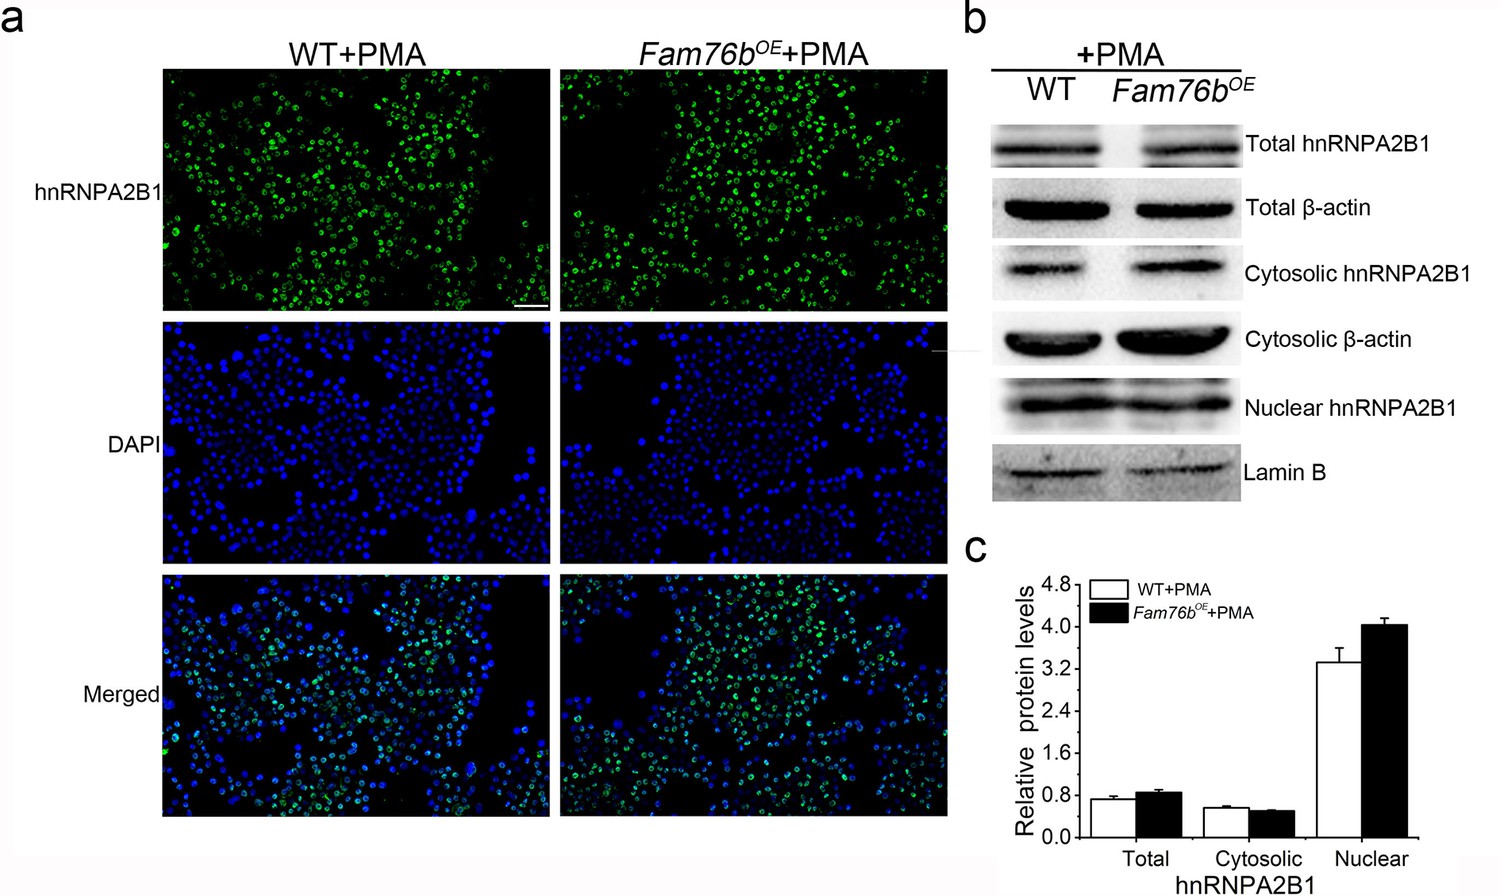
No significant change in cytoplasmic translocation of hnRNPA2B1 in FAM76B overexpressed U937 cells treated with PMA only.
(a) Immunofluorescence revealed no significant change in cytoplasmic translocation of hnRNPA2B1 in FAM76B overexpressing U937 cells (Fam76bOE) stimulated with PMA only. Scale bar, 50 µm. (b) Western blot confirmed the cytoplasmic distribution of hnRNPA2B1 in FAM76B overexpressing U937 cells (Fam76bOE) stimulated with PMA only. (c) The semiquantification of the results of western blot from (b). The experiments were performed at least three times. Values are mean ± SD.
-
Figure 4—figure supplement 2—source data 1
Labeled uncropped western blot images for Figure 4—figure supplement 2.
- https://cdn.elifesciences.org/articles/85659/elife-85659-fig4-figsupp2-data1-v2.pdf
-
Figure 4—figure supplement 2—source data 2
Raw western blot images with tiff format for Figure 4—figure supplement 2.
- https://cdn.elifesciences.org/articles/85659/elife-85659-fig4-figsupp2-data2-v2.zip
Figure 4—figure supplement 3
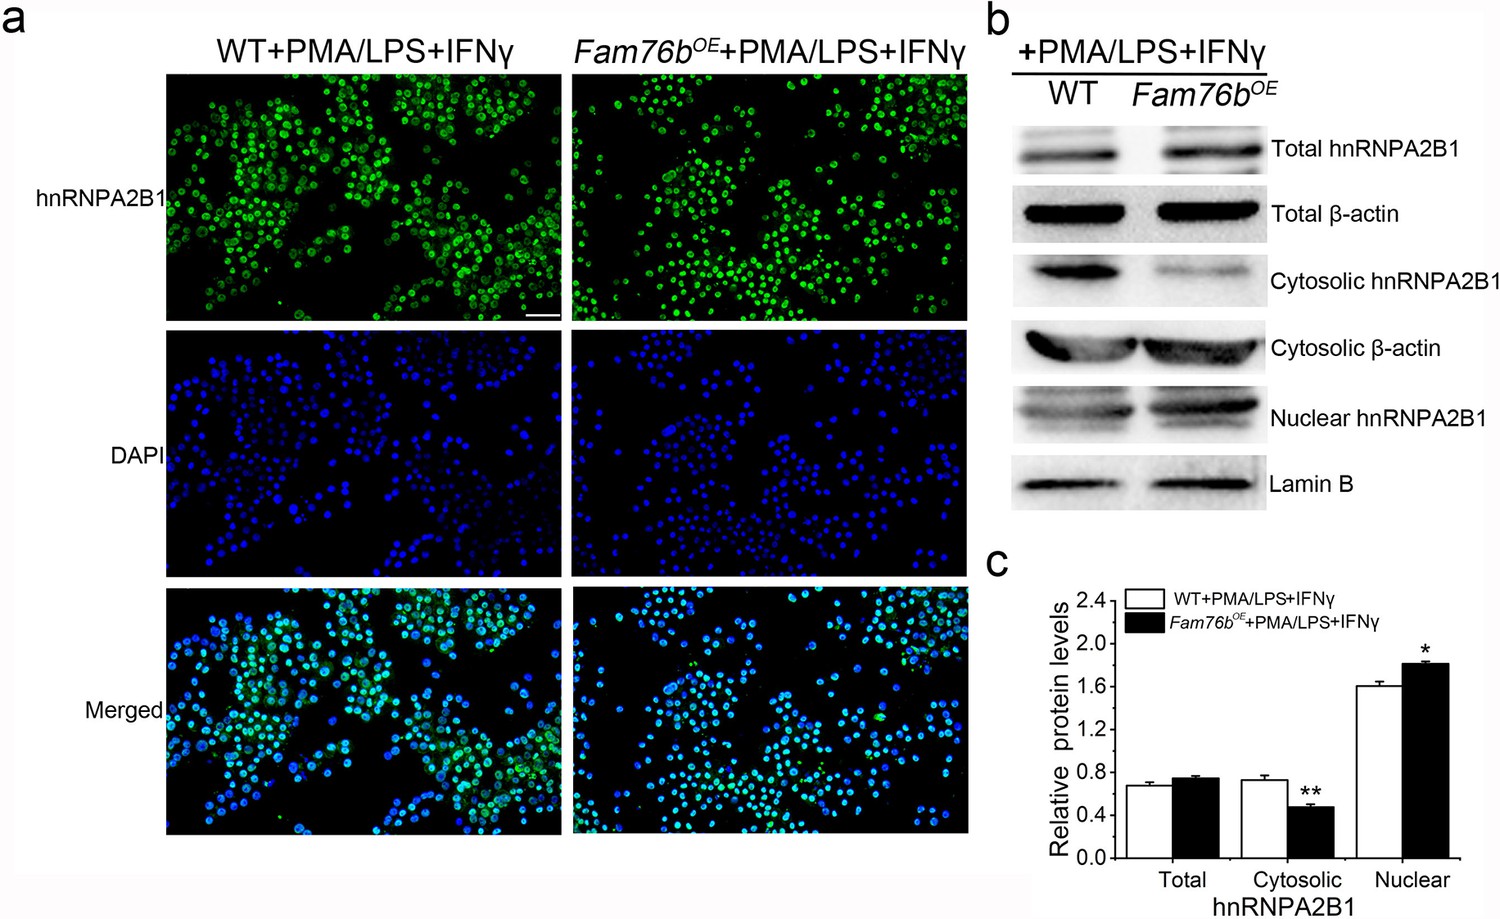
Decreased cytoplasmic translocation of hnRNPA2B1 in FAM76B overexpressed U937 cells treated with PMA followed by LPS+IFNγ.
(a) Immunofluorescence revealed decreased cytoplasmic translocation of hnRNPA2B1 in FAM76B overexpressing U937 cells (Fam76bOE) stimulated with PMA followed by LPS+IFNγ. Scale bar, 50 µm. (b) Western blot confirmed the cytoplasmic translocation of hnRNPA2B1 in FAM76B overexpressing U937 cells (Fam76bOE) stimulated with PMA followed by LPS+IFNγ. (c) The semiquantification of the results of western blot from (b). The experiments were performed at least three times. Values are mean ± SD; *p<0.05, **p<0.01, statistically significant.
-
Figure 4—figure supplement 3—source data 1
Labeled uncropped western blot images for Figure 4—figure supplement 3.
- https://cdn.elifesciences.org/articles/85659/elife-85659-fig4-figsupp3-data1-v2.pdf
-
Figure 4—figure supplement 3—source data 2
Raw western blot images with tiff format for Figure 4—figure supplement 3.
- https://cdn.elifesciences.org/articles/85659/elife-85659-fig4-figsupp3-data2-v2.zip
Figure 4—figure supplement 4
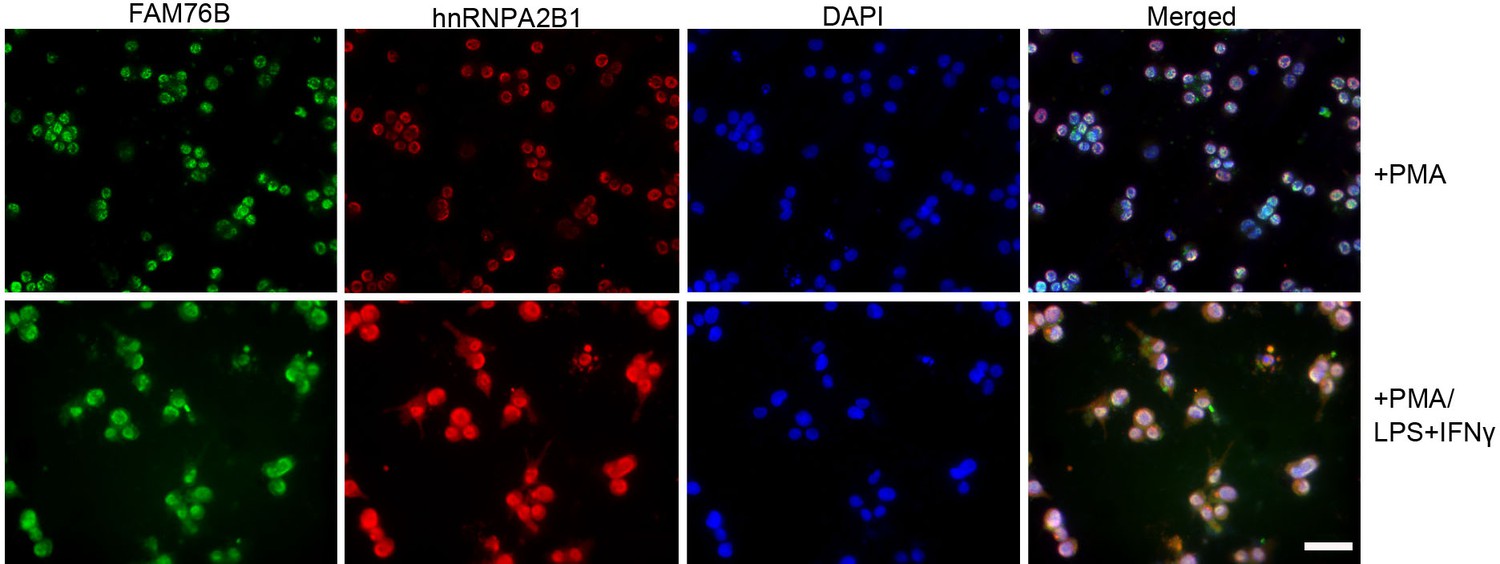
Increased cytoplasmic translocation of hnRNPA2B1 and FAM76B in U937 cells treated with PMA followed by LPS+IFNγ.
U937 cells were stimulated with 1 ng/mL PMA followed by LPS and IFNγ treatment, which led to the cytoplasmic translocations of FAM76B and hnRNPA2B1. Scale bar, 20 µm.
Figure 5 with 2 supplements

Generation of Fam76b knockout (Fam76b-/-) mice.
(a) Schematic diagram of the homologous recombination construct for generating Fam76b-/- mice, with arrows denoting primer locations. (b) Genotyping results for Fam76b wild-type (WT), hemizygous (+/-), and homozygous (-/-) mice. Lanes 1, 3, and 5 are the amplified products using Fam76b forward and reverse primers (Supplementary file 3); lanes 2, 4, and 6 are the amplified products using Fam76b forward and V76 reverse primers (Supplementary file 3). (c) FAM76B protein levels in mouse embryonic fibroblasts from Fam76b WT, hemizygous (+/-), and homozygous (-/-) mice were confirmed by western blot(n=3, each group). (d) Detection of Fam76b mRNA levels in mouse embryonic fibroblasts from Fam76b WT, hemizygous (+/-), and homozygous (-/-) mice by real-time PCR(n=3, each group). Values are mean ± SD;*p<0.05, **p<0.01, statistically significant.
-
Figure 5—source data 1
Labeled uncropped western blot images for Figure 5.
- https://cdn.elifesciences.org/articles/85659/elife-85659-fig5-data1-v2.pdf
-
Figure 5—source data 2
Raw western blot images with tiff format for Figure 5.
- https://cdn.elifesciences.org/articles/85659/elife-85659-fig5-data2-v2.zip
Figure 5—figure supplement 1

The detection of FAM76B expression in mouse tissues by real-time PCR (n=5).
Values are mean ± SD; *p<0.05, **p<0.01, statistically significant.
Figure 5—figure supplement 2
Characterization of Fam76b knockout mice.
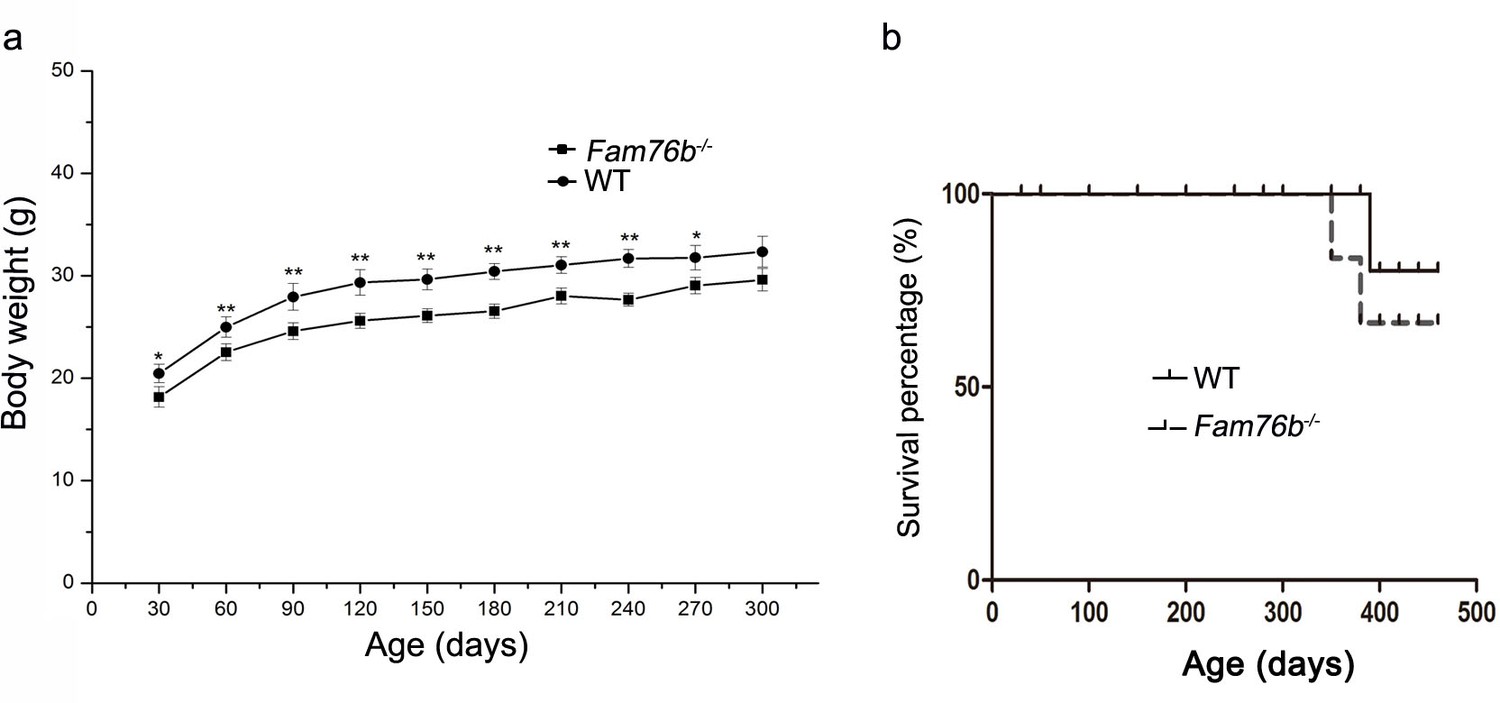
(a) Body weight changes of male wild-type (WT) and homozygous Fam76b mutant (Fam76b-/-) mice over time. Values are mean ± SD; *p<0.05, **p<0.01, statistically significant. (b) The survival curve of homozygous Fam76b mutant (Fam76b-/-) mice did not differ from that of WT mice. n=5, each group.
Figure 6 with 1 supplement
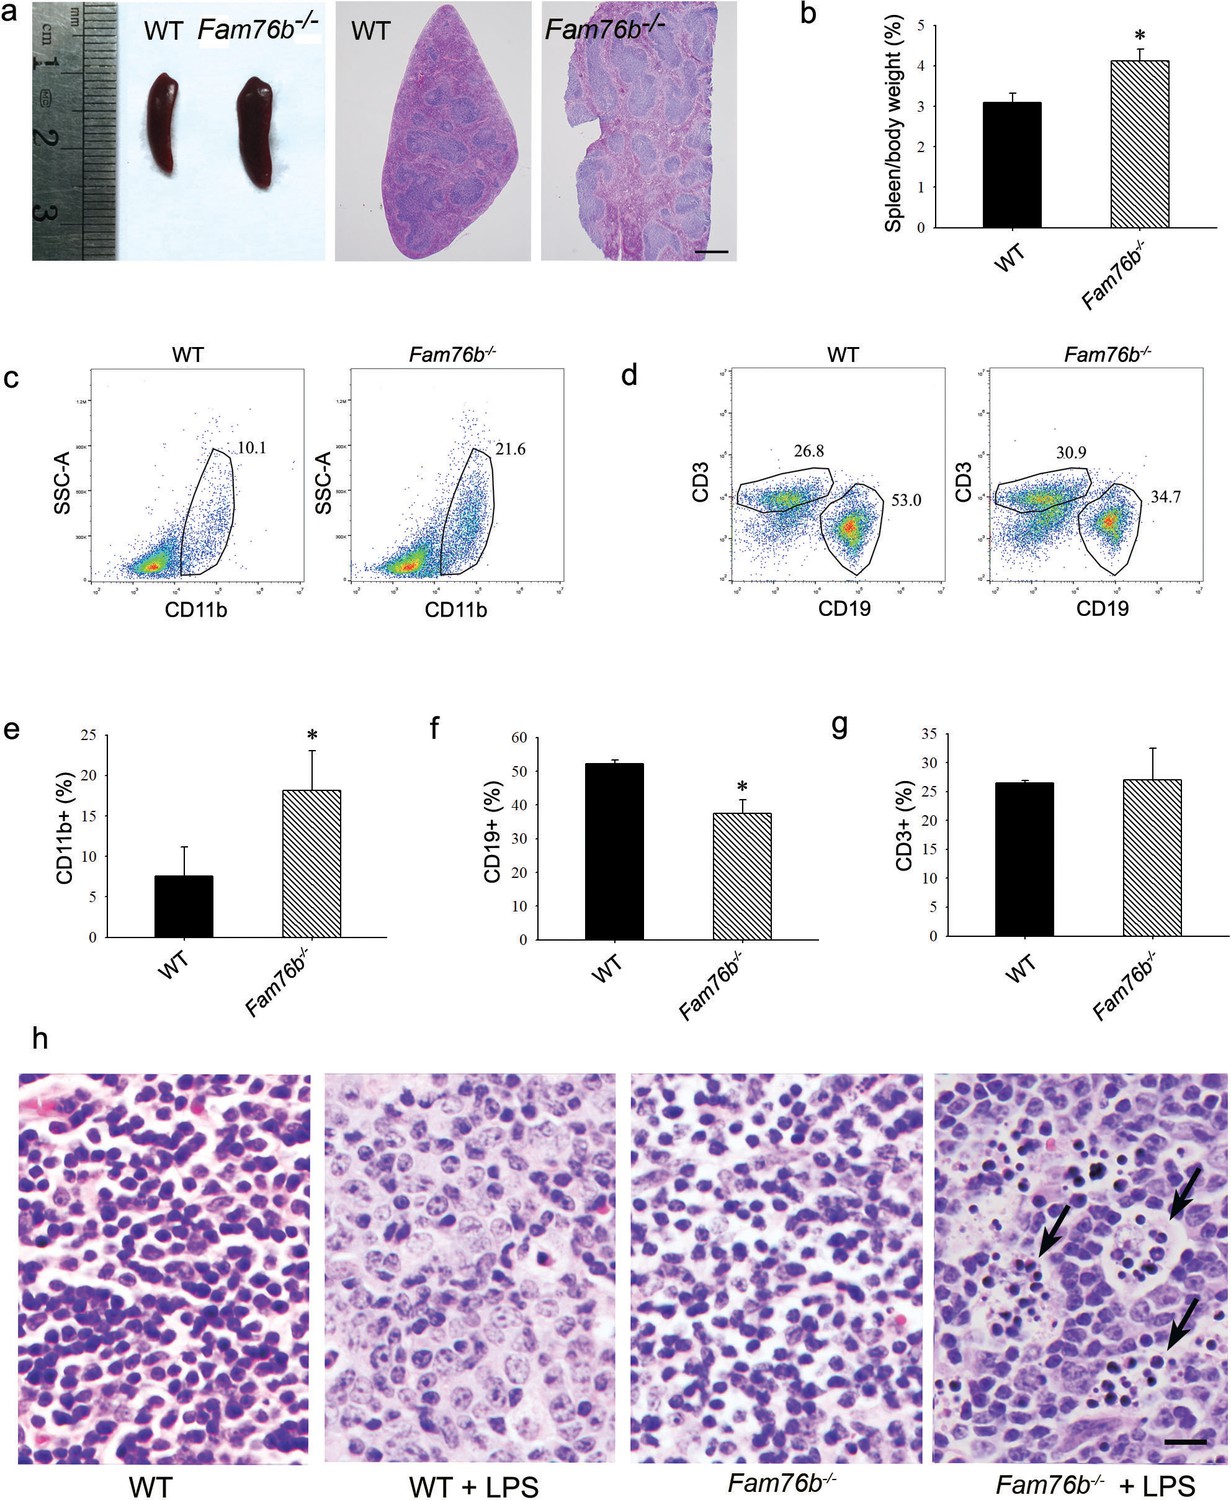
Fam76b knockout mice have enlarged spleens with altered cell populations and inflammation.
(a) Enlarged spleen with white pulp hypertrophy in Fam76b knockout mice (Fam76b-/- mice) (5 months), as compared with wild-type (WT). Scale bar, 500 µm. (b) The weight ratio of spleen to body in Fam76b-/- mice (5 months) revealed an enlarged spleen, as compared with WT. *p<0.05, statistically significant (n=5, each group). (c–g) Flow cytometry results of the cell population of spleens of Fam76b-/- mice (5 months). Dot plots (c and d) and bar graphs (e, f, and g) show increased populations of CD11b+ and decreased populations of CD19+ B cells in Fam76b-/- mice spleens (n=4, each group) ( Values are mean ± SD; *p<0.05, one-way ANOVA). (h) Photomicrographs of hematoxylin and eosin (H&E)-stained spleens from Fam76b-/- mice intraperitoneally injected with lipopolysaccharide (LPS) showed abundant tingible body macrophages (arrows) in the germinal center, whereas no tingible body macrophages were seen in LPS-treated WT or in phosphate-buffered saline (PBS)-treated Fam76b-/- and WT mice (n=5, each group). Scale bar, 25 µm.
Figure 6—figure supplement 1
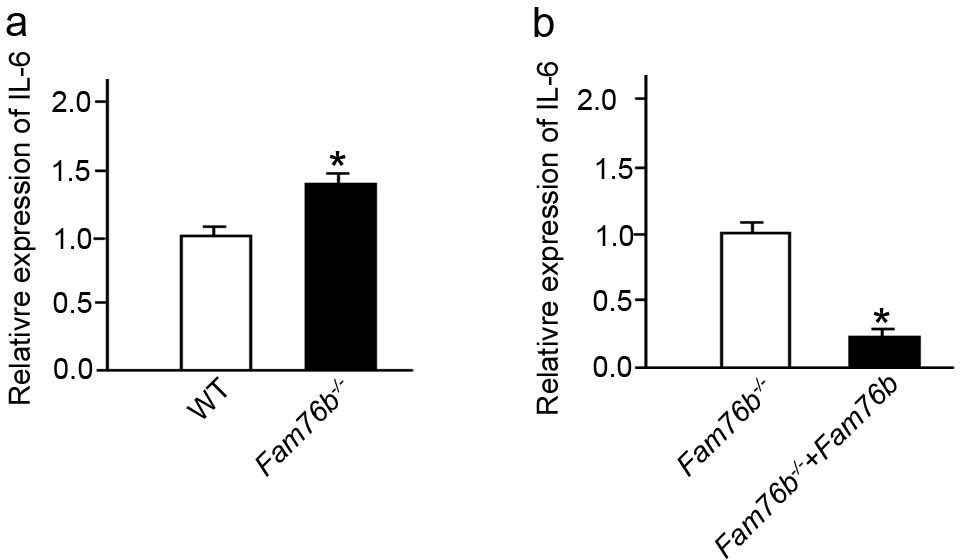
Lipopolysaccharide (LPS) stimulated bone marrow-derived macrophages (BMDMs) from Fam76b knockout mice showed increased IL6 expression.
(a) IL6 expression was revealed by real-time PCR in BMDMs from Fam76b knockout mice (Fam76b-/- mice) in the presence of LPS. (b) IL6 expression was decreased when the BMDMs from Fam76b-/- mice were infected with FAM76B expressing lentivirus vector in the presence of LPS. The experiments were repeated at least three times. Values are mean ± SD; *p<0.05, statistically significant.
Figure 7 with 2 supplements
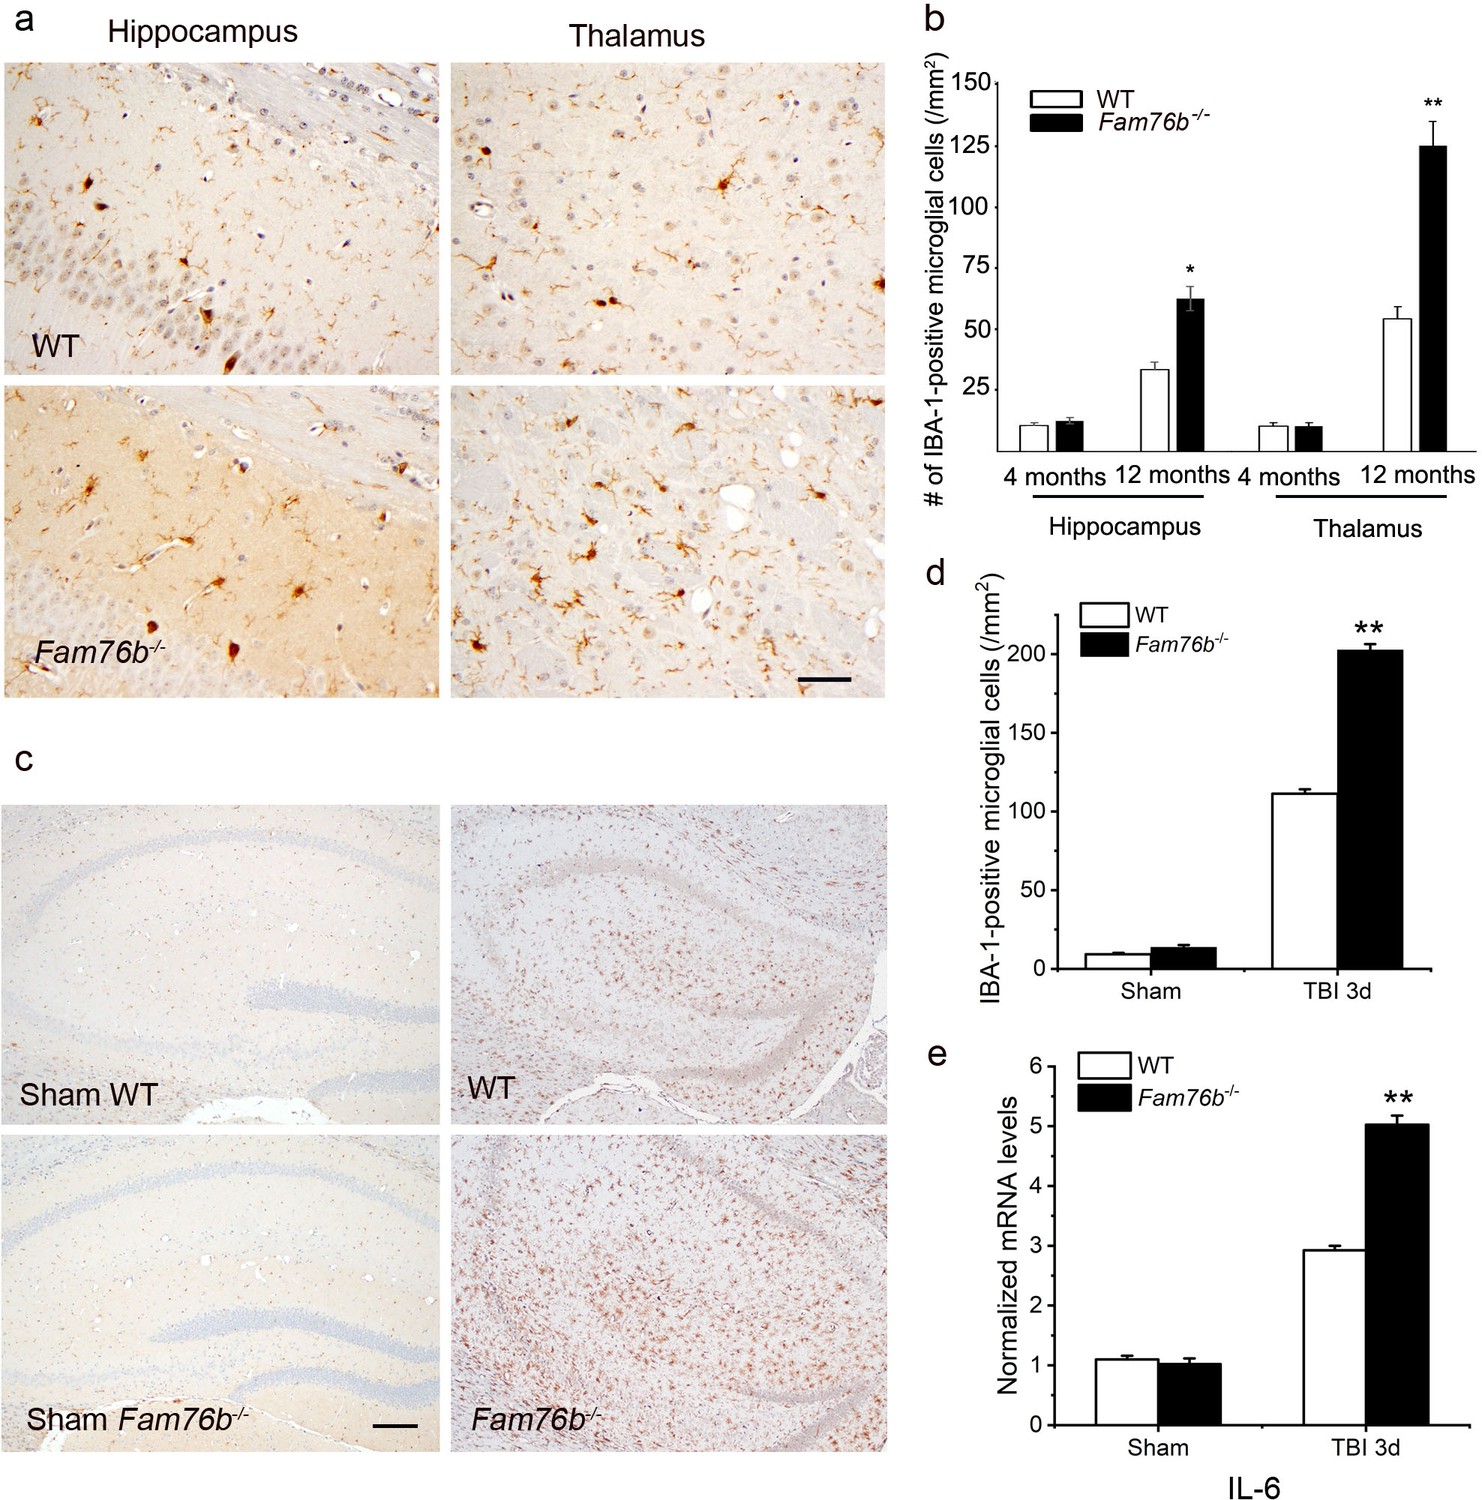
Neuroinflammation is enhanced in Fam76b knockout mice.
(a) Increased IBA-1-positive microglial infiltration in the hippocampus (lower left panel) and thalamus (lower right panel) of 12-month-old Fam76b knockout mice (Fam76b-/- mice), as compared with age-matched wild-type (WT) mice (n=5, each group). Scale bar, 50 µm. (b) Density of IBA-1-positive microglia in hippocampal CA1 regions and the thalamus of 4- and 12-month-old Fam76b-/- mice, as compared with age-matched WT mice (n=5, each group). (c) Increased IBA-1-positive microglia in the hippocampus adjacent to the contusion site of Fam76b-/- mice, as compared with WT mice and sham controls. Scale bar, 200 µm. (d) Density of IBA-1-positive microglia in hippocampal CA1 regions of Fam76b-/- mice, as compared with WT mice and sham controls (n=5, each group). Values are mean ± SD. The densities of IBA-1-positive microglia were compared to the control value by Student’s t-test (**p<0.01). (e) Increased IL6 expression, as revealed by real-time PCR, in the ipsilateral hippocampus in both Fam76b-/- and WT mice 3 days after traumatic brain injury (TBI), with more prominent changes in Fam76b-/- mice. Values are mean ± SD; *p<0.05, **p<0.01, statistically significant.
Figure 7—figure supplement 1
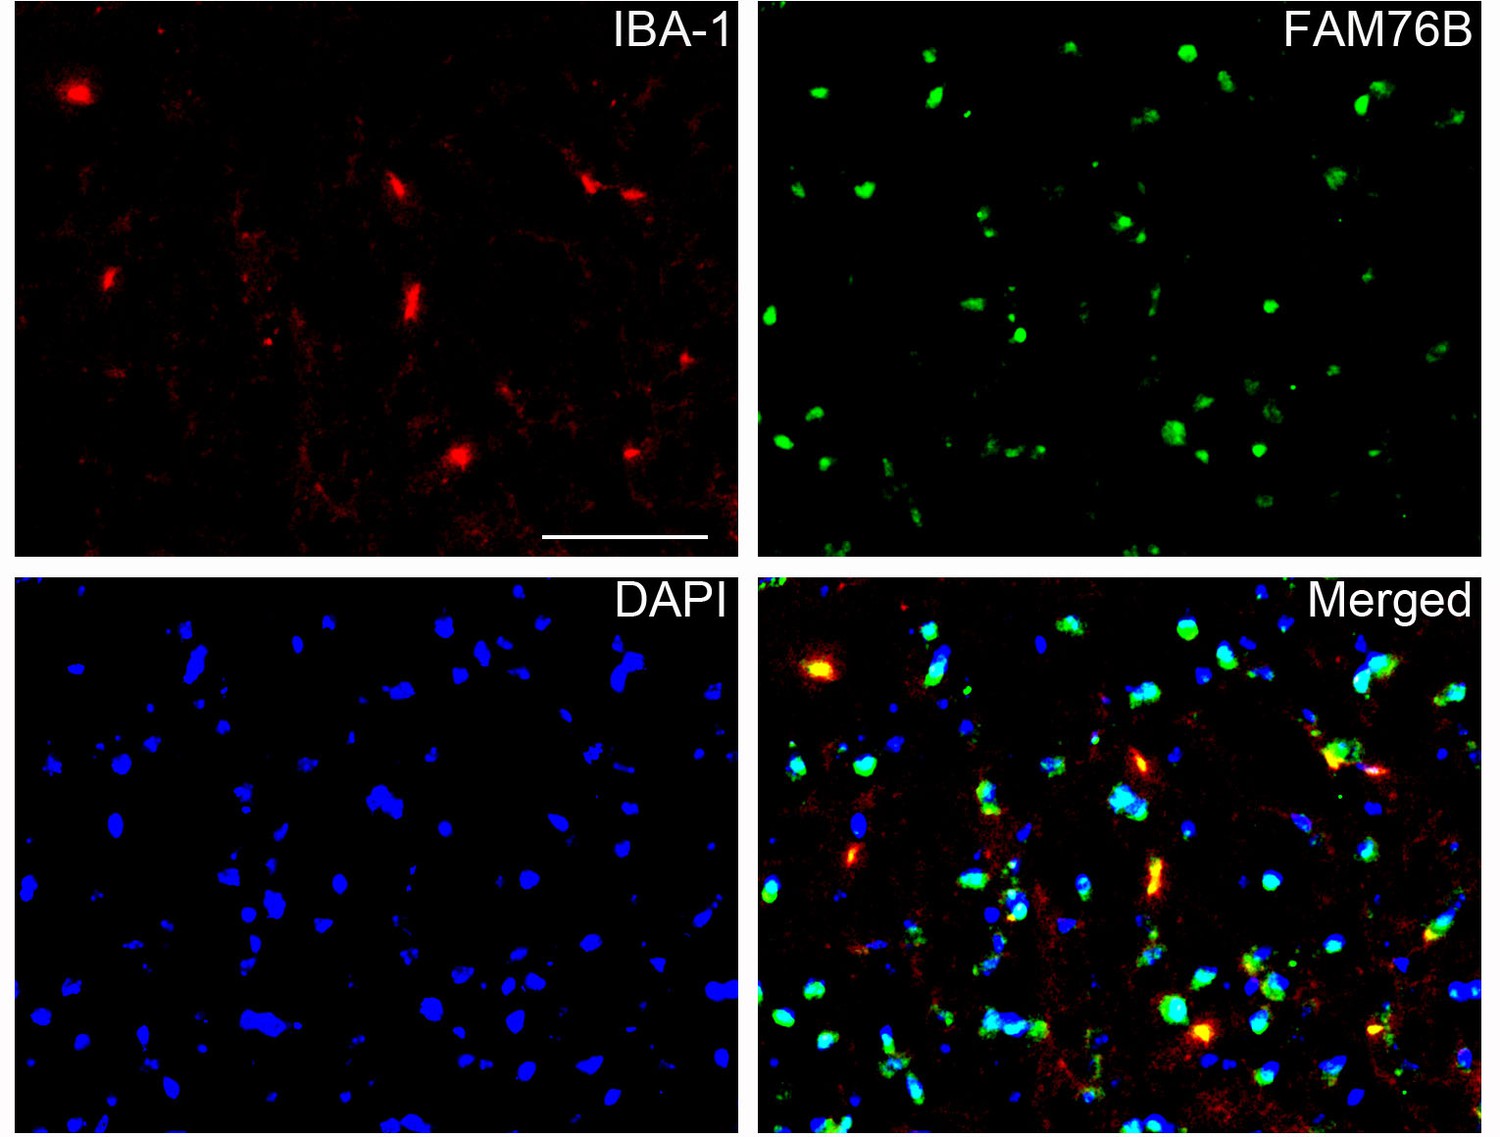
The co-localization of FAM76B with IBA-1 in the mouse brain by immunofluorescence staining.
Scale bar, 50 µm.
Figure 7—figure supplement 2
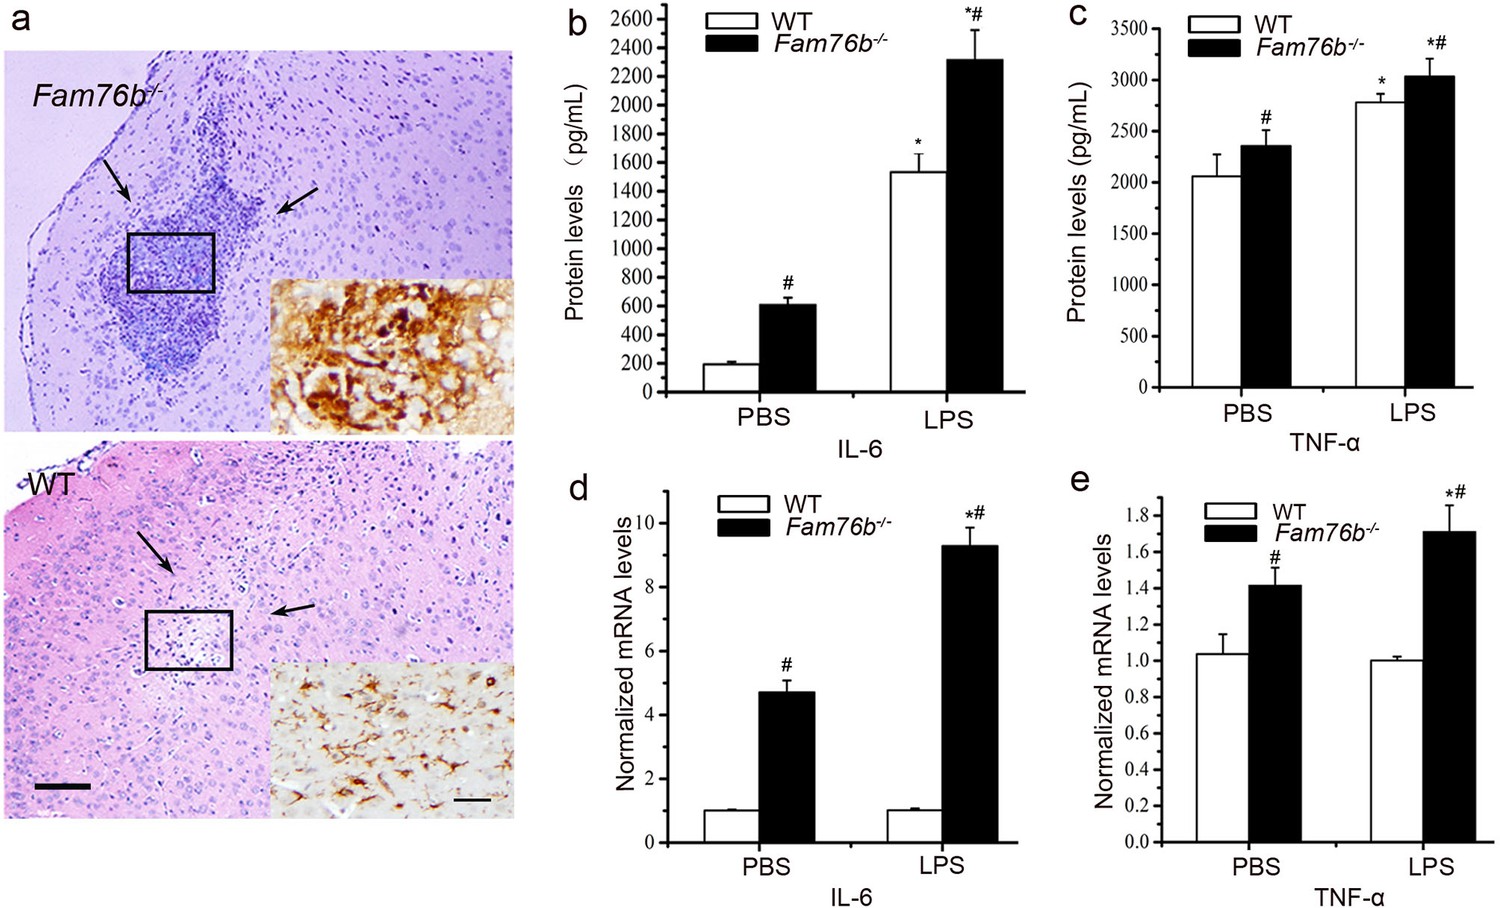
Neuroinflammation in Fam76b knockout mice after lipopolysaccharide (LPS) treatment.
(a) Hematoxylin and eosin (H&E) staining of needle track sites (between the arrows) in LPS-injected mouse brains. A high number of macrophages were observed infiltrating the needle track areas in the LPS-injected brains of Fam76b knockout mice (Fam76b-/- mice). Only a mild inflammatory response was observed at the injection site in wild-type (WT) mice. Scale bar, 100 µm. Insets, the IBA-1-positive cells in needle track sites. Scale bar, 20 µm. (b–e) IL-6 and tumor necrosis factor alpha (TNF-α) expression at the injection sites of Fam76b-/- and WT mice post-LPS intracranial injection, by enzyme-linked immunosorbent assay (ELISA) and real-time PCR. Brain tissues 1 mm in diameter around the needle track were dissected 24 hr after the injection and homogenized, followed by ELISA and real-time PCR. The experiments were performed at least three times. Values are mean ± SD; *p<0.05, statistically significant, LPS vs. phosphate buffered saline (PBS); #p<0.05, statistically significant, Fam76b-/- vs. WT.
Figure 8 with 1 supplement
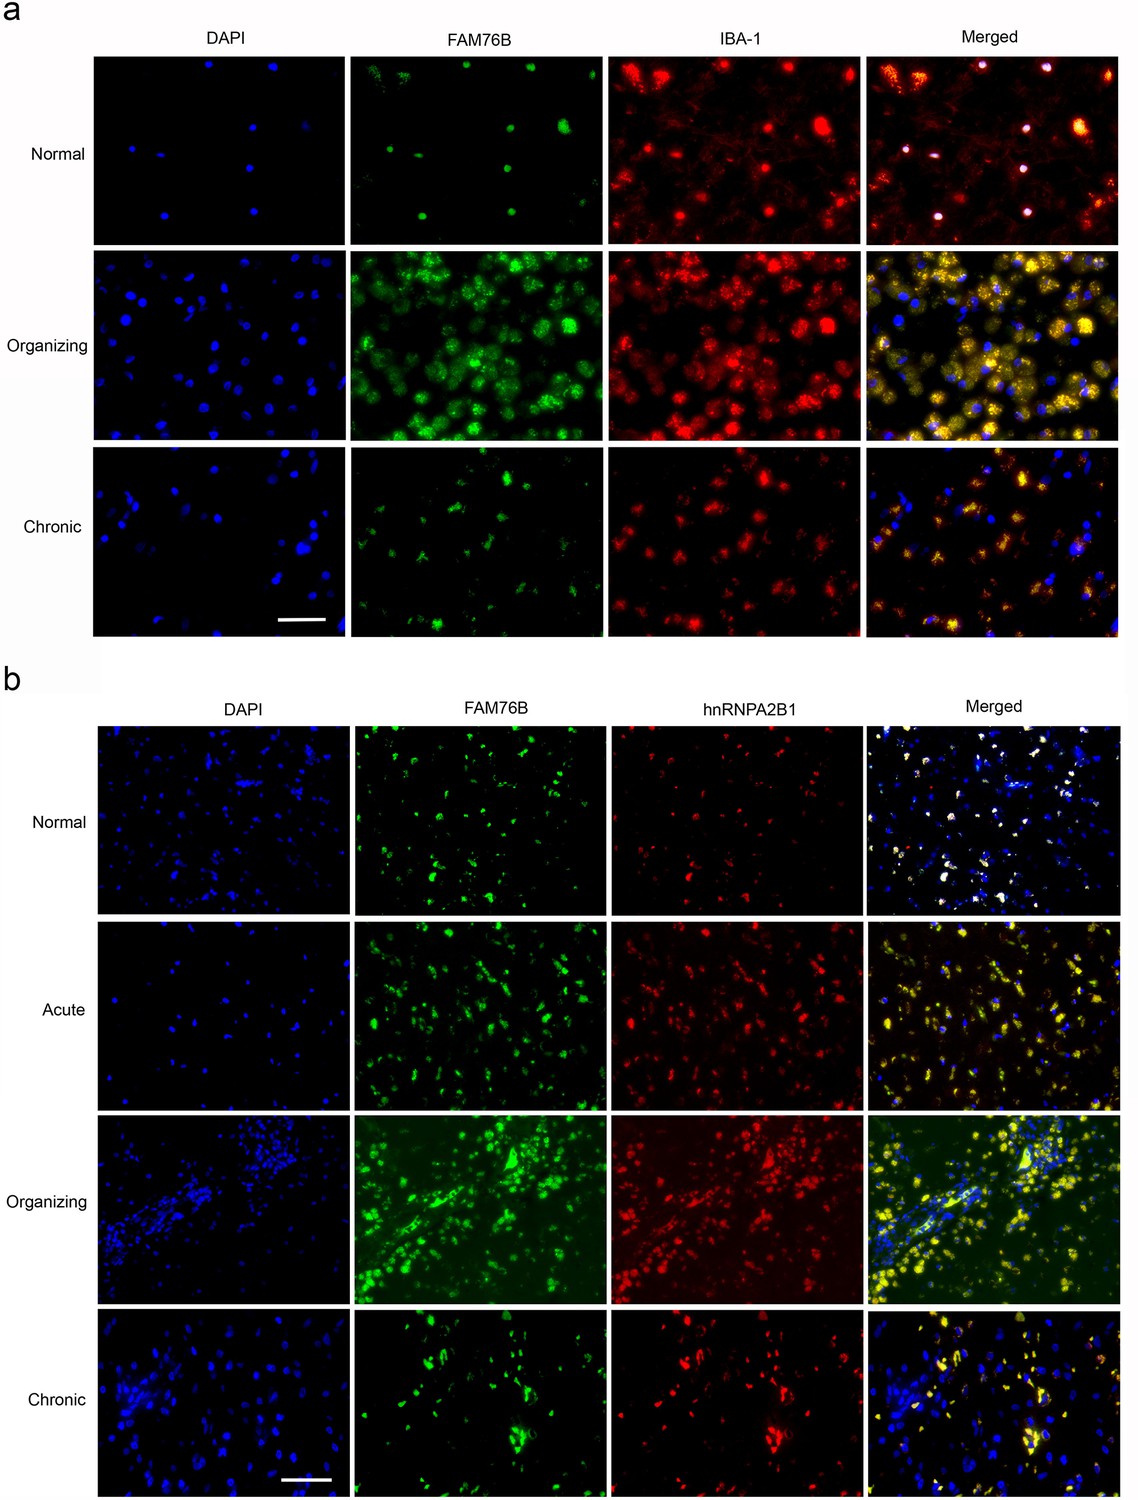
The expression and distribution of FAM76B/hnRNPA2B1 in human brains with traumatic brain injury (TBI).
(a) Microglial localization of FAM76B in organizing and chronic TBI. Immunofluorescence revealed the nuclear localization of FAM76B in IBA-1-positive microglia in the normal human cortex. FAM76B was upregulated and cytoplasmically translocated in microglia/macrophages in the human cortex with organizing TBI. In chronic TBI, microglial FAM76B showed persistent cytoplasmic distribution. Scale bar, 100 µm. (b) Upregulation and cytoplasmic translocation of FAM76B and hnRNPA2B1 in acute, organizing, and chronic TBI. Immunofluorescence revealed the nuclear co-localization of FAM76B and hnRNPA2B1 in the normal human cortex. Both FAM76B and hnRNPA2B1 were upregulated and cytoplasmically translocated in microglia/macrophages in the cortex of a patient with acute TBI. Both proteins were further upregulated in the cytoplasm of the microglia/macrophages in the human cortex with organizing TBI. In chronic TBI, microglial FAM76B and hnRNPA2B1 showed persistent cytoplasmic distribution and co-localization. Scale bar, 100 µm.
Figure 8—figure supplement 1
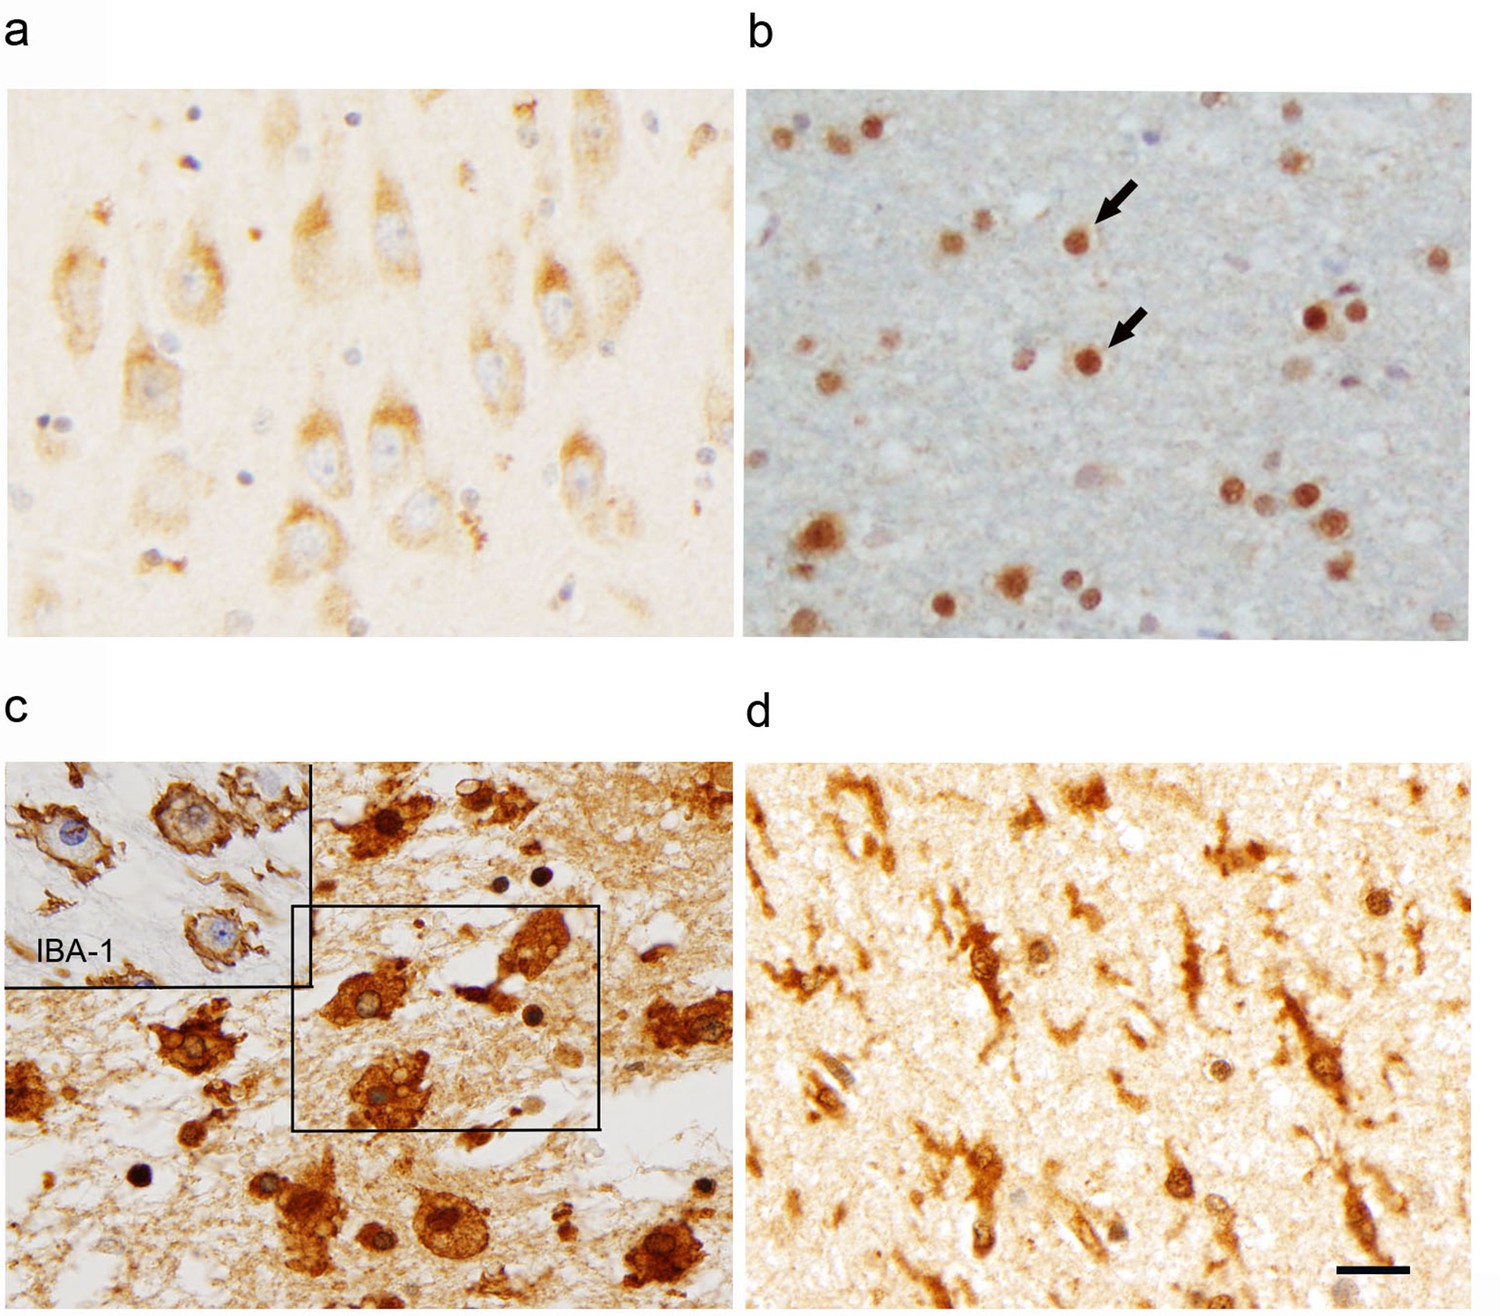
Expression of FAM76B in normal and diseased tissues.
The expression of FAM76B in different human brain tissues revealed by immunohistochemical staining demonstrated that FAM76B was localized in the cytoplasm of neurons (a; photo taken of the hippocampal CA1 region) and in the nuclei of glial cells (b; photo taken of white matter). Arrows, oligodendroglial cells of normal human brains. Significant upregulation and cytoplasmic translocation of FAM76B in macrophages in areas of organizing necrosis in the brain of a patient with TBI (c; inset, macrophages labeled by IBA-1 in the mirrored section). Reactive microglial cells in the hippocampus of a patient with acute ischemic injury are strongly immunopositive for FAM76B (d). Scale bar, 20 µm for all photos.
Figure 9
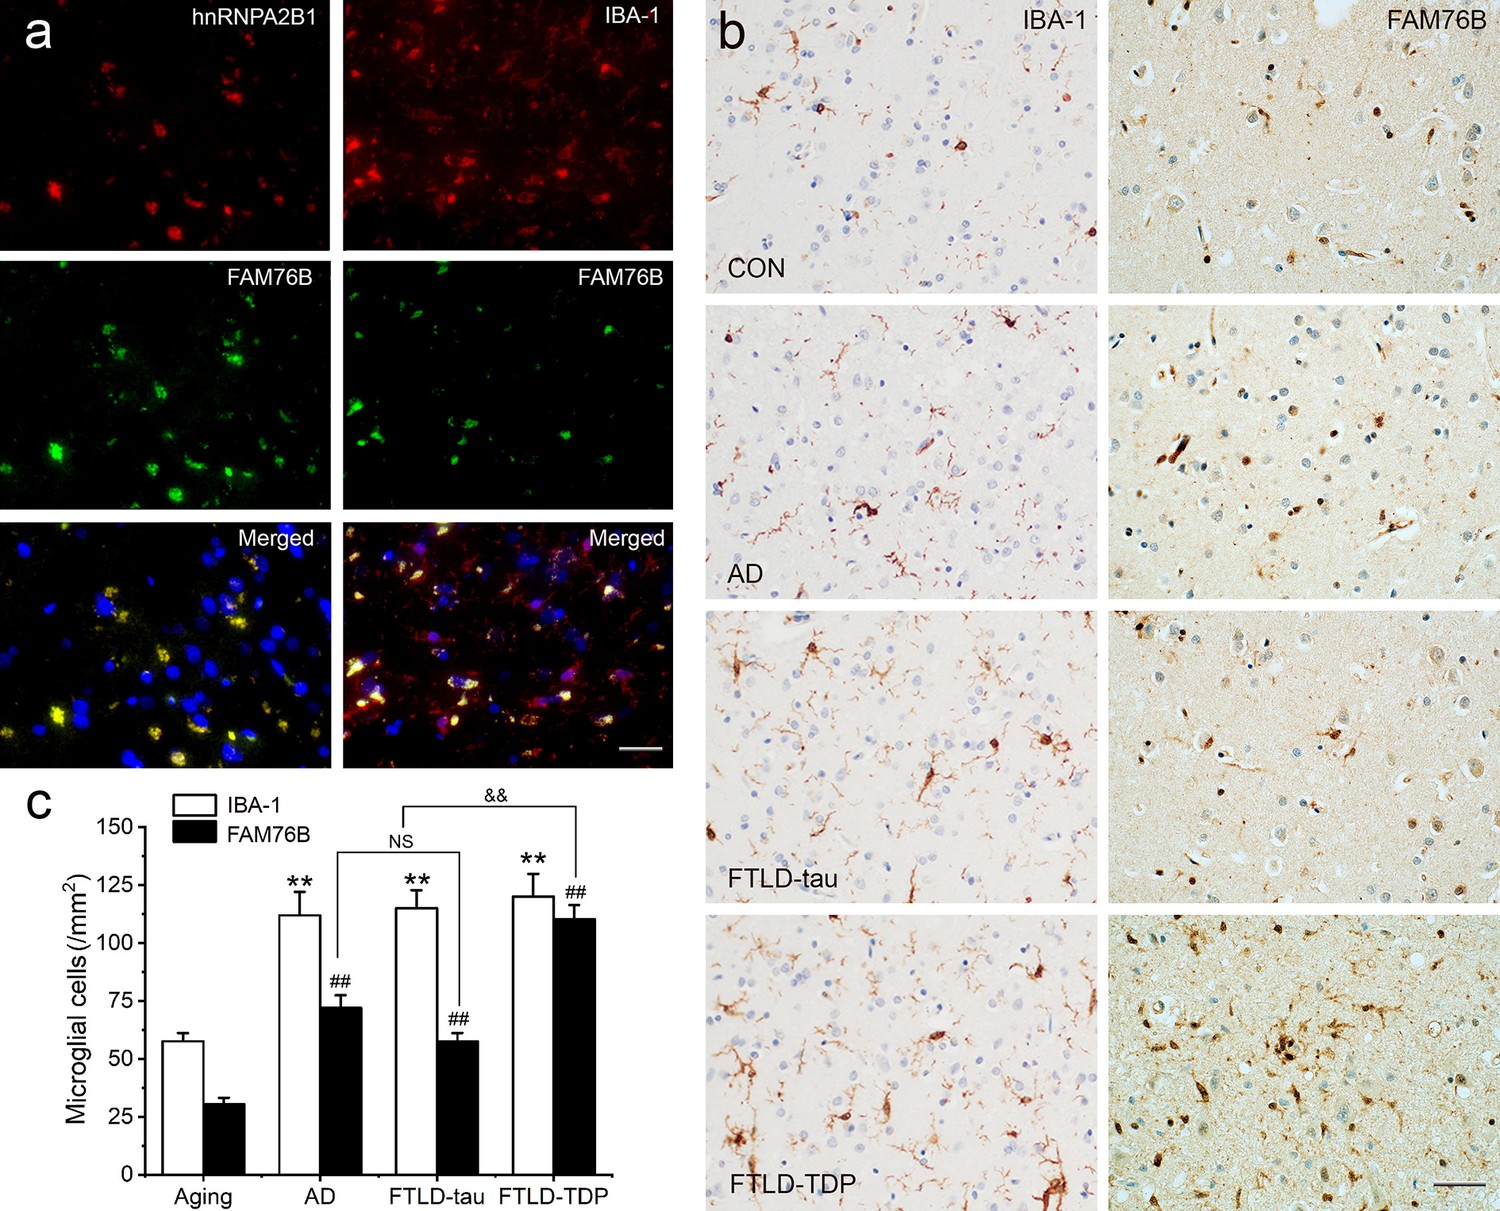
Persistent microglial FAM76B expression in neurodegenerative diseases.
(a) Immunofluorescent staining using the frontal cortex of an frontotemporal lobar degeneration with TAR DNA-binding protein 43 inclusions (FTLD-TDP) patient demonstrated that FAM76B co-localizes with IBA-1, while FAM76B co-localizes with hnRNPA2B1, in the cytoplasm of microglia. Scale bar, 50 µm. (b) Immunohistochemical stains revealed that the frontal cortex of Alzheimer’s disease (AD), frontotemporal lobar degeneration with tau pathology (FTLD-tau), and FTLD-TDP patients showed increased IBA-1- and FAM76B-positive microglia as compared to the control (CON). This increase in microglial FAM76B expression was more prominent in FTLD-TDP than in AD or FTLD-tau. Scale bar, 50 µm. (c) The density of IBA-1- and FAM76B-positive microglia in the frontal cortex of normal aging controls, AD, FTLD-tau and FTLD-TDP patients. Values are mean ± SD; n=5. The densities of IBA-1-positive microglia were compared between different groups by one-way ANOVA followed by the Tukey-honest significant difference (HSD) test (**p<0.01). Similarly, the density of FAM76B-microglia was compared between groups (##p<0.01). The ratios of FAM76B- to IBA-1-microglia densities were compared between different groups by Chi-square goodness-of-fit test (&&p<0.01). n.s., no significance.
Figure 10
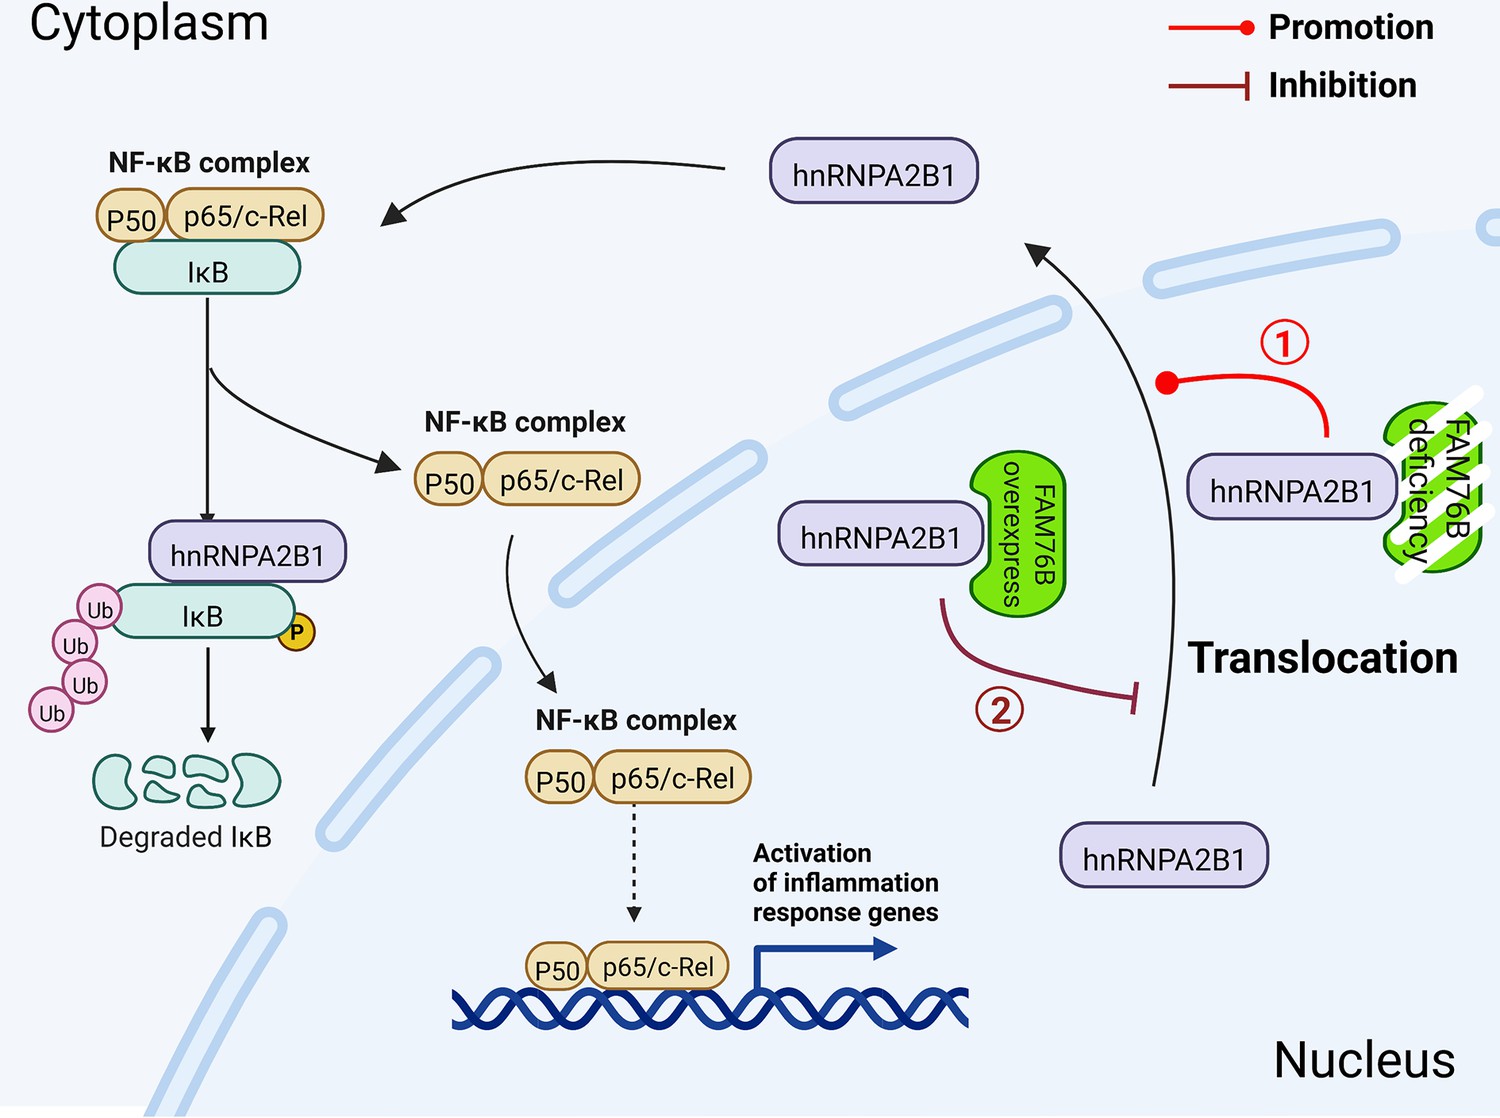
Schematic diagram of FAM76B regulating the NF-κB-mediated inflammatory pathway by affecting the hnRNPA2B1 translocation.
Under normal conditions, FAM76B could bind to hnRNPA2B1 and make hnRNPA2B1 stay in the nucleus. However, when the expression level of FAM76B was changed, the localization of hnRNPA2B1 was also changed, which then regulated inflammation in immune cells. ① When FAM76B expression was decreased or knocked out in the immune cells, more hnRNPA2B1 proteins translocated into the cytoplasm and led to increased NF-κB-mediated inflammation by the degradation of IKBα and p65’s entry into the nucleus. ② When FAM76B expression was increased in the immune cells, FAM76B could trap more hnRNPA2B1 in the nucleus and resulted in less cytoplasmic distribution of hnRNPA2B1 correspondingly, which led to the inhibition of NF-κB mediated inflammation due to the less degradation of IκBα and less entry of P65 into nucleus.
Additional files
-
Supplementary file 1
Proteins that interact with FAM76B and their interacting scores and ranks.
- https://cdn.elifesciences.org/articles/85659/elife-85659-supp1-v2.docx
-
Supplementary file 2
Primers used for real-time PCR.
- https://cdn.elifesciences.org/articles/85659/elife-85659-supp2-v2.docx
-
Supplementary file 3
Other primers used in the study.
- https://cdn.elifesciences.org/articles/85659/elife-85659-supp3-v2.docx
-
Supplementary file 4
Antibodies used in the study.
- https://cdn.elifesciences.org/articles/85659/elife-85659-supp4-v2.docx
-
Supplementary file 5
Patient demographics.
- https://cdn.elifesciences.org/articles/85659/elife-85659-supp5-v2.docx
-
MDAR checklist
- https://cdn.elifesciences.org/articles/85659/elife-85659-mdarchecklist1-v2.docx
Download links
A two-part list of links to download the article, or parts of the article, in various formats.
Downloads (link to download the article as PDF)
Open citations (links to open the citations from this article in various online reference manager services)
Cite this article (links to download the citations from this article in formats compatible with various reference manager tools)
FAM76B regulates NF-κB-mediated inflammatory pathway by influencing the translocation of hnRNPA2B1
eLife 12:e85659.
https://doi.org/10.7554/eLife.85659


