Dynamics and maintenance of categorical responses in primary auditory cortex during task engagement
- Laboratoire des Systèmes Perceptifs, Département d’Études Cognitives, École Normale Supérieure, PSL University,, France
- Laboratoire de Neurosciences Cognitives Computationnelle (INSERM U960), Département d’Études Cognitives, École Normale Supérieure, France
- Institute for System Research, Department of Electrical and Computer Engineering, University of Maryland, College Park, United States
Figures
Figure 1 with 3 supplements
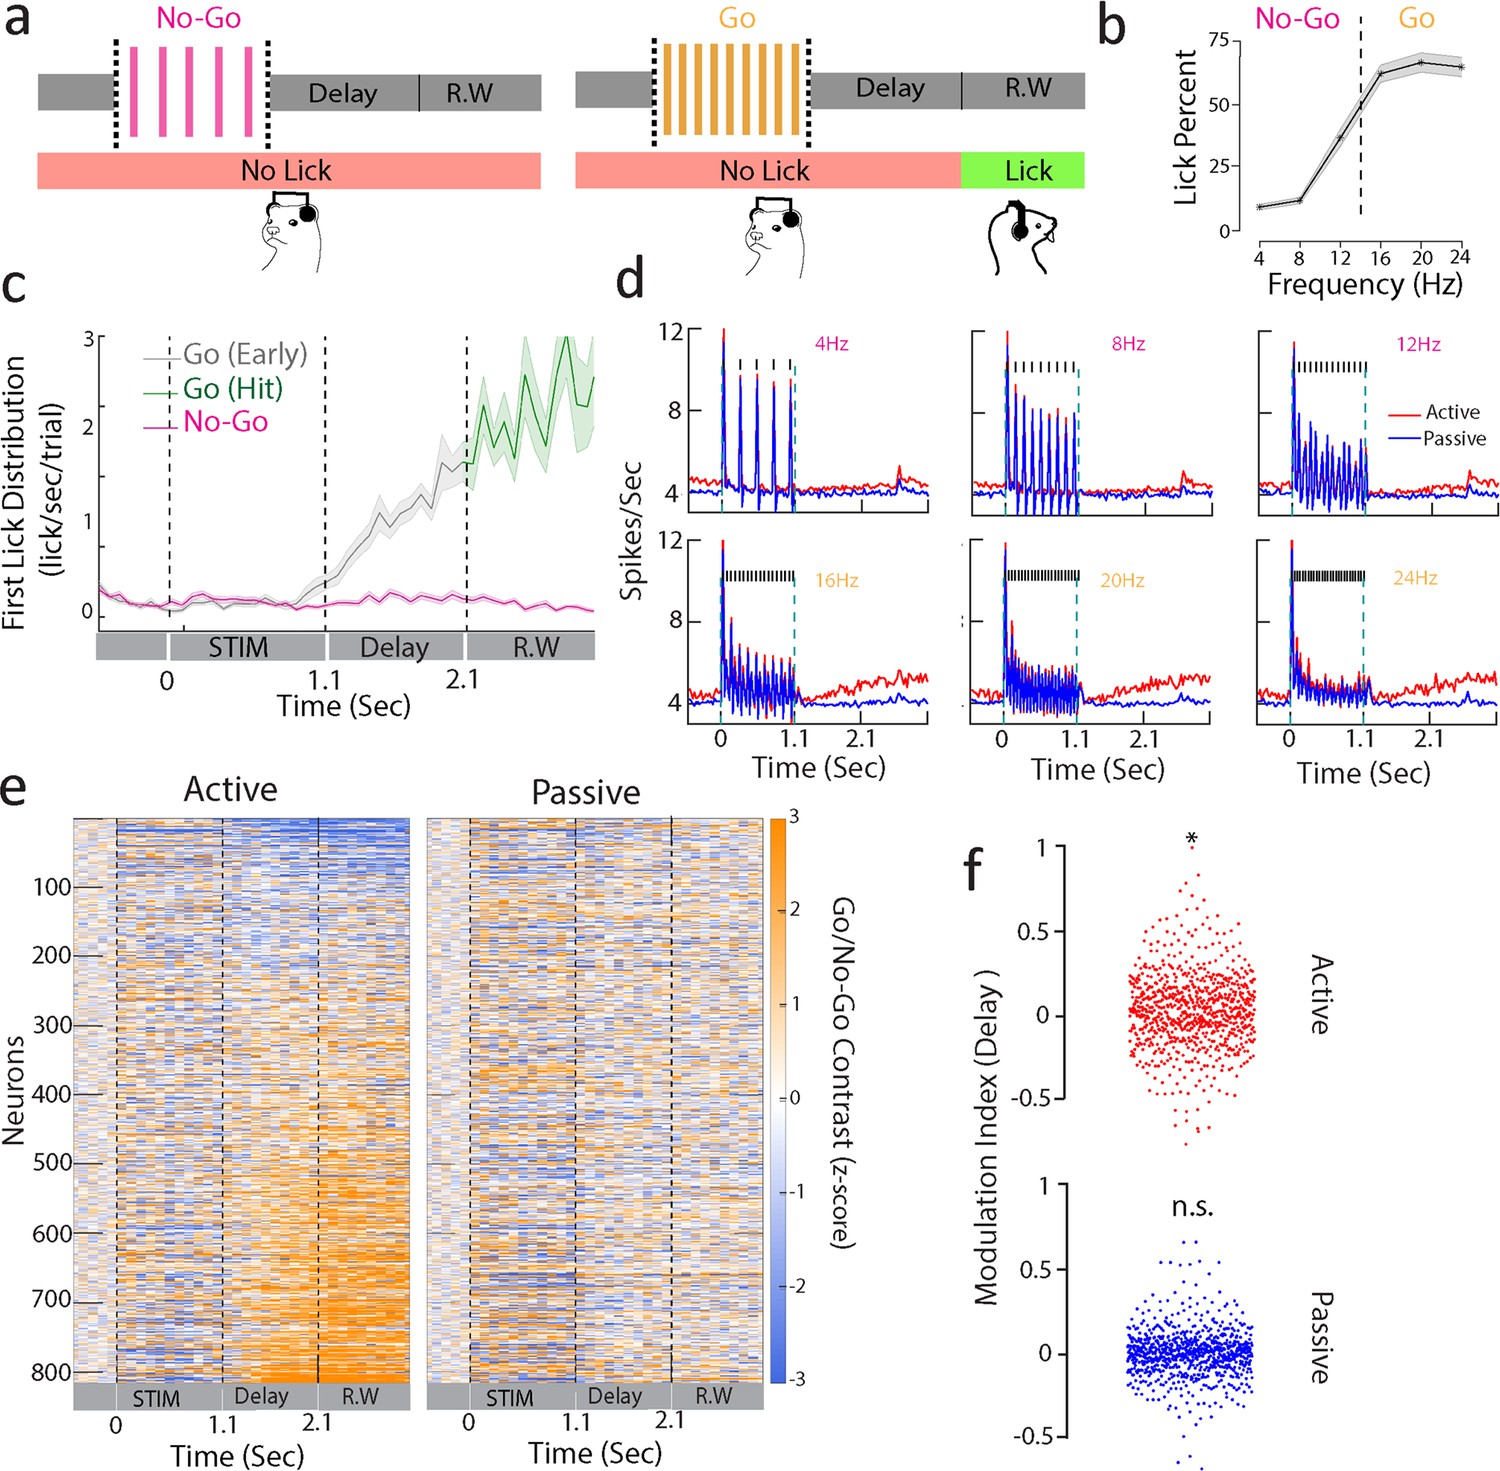
Sustained A1 activity during a delayed categorization task.
(a) Delayed categorization task. A trial starts with a 0.5 s of pre-stimulus silence followed by 1.1-s-duration click train stimulus. The animal must wait for a 1-s delay period before the 1-s-long response window (R.W.). Correct trials were rewarded with water while error trials and early trials (lick during delay period including sound period) were punished by a timeout. (b) Proportion of licks in response window for one of the animals (ferret P) with low rates as No-Go and higher rates as Go stimuli. Only non-early trials are considered. Shaded regions are SEM. (c) Temporal profile of first lick rate. Shaded regions are SEM. (d) Average PSTHs of all neurons from ferret P corresponding to passive (blue curve) and active (red curve) states for each of the click trains (only correct behavioral trials were used, i.e., correct rejections for No-Go and hits for Go sounds). Note that the response during the delay period is enhanced for Go stimuli (16, 20, 24 Hz). (e) Contrast (Go – No-Go firing rate) computed for neurons of both animals (n = 816 units) in passive (right) and active (left) states (z-scored with pre-stimulus baseline activity). Neurons were ranked by delay firing rate for Go active trials. (f) Modulation index (see ‘Methods’) with respect to spontaneous activity during delay (1.1–2.1 s) period for active and passive states (t-test *p<0.05; n = 816 units from both ferrets).
Figure 1—figure supplement 1
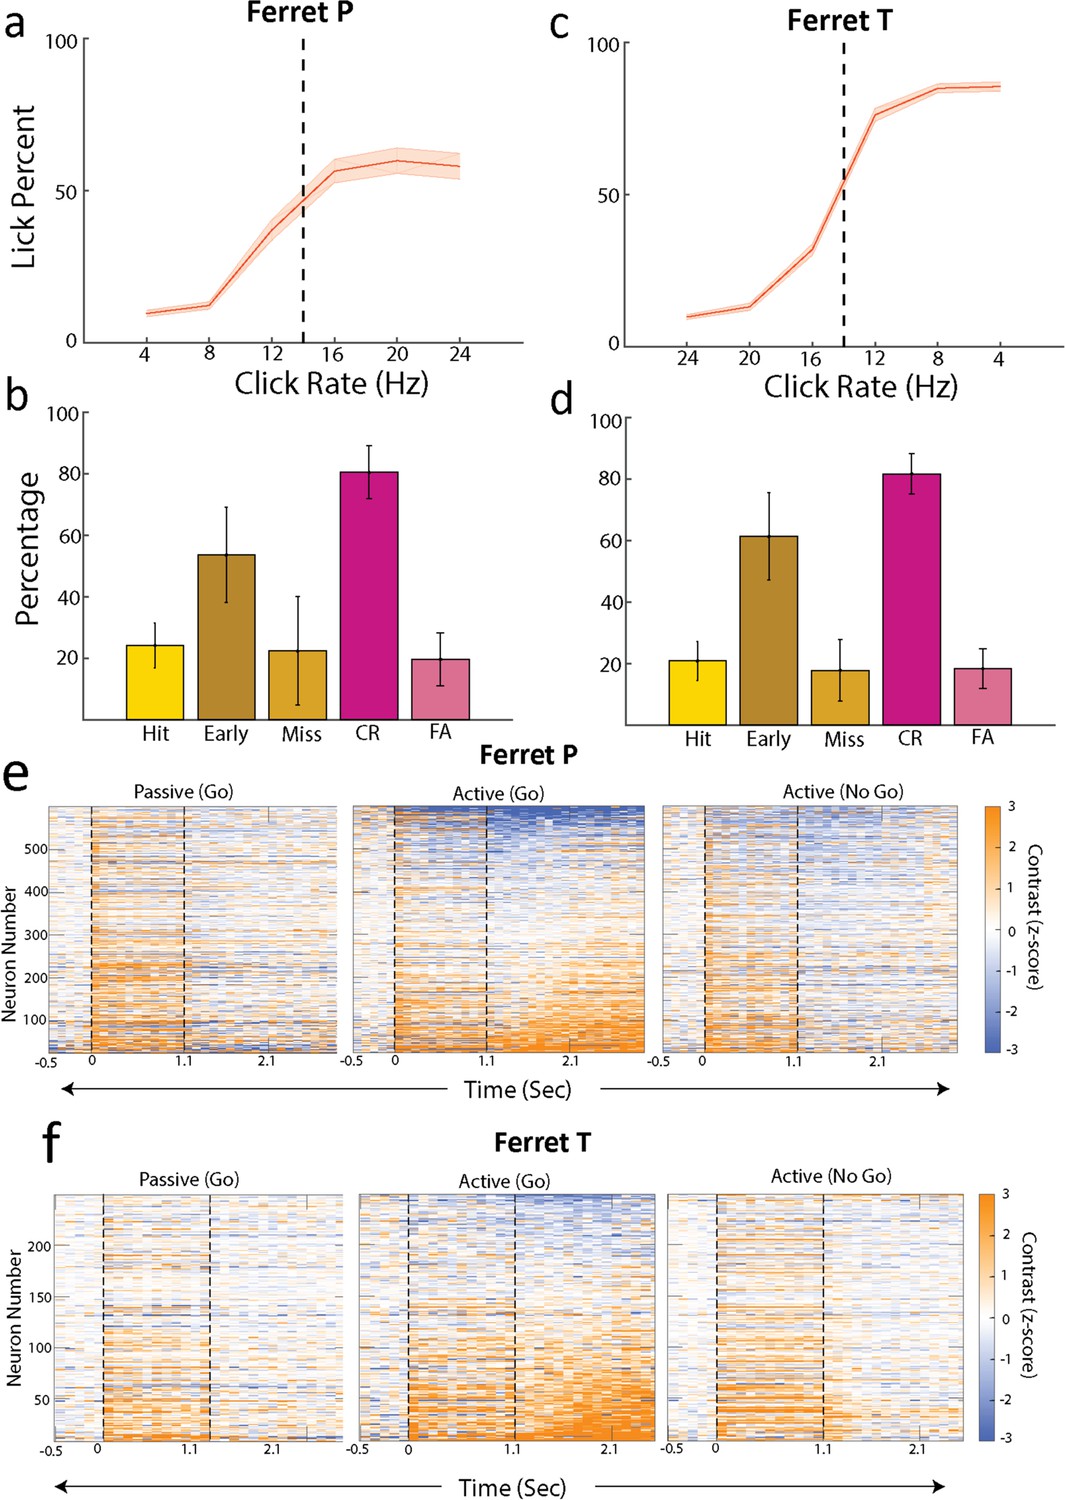
Behavioral performance and sustained responses for all animals.
(a) Psychometric curves. (b) Average percentage of trials in recording sessions. (d) Sustained activity for ferret P. (c, d, f) Same as (a, b) and (e) for ferret T.
Figure 1—figure supplement 2
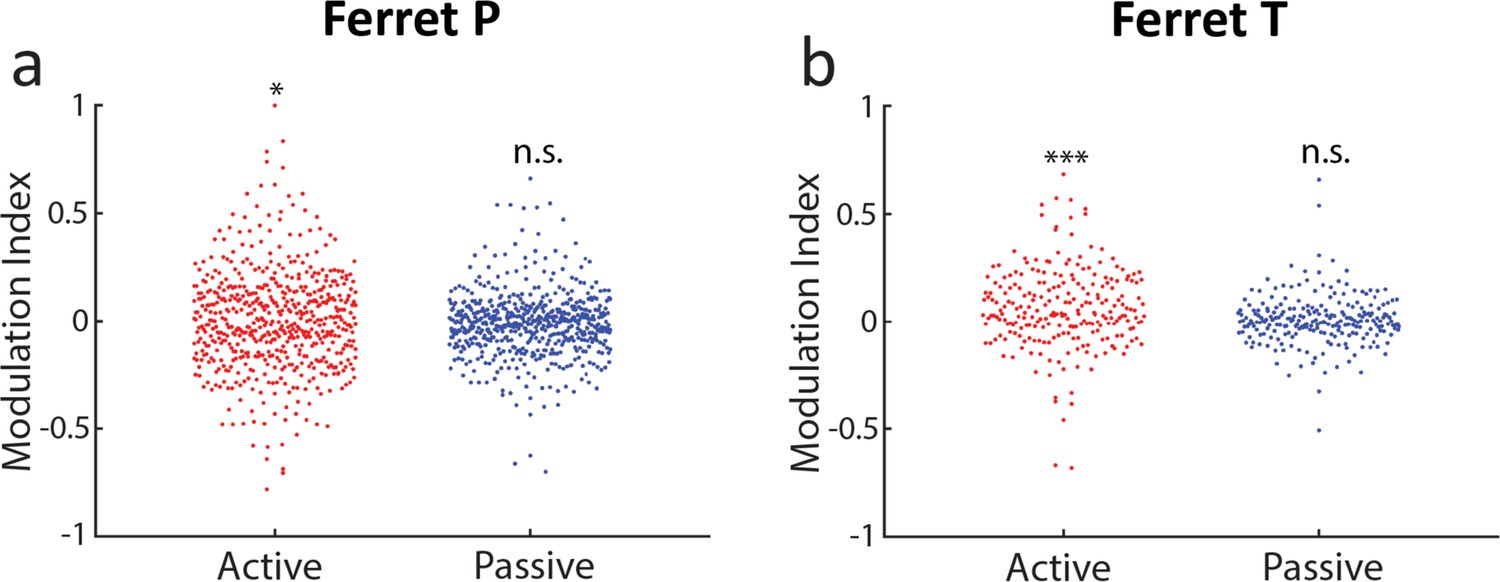
Modulation index for delay activity in (a) ferret P and (b) ferret T (*** p<0.001, * p<0.05).
Figure 1—figure supplement 3
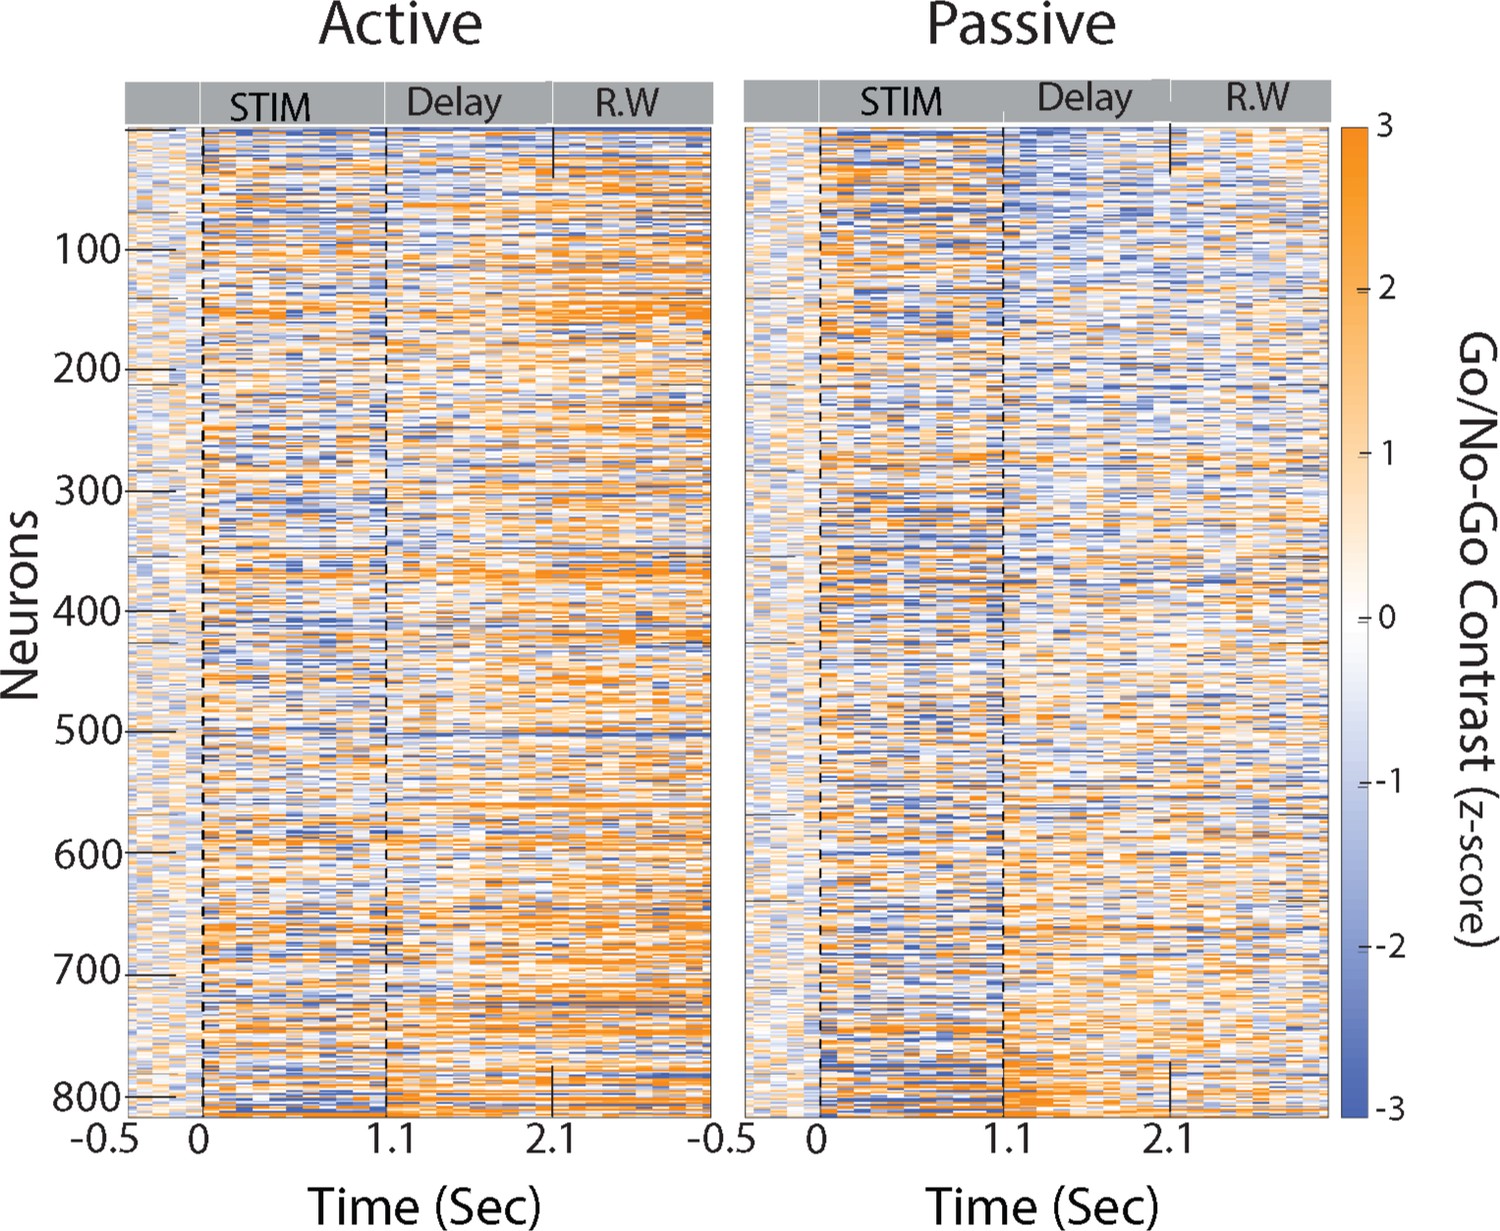
Difference in average firing rate between Go and No-Go correct trials computed for neurons of both animals (n = 816 units) in active (left) and passive (right) states (z-scored with pre-stimulus baseline activity).
Neurons were ranked by delay firing rate for Go trials during passive listening.
Figure 2 with 5 supplements
Emergence of categorical information from primary auditory cortex during stimulus presentation.
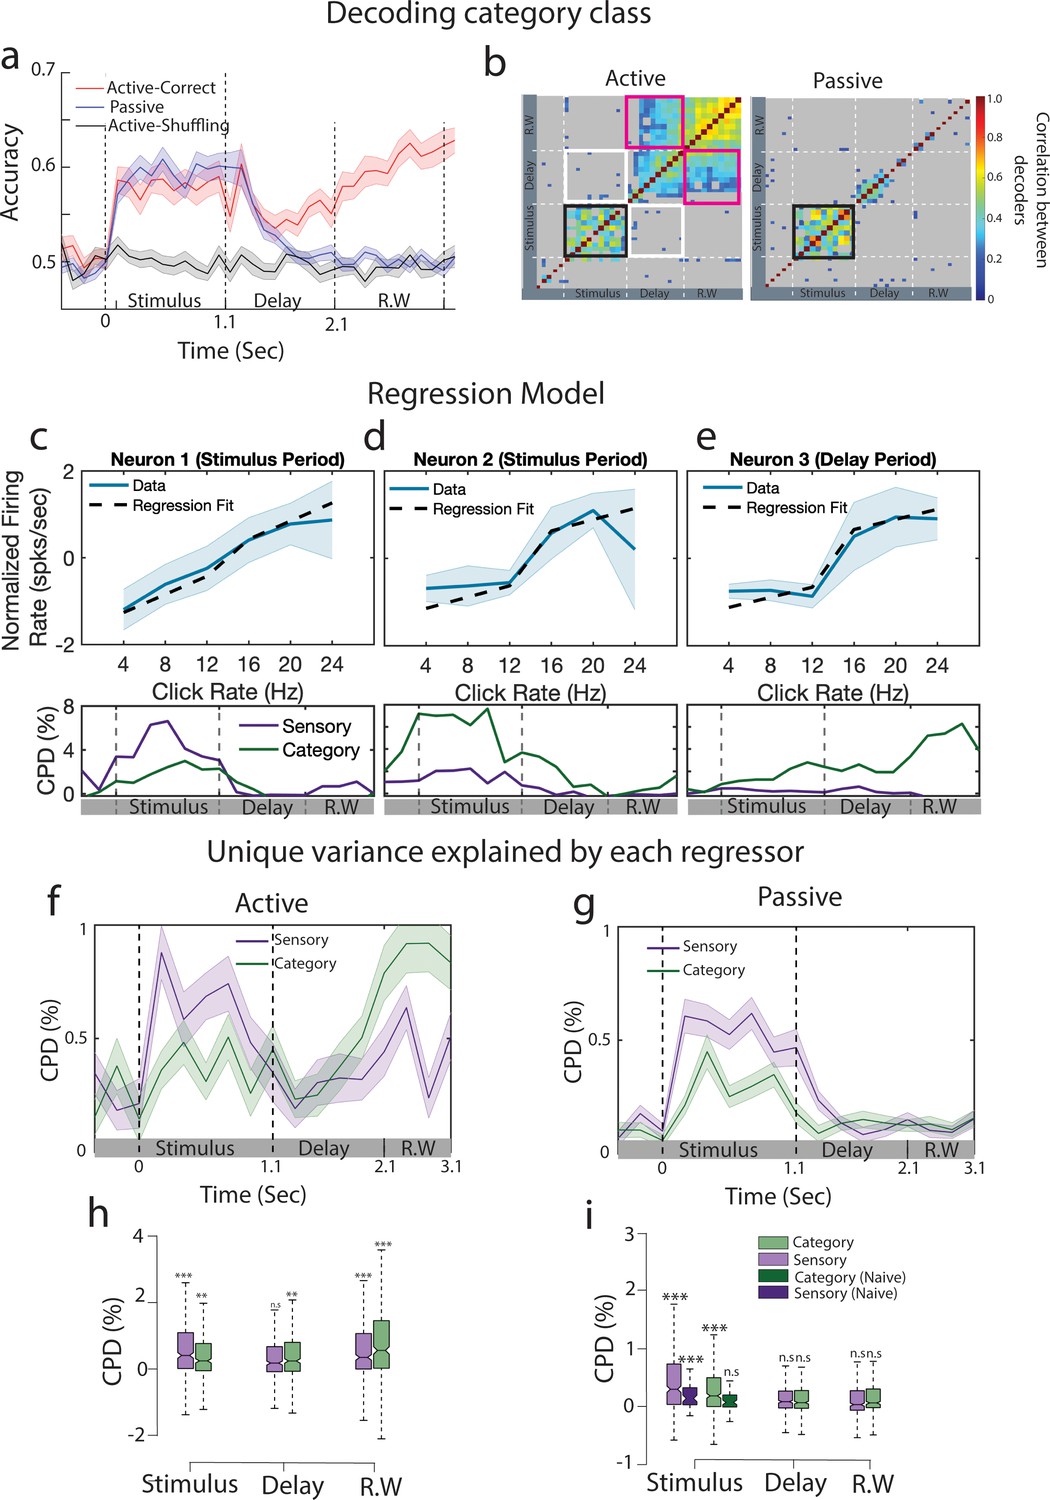
(a) Go vs No-Go classification performance in active (red curve) and passive (blue curve) conditions (n = 35 sessions from ferret P). Gray curve indicates the performance by shuffling labels for the task-engaged condition. Error bars show 1 SD. The dashed lines separate stimulus, delay, and response window (R.W.) periods. (b) Cross-correlation matrix between decoders trained at different time points for task-engaged (left) and passive (right) data. Nonsignificant correlations are shown in gray. Significance was assessed by permutation test (200 permutations). Black frame shows the significant cross-correlation during the stimulus period. White frames show absence of correlation between decoders trained during the stimulus and the delay period. Similarly, pink frames correspond to correlation of stimulus and response window decoders. (c) Example neuron showing sensory encoding during sound period, firing rate plotted as a function of click rates (blue curve, error bars show 1 SD over trials). Prediction from the regression model are overlaid (dashed line) (CPDsensory,stimulus = 0.07 ± 0.02/CPDcategory,stimulus = 0.02 ± 0.01). Time course of coefficient of partial determination (CPD) is shown below. (d, e) Same as (c) for example neurons mostly tuned to categories during the stimulus (d, CPDsensory,stimulus = 0.02 ± 0.01/CPDcategory,stimulus = 0.05 ± 0.01) or delay (e, CPDsensory,delay = 0.00 ± 0.01/CPDcategory,delay = 0.02 ± 0.01) periods. (f) CPD computed by fitting linear regression models in active state (n = 395 neurons from ferret P). Shaded region represents 1 SEM over all the neurons. (g) Same as (f) for passive state. (h) CPD computed during the stimulus, delay, and response window time epochs. Significance is tested against pre-stimulus period value (two-tailed t-test ***p<0.001, n = 395 neurons from ferret P). (i) Same as (h) for passive state. CPD computed from a naive animal is added in the stimulus period for comparison.
Figure 2—figure supplement 1
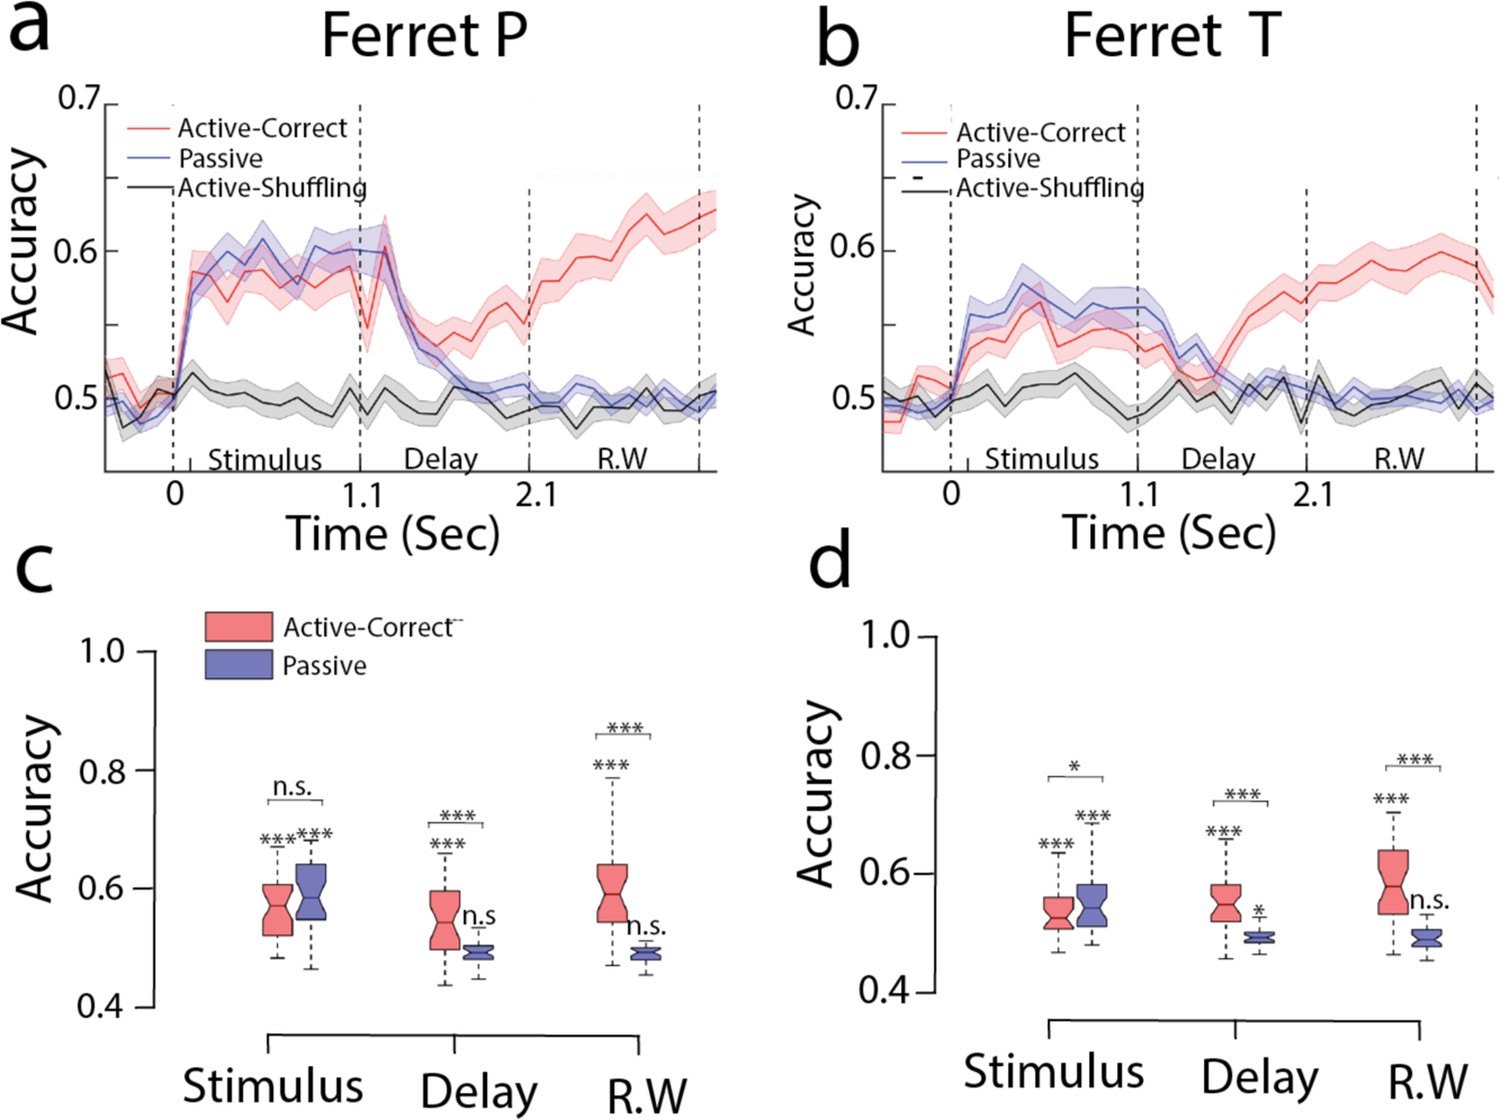
(a,c) Decoding accuracies for passive (blue) and active (red) states for ferret P (n=35 sessions). (b,d) Decoding accuracies for passive (blue) and active (red) for ferret T (n=39 sessions).
Window periods used for computing accuracies in (c, d) are stimulus period (0-1.0 s), Delay period (1.4-2.1 s) and Response window (2.1-3.1 s).
Figure 2—figure supplement 2
Decoding accuracy in naive animals.
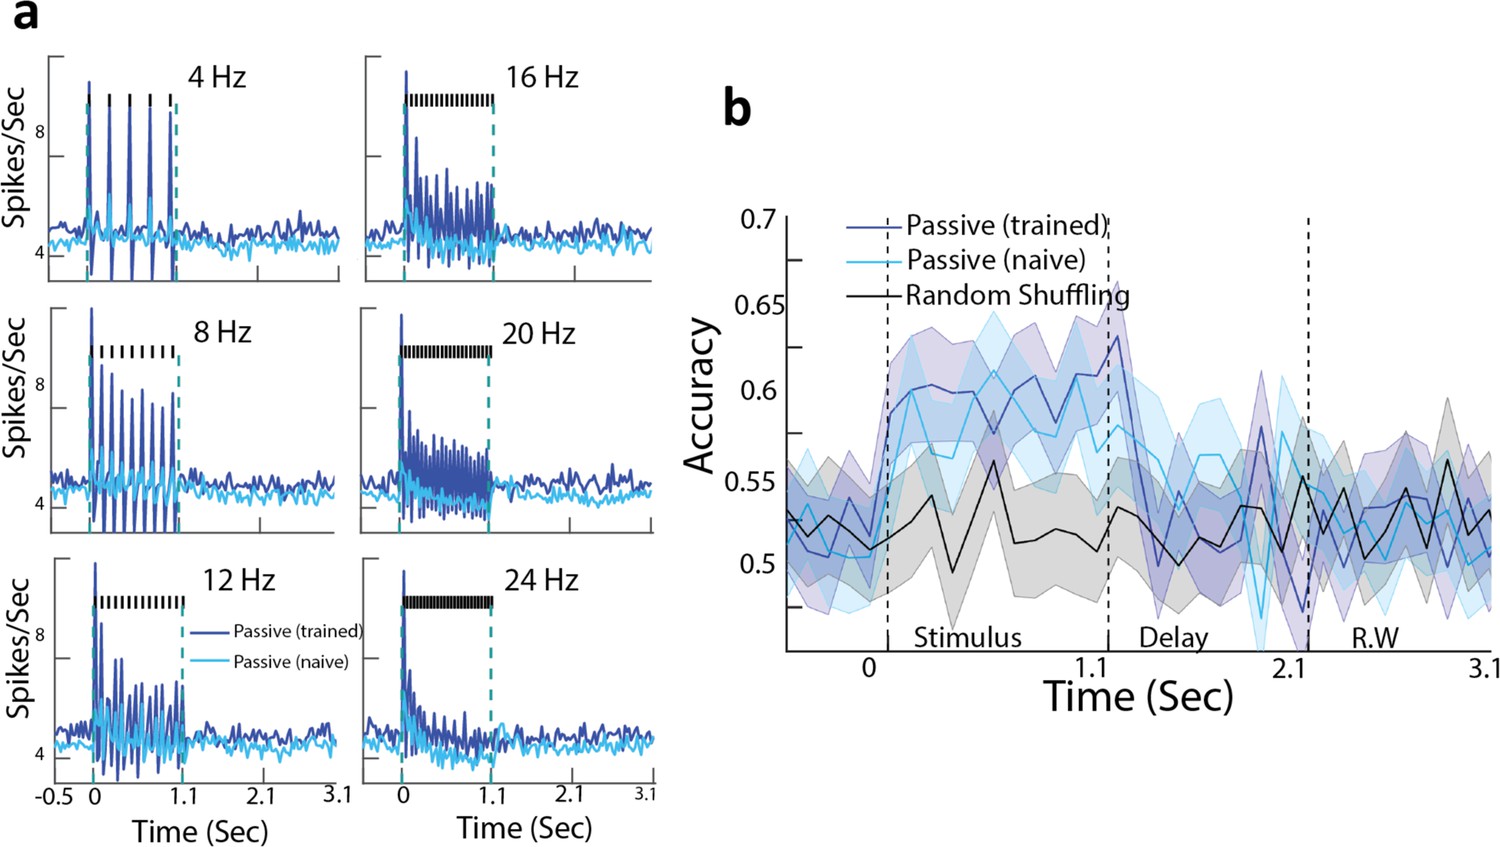
(a) Population-averaged PSTHs for passive listening and (deep blue) and in naive animals (light blue). (b) Decoding performance for naive animals. Gray curve indicates the performance by shuffling labels in task engagement. Error bars are 1 SD over 200 cross-validations. Neuron number is balanced while computing the decoders for trained and naive animal (n = 71 units).
Figure 2—figure supplement 3
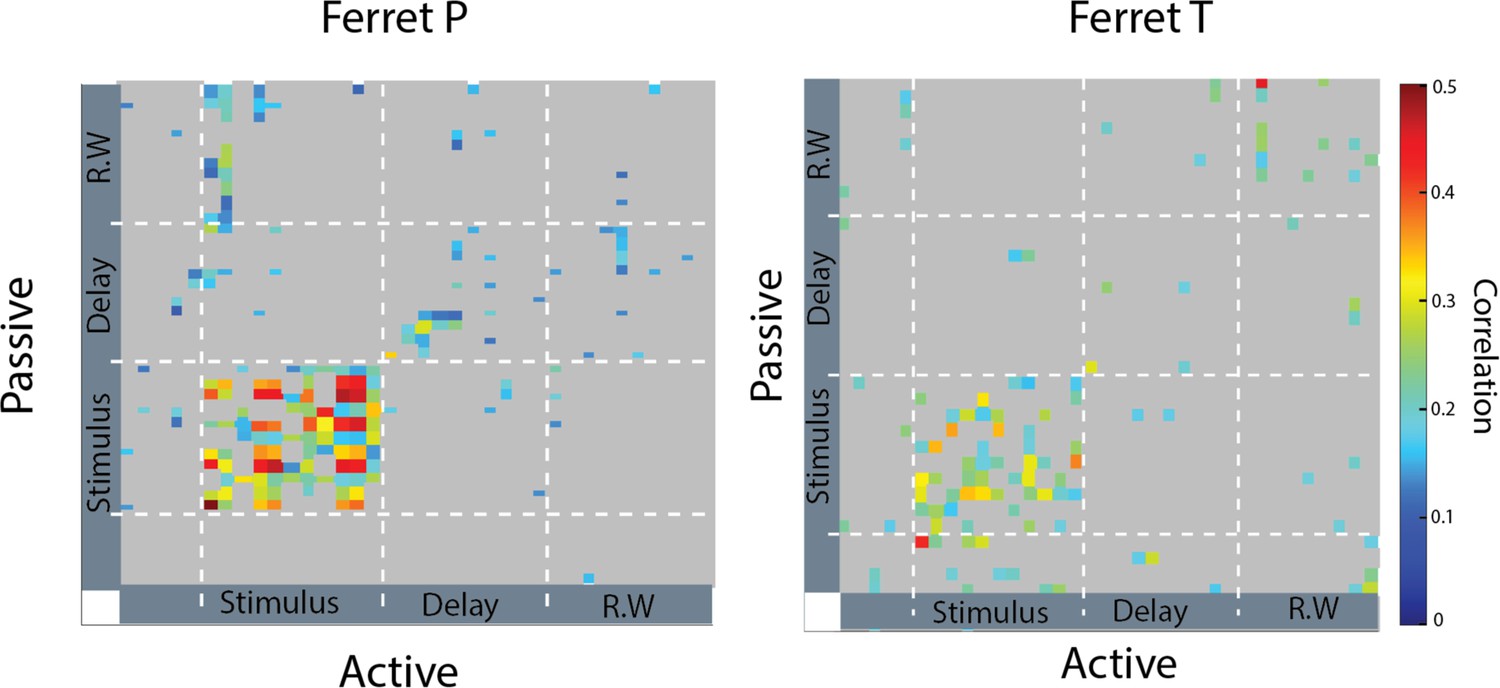
Correlation of passive and task-engaged decoders for ferrets P and T.
Figure 2—figure supplement 4
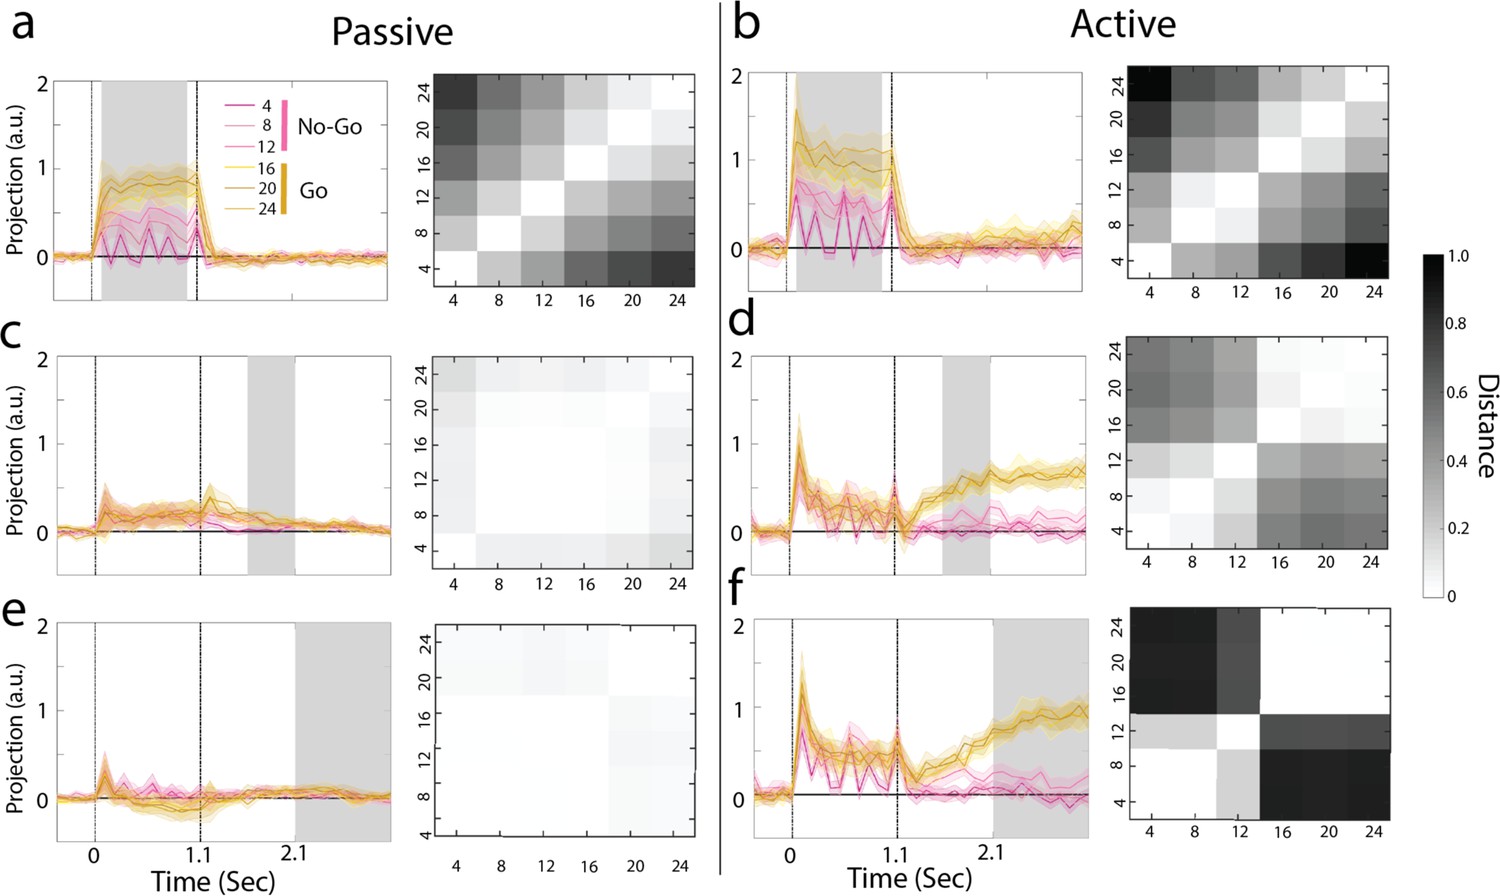
Projection of each click rates onto linear decoders.
(a, c, e) Projection of trial-averaged activity of each of the category stimuli onto the passive decoders trained at different time epochs (i.e., stimulus, delay, and response window). The gray shaded region indicates the time at which the decoder was trained. Right panels show the distance matrix between successive stimulus pairs. (b, d, f) Same as (a, c, e) for active behavior.
Figure 2—figure supplement 5
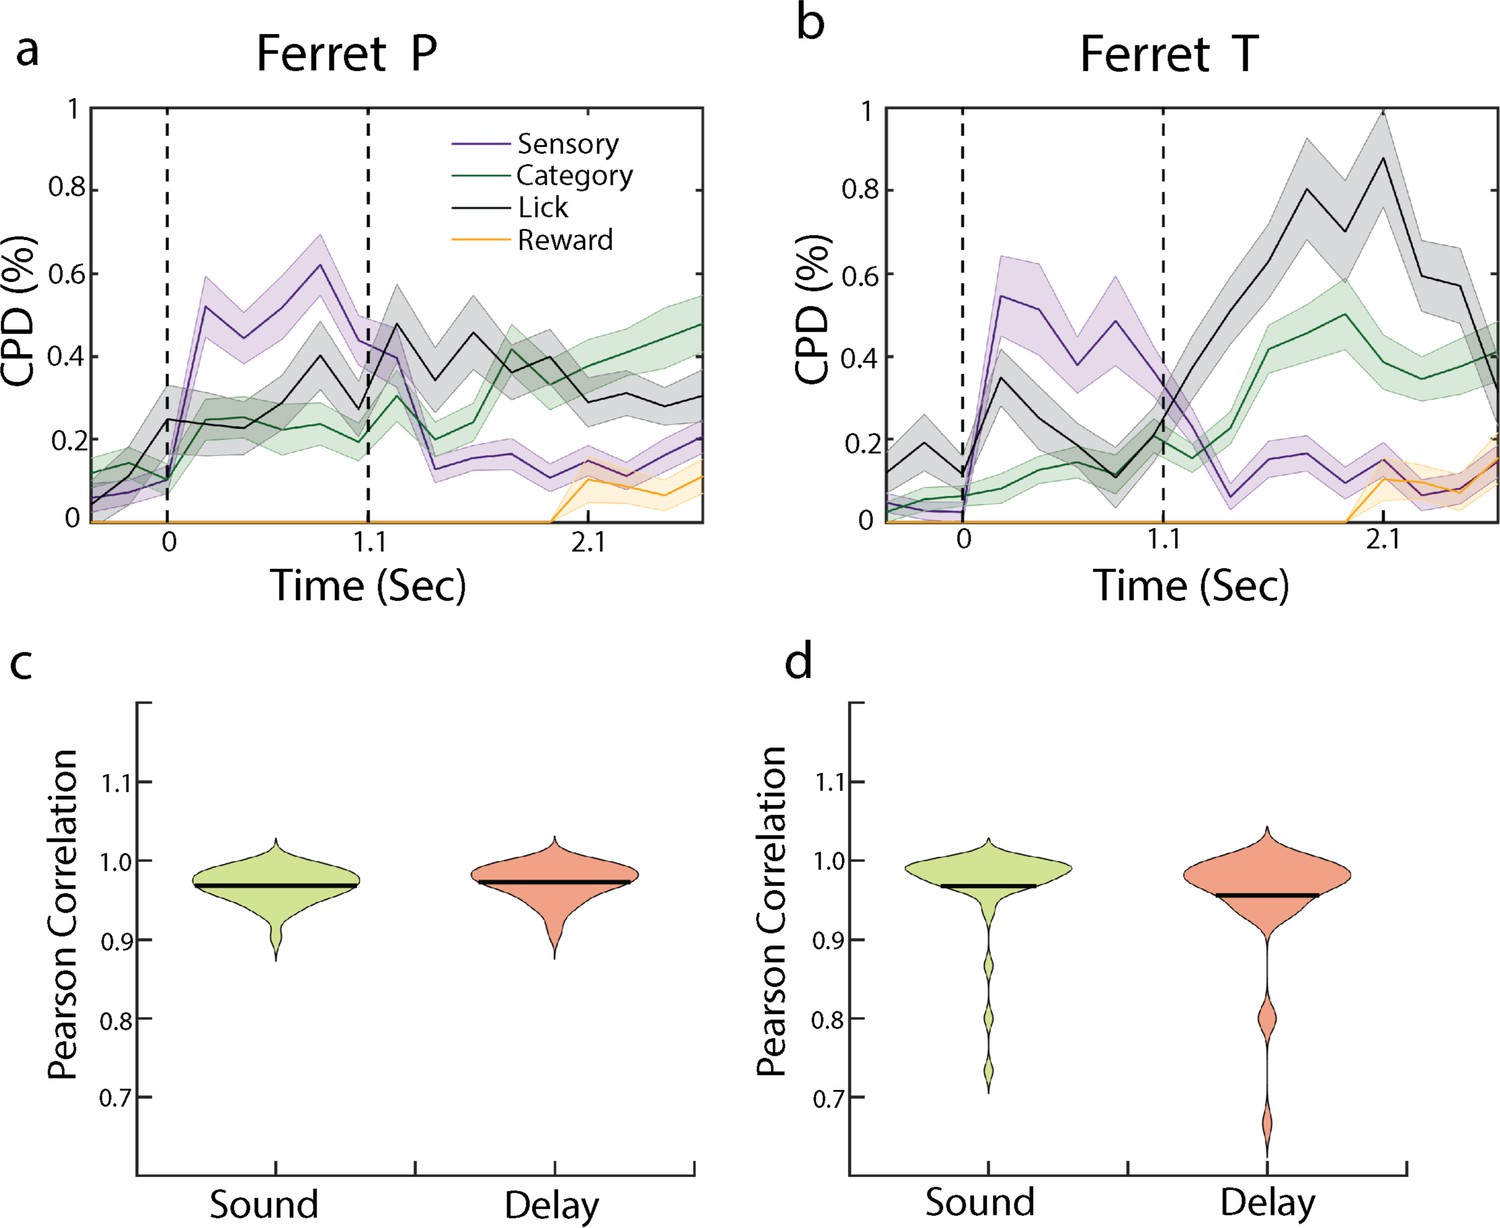
Regression model supplemented with licks and reward.
(a, b) Coefficient of partial determination (CPD) obtained using other task variables for ferret P (a) and ferret T (b). (c, d) Correlation between regressors with two and four regressor values. Plotted here is the Pearson correlation between category weights when linear regression is performed with two (sensory and category) and four (sensory, category, lick, and decision) regressors for ferret P (c) and ferret T (d).
Figure 3 with 3 supplements
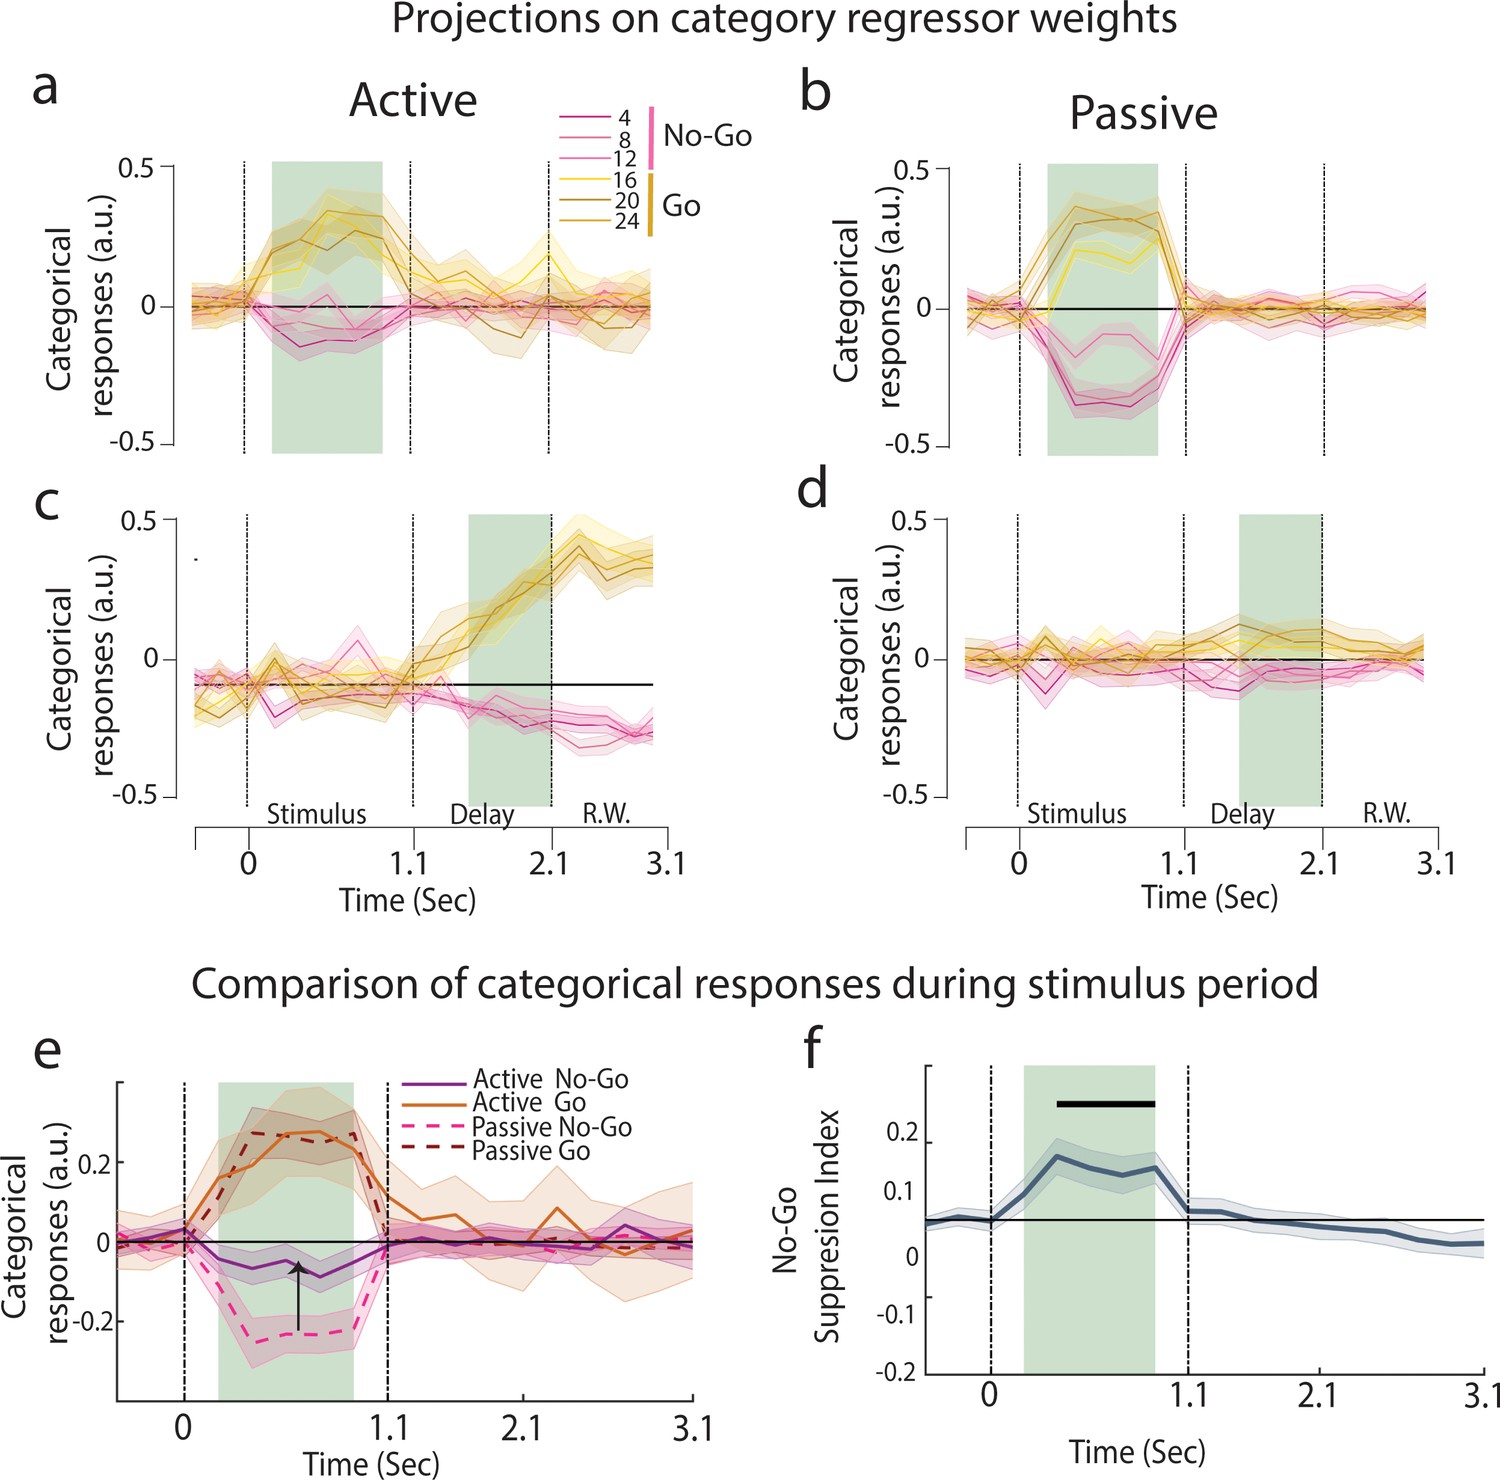
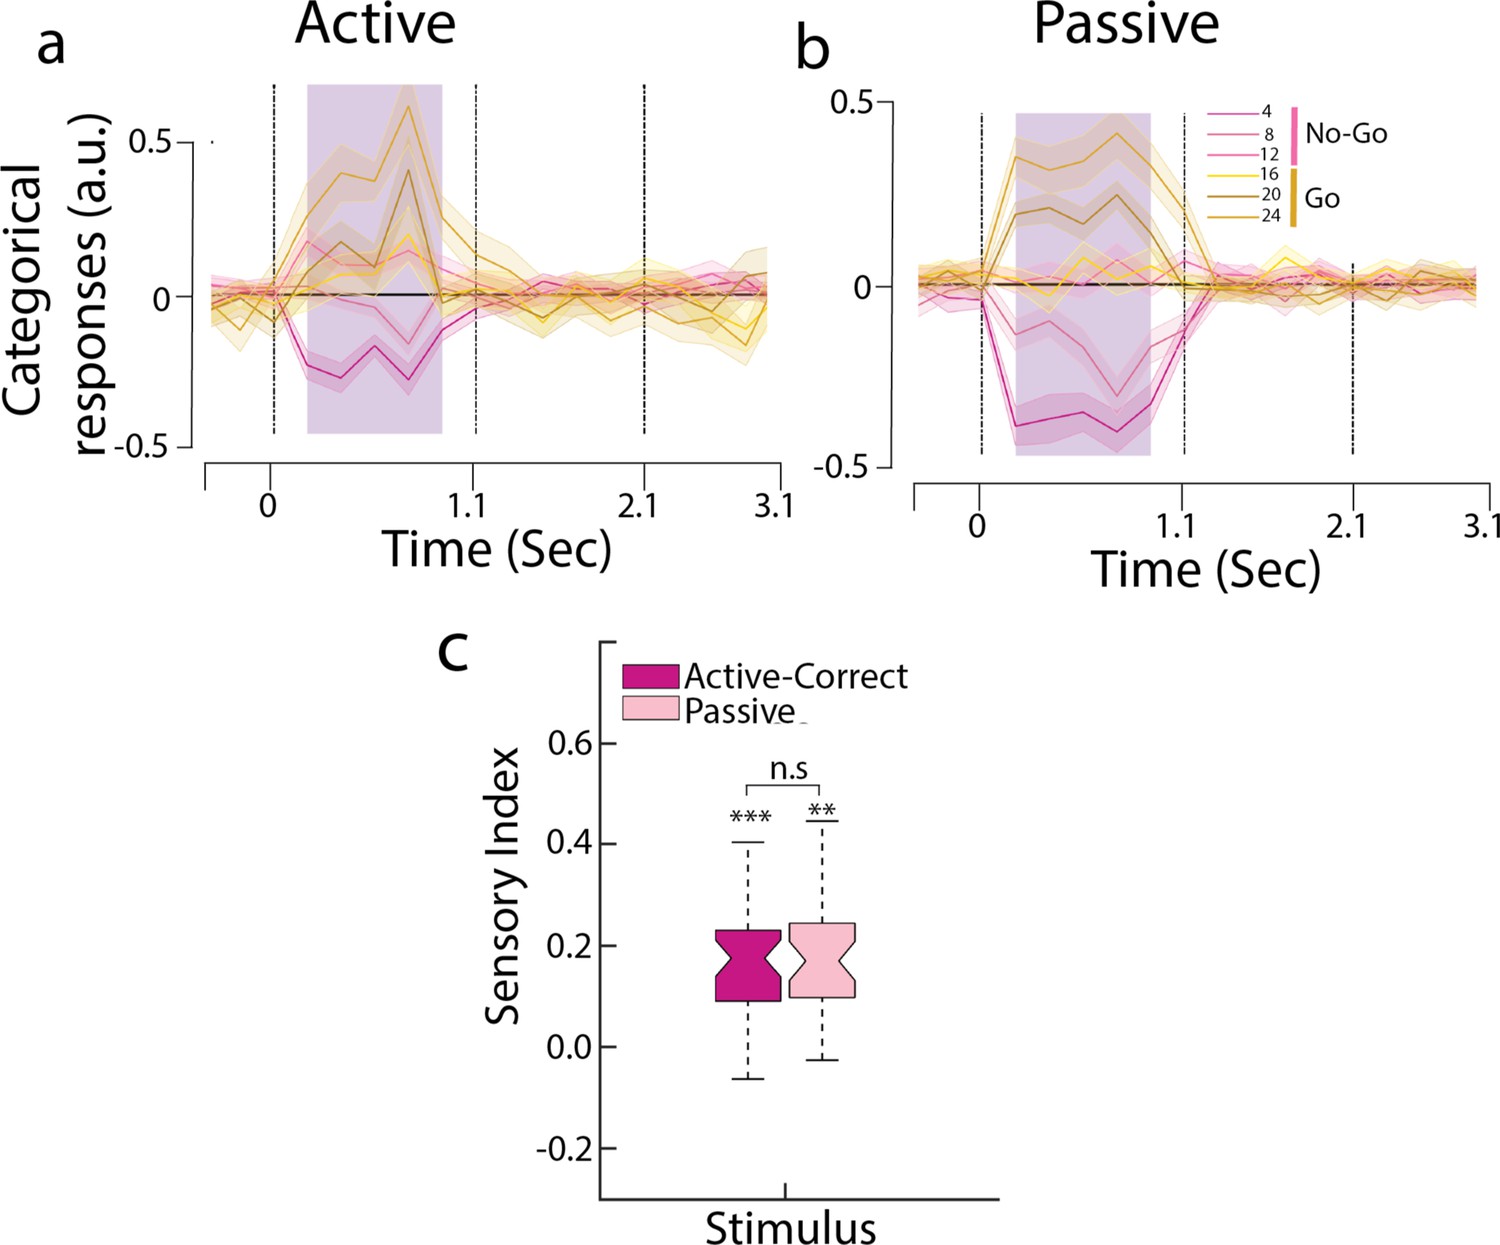
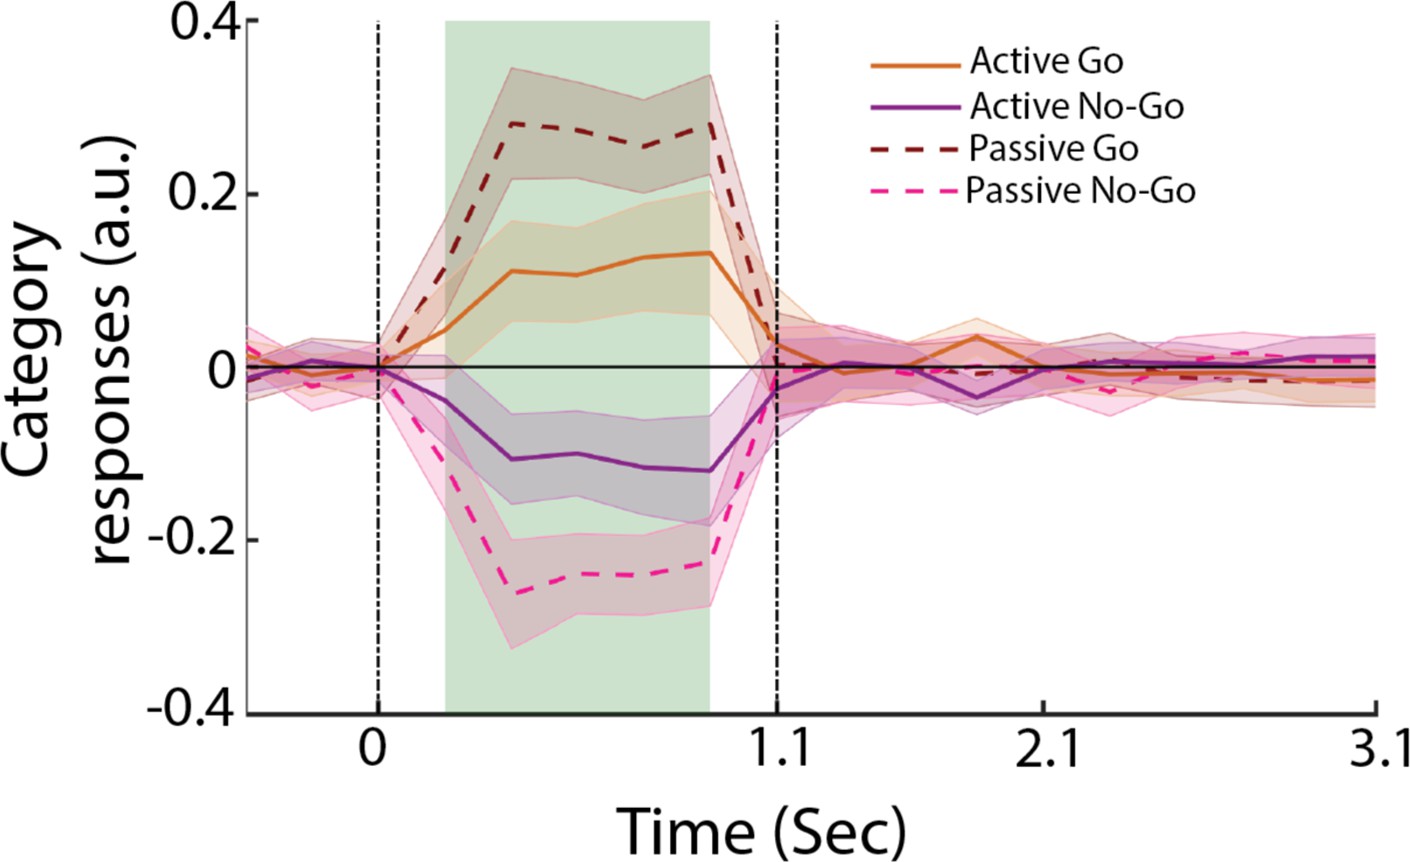
Emergence of categorical representation through suppression of No-Go sounds.
(a–d) Projection of trial-averaged activities of individual click rates onto category axis trained at different time epochs (n = 35 sessions from ferret P). The shaded regions show training time and the error bars are ±2 SEM over sessions. (a, c) are active and (b, d) are passive states. See Figure 3—figure supplement 2 for graded sensory responses to the different stimuli. (e) Categorical responses for passive and active states (n = 35 sessions from ferret P; Figure 3—figure supplement 1d for ferret T). (f) Time course of No-Go suppression in categorical responses (difference between the absolute value of passive and active No-Go categorical responses highlighted in e). Black bar represents the significant period (p<0.05, t-test n = 35 sessions).
Figure 3—figure supplement 1
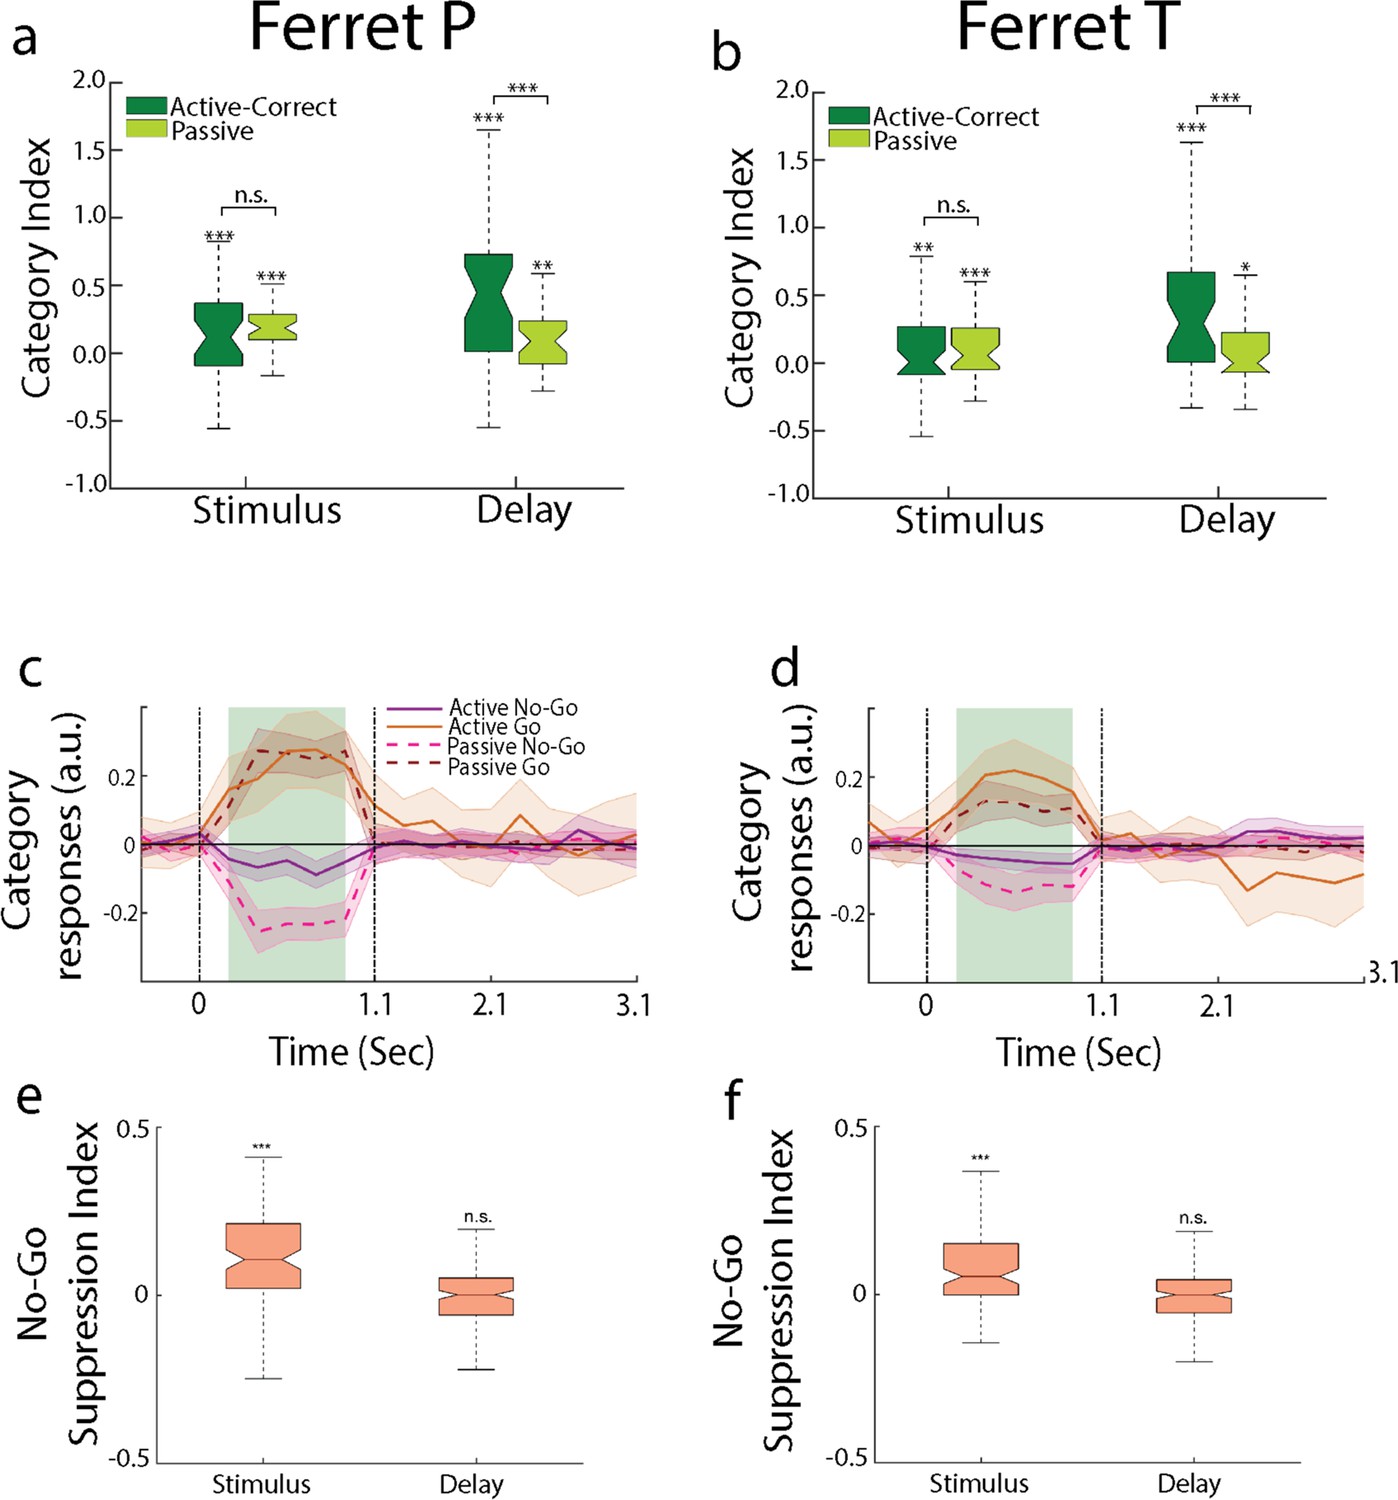
No-Go suppression in all animals.
(a, b) Category index for ferrets P and T. (c, d) Projection of trial-averaged activities of passive and active states onto the category axis for ferrets P (c) and T (d). (e, f) No-Go suppression index (***p<0.001, *p<0.01, *p<0.05).
Figure 3—figure supplement 2
Projection of trial-averaged activity onto sensory regressor weights.
(a, b) Projection of trial-averaged activity onto sensory regressor weights trained at stimulus time epoch. (a) Active and (b) passive states. (c) Sensory index as quantified by projection distance between successive click rates onto the sensory regressor weights (***p<0.001 using permutation test for individual boxes).
Figure 3—figure supplement 3
Projection onto category neural axis extracted from the task-engaged condition for passive and active states.
Note that Go and No-Go sounds are symmetrically laid out around baseline projections.
Figure 4 with 3 supplements
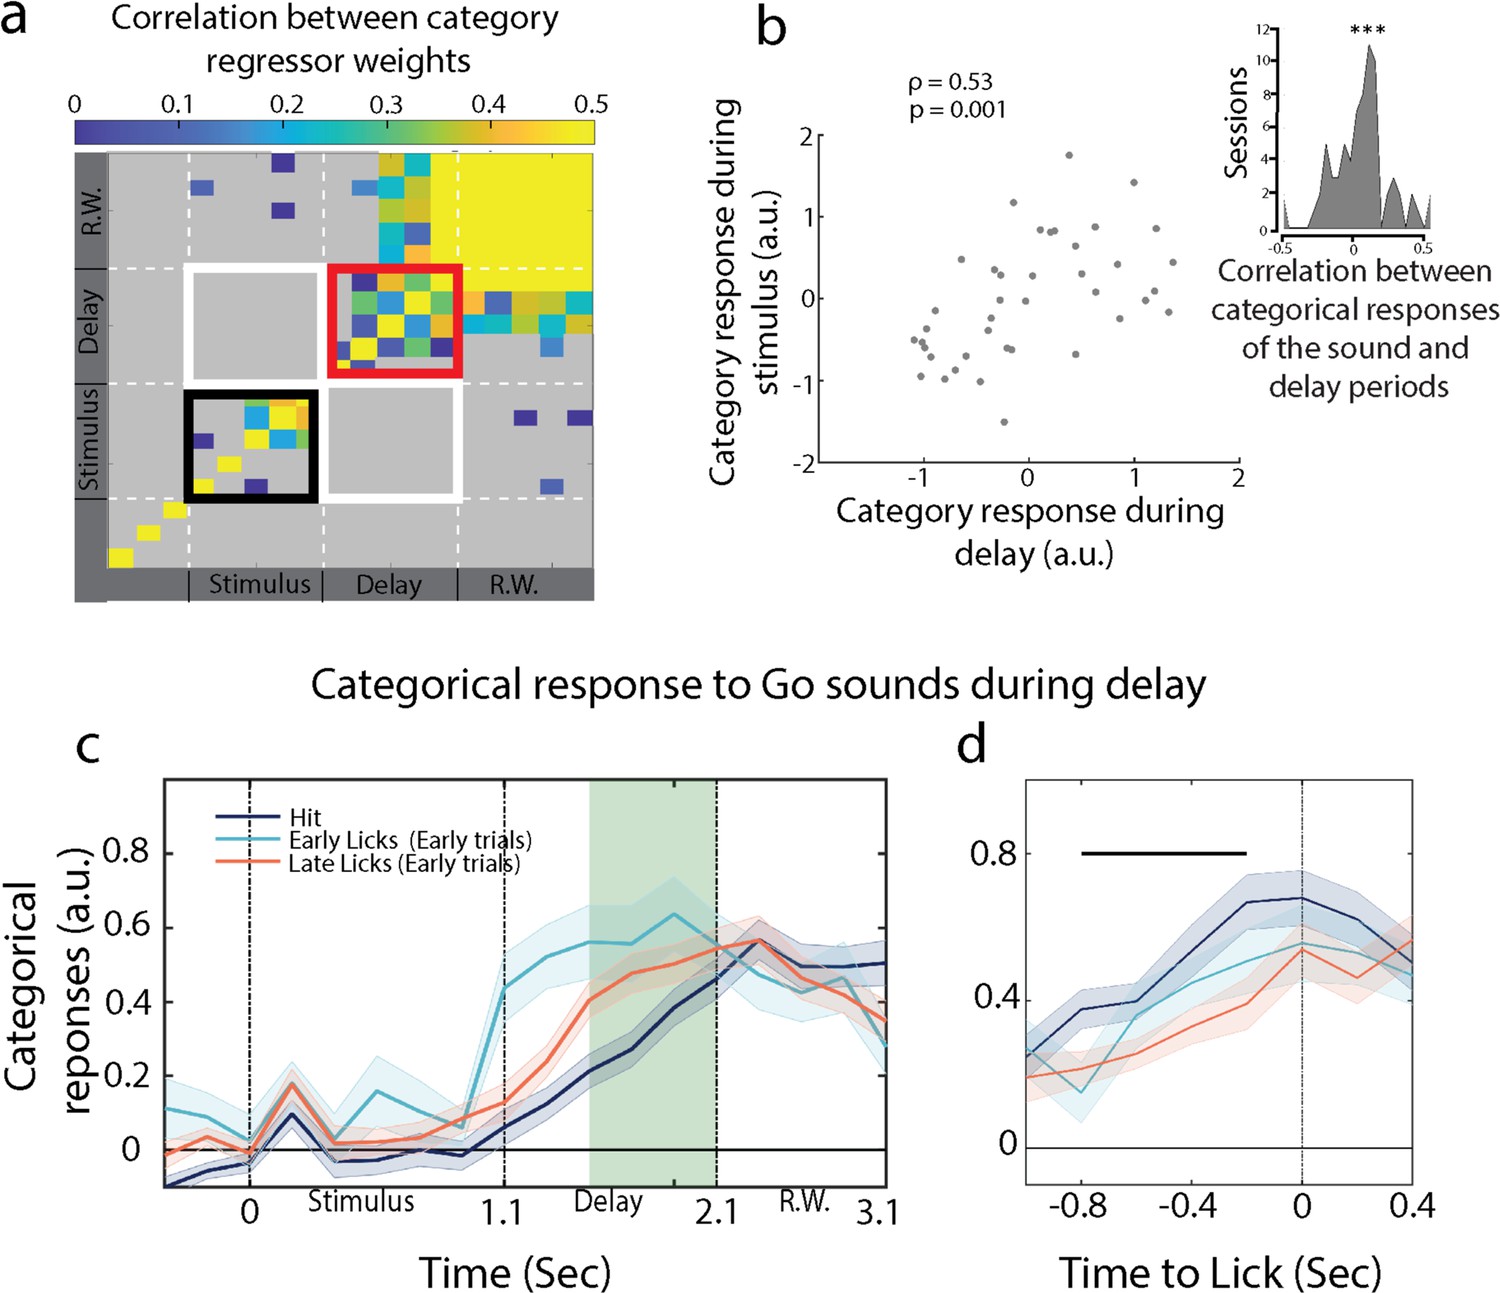
Post-stimulus anticipatory activity correlates with categorical representation during the sound.
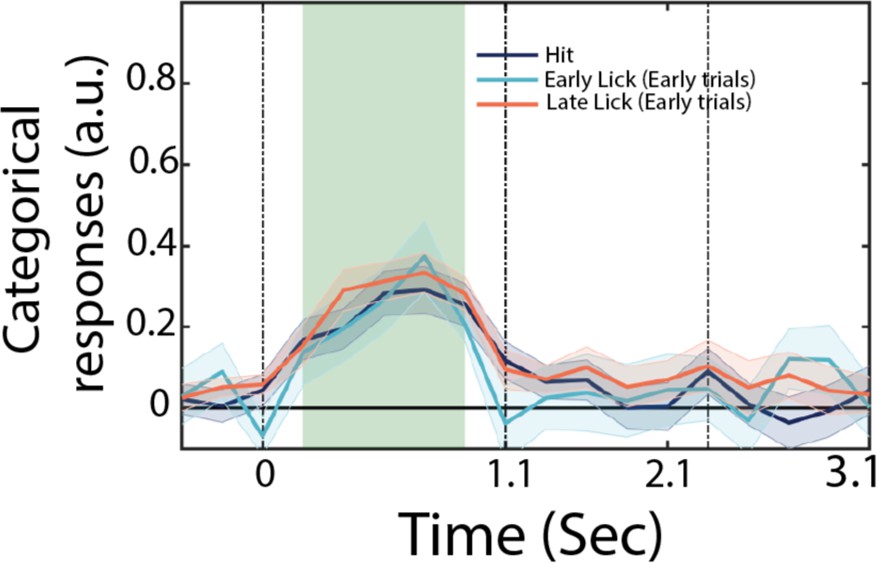
(a) Temporal evolution of the category axis (n = 35 sessions from ferret P). (b) Scatter plot for categorical response during stimulus and delay period for one session. Inset: correlation of single-trial categorical responses between the sound and delay periods (n = 74 sessions from both ferrets). (c) Categorical responses for hit, early trials with licks in the early (early licks) and late (late licks) phases of the delay period. (d) Lick-aligned categorical responses. Projections were not different between hit and early trials at lick time (see outcome decoding in Figure 4—figure supplement 3). The black bar represents the significant period (p<0.05, t-test).
Figure 4—figure supplement 1
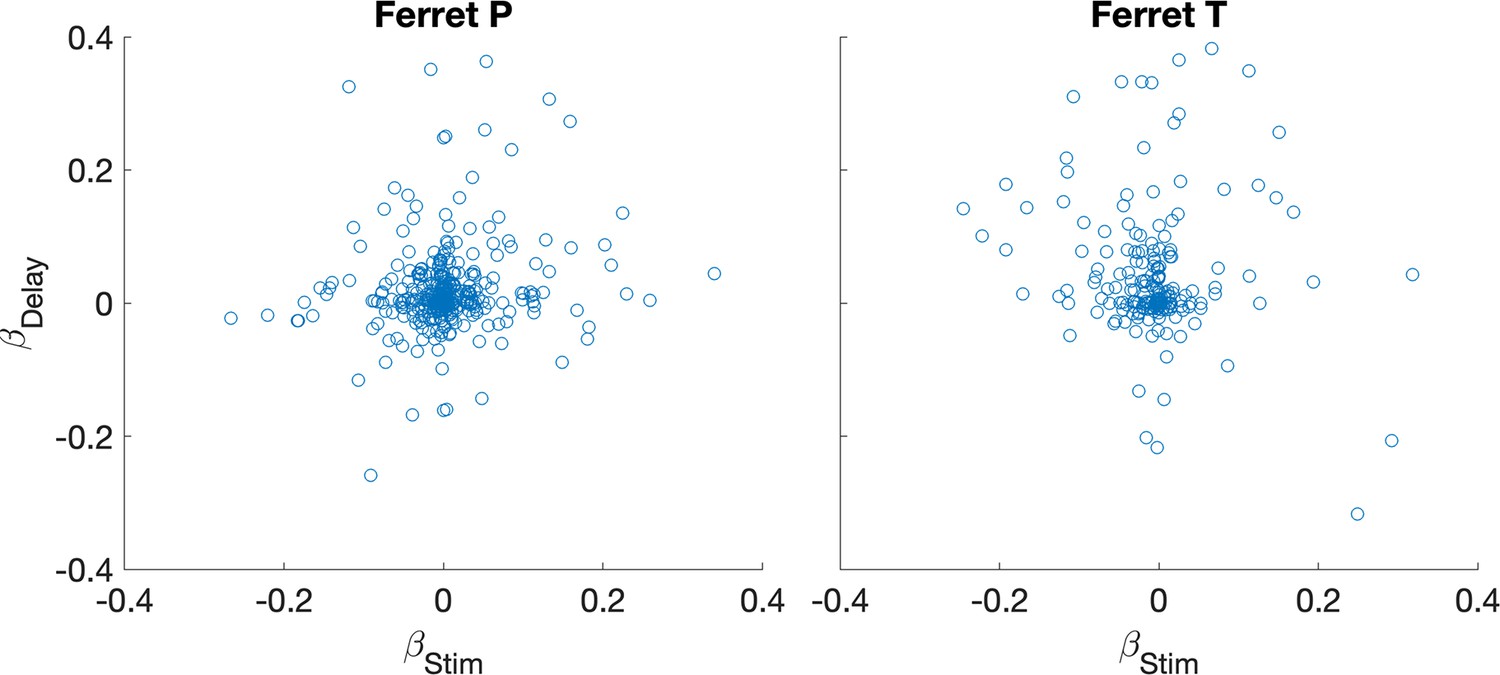
Scatter plot of the category weights regressed during stimulus and delay periods (n = 395 neurons from ferret P and n = 203 neurons from ferret T).
Figure 4—figure supplement 2
Projection of trial-averaged activity of hit, early–early, and late–early trials onto the category neural axis computed during the stimulus period.
Figure 4—figure supplement 3
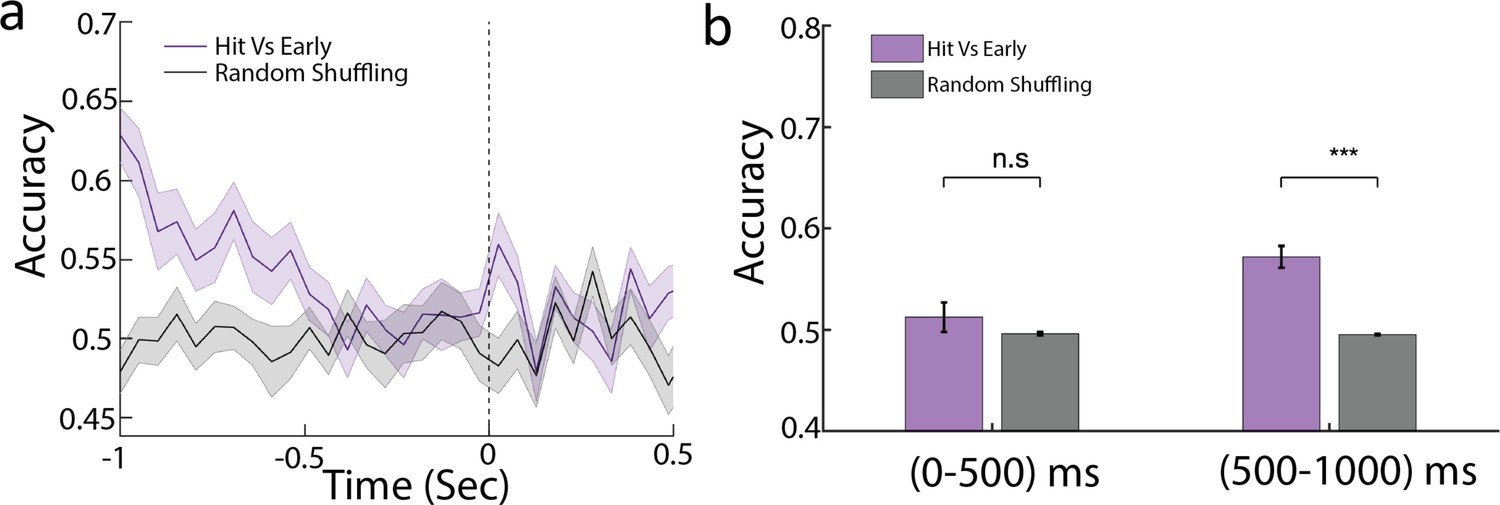
Delay activity in hit and early trials is identical.
(a) Lick-aligned population decoding of hit vs early trials. The accuracy is about chance level 500 ms before the lick. (b) Comparison of accuracy within 0–500 ms and 500–1000 ms before lick with that of random shuffling, significance is computed using a permutation test (***p<0.001).
Figure 5 with 2 supplements
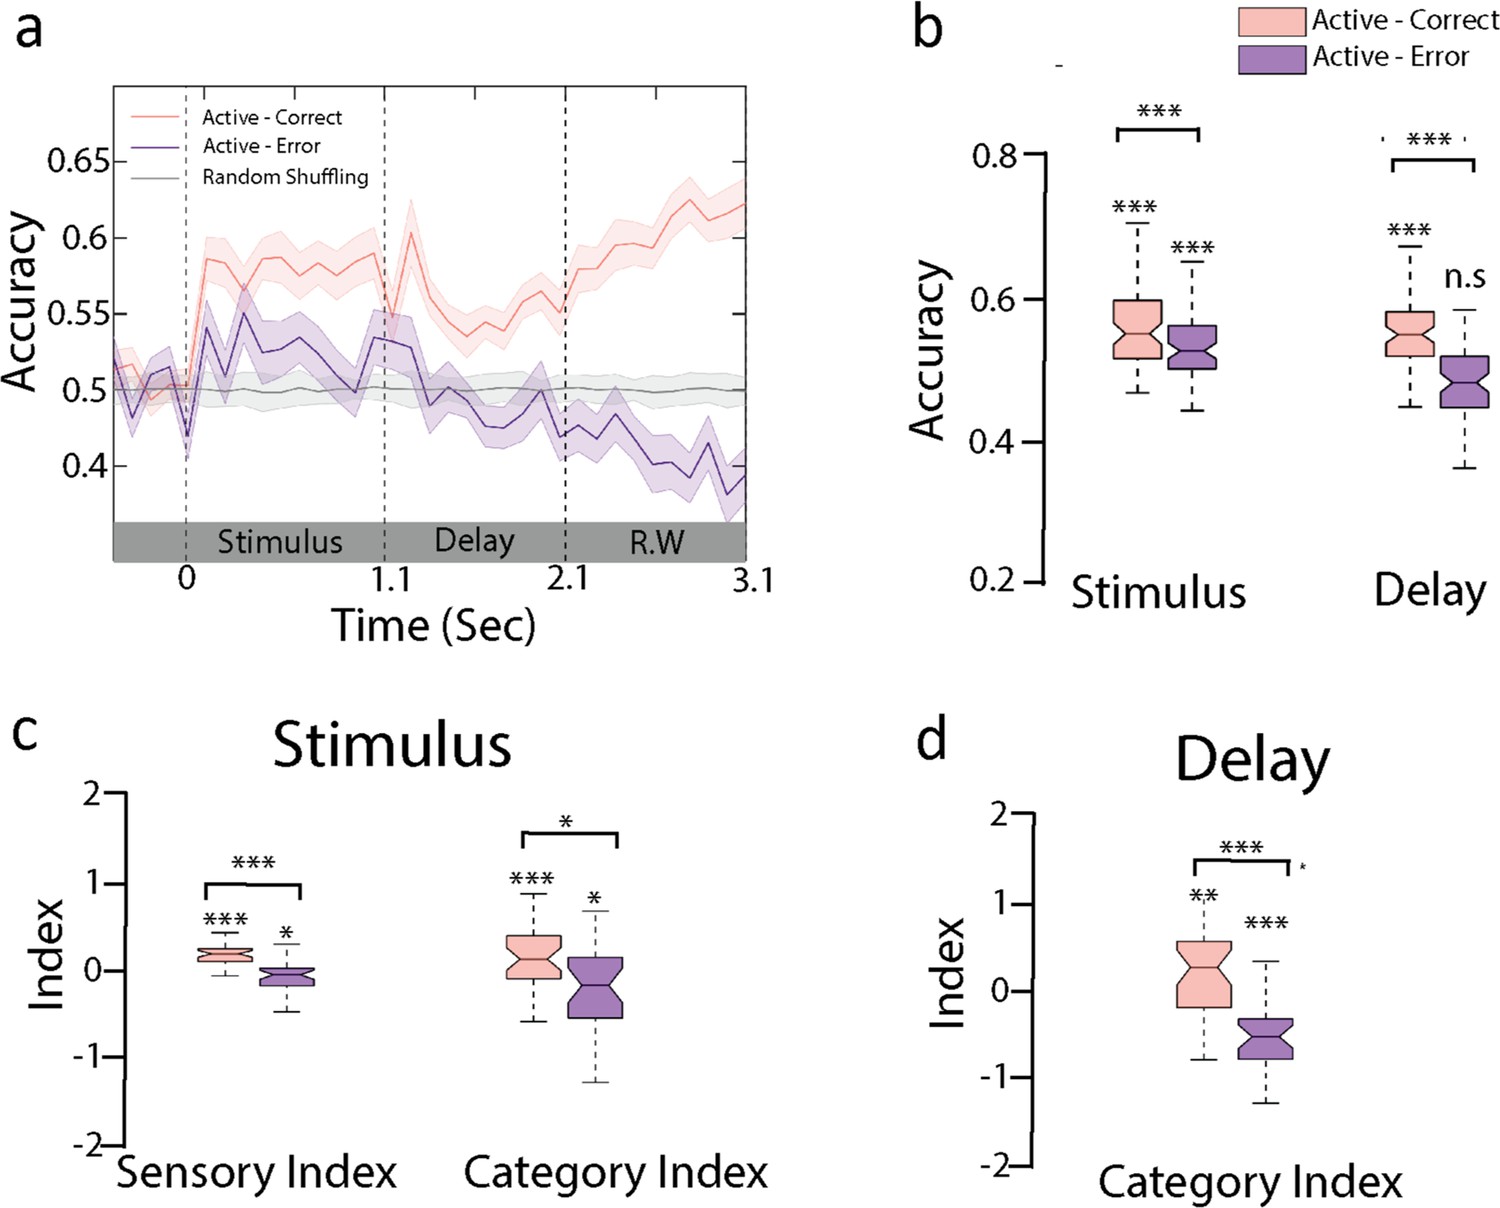
Sensory and categorical responses during error trials.
(a) Encoding of behavioral choices: here we trained the active classifier on correct behavioral choices (hit and correct rejection) and used the decoding weights to compute the accuracy using incorrect behavioral choices (false alarm and miss) as shown in the purple curve (n = 35 sessions from ferret P). Gray curve indicated the performance by shuffling labels in task engagement. Error bars show 1 SD. (b) Accuracy of the active decoder for correct and error trials during sound and delay period (n = 35 sessions from ferret P). (c) Category index and sensory index computed from the projections of trial-averaged correct and error trials onto category axis trained during sound period (see ‘Methods’). (d) Category index for delay period (see Figure 5—figure supplement 2 for both animals).
Figure 5—figure supplement 1
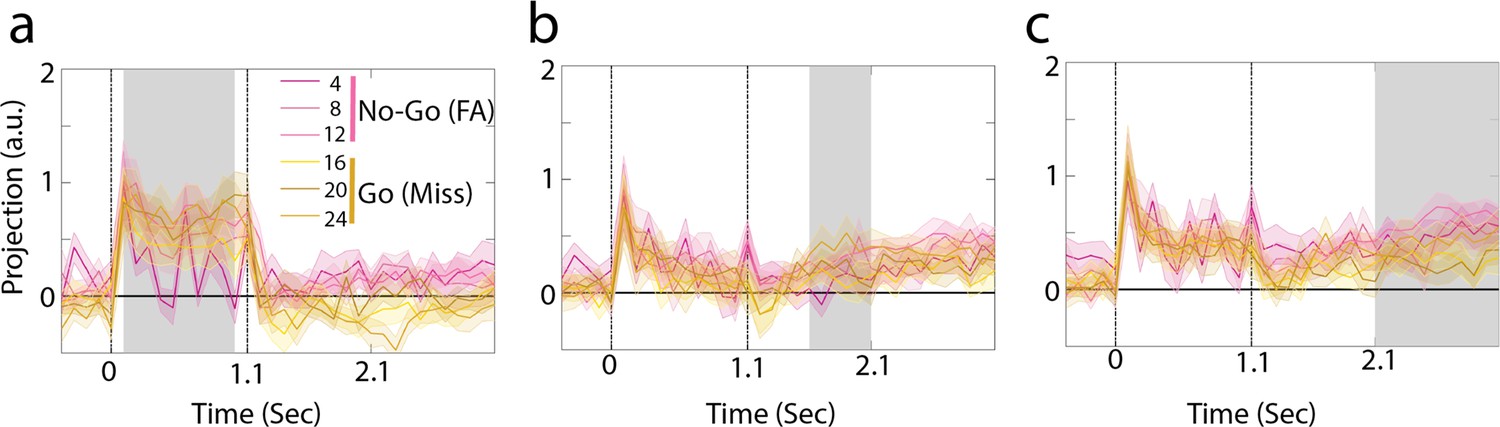
Projection of trial-averaged activity of error trials (average number of error trials in ferret P: 55.1 ± 14.9 and in ferret T: 66.2 ± 13.2) in both Go and No-Go categories onto the classifiers trained on correct trials during stimulus presentation (a), delay (b), and response window (c).
Figure 5—figure supplement 2
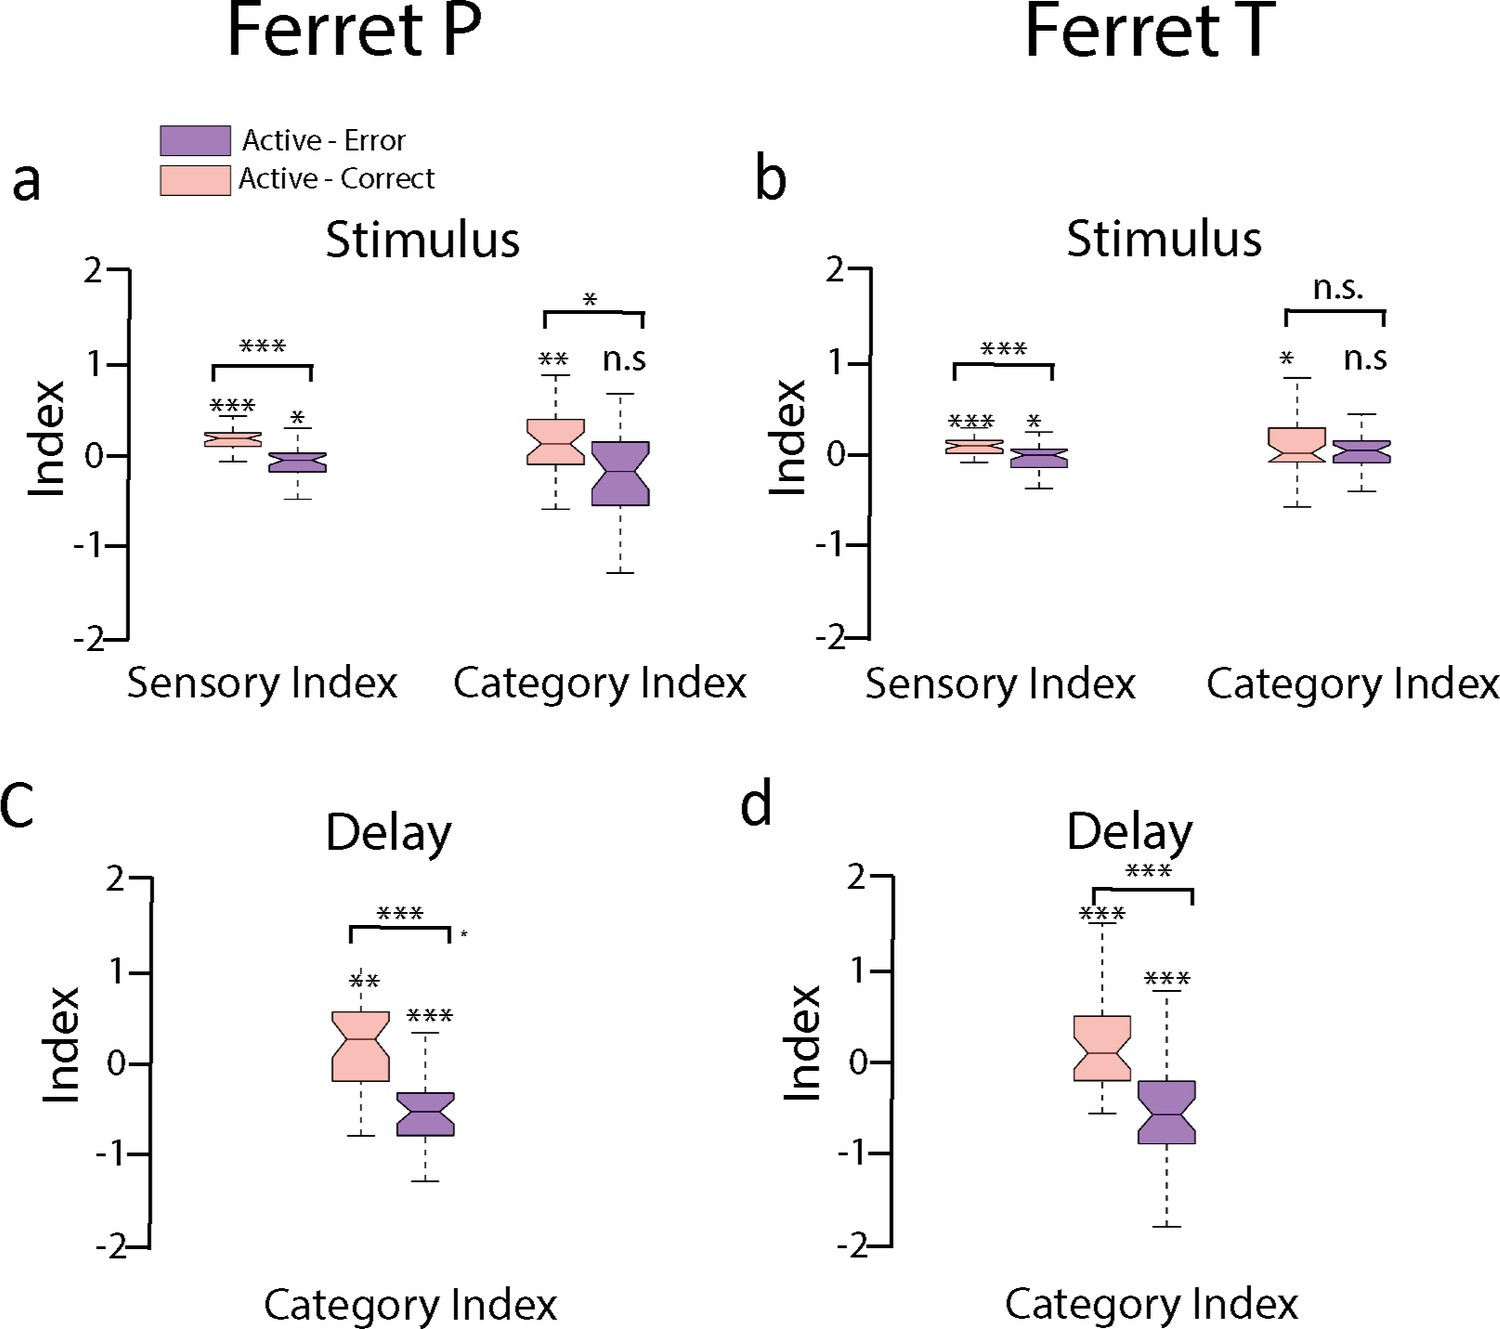
Sensory and Category index per animal.
(a, c) Sensory and category Index during active correct and error trials for ferret P. (b, d) Same as (a, c) for ferret T (***p<0.001, **p<0.05, *p<0.1).
Author response image 1
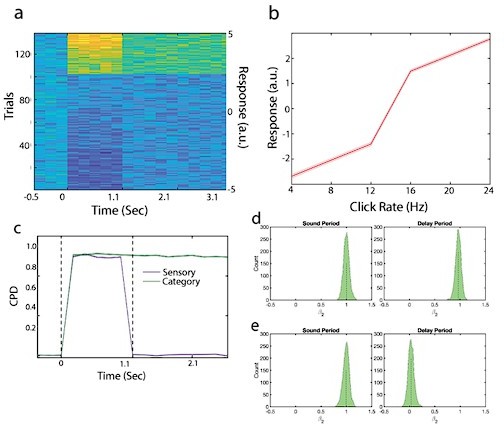
Testing the ability of the regression procedure to disentangle sensory and category contributions with modeled neurons.
A model generated spike counts from both sensory and category regressors during the sound period and from the category regressor during the delay period (see text). The number of trials, number of neurons and sessions were the same as in one example session of Ferret P ( = 0.5). ε (a) Scatter plot of a model neuron, organized by click rates. (b) Average response of all neurons in the model as a function of click rate. (c) CPD for the sensory and category regressors. (d) Category regressor weights recovered from the model. (e) Sensory regressor weights recovered from the model.
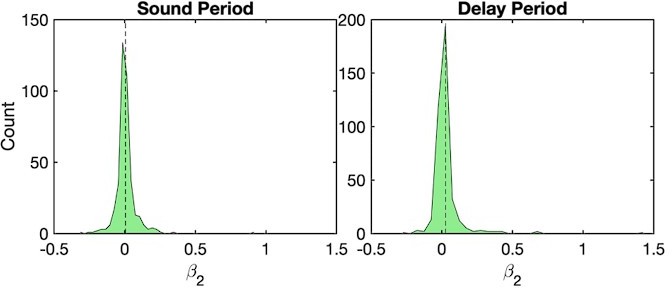
Author response image 2
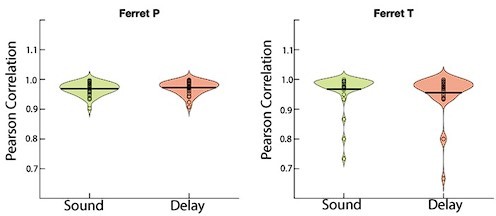
Correlation between regressors with two and four regressor values Distributions of correlation values between category weights independantly obtained from each of the two regression models (with either two [sensory and category] or four [sensory, category, lick and decision] regressors) (n=35 sessions in Ferret P; n=38 sessions in Ferret T).
Author response image 3
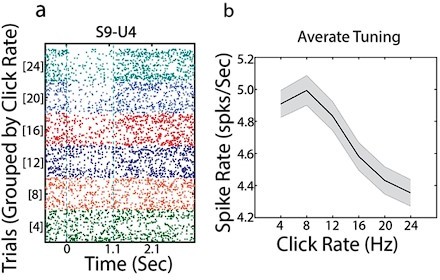
(a) Example neuron raster plot with trials sorted by click rates. (b) Average tuning curve over all neurons (shaded area shows 1 SEM; n=71 neurons).
Author response image 4
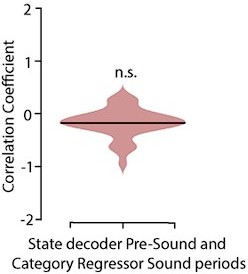
Distribution of correlations between the category regressor weights during the active stimulus period and the weights of state (passive/active) decoders (p =0. 125 t-test, Ferret P, n= 35 sessions).
Author response image 5
Author response image 6
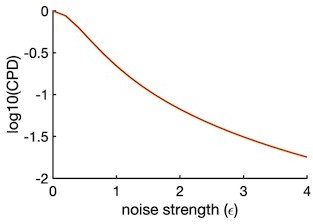
Coefficient of partial determination (CPD) for category regressor as a function of noise strength.
Author response image 7
Tables
Table 1
Number of recorded units.
| Ferret | Recorded Units | Units used for population analysis | Sessions |
|---|---|---|---|
| Ferret P | 575 | 395 | 35 |
| Ferret T | 241 | 203 | 39 |
Additional files
Download links
A two-part list of links to download the article, or parts of the article, in various formats.
Downloads (link to download the article as PDF)
Open citations (links to open the citations from this article in various online reference manager services)
Cite this article (links to download the citations from this article in formats compatible with various reference manager tools)
Dynamics and maintenance of categorical responses in primary auditory cortex during task engagement
eLife 12:e85706.
https://doi.org/10.7554/eLife.85706


