MTL neurons phase-lock to human hippocampal theta
- Department of Neuroscience, Perelman School of Medicine, University of Pennsylvania, United States
- Department of Psychology, University of Pennsylvania, United States
- Department of Neurosurgery, University of Pennsylvania, United States
- Department of Bioengineering, University of Pennsylvania, United States
- Department of Neurosurgery, Neurosurgery, David Geffen School of Medicine and Semel Institute for Neuroscience and Human Behavior, University of California, Los Angeles, United States
- Faculty of Medicine, Tel-Aviv University, Israel
Figures
Figure 1 with 2 supplements
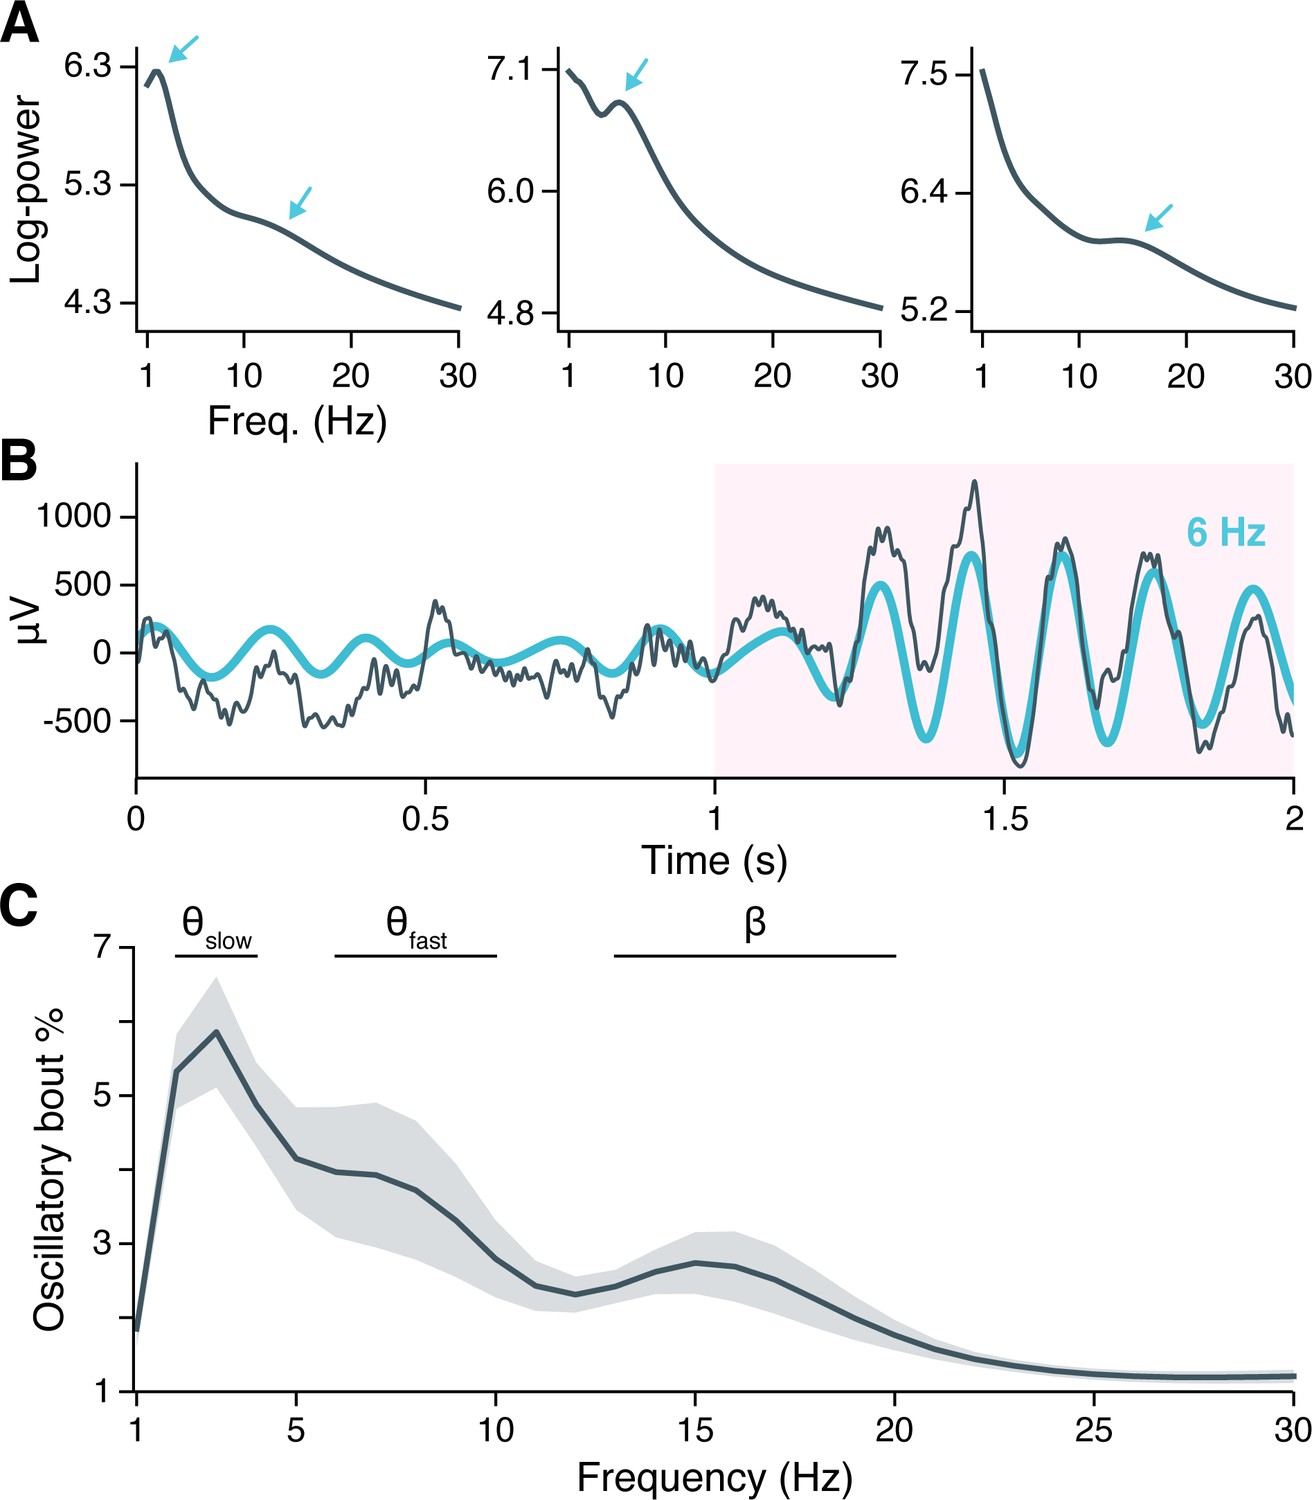
Neural oscillations in the hippocampus.
(A) Spectral power across the recording session is shown for hippocampal local field potentials (LFPs) from three example subjects. Arrows indicate spectral peaks above the background 1/f spectrum. (B) A hippocampal LFP trace (gray line = raw LFP, cyan line = 6 Hz–filtered LFP) is shown immediately before and during a Better OSCillation (BOSC)–detected theta oscillation, highlighted in pink. (C) Mean ± SEM percent time, across 28 subjects, that BOSC-detected oscillations were present in hippocampal LFPs at each frequency from 1 to 30 Hz.
Figure 1—figure supplement 1
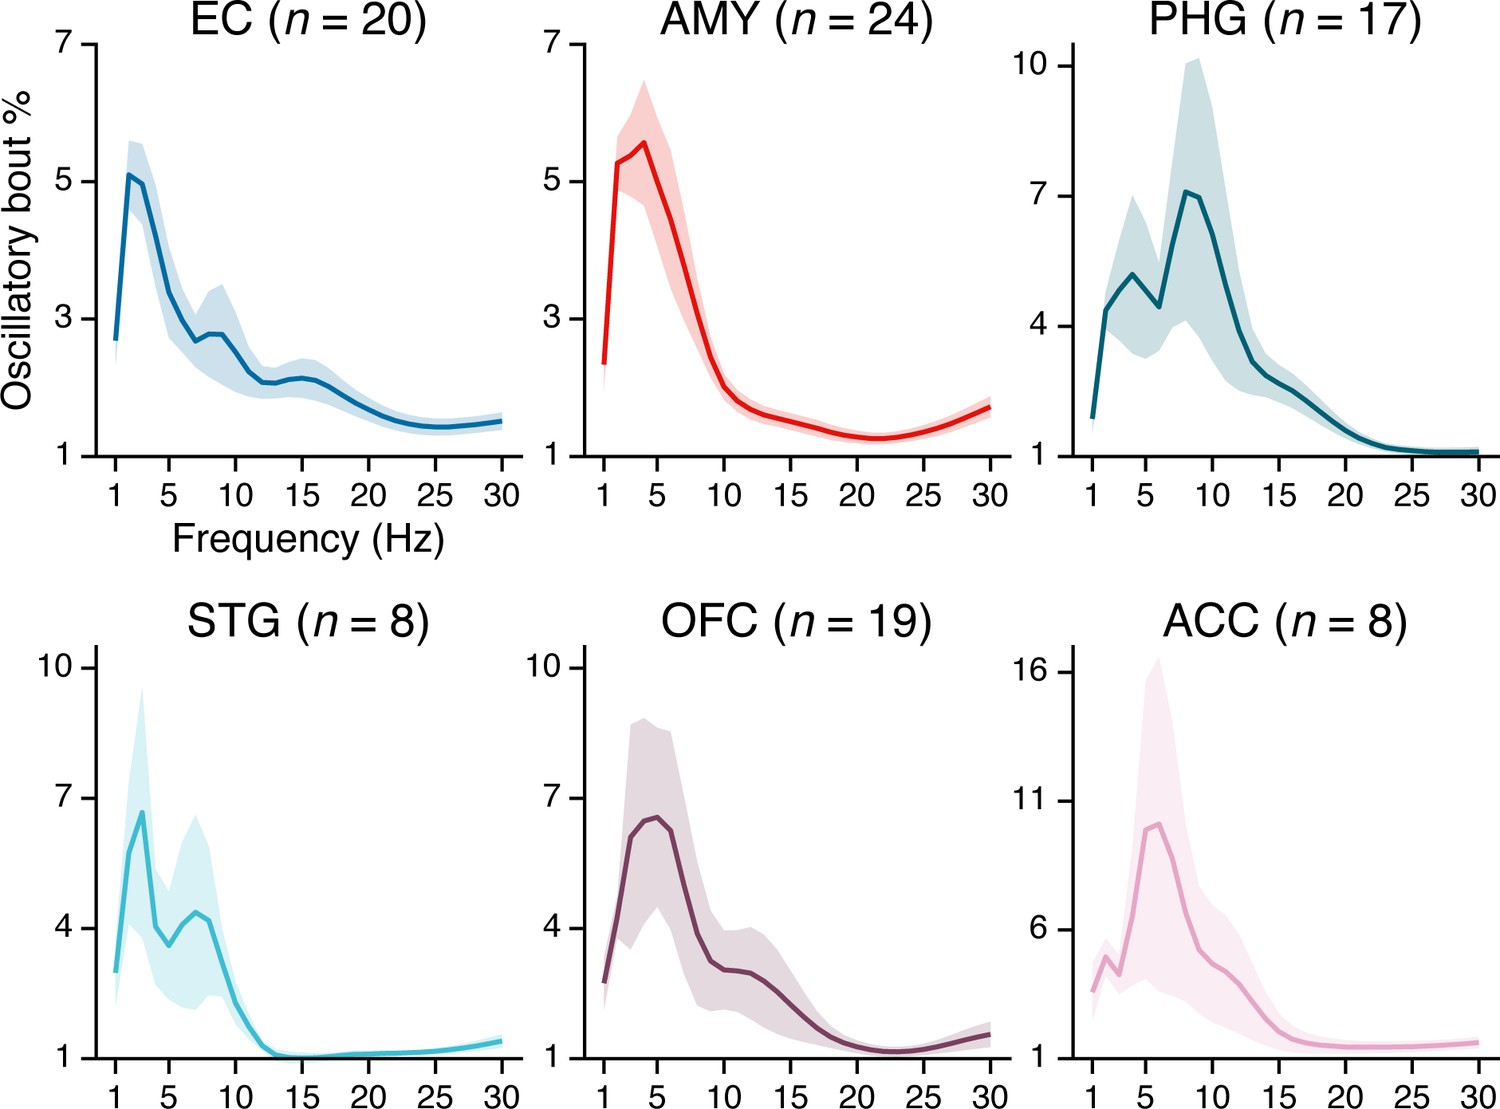
Neural oscillations outside the hippocampus.
Subpanels show the mean ± SEM percent time, across n subjects, that Better OSCillation (BOSC)–detected oscillations were present in each region at 1–30 Hz frequencies. Regions in which neurons were recorded from fewer subjects exhibit greater variance across subjects, so y-axis scaling varies among subpanels to accommodate the visualization of differing variances.
Figure 1—figure supplement 2
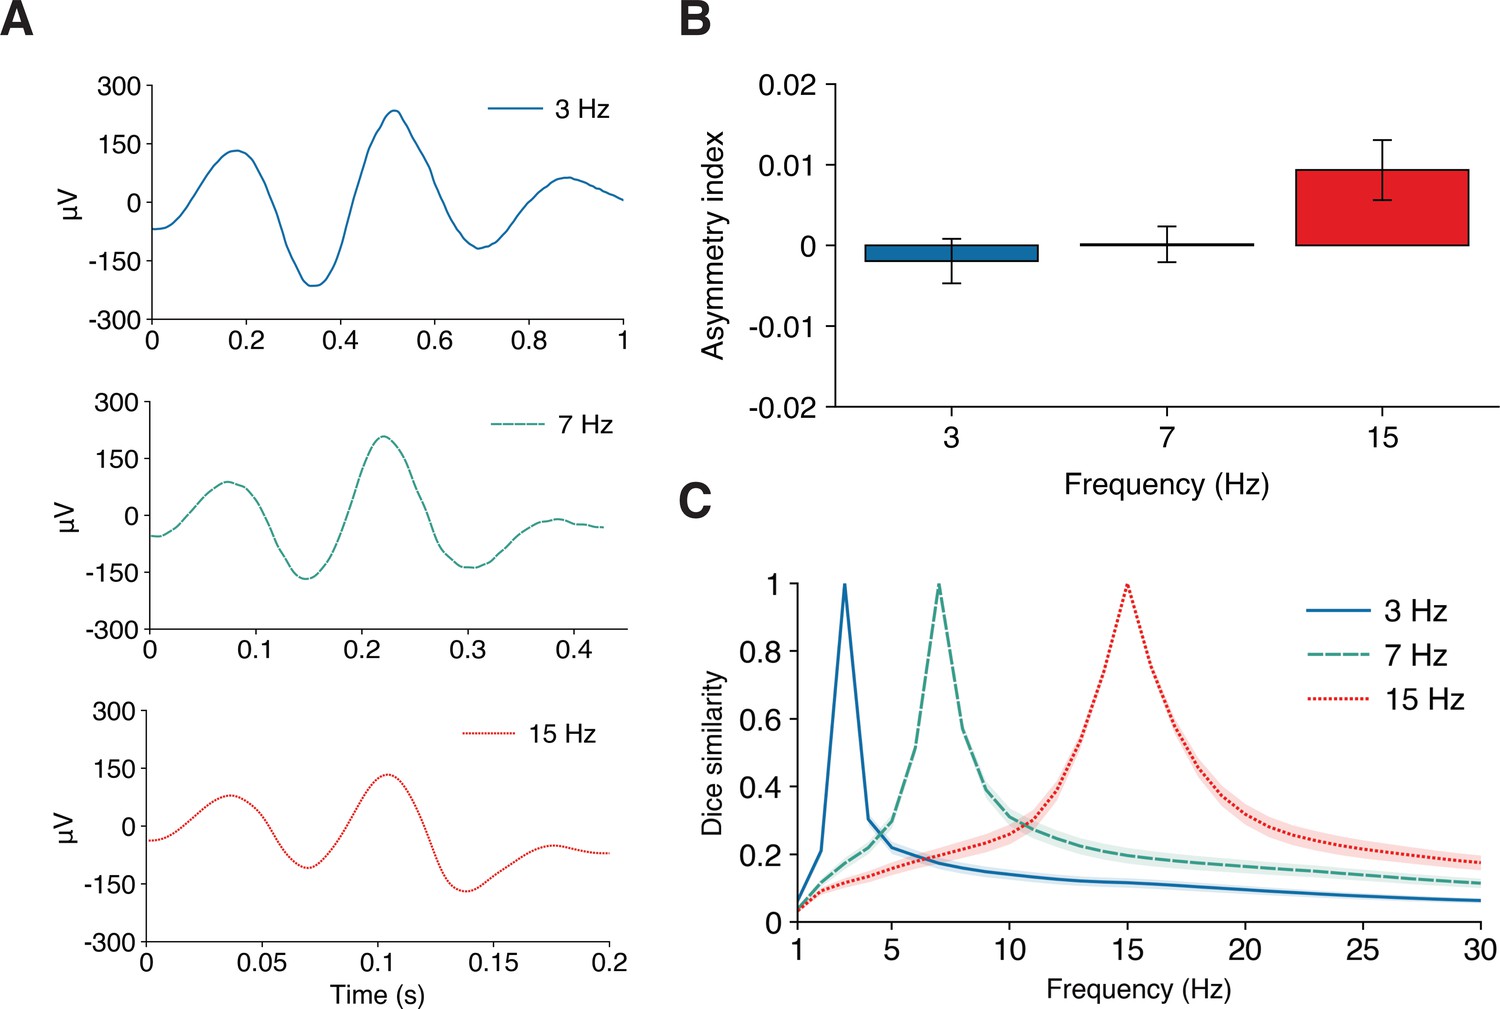
Oscillatory bout co-occurrence and waveform asymmetry at 3 Hz, 7 Hz, and 15 Hz.
(A) LFP traces show the mean waveform of the first three cycles of hippocampal oscillatory bouts at 3 Hz, 7 Hz, and 15 Hz, respectively. (B) Mean ± SEM asymmetry index of hippocampal oscillatory bouts at 3 Hz, 7 Hz, and 15 Hz. (C) Dice similarity coefficients show the overlap between 3 Hz, 7 Hz, and 15 Hz oscillatory bouts, respectively, and oscillatory bouts at all other examined frequencies in the hippocampal LFP. All figure panels show across-subject means after first aggregating each measure within-subject. Error bars and error shading show SEM across the 28 participants.
Figure 2
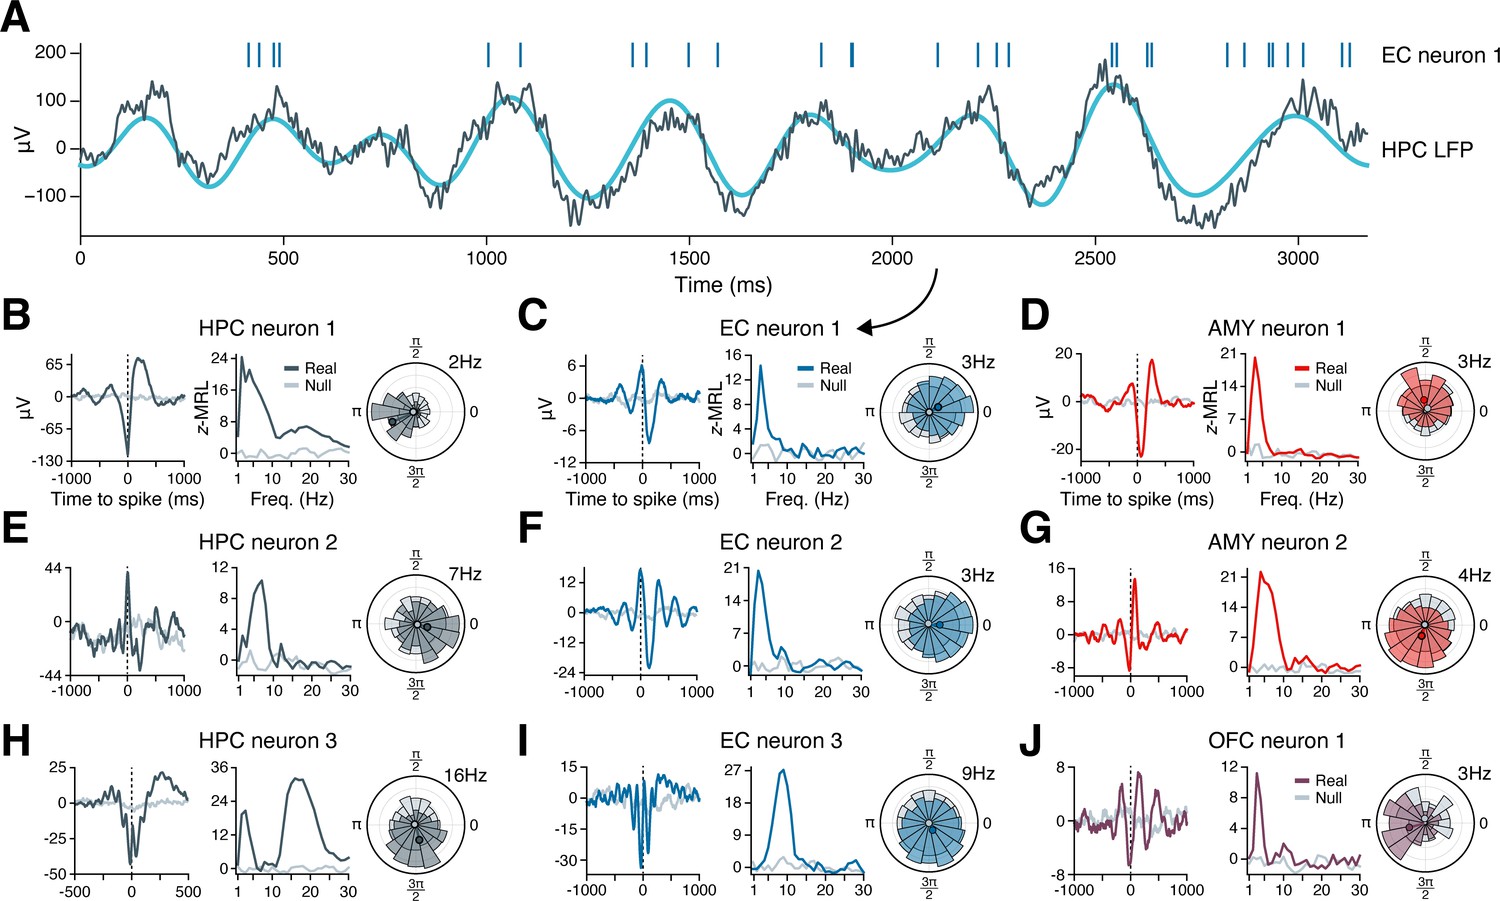
Example phase-locking to hippocampal oscillations.
(A) Spikes from an EC neuron (top, vertical lines) are shown alongside local field potential (LFP) activity in the hippocampus during a slow theta oscillation (gray line = raw LFP, cyan line = 3 Hz–filtered LFP). Panel (C) shows phase-locking statistics for this neuron across the recording session. (B–J) Shown are nine neurons in the HPC (left column), EC (middle column), AMY (right column, top two rows), and OFC (right column, bottom row) that phase-locked to oscillatory signals in the hippocampus while subjects navigated through a virtual environment. The left subpanel for each neuron shows the mean hippocampal LFP centered on the time of each spike. The middle subpanel shows the phase-locking strength at each frequency relative to a null distribution of circularly shifted spikes. The right subpanel shows the spike–phase distribution at the maximum phase-locking frequency. Dark gray (HPC), blue (EC), red (AMY), and purple (OFC) lines correspond to true spike times, while light gray lines correspond to circularly shifted spike times from a single draw from the null distribution. HPC = hippocampus; EC = entorhinal cortex; AMY = amygdala; OFC = orbitofrontal cortex.
Figure 3 with 1 supplement
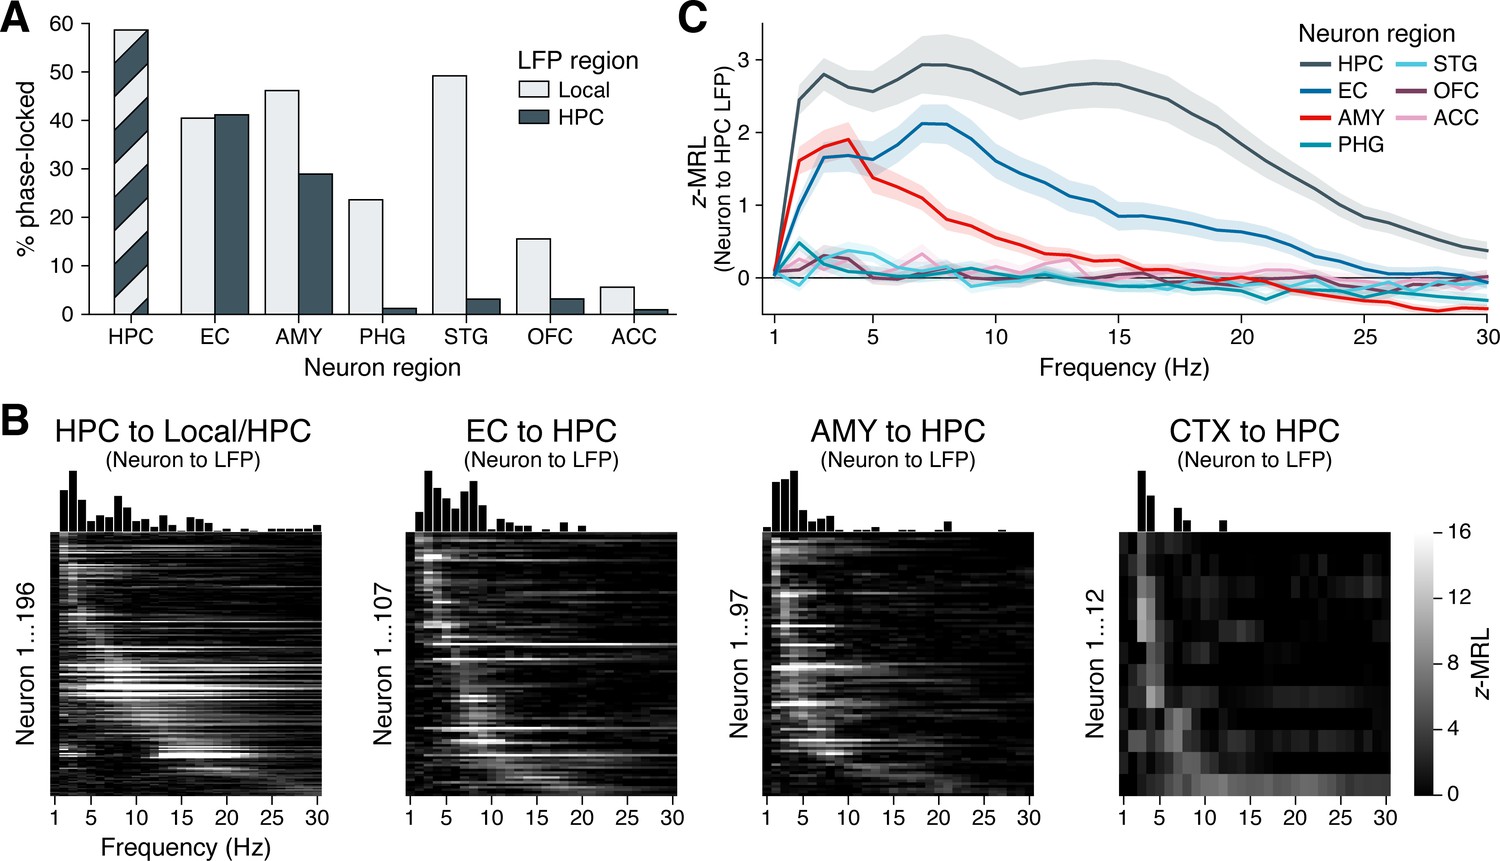
Phase-locking to hippocampal oscillations by region and frequency.
(A) Bars show the percentage of neurons in each region that phase-locked to locally recorded local field potential (LFP) oscillations (light gray) and hippocampal LFP oscillations (dark gray). (Note that local and hippocampal LFP is identical for hippocampal neurons.) Phase-locking significance was set at false discovery rate (FDR)–corrected within each bar group. (B) Heatmaps show the phase-locking strength (z-MRL; color scale intensity) by hippocampal LFP oscillation frequency (x-axis) for all significantly phase-locked neurons (y-axis; each row = one neuron) in the HPC, EC, AMY, and remaining regions (CTX), respectively. Neurons in each region are sorted from top to bottom by frequency of maximum phase-locking strength. Neurons depicted match the dark gray bars in (A). (C) Mean ± SEM phase-locking strength by hippocampal oscillation frequency is shown for all neurons in each region, regardless of their individual phase-locking significance as depicted in (A) and (B). HPC = hippocampus; EC = entorhinal cortex; AMY = amygdala; PHG = parahippocampal gyrus; STG = superior temporal gyrus; OFC = orbitofrontal cortex; ACC = anterior cingulate cortex.
Figure 3—figure supplement 1
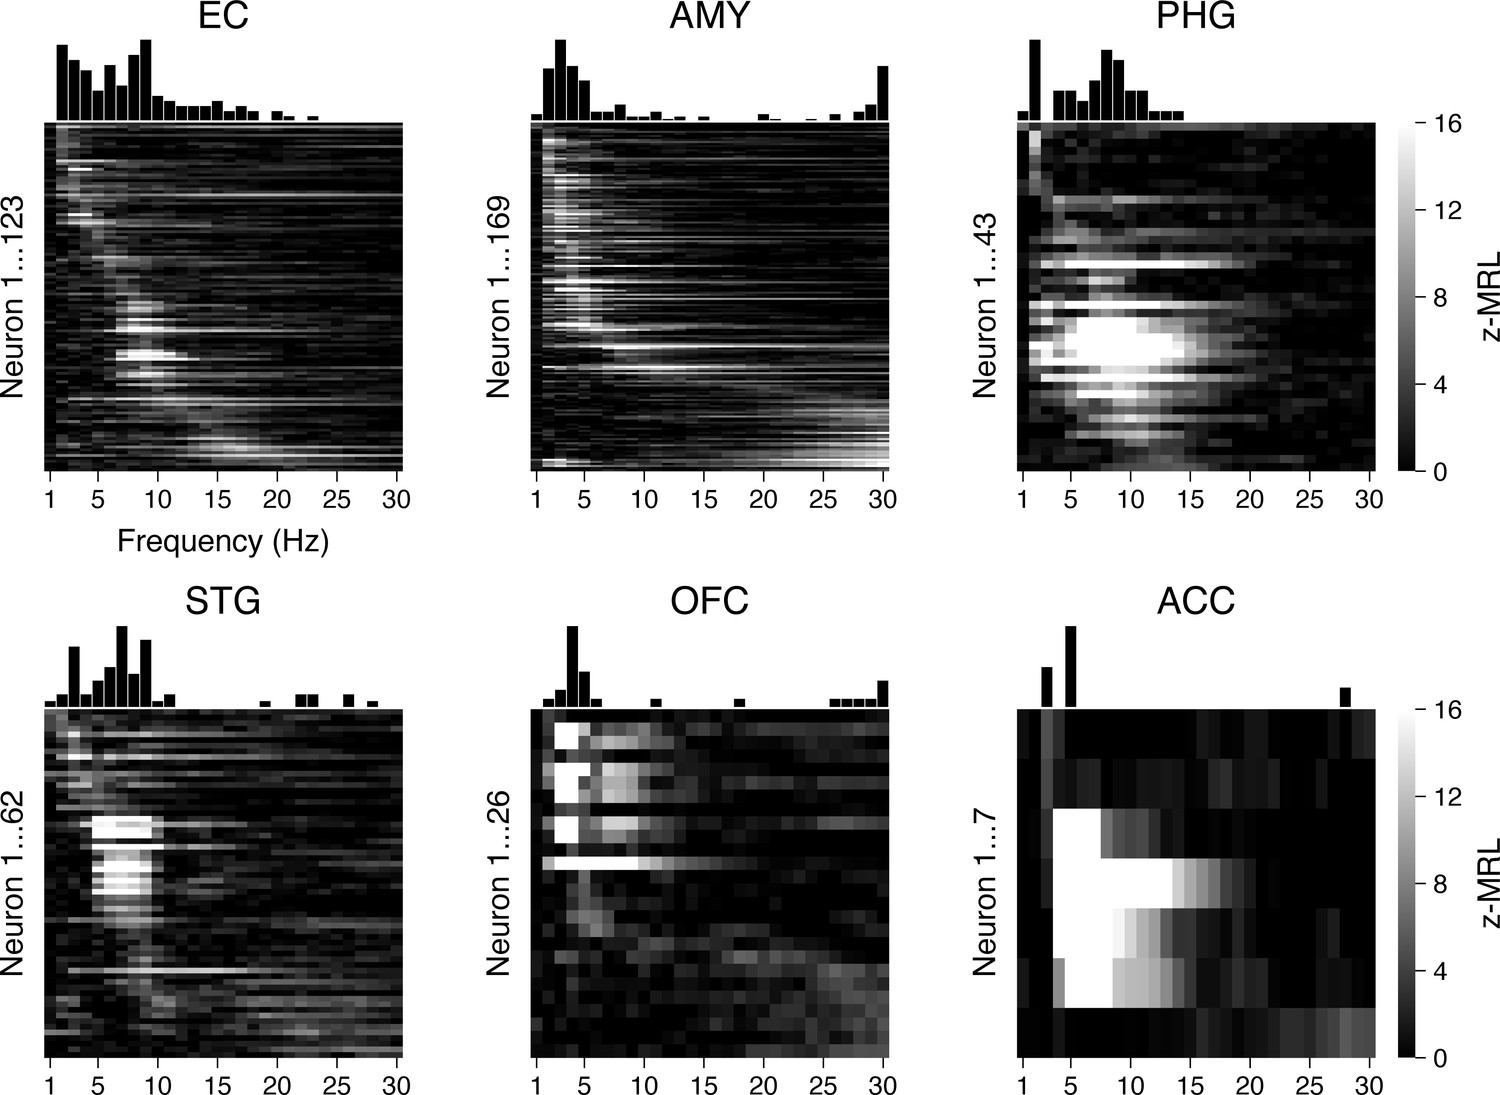
Phase-locking to local oscillations.
Heatmaps show the phase-locking strength (z-MRL; color scale intensity) by local oscillation frequency (x-axis) for all significantly phase-locked neurons (y-axis; each row = one neuron) in each region, respectively. Within the heatmap for each region, the order of neurons from top to bottom follows increasing preferred phase-locking frequency. The population of neurons depicted in these heatmaps matches the population represented by the light gray bars in Figure 3A.
Figure 4 with 2 supplements
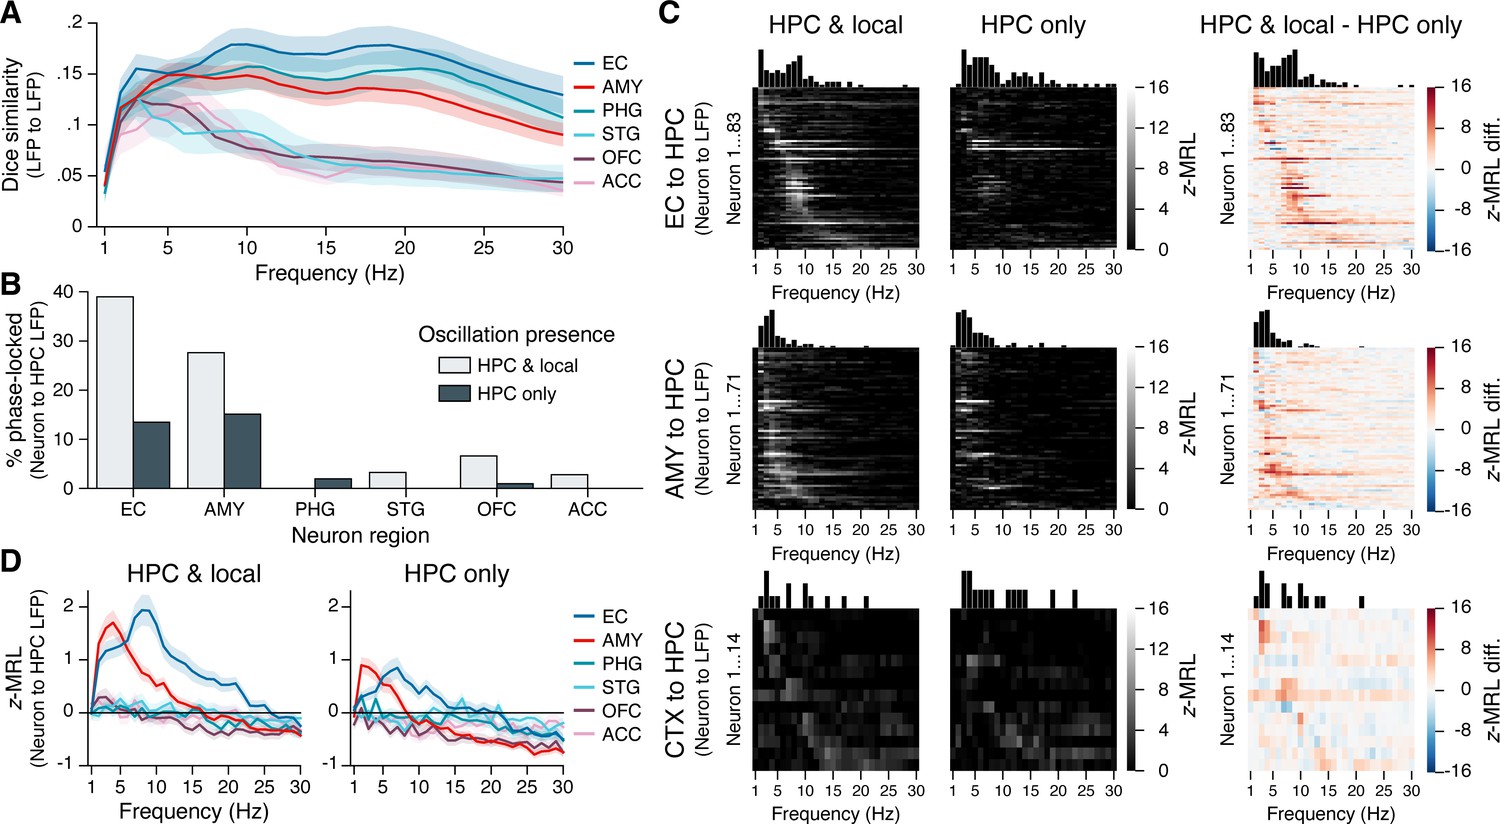
Phase-locking to hippocampal oscillations with and without co-occurring local oscillations.
(A) Mean ± SEM (across 28 subjects) Dice coefficient across subjects shows the percent overlap between oscillatory bouts in the hippocampus and in each extrahippocampal region. (B) Bars show the percentage of neurons in each region that phase-locked to hippocampal oscillations when local oscillations were present (light gray) or absent (dark gray). Phase-locking significance was set at false discovery rate (FDR)-corrected within each bar group. (C) Heatmaps show the phase-locking strength by hippocampal LFP oscillation frequency for all significantly phase-locked neurons in the EC (top row), AMY (middle row), and remaining regions (CTX; bottom row), when hippocampal and local oscillations co-occurred (left column) versus when only hippocampal oscillations occurred (middle column). The right column shows the left column minus middle column values. Neurons in each region are sorted from top to bottom by frequency with the maximum phase-locking strength, and the sorting order is constant across columns within each row. Neurons depicted match the union of light gray and dark gray bars in (B). (D) Phase-locking to the hippocampus is shown during co-occurring local and hippocampal oscillations (left) or only hippocampal oscillations (right). Each subpanel shows the mean ± SEM (across 28 subjects) phase-locking strength by hippocampal oscillation frequency for all neurons in each region, regardless of their individual phase-locking significance as depicted in (B) and (C). HPC = hippocampus; EC = entorhinal cortex; AMY = amygdala; PHG = parahippocampal gyrus; STG = superior temporal gyrus; OFC = orbitofrontal cortex; ACC = anterior cingulate cortex.
Figure 4—figure supplement 1
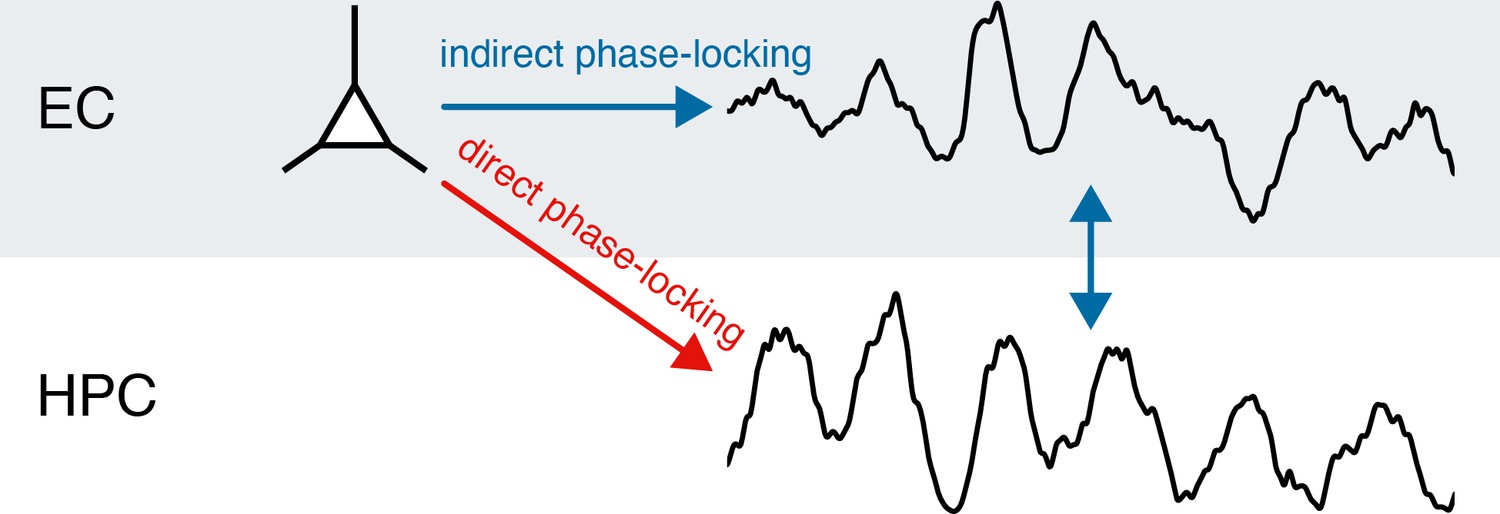
Two explanations for remote phase-locking to hippocampal theta.
Figure illustration shows two ways in which phase-locking of extrahippocampal neurons to hippocampal theta could occur. In the first scenario, an entorhinal cortex (EC) neuron phase-locks to the local theta rhythm, which in turn exhibits phase-synchrony with hippocampal theta (‘indirect phase-locking,’ blue arrows). In the second scenario, the EC neuron is directly entrained to hippocampal theta, such that phase-locking can occur even absent a local theta rhythm (‘direct phase-locking,’ red arrow).
Figure 4—figure supplement 2
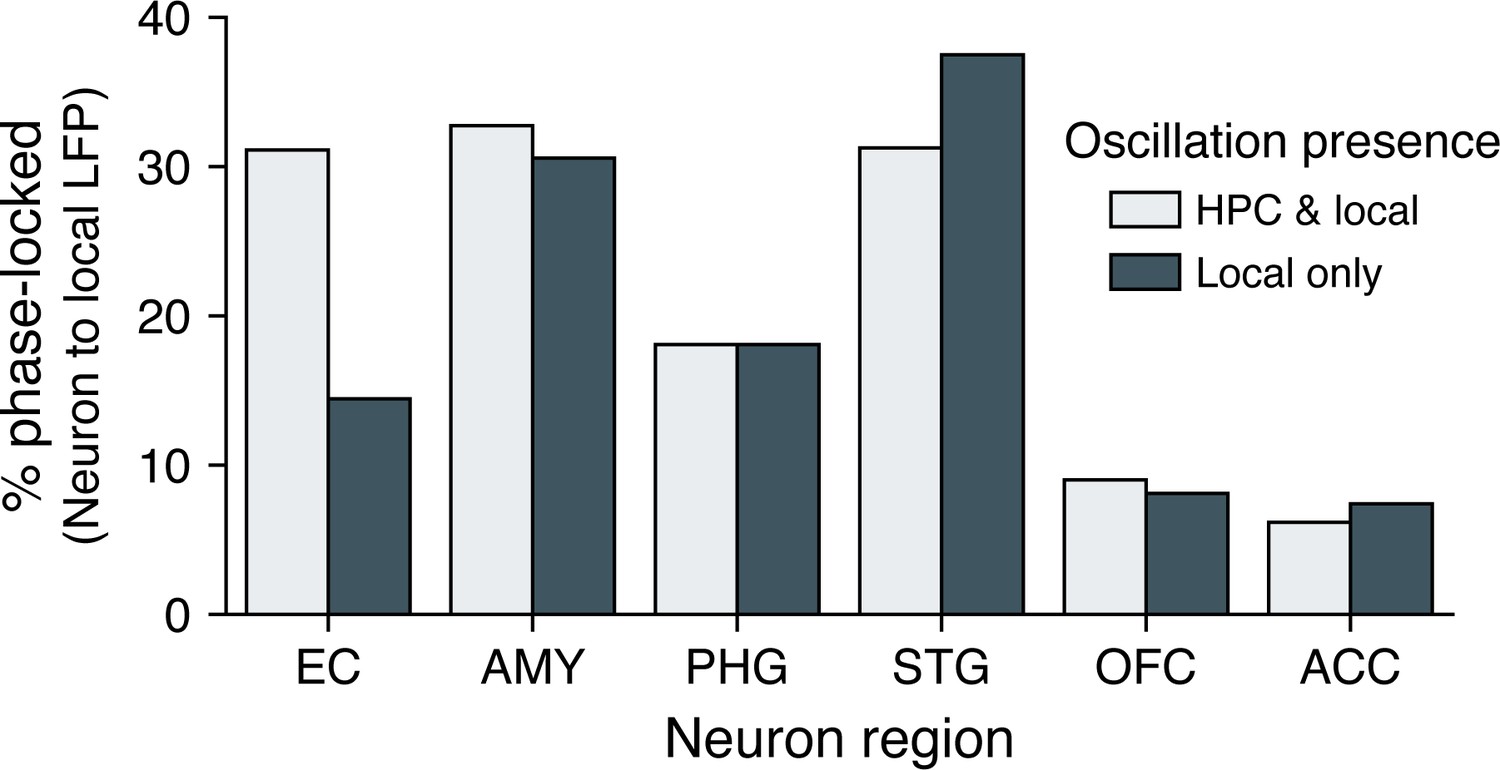
Phase-locking to local oscillations with and without co-occurring hippocampal oscillations.
Bars show the percentage of neurons in each region that phase-locked to local oscillations when hippocampal oscillations were present (light gray) or absent (dark gray). Phase-locking significance was set at false discovery rate (FDR)–corrected within each bar group.
Tables
Table 1
Neurons by region.
Table shows how many subjects had at least one neuron in each brain region, how many neurons were recorded in each region, and the median, lower-, and upper-quartile firing rates for these neurons.
| Region | Subjects | Neurons | Firing rate (Hz) |
|---|---|---|---|
| Hippocampus | 27 | 391 | 1.6 (0.6, 4.7) |
| Entorhinal cortex | 19 | 341 | 2.3 (1.0, 5.5) |
| Amygdala | 23 | 439 | 1.5 (0.6, 3.7) |
| Parahippocampal gyrus | 15 | 217 | 2.2 (0.8, 4.5) |
| Superior temporal gyrus | 5 | 139 | 3.4 (1.4, 8.6) |
| Orbitofrontal cortex | 15 | 193 | 2.0 (0.9, 4.9) |
| Anterior cingulate cortex | 8 | 134 | 3.1 (1.4, 6.8) |
| Total | 28 | 1854 | 2.0 (0.8, 5.0) |
Additional files
Download links
A two-part list of links to download the article, or parts of the article, in various formats.
Downloads (link to download the article as PDF)
Open citations (links to open the citations from this article in various online reference manager services)
Cite this article (links to download the citations from this article in formats compatible with various reference manager tools)
MTL neurons phase-lock to human hippocampal theta
eLife 13:e85753.
https://doi.org/10.7554/eLife.85753


