Mechanistic insights into robust cardiac IKs potassium channel activation by aromatic polyunsaturated fatty acid analogues
- Department of Physiology and Biophysics, Miller School of Medicine, University of Miami, United States
- Department of Biomedical and Clinical Sciences, Linköping University, Sweden
- Department of Biological Sciences and Centre for Molecular Simulation, University of Calgary, Canada
Figures
Figure 1
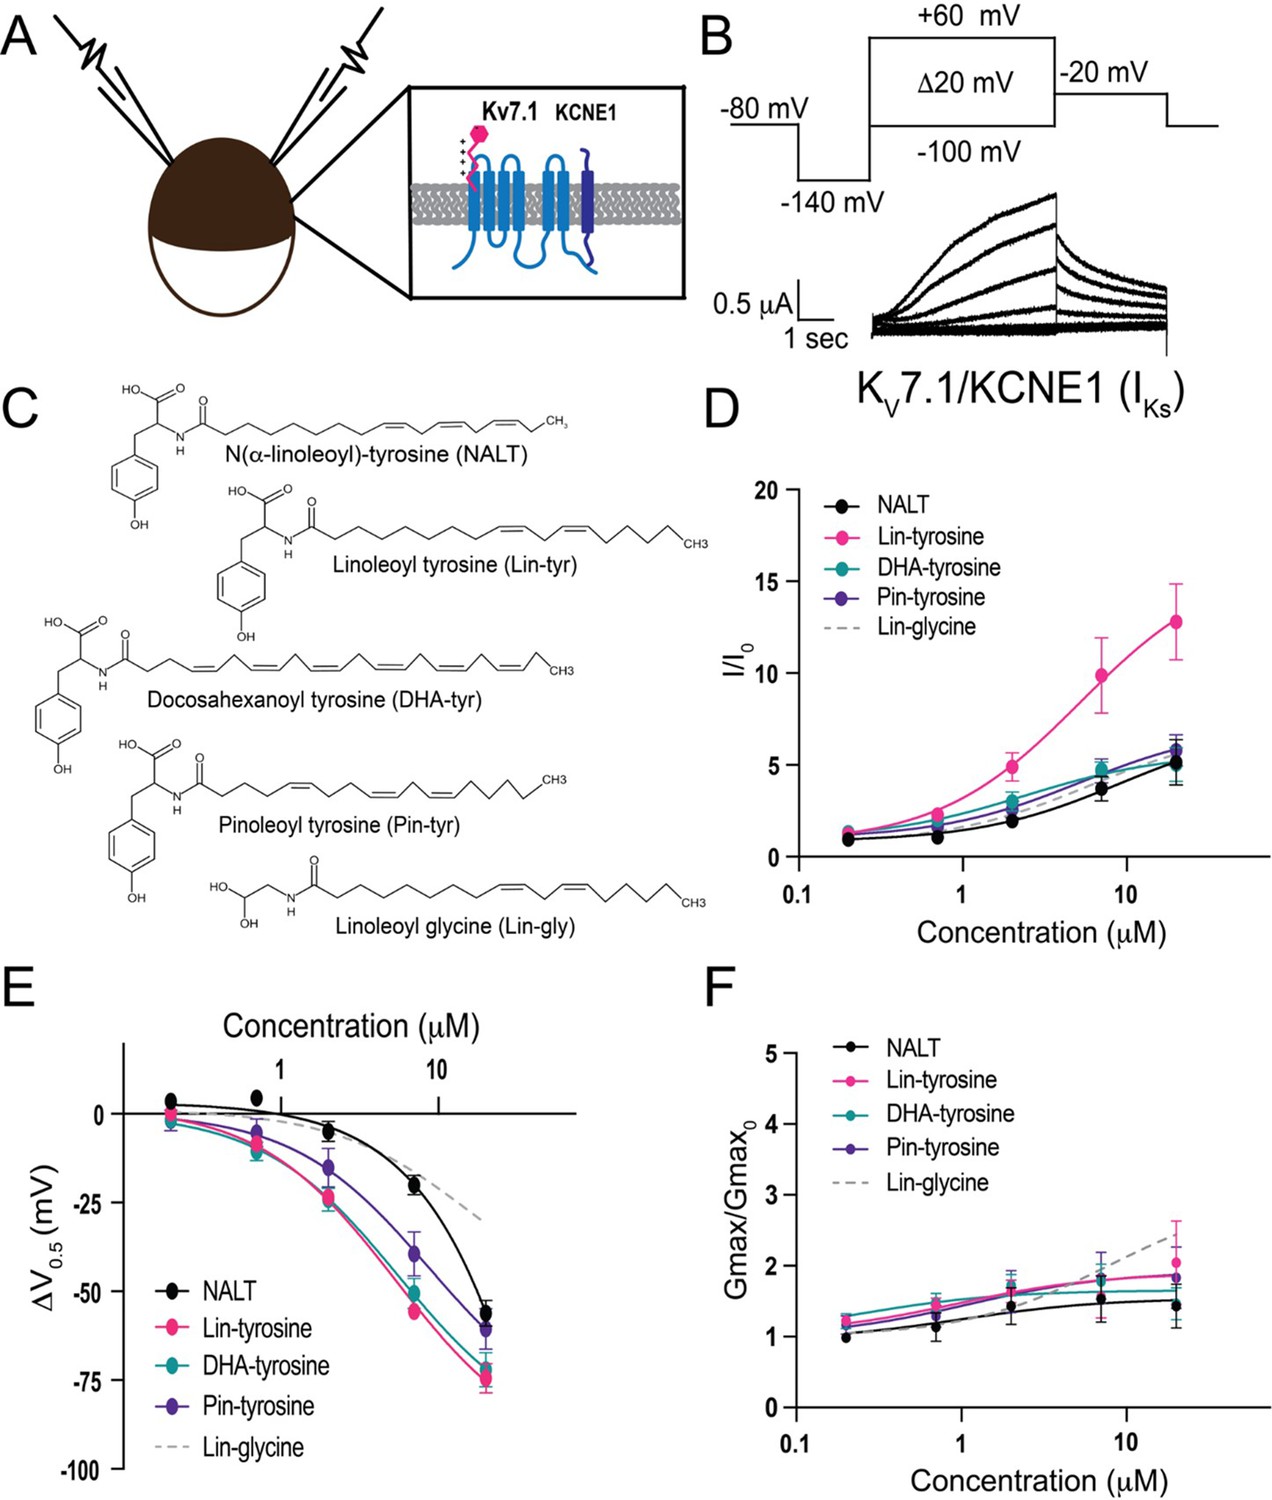
Polyunsaturated fatty acids (PUFA) analogues with a tyrosine head group are strong IKs channel activators.
(A) Schematic of two electrode voltage-clamp setup (inset: IKs channel cartoon + PUFA [pink]). (B) Voltage protocol (top) with representative KV7.1/KCNE1 (IKs) current (bottom). (C) Structures of NALT, Lin-tyrosine, DHA-tyrosine, and Pin-tyrosine (with Lin-glycine for comparison). (D–F) I/I0, (E) ΔV0.5, and (F) Gmax dose–response curves for NALT (black circles) (n = 4), Lin-tyrosine (pink circles) (n = 4), DHA-tyrosine (teal circles) (n = 3), Pin-tyrosine (purple circles) (n = 5), and Lin-glycine (gray dotted line) (n = 3). Values for all compounds and concentrations available in Figure 1—source data 1.
-
Figure 1—source data 1
Source Data for Panels D-F.
- https://cdn.elifesciences.org/articles/85773/elife-85773-fig1-data1-v2.docx
Figure 2
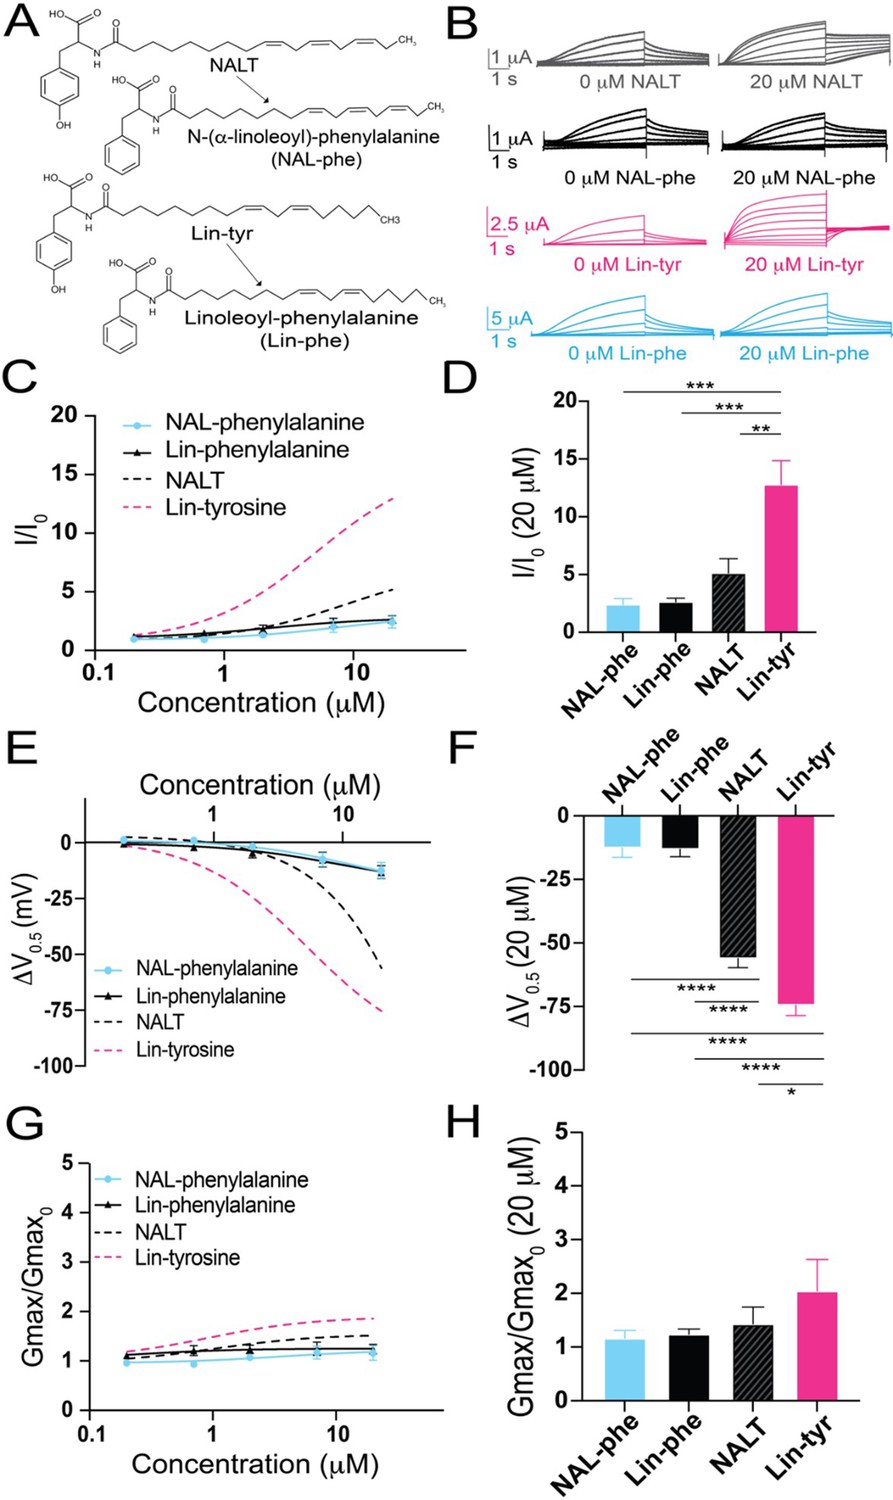
The distal hydroxyl (–OH) group of tyrosine polyunsaturated fatty acid (PUFA) analogues is necessary for robust IKs channel activation.
(A) Structures of NAL-phe and Lin-phe. (B) Representative current traces for NALT (gray), NAL-phe (black), Lin-tyr (pink), and Lin-phe with 0 μM PUFA (left) and 20 μM PUFA (right). (C, E, G) I/I0, (E) ΔV0.5, and (G) Gmax dose–response curves for NAL-phe (n = 4) and Lin-phe (n = 4) with dotted lines representing dose response of NALT (n = 4) and Lin-tyr (n = 4). (D, F, H) Maximum effects on (D) I/I0, (F) ΔV0.5, and (H) Gmax (at 20 μM) for NAL-phe (n = 4), Lin-phe (n = 4), NALT (n = 4), and Lin-tyr (n = 4). Asterisks indicate statistically significant differences determined by one-way ANOVA with Tukey’s test for multiple comparisons. Values for all compounds and concentrations available in Figure 2—source data 1.
-
Figure 2—source data 1
Source Data for Panels C-H.
- https://cdn.elifesciences.org/articles/85773/elife-85773-fig2-data1-v2.docx
Figure 3
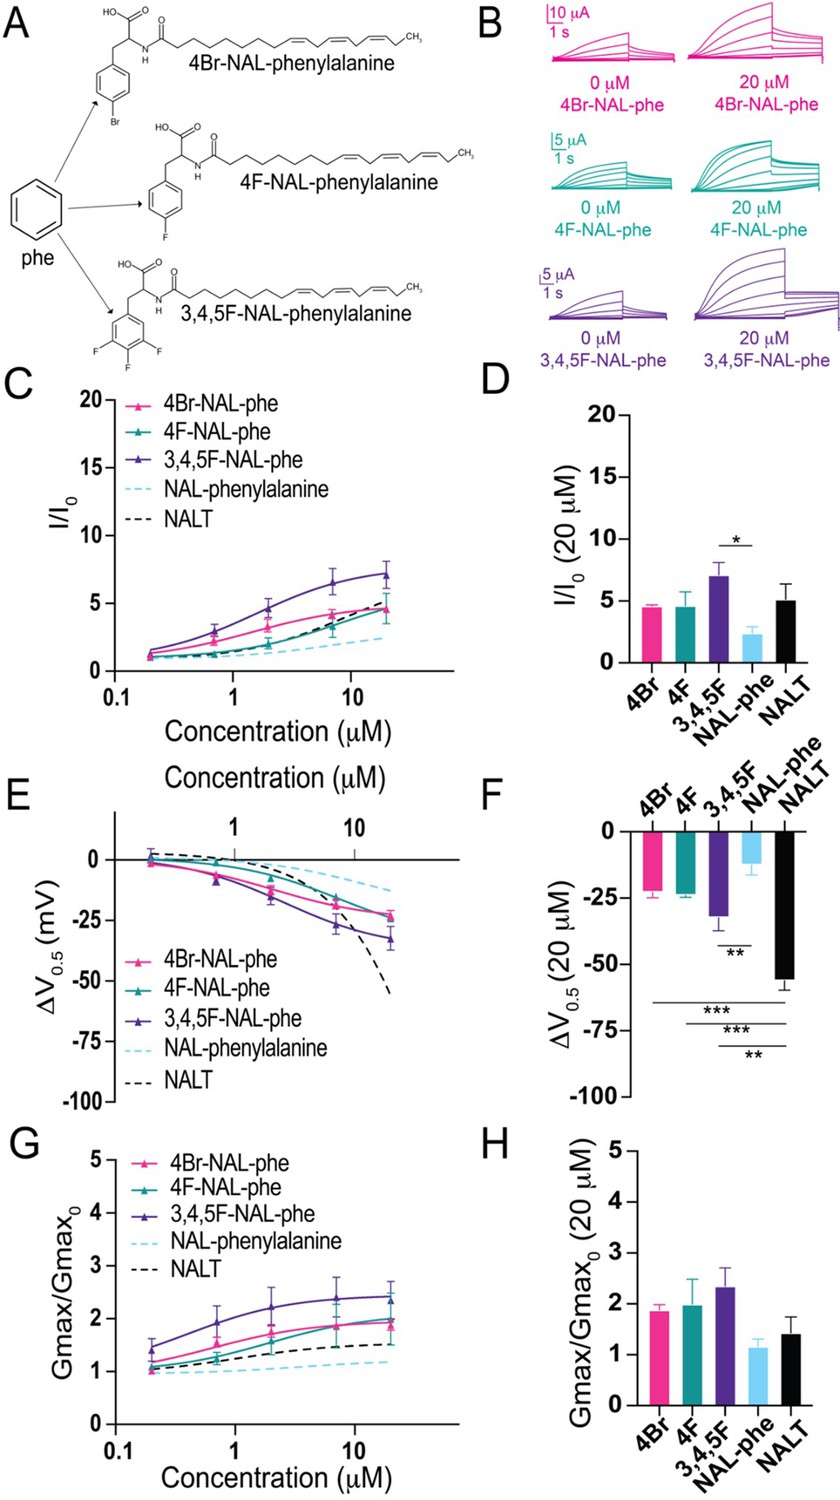
The addition of electronegative atoms to phenylalanine polyunsaturated fatty acid (PUFA) analogues strengthens IKs channel activation through improved effects on Gmax.
(A) Structures of 4Br-NAL-phe, 4F-NAL-phe, and 3,4,5F-NAL-phe. (B) Representative traces for 4Br-NAL-phe (pink), 4F-NAL-phe (teal), and 3,4,5F-NAL-phe (purple) with 0 μM PUFA (left) and 20 μM PUFA (right). (C, E, G) I/I0, (E) ΔV0.5, and (G) Gmax dose–response curves for NAL-phe (n = 4), 4Br-NAL-phe (n = 3), 4F-NAL-phe (n = 4), and 3,4,5F-NAL-phe (n = 5) with dotted line representing dose response of NALT (n = 4). (D, F, H) Maximum effects on (D) I/I0, (F) ΔV0.5, and (H) Gmax (at 20 μM) for 4Br-NAL-phe (n = 3), 4F-NAL-phe (n = 4), and 3,4,5F-NAL-phe (n = 5). Asterisks indicate statistically significant differences determined by one-way ANOVA with Tukey’s test for multiple comparisons. Values for all compounds and concentrations available in Figure 3—source data 1.
-
Figure 3—source data 1
Source Data for Panels C-H.
- https://cdn.elifesciences.org/articles/85773/elife-85773-fig3-data1-v2.docx
Figure 4
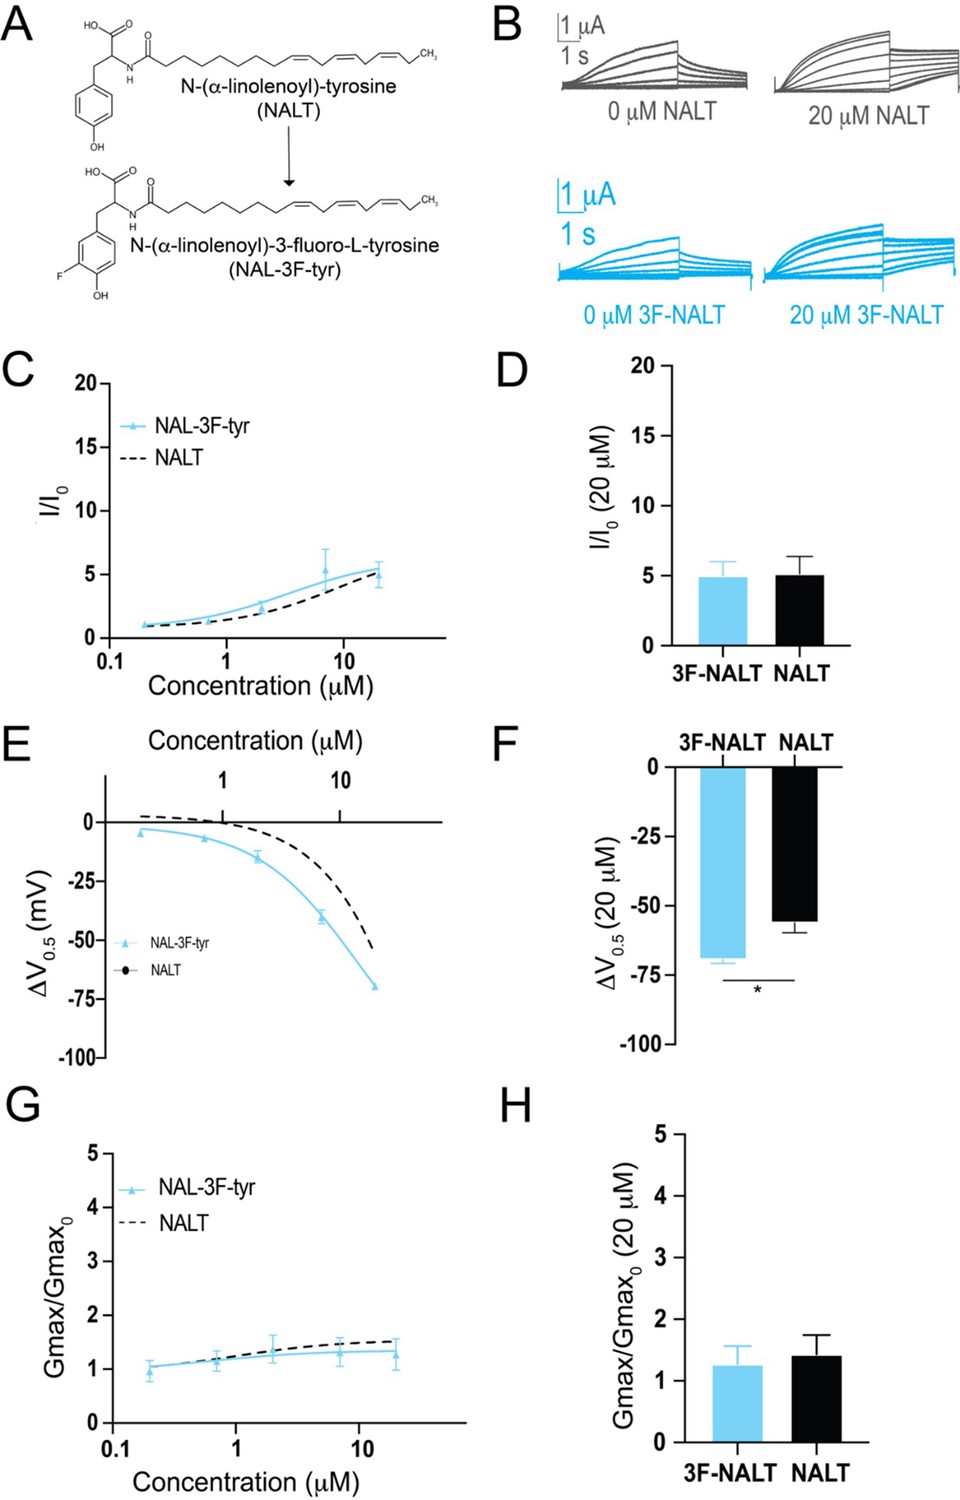
Hydrogen bonding through the distal –OH group of tyrosine polyunsaturated fatty acids (PUFAs) is important for effects on IKs channel voltage dependence.
(A) Structures of NALT and 3F-NALT. (B) Representative traces of NALT (gray) and 3F-NALT (cyan) with 0 μM PUFA (left) and 20 μM PUFA (right). (C, E, G) I/I0, (E) ΔV0.5, and (G) Gmax dose–response curves for NALT (black dashed line) (n = 4) and 3F-NALT (cyan) (n = 3). (D, F, H) Maximum effects on (D) I/I0, (F) ΔV0.5, and (H) Gmax (at 20 μM) for 3F-NALT (n = 3) and NALT (n = 4). Values for all compounds and concentrations available in Figure 4—source data 1.
-
Figure 4—source data 1
Source Data for Panels C-H.
- https://cdn.elifesciences.org/articles/85773/elife-85773-fig4-data1-v2.docx
Figure 5
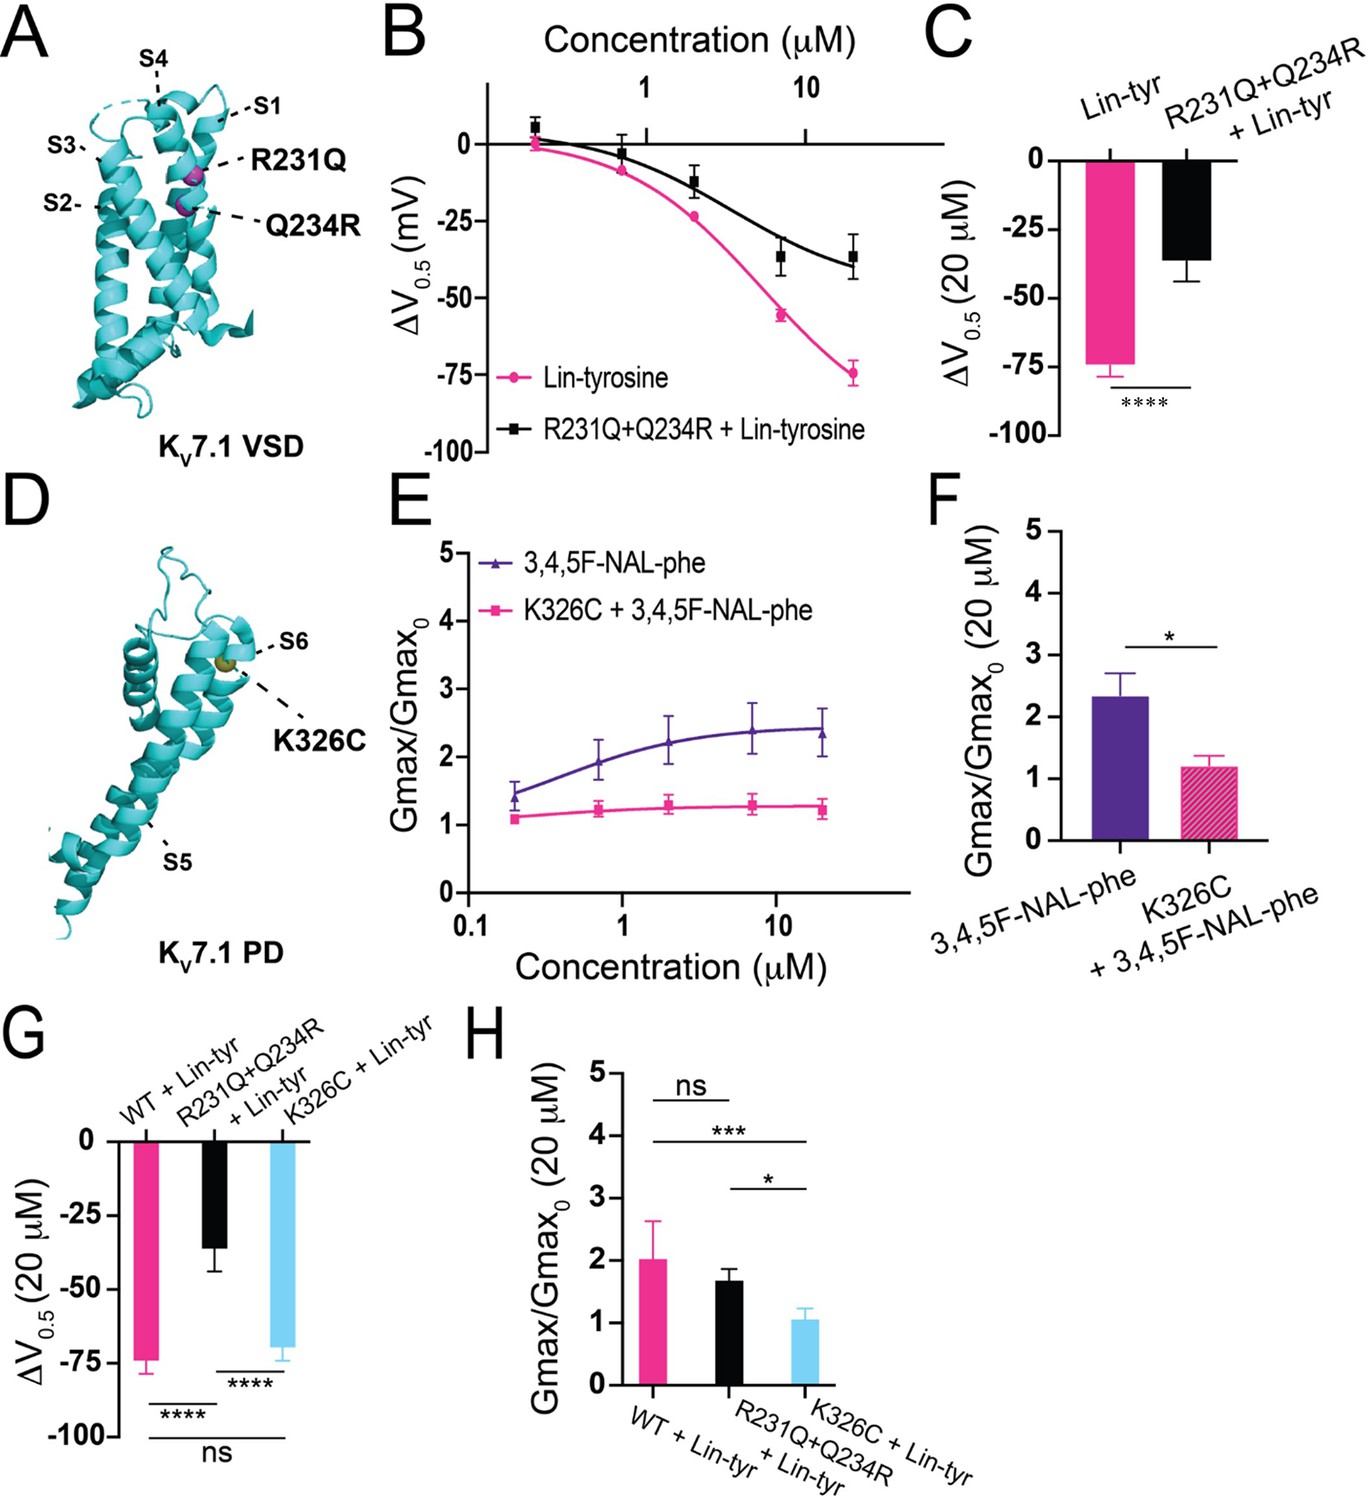
Proposed mechanisms of aromatic polyunsaturated fatty acids (PUFAs).
(A) Structure of KV7.1 voltage-sensing domain (VSD) based on PDB: 6V00A projected using PyMOL Software (Schrödinger L and DeLano 2020). Pink spheres indicate mutated residues in the S4 segment, R321Q-Q234R, which are implicated in PUFA-mediated effects on voltage dependent activation. (B) ΔV0.5 dose–response curve for WT KV7.1/KCNE1 + Lin-tyr (pink) (n = 4) and KV7.1-R231Q-Q234R/KCNE1 + Lin-tyr (black) (n = 5). (C) Maximum effects on ΔV0.5 (at 20 μM) for WT KV7.1/KCNE1 + Lin-tyr (n = 4) and KV7.1-R231Q-Q234R/KCNE1 + Lin-tyr (n = 5). (D) Structure of KV7.1 pore domain (PD). Yellow spheres indicate mutated residue in the S6 segment, K326C, which is implicated in PUFA-mediated effects on maximal conductance. (E) Gmax dose–response curve for WT KV7.1/KCNE1 + 3,4,5F-NAL-phe (purple) (n = 5) and KV7.1-K326C/KCNE1 + 3,4,5F-NAL-phe (pink) (n = 3). (F) Maximum effects on Gmax (at 20 μM) for WT KV7.1/KCNE1 + 3,4,5F-NAL-phe (n = 5) and KV7.1-K326C/KCNE1 + 3,4,5F-NAL-phe (n = 3). (G) Maximum effects on ΔV0.5 (at 20 μM) of Lin-tyr on WT KV7.1/KCNE1 (n = 4), KV7.1-R231Q-Q234R/KCNE1 (n = 5), and KV7.1-K326C/KCNE1 (n = 6). (H) Maximum effects on Gmax (at 20 μM) of Lin-tyr on WT KV7.1/KCNE1 (n = 6), KV7.1-R231Q-Q234R/KCNE1 (n = 5), and KV7.1-K326C/KCNE1 (n = 6). Values for all compounds and concentrations available in Figure 5—source data 1.
-
Figure 5—source data 1
Source Data for Panels B, C, E, F, G, and H.
- https://cdn.elifesciences.org/articles/85773/elife-85773-fig5-data1-v2.docx
Figure 6
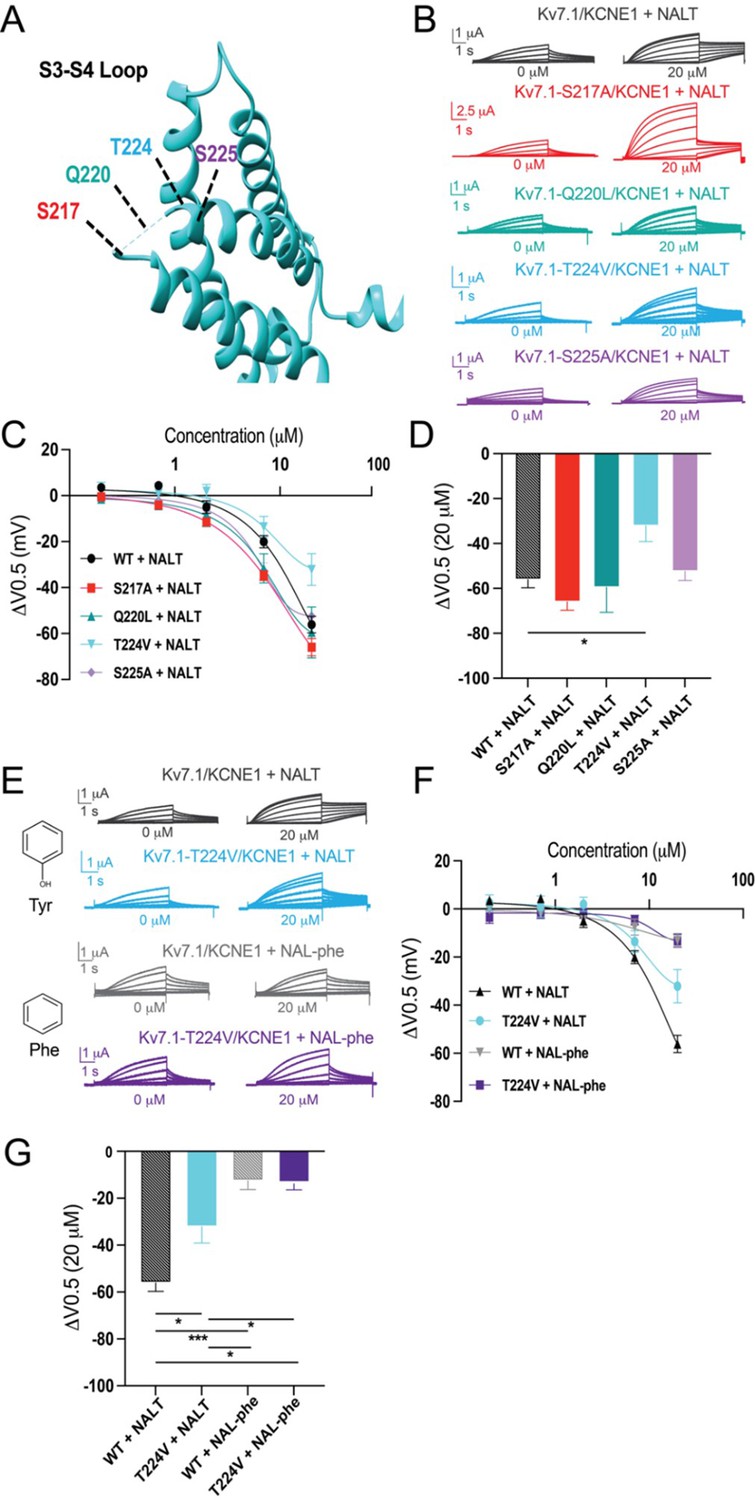
Loop is the locus for hydrogen bonding interactions with tyrosine polyunsaturated fatty acids (PUFAs).
(A) Top view of KV7.1 voltage-sensing domain (VSD) highlighting mutated residues in the S3–S4 loop. (B) Representative traces of WT KV7.1/KCNE1 (black), KV7.1-S217A/KCNE1 (red), KV7.1-Q220L/KCNE1 (teal), KV7.1-T224V/KCNE1 (cyan), and KV7.1-S225A/KCNE1 (purple) with 0 μM (left) and 20 μM (right) NALT. (C) ΔV0.5 dose–response curve for WT KV7.1/KCNE1 (n = 4), KV7.1-S217A/KCNE1 (n = 5), KV7.1-Q220L/KCNE1 (n = 3), KV7.1-T224V/KCNE1 (n = 4), and KV7.1-S225A/KCNE1 (n = 7) with NALT. (D) Maximum effects on ΔV0.5 (at 20 μM) for WT and S3–S4 loop mutations. Asterisks indicate statistically significant differences determined by one-way ANOVA. (E) Representative traces of WT KV7.1/KCNE1 with NALT (black) and NAL-phe (gray) compared to KV7.1-T224V/KCNE1 with NALT (cyan) and NAL-phe (dark purple), KV7.1-S217A/KCNE1 (red), KV7.1-Q220L/KCNE1 (teal), KV7.1-T224V/KCNE1 (cyan), and Kv7.1-S225A/KCNE1 (purple) with 0 μM (left) and 20 μM (right) NALT. (F) ΔV0.5 dose–response curve for WT KV7.1/KCNE1 and KV7.1-T224V/KCNE1 with NALT and NAL-phe. (G) Maximum effects on ΔV0.5 (at 20 μM) for WT KV7.1/KCNE1 (n = 4) and KV7.1-T224V/KCNE1 with NALT (n = 4) and NAL-phe (n = 7). Asterisks indicate statistically significant differences determined by one-way ANOVA. Values for all compounds and concentrations available in Figure 6—source data 1.
-
Figure 6—source data 1
Source Data for Panel C, D, F, and G.
- https://cdn.elifesciences.org/articles/85773/elife-85773-fig6-data1-v2.docx
Figure 7
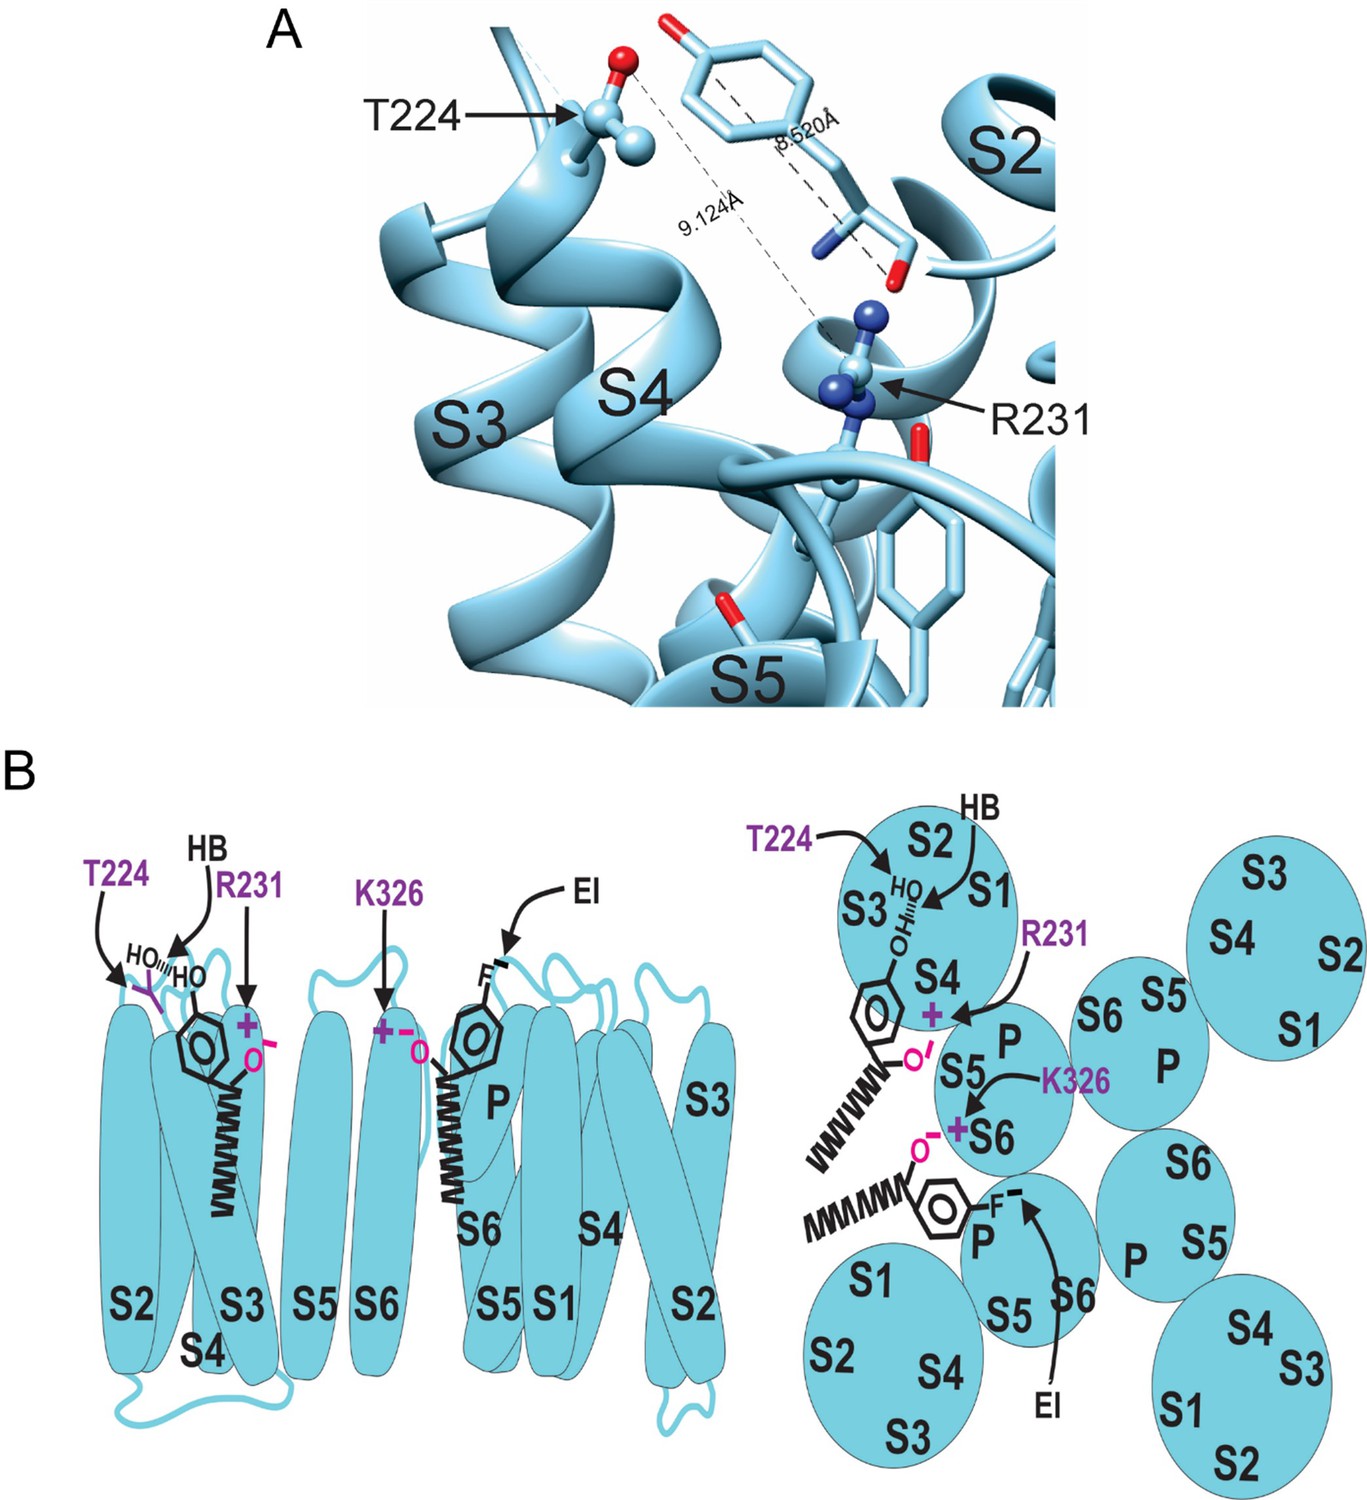
Model for aromatic polyunsaturated fatty acid (PUFA) interaction with Kv7.1/KCNE1 channels.
(A) Image of the KCNQ1 structure (PDB 6UZZ) marking the distance between R231 and T224. This distance is shown in comparison to the length of a tyrosine head group. (B) Model for aromatic PUFAs effect on KV7.1/KCNE1 channels, side view (left) and top view (right). One site is between S4 and S5: Aromatic PUFAs shift the voltage dependence of opening by stabilizing the upstate of S4 by an electrostatic interaction between R231(+) and the carboxyl group (O-) of the PUFA. A hydrogen bond (HB) by the hydroxyl group (OH) at the para site of the aromatic ring of the PUFA with T224 stabilizes the PUFA in this site. Another site is between S6 and S1: aromatic PUFAs increase the maximum conductance by an electrostatic interaction between K326(+) and the carboxyl group (O-). An electrostatic interaction (EI) by the para fluorine (F-) stabilize the PUFA in this site.
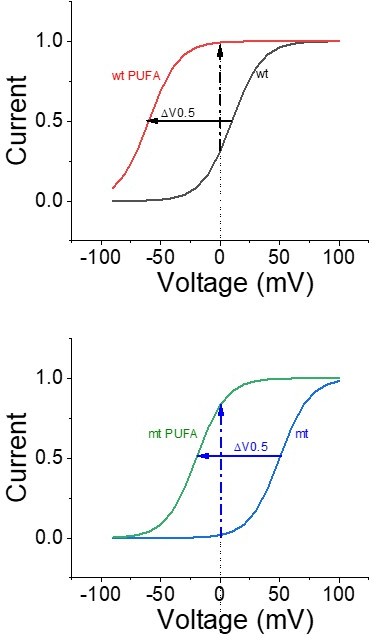
Author response image 1
Additional files
Download links
A two-part list of links to download the article, or parts of the article, in various formats.
Downloads (link to download the article as PDF)
Open citations (links to open the citations from this article in various online reference manager services)
Cite this article (links to download the citations from this article in formats compatible with various reference manager tools)
Mechanistic insights into robust cardiac IKs potassium channel activation by aromatic polyunsaturated fatty acid analogues
eLife 12:e85773.
https://doi.org/10.7554/eLife.85773


