APOE expression and secretion are modulated by mitochondrial dysfunction
- Department of Cell Biology, Emory University, United States
- Department of Pathology and Laboratory Medicine, Emory University, United States
- Department of Psychiatry and Behavioral Sciences, Emory University, United States
- Department of Neurology and Human Genetics, Emory University, United States
- Department of Biochemistry, Emory University, United States
- Program in Neuroscience, Middlebury College, United States
- Department of Biochemistry, University of Missouri, United States
- Department of Physiology, Johns Hopkins University, United States
- Department of Neurology and Biochemistry & Molecular Biology, University of Miami, United States
Figures
Figure 1
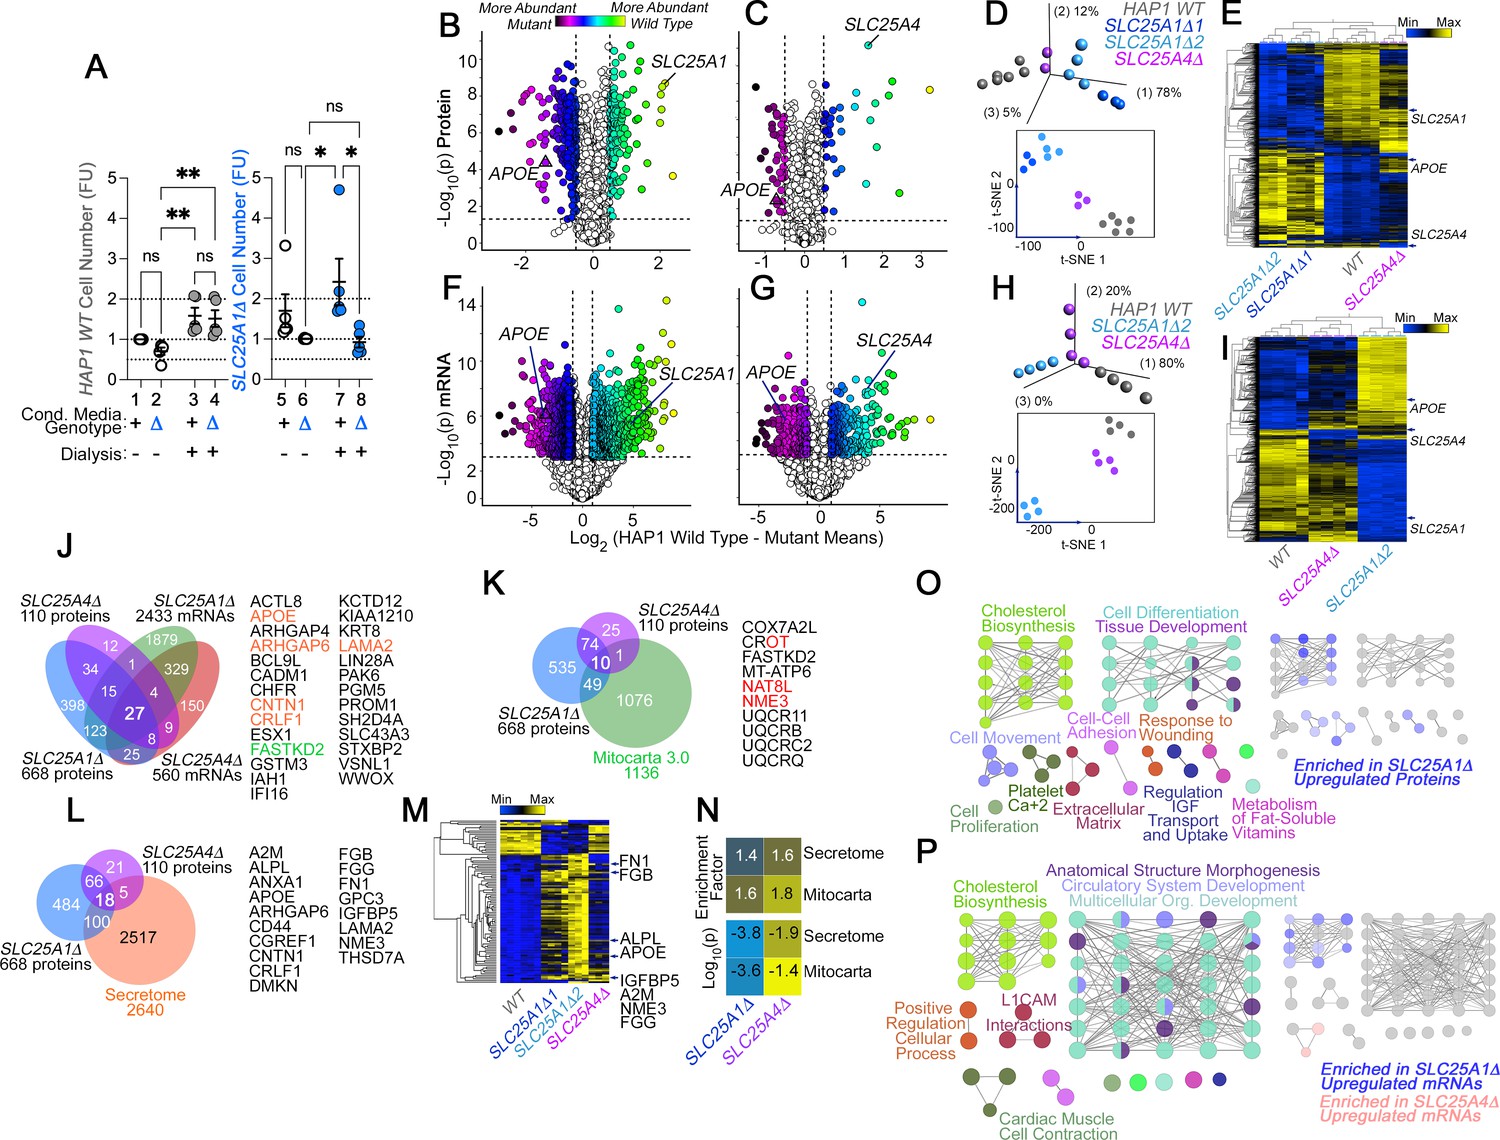
The secreted and mitochondrial proteomes are Modified by Inner Mitochondrial Membrane Transporter Mutants.
(A) Cell number determinations of wild-type (columns 1–4) and SLC25A1-null HAP1 cells (SLC25A1Δ, columns 5–8) grown in the presence of conditioned media from each genotype. Conditioned media was applied to cells for 48 hr before (columns 1, 2, 5, and 6) or after dialysis (columns 3, 4, 7, and 8). Cell number was determined by Alamar blue cell viability assay. FU, Normalized Alamar Blue Fluorescence Units. Mean ± SEM, n=5, Two-Way ANOVA followed by Benjamini, Krieger and Yekutieli corrections. (B–C) Volcano plots of TMT proteomic data from wild-type HAP1 cells (n=3), SLC25A1Δ (B, n=3 for two independent CRISPR clones), and SLC25A4Δ mutants (C, n=3), depicted are log10 p values and log2 fold of change. (D) Principal component analysis and 2D-tSNE analyses of datasets in B-C. (E) Hierarchical clustering of all proteome hits where differential expression is significant with an α<0.001 in at least one mutant genotype. (F–G) Volcano plots of RNAseq data from wild-type HAP1 cells (n=4), SLC25A1Δ (B, n=4 for one independent CRISPR clone), and SLC25A4Δ mutants (C, n=4), depicted are log10 p values and log2 fold of change. (H) PCA and 2D-tSNE analyses of datasets in F-G. Subject grouping was determined by k-means clustering. (I) Hierarchical clustering of all RNAseq hits where differential expression is significant with an α=0.001 in at least one mutant genotype. (J) Venn diagram of protein and transcript hits shared by SLC25A1Δ and SLC25A4Δ mutants. Twenty-seven shared protein and RNA hits are annotated to either the human secretome (orange font) or annotated to Mitocarta 3.0 (green font). CROT was downregulated and upregulated in SLC25A1Δ and SLC25A4Δ mutants, respectively. (K) Venn diagram of protein hits in SLC25A1Δ and SLC25A4Δ mutants annotated in Mitocarta 3.0. (L) Venn diagram of protein hits in SLC25A1Δ and SLC25A4Δ mutants annotated in the Human Secretome (Uhlén et al., 2019). (M) Hierarchical clustering of all proteins annotated to the human secretome across genotypes. (N) Magnitude of compromise in secreted and mitochondrial proteomes in SLC25A1Δ and SLC25A4Δ mutants. p value was calculated with exact hypergeometric probability. (O–P) Gene ontology analysis of proteome (O) and transcriptome (P) in SLC25A1Δ and SLC25A4Δ mutants. Overlapping and mutant-specific ontologies are color-coded by percent of contribution >50% to an ontological category. Gray represents ontologies where all three mutants similarly contribute hits.
Figure 2 with 1 supplement

APOE transcripts and protein are upregulated independent from cholesterol levels in SLC25A1 and SLC25A4 mutants.
(A) MesoScale electrochemiluminescence solid phase ELISA determinations of human APOE in wild-type (column 1), SLC25A1Δ (columns 2 and 3), and SLC25A4Δ (column 4) HAP1 mutant cell lysates and conditioned media. Two independent SLC25A1Δ clones were tested (columns 2–3). Column 5 depicts complete media not exposed to cells. n=4. (B) APOE immunoblot of cellular extracts from wild-type, SLC25A1Δ, and SLC25A4Δ HAP1 mutant cells. HSP90 was used as a loading control. Lane 4 presents recombinant human APOE (rAPOE). In bold is the predicted molecular weight of rAPOE. (C) MesoScale ELISA measurements of human APOE in wild-type and SLC25A1Δ/Δ SH-SY5Y mutant cell lysates and conditioned media. (D–F) qRT-PCR quantification of APOE, sterol metabolism annotated genes, and housekeeping controls (VAMP2 and RPS20) in wild-type and diverse mutant cell lines. (D) and (E) show transcript levels in SLC25A1Δ and SLC25A4Δ HAP1 mutant cells, respectively. (F) depicts transcript levels in SLC25A1Δ/Δ SH-SY5Y mutant cells. All data are expressed as transcript ratio between mutant and wild-type. n=3 for D-F. (G–I) Volcano plots of positive mode untargeted lipidomics performed in SLC25A1Δ, SLC25A4Δ, and SLC25A1Δ/Δ mutant HAP1 and SH-SY5Y cells and their controls. Upper inserts present the distribution of cholesterol ester and triglyceride species marked by triangles. Depicted are log10 p values and log2 fold of change. n=4 per clone for the two SLC25A1Δ clones, n=4 for SLC25A4Δ, and n=4 for SLC25A1Δ/Δ. (J). Total cellular levels of free cholesterol (Ch), cholesterol ester (ChE), and triglycerides (TG) in wild-type, SLC25A1Δ, and SLC25A4Δ HAP1 cells. (K). Total cellular levels of free cholesterol (Ch), cholesterol ester (ChE), and triglycerides (TG) in wild-type and SLC25A1Δ/Δ SH-SY5Y cells. Average ± SEM, One-way ANOVA followed by Bonferroni or Holm-Šydák’s (D–F) multiple corrections, or unpaired t-test (K). See available source data for (B).
-
Figure 2—source data 1
Original blots.
- https://cdn.elifesciences.org/articles/85779/elife-85779-fig2-data1-v2.zip
-
Figure 2—source data 2
Original blots.
- https://cdn.elifesciences.org/articles/85779/elife-85779-fig2-data2-v2.zip
Figure 2—figure supplement 1
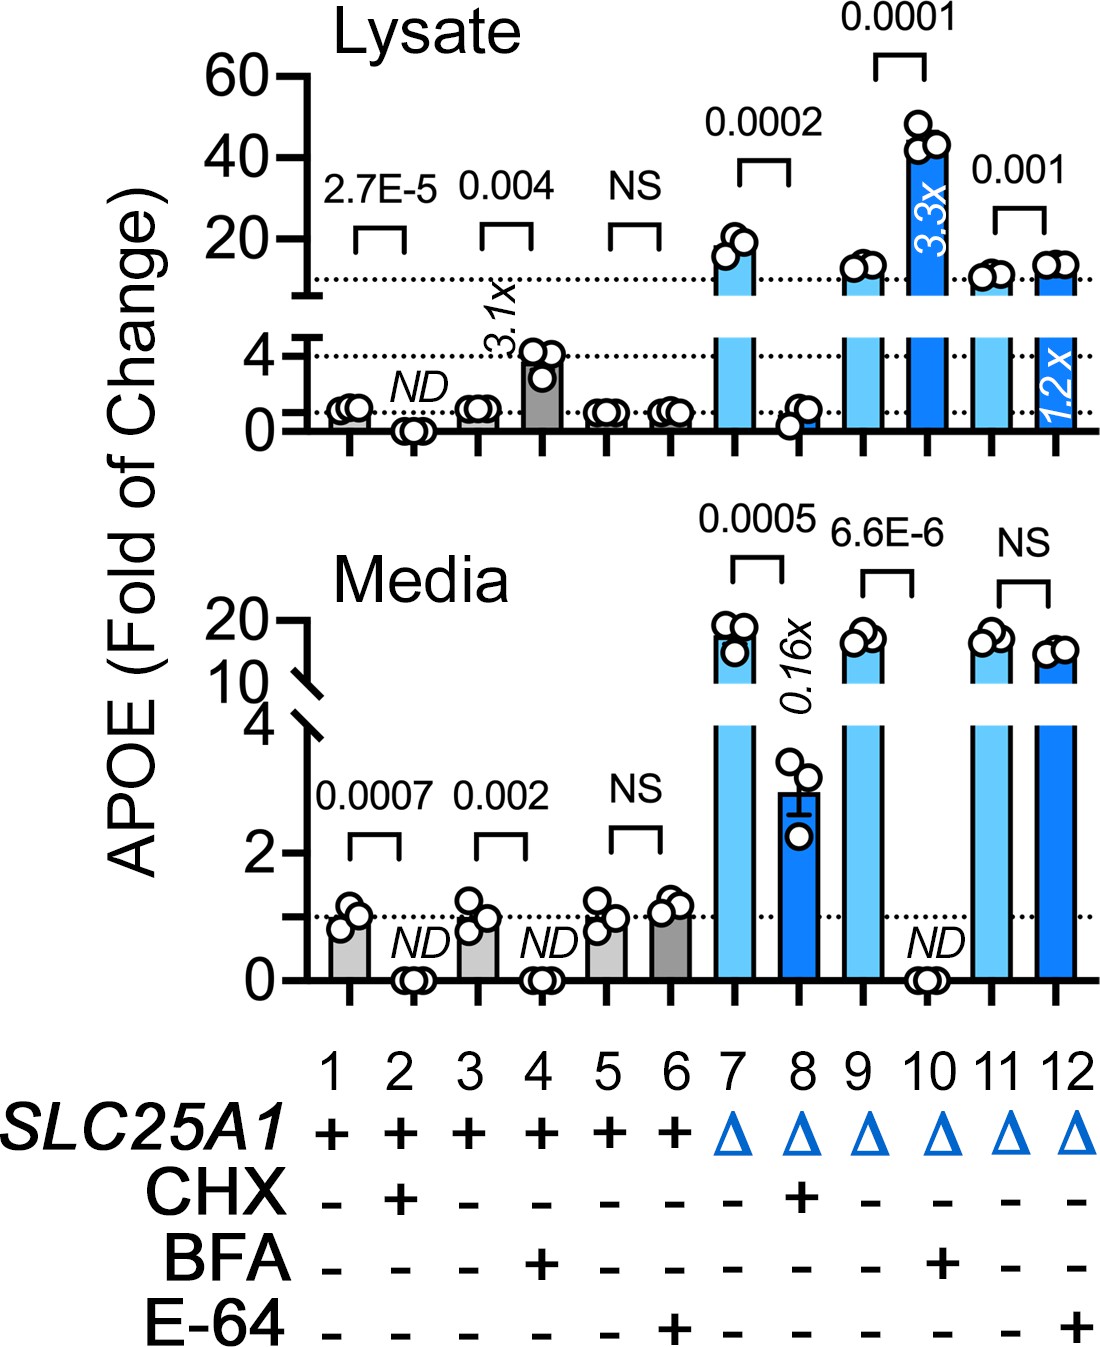
Effects of diverse mon-mitochondrial inhibitors on APOE expression and secretion.
Figure 3 with 3 supplements
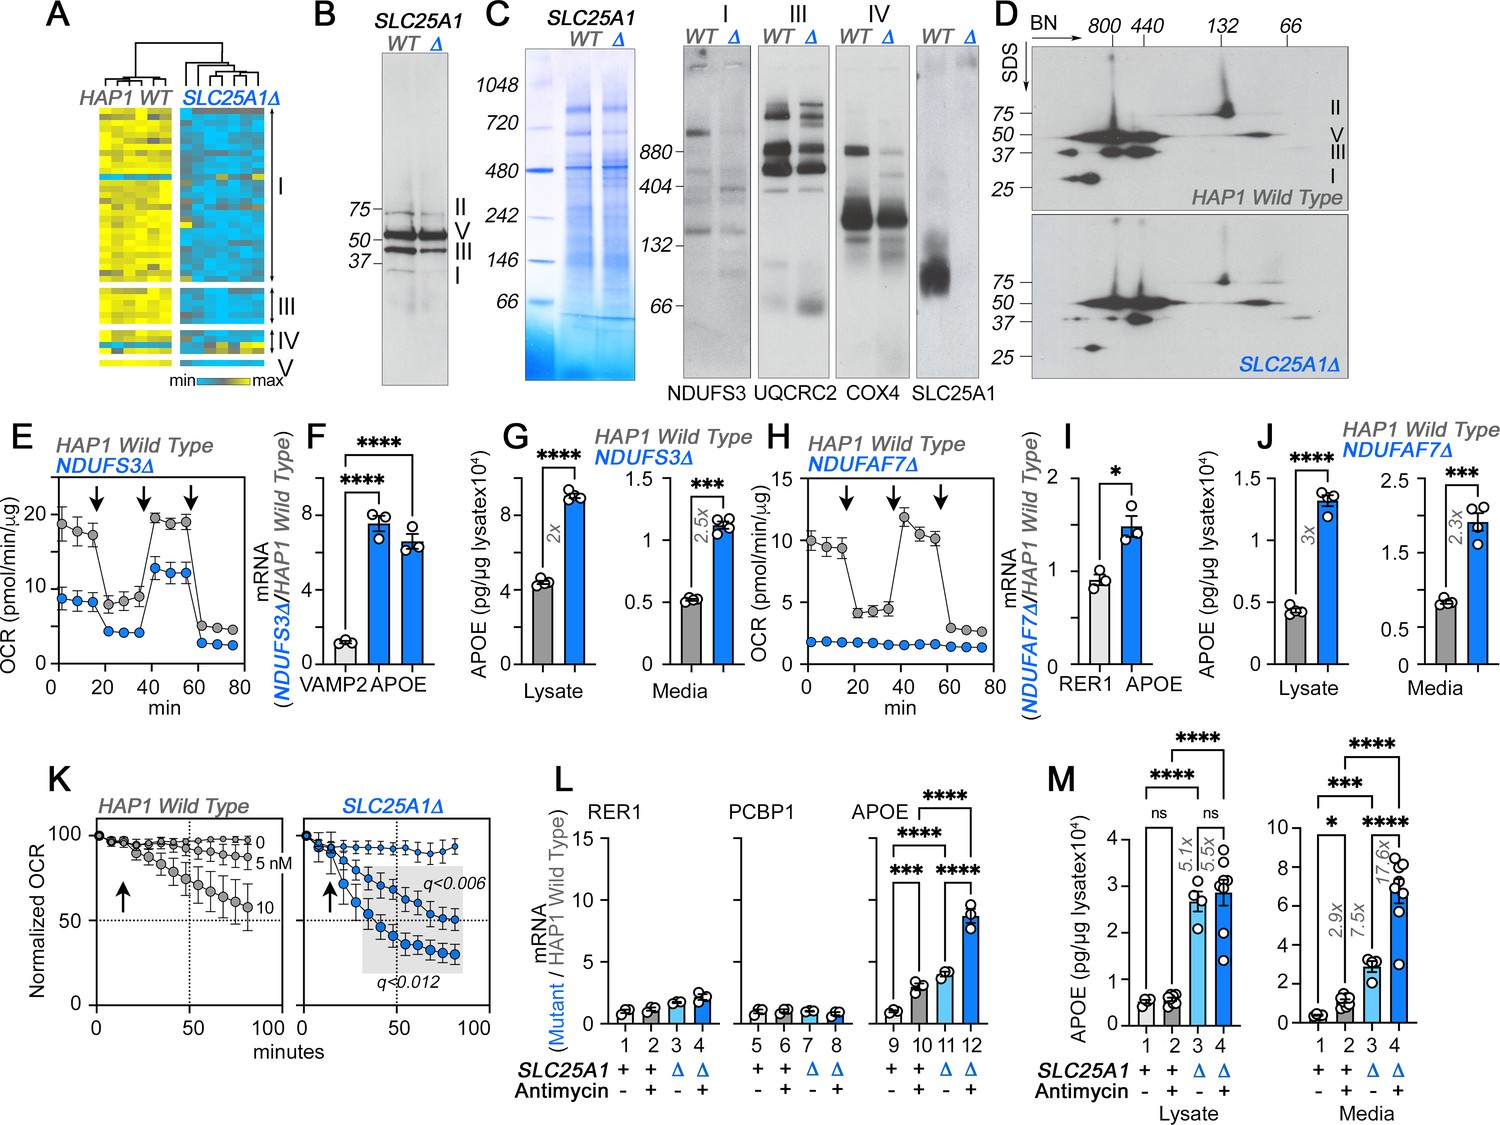
The integrity of respiratory chain complex I is required to control APOE expression.
(A) Expression of respiratory complex subunits in wild-type and SLC25A1Δ HAP1 cells quantified by TMT mass spectrometry. Kendal Tau hierarchical clustering analysis. (B) Immunoblots with OxPhos antibody mix in mitochondrial fractions from wild-type and SLC25A1Δ cells. (C) Blue native electrophoresis of mitochondrial fractions from wild-type and SLC25A1Δ cells. Shown are Coomassie stained native gel and immunoblots probed with antibodies against complex, I, III, IV, and SLC25A1. (D) Blue native electrophoresis followed by SDS-PAGE then immunoblot with antibodies against complex, I, II, III, and V in mitochondrial fractions from wild-type and SLC25A1Δ cells. (E–G). Seahorse stress test, APOE qRT-PCR, and APOE MesoScale ELISA analysis respectively in wild-type and NDUFS3Δ HAP1 cells. In (F), APOE was measured with two primer sets. (H–J) Seahorse stress test, APOE qRT-PCR, and APOE MesoScale ELISA analysis respectively in wild-type and NDUFAF7Δ HAP1 cells. VAMP2 or RER1 transcripts were used as controls in F and J. All qRT-PCR data are expressed as ratio between mutant and wild-type. (E to M) average ± SEM. One-Way ANOVA followed by Šydák’s multiple correction (F), or unpaired t-test with Welch’s correction (G, I, and J). Arrows in E (n=4) and H (n=3) show sequential addition of oligomycin, FCCP, and rotenone-antimycin during the Seahorse stress test. (K) SLC25A1Δ cells are more sensitive to antimycin than wild-type HAP1 cells. Wild type and SLC25A1Δ cells were exposed to vehicle or increasing concentrations of antimycin. Basal cellular respiration was measured for 90 min after additions (arrow) using Seahorse. Data are presented normalized to basal respiration in the absence of drug. Average ± SEM, n=3, Gray square shows significant differences between wild-type and SLC25A1Δ drug-treated cells as determined by multiple unpaired t-tests followed by corrections with the Benjamini-Krieger-Yekuiteli method (FDR = 5%). (L–M) APOE qRT-PCR and APOE MesoScale ELISA in wild-type and SLC25A1Δ HAP1 cells, respectively, treated with vehicle or antimycin. Twenty nM antimycin was used in qPCR experiments. Twenty to 80 nM was used in MesoScale ELISA experiments. RER1 (columns 1–4) and PCBP1 transcripts (columns 5–8) were used as housekeeping controls. All qRT-PCR data are expressed as ratio between mutant and wild-type. Average ± SEM, One-way ANOVA followed by Benjamini-Krieger-Yekuiteli multiple comparison corrections (FDR = 5%). See available source data for (B and C).
-
Figure 3—source data 1
Original gels and blots.
- https://cdn.elifesciences.org/articles/85779/elife-85779-fig3-data1-v2.zip
-
Figure 3—source data 2
Original gels and blots.
- https://cdn.elifesciences.org/articles/85779/elife-85779-fig3-data2-v2.zip
Figure 3—figure supplement 1
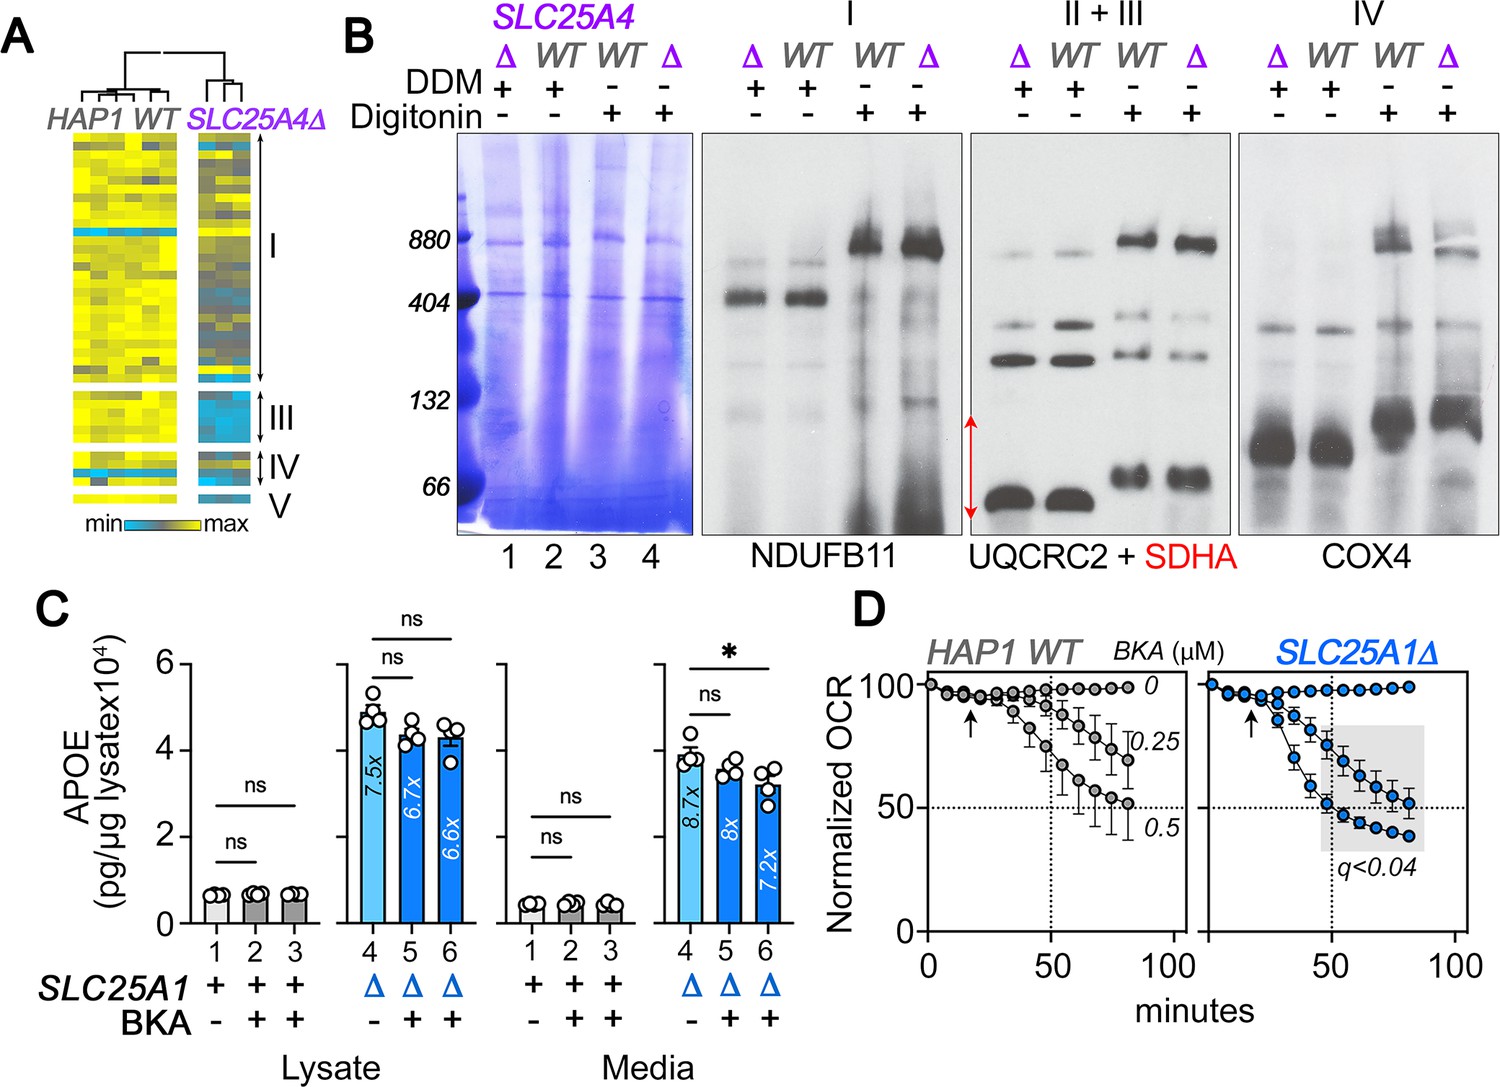
SLC25A4 null HAP1 cells disrupt complex III and increase expression of APOE.
(A) Expression of respiratory complex subunits in wild-type and SLC25A4Δ HAP1 cells quantified by TMT mass spectrometry. Kendal Tau hierarchical clustering analysis. (B) Blue native electrophoresis followed by either Coomassie or immunoblotting with antibodies against complex, I, II, III, and IV in mitochondrial fractions from wild-type and SLC25A4Δ HAP1 cells. n-dodecyl-β-d-maltoside (DDM) was used to disrupt supercomplexes. (C) APOE MesoScale ELISA in wild-type and SLC25A1Δ HAP1 cells treated with vehicle (columns 1 and 4) or bongkrekic acid 0.25 and 0.5 µM for 48 hr (columns 2 and 5 and 3 and 6, respectively). Average ± SEM, One-way ANOVA followed by Dunnett’s multiple comparisons test. (D) Wild-type and SLC25A1Δ HAP1 cells were exposed to vehicle or increasing concentrations of bongkrekic acid (BKA). Basal cellular respiration was measured for 90 min after additions (arrow) using Seahorse. Data are presented normalized to basal respiration in the absence of drug. Average ± SEM, n=4 wild-type, n=8 for SLC25A1Δ mutants for treated and untreated cells. Gray square shows significant differences between wild-type and SLC25A1Δ drug-treated cells as determined by Two-way ANOVA followed by Two-stage linear step-up procedure of Benjamini, Krieger and Yekutieli (FDR 5%).
-
Figure 3—figure supplement 1—source data 1
Original gels and blots.
- https://cdn.elifesciences.org/articles/85779/elife-85779-fig3-figsupp1-data1-v2.zip
-
Figure 3—figure supplement 1—source data 2
Original gels and blots.
- https://cdn.elifesciences.org/articles/85779/elife-85779-fig3-figsupp1-data2-v2.zip
Figure 3—figure supplement 2
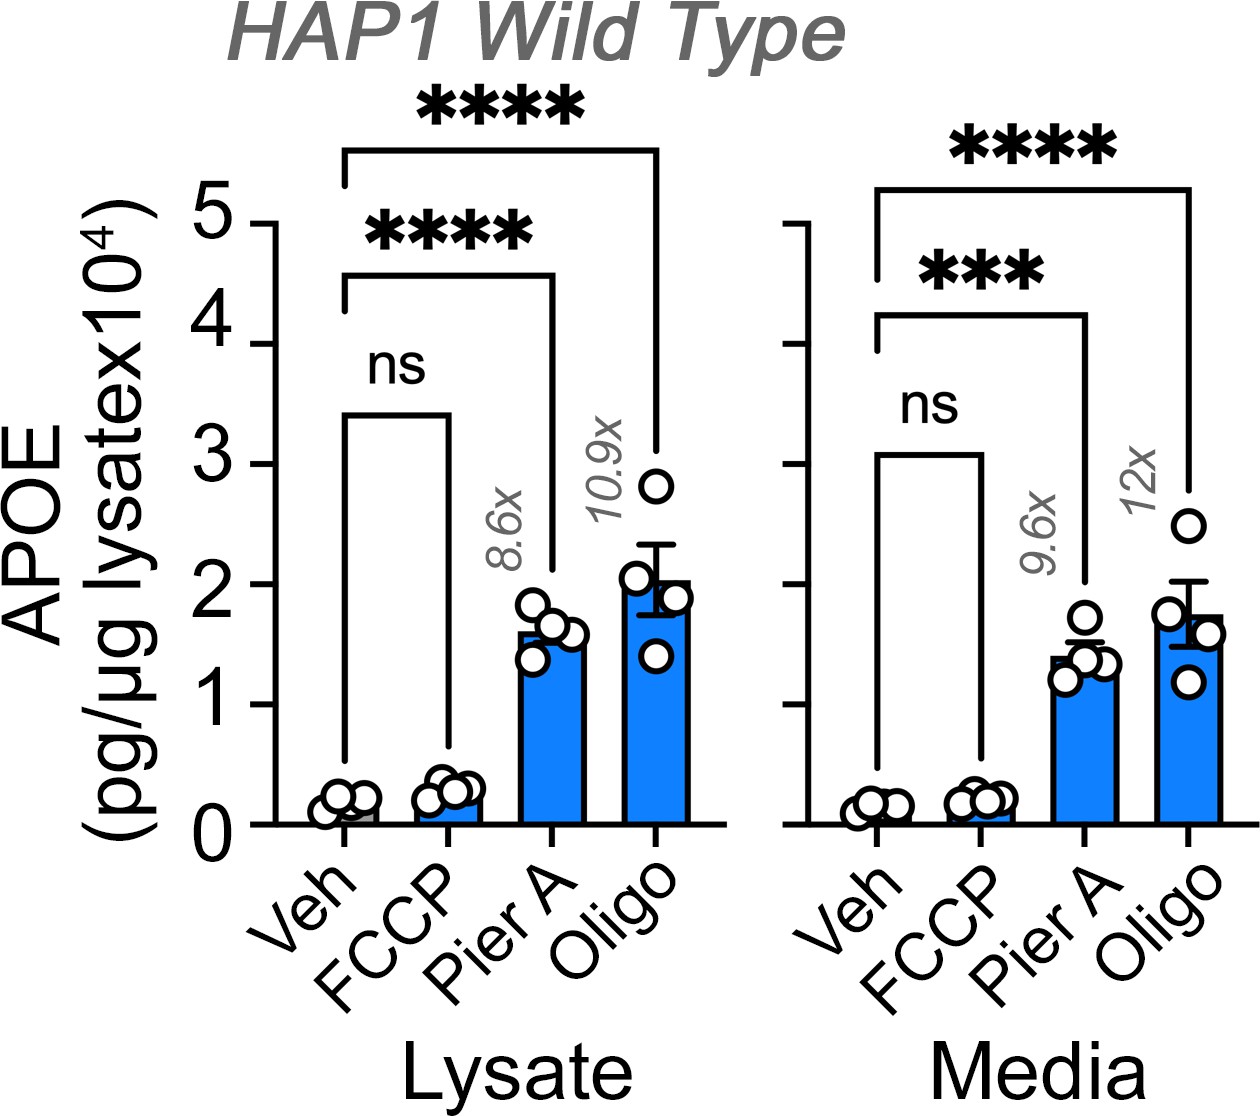
Effects of inhibitors of the electron transport chain on APOE levels.
Figure 3—figure supplement 3
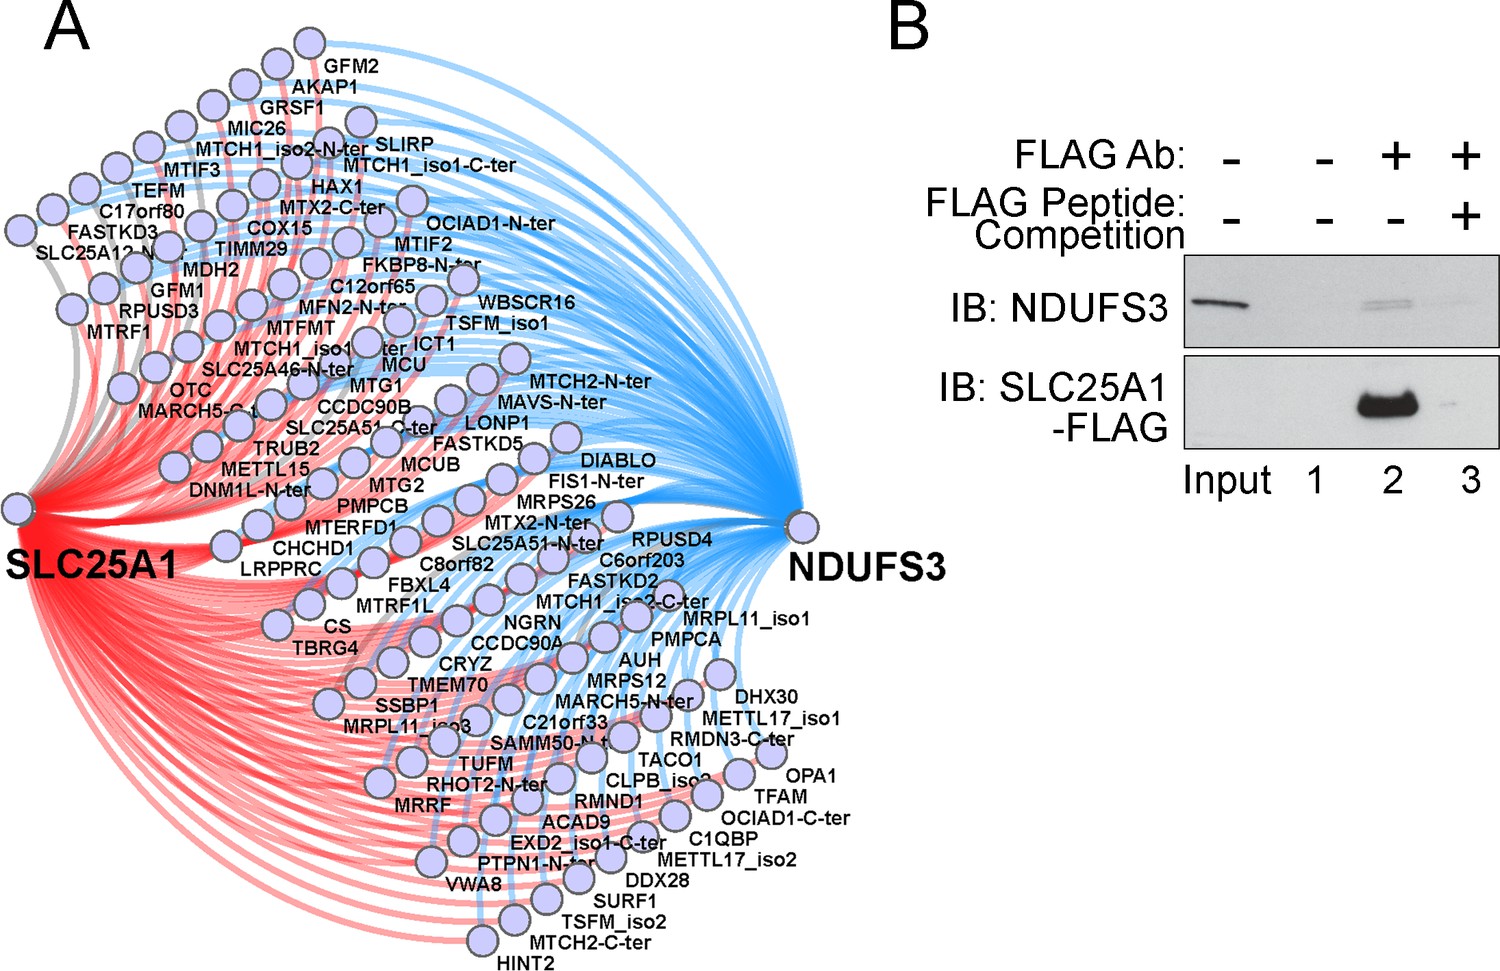
Interactions between SLC25A1 and NDUFS3.
(A) Proximity ligation map of interactions shared between SLC25A1 and NDUFS3. (B) SLC25A1-FLAG expressing SH-SY5Y cell lysates were immunoprecipitated with magnetic beads alone (lane 1) or FLAG antibodies (lanes 2–3), either in the absence or presence of an excess FLAG peptide for out-competition (Lanes 2 and 3, respectively). Immunoprecipitated complexes were probed by immunoblot with NDUSF3 antibody.
-
Figure 3—figure supplement 3—source data 1
Original blots.
- https://cdn.elifesciences.org/articles/85779/elife-85779-fig3-figsupp3-data1-v2.zip
-
Figure 3—figure supplement 3—source data 2
Original gels and blots.
- https://cdn.elifesciences.org/articles/85779/elife-85779-fig3-figsupp3-data2-v2.zip
Figure 4 with 1 supplement
Robustness and redundancy of adenine nucleotide translocators regulating APOE expression.
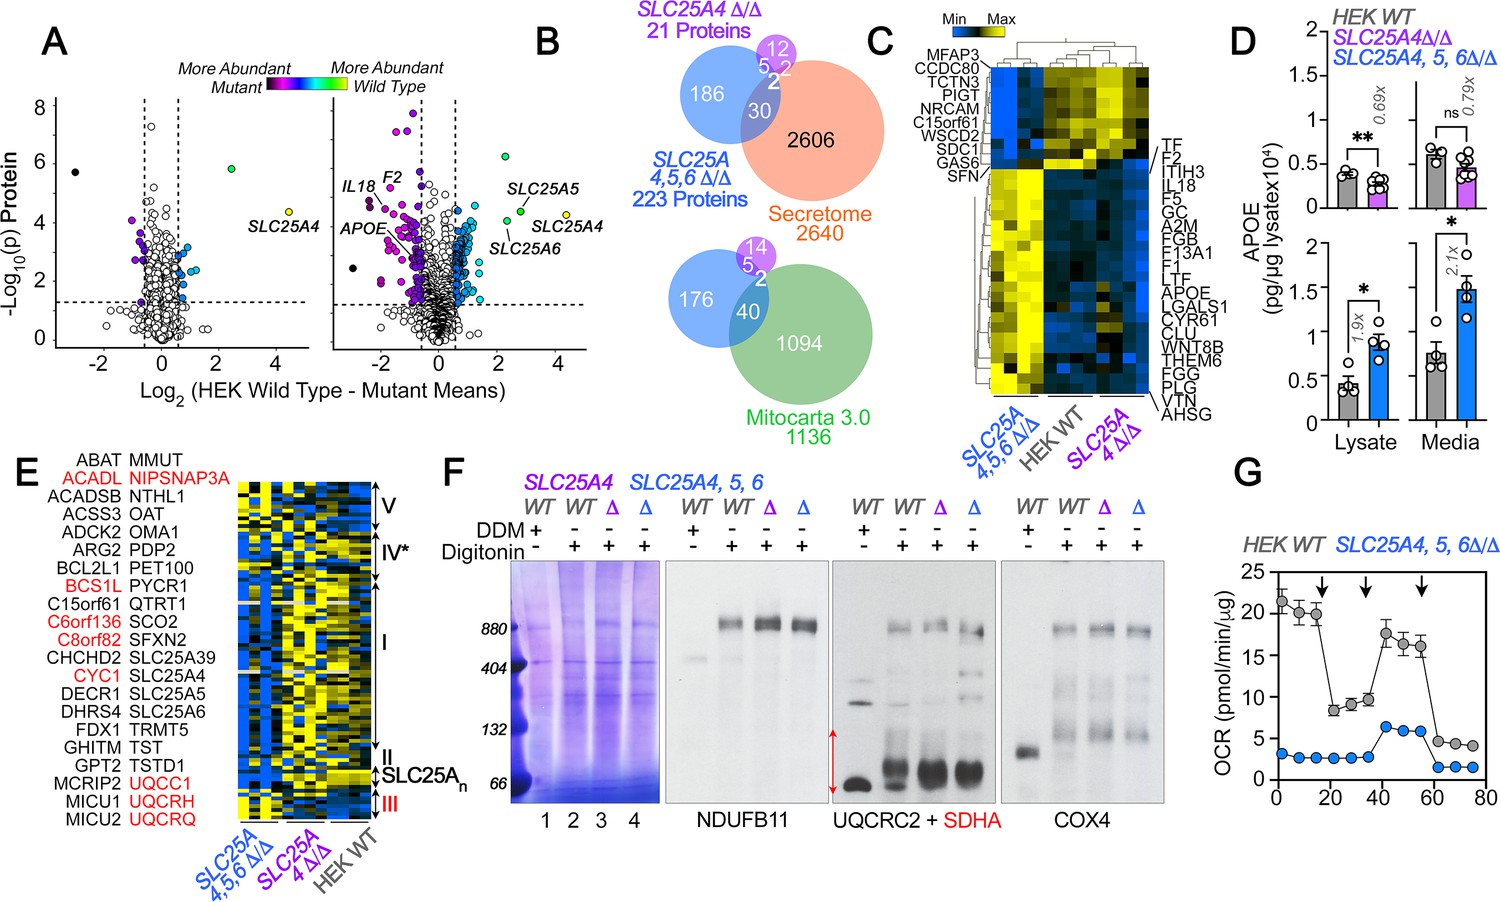
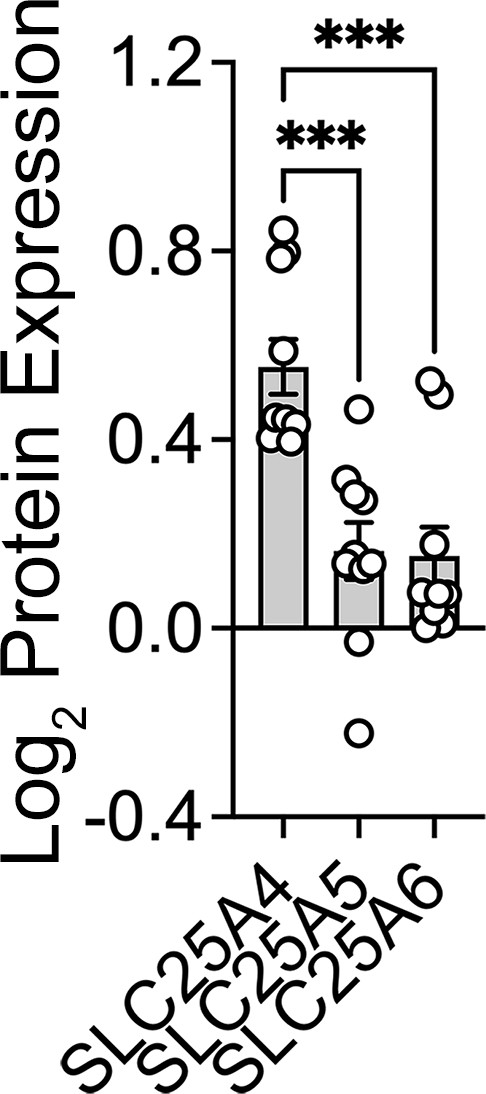
(A) Volcano plots of TMT proteomic data from wild-type HEK293 cells (n=4), SLC25A4Δ/Δ and triple knock-out SLC25A4,5,6Δ/Δ (B, n=4), depicted are log10 p values and log2 fold of change. (B). Venn diagram of protein hits in SLC25A4Δ/Δ and triple knock-out SLC25A4,5,6Δ/Δ mutants annotated in Mitocarta 3.0 or the Human Secretome (Uhlén et al., 2019). (C) Hierarchical clustering of all proteins annotated to the human secretome across genotypes. (D) MesoScale ELISA determinations of human APOE in wild-type and mutant HEK293 cells. Shown are APOE content in lysates and conditioned media. Mann-Whitney test. (E) Mitocarta 3.0 annotated hits in the triple knock-out SLC25A4,5,6Δ/Δ proteome, see panel B. Red font indicates increased levels in mutant. Hierarchical clustering of all proteins annotated to electron transport chain subunits and SLC25A transporters across genotypes. (F) Blue native electrophoresis followed by immunoblotting with antibodies against complex, I, II, III, and IV in mitochondrial fractions from wild-type and SLC25A4Δ/Δ and triple knock-out SLC25A4,5,6Δ/Δ cells. n-dodecyl-β-d-maltoside (DDM) was used to disrupt supercomplexes. Red arrow and font denote region blotted with SDHA antibodies. (G) Seahorse stress test wild-type and triple knock-out SLC25A4,5,6Δ/Δ cells as in Figure 3. N=3. See available source data for (F).
-
Figure 4—source data 1
Original gels and blots.
- https://cdn.elifesciences.org/articles/85779/elife-85779-fig4-data1-v2.zip
-
Figure 4—source data 2
Original gels and blots.
- https://cdn.elifesciences.org/articles/85779/elife-85779-fig4-data2-v2.zip
Figure 4—figure supplement 1
SLC25A4 null HAP1 cells disrupt complex III and increase expression of APOE.
Figure 5 with 5 supplements
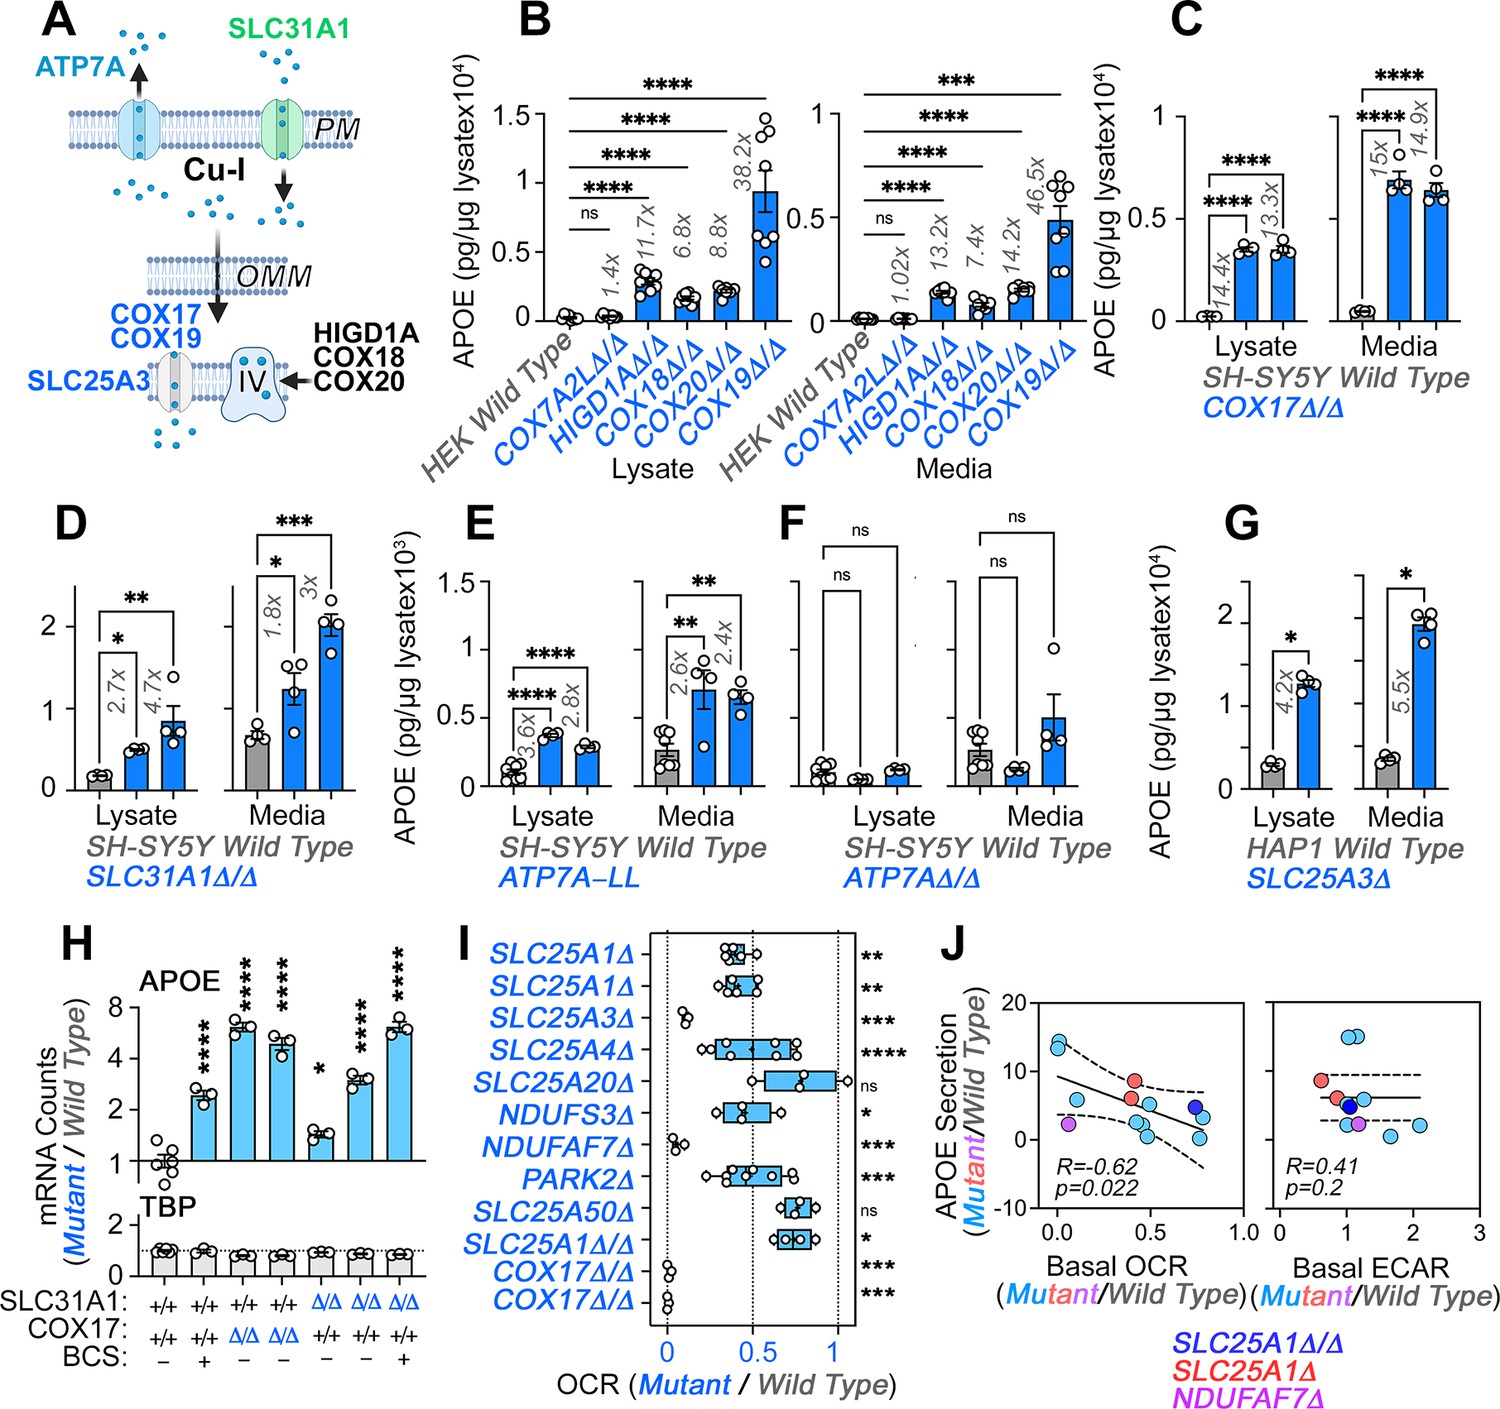
Direct and indirect disruption of complex IV increases APOE expression.
(A) Direct (COX17-20, HIGD1A) and indirect (SLC25A3, SLC31A1, ATP7A) mechanisms required for complex IV assembly. (B) MesoScale ELISA determinations of human APOE in wild-type and HEK293 cell clones null for the genes indicated in blue font. Shown are APOE content in lysates and conditioned media. (C) MesoScale ELISA determinations of human APOE in wild-type and two independent COX17Δ/Δ mutant SH-SY5Y cell clones. (D) MesoScale ELISA determinations of human APOE in wild-type and two independent SLC31A1Δ/Δ mutant SH-SY5Y cell clones were studied. (E) MesoScale ELISA determinations of human APOE in wild-type and two independent ATP7AΔ/Δ mutant SH-SY5Y cell clones transfected with the endocytosis-deficient ATP7A-LL construct. (F) MesoScale ELISA determinations of human APOE in wild-type and two independent ATP7AΔ/Δ mutant SH-SY5Y cell clones. (G) MesoScale ELISA determinations of human APOE in wild-type and SLC25A3Δ mutant HAP1 cells were studied. N=8 for B and n=4 for C-G. (H) NanoString mRNA quantification of human APOE and TBP transcripts in wild-type, and two independent mutant clones of either COX17Δ/Δ or SLC31A1Δ/Δ mutant SH-SY5Y cells. Wild type and SLC31A1Δ/Δ cells were treated with vehicle or 200 micromolar of the copper chelator bathocuproinedisulfonic acid (BCS). TBP was used as a housekeeping control transcript. n=3. (I) Seahorse basal cellular respiration across different genotypes normalized to the corresponding wild-type cell. (J) Correlation between APOE in conditioned media with either basal cellular respiration (OCR) or the extracellular acidification rate determined by Seahorse (ECAR, n=3–9). Simple linear regression fit and 95% confidence interval is shown. All data are presented as average ± SEM. For B to F, and H One-way ANOVA followed by Benjamini-Krieger-Yekuiteli multiple comparison corrections (FDR = 5%). (G) unpaired t-test with Welch’s correction.
Figure 5—figure supplement 1
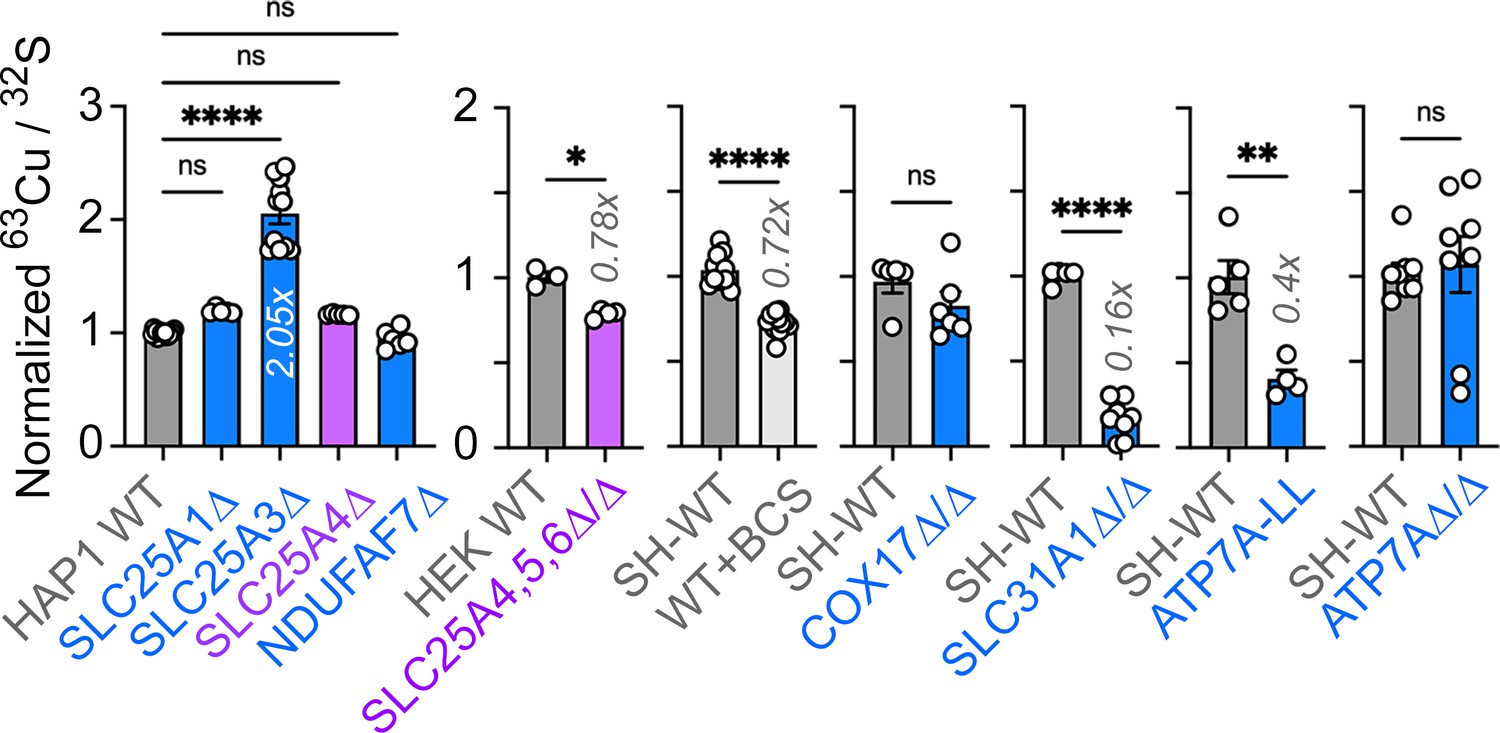
Total cellular copper in wild type and diverse mutant cells.
Figure 5—figure supplement 2
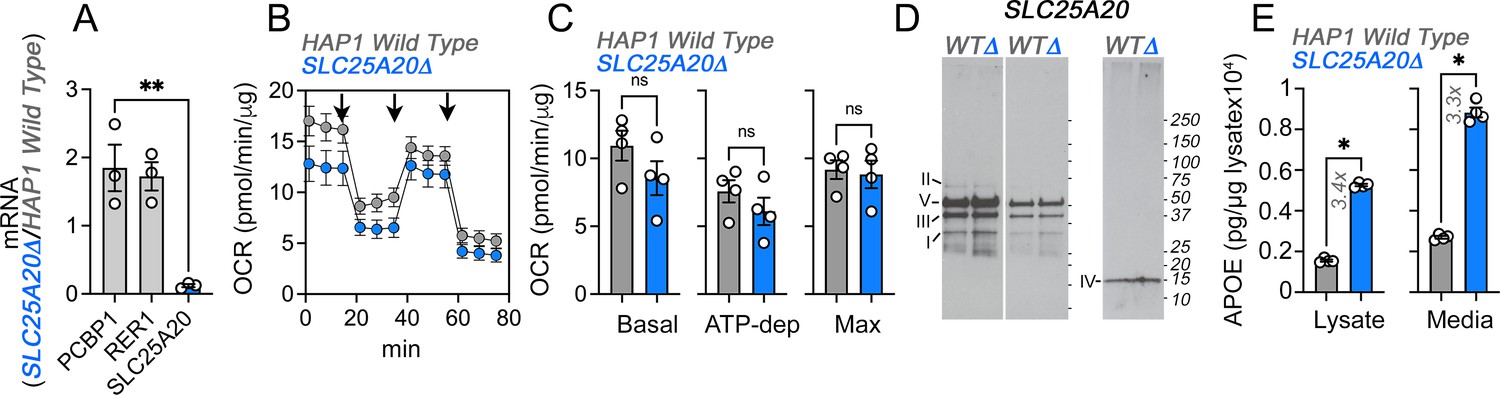
Upregulation of APOE expression and secretion in SLC25A20 mutant cells.
(A) qRT-PCR quantification of SLC25A20 and housekeeping control genes (PCBP1 and RER1) in wild-type and SLC25A20Δ mutant cells. Average ± SEM, One-way ANOVA followed by Dunnett’s multiple comparisons test. (B) Seahorse stress test in wild-type and SLC25A20Δ HAP1 cells. Arrows show sequential addition of oligomycin, FCCP, and rotenone-antimycin during the Seahorse stress test. (C) Depicts basal, ATP-dependent and maximal oxygen consumption rates. p value, Mann-Whitney U test, n=4. (D) Immunoblots with OxPhos antibody mix in mitochondrial fractions from wild-type and SLC25A20Δ cells. Left panels represent two exposures and right panel shows blot with COX4 antibodies. (E) MesoScale ELISA determinations of human APOE in wild-type and SLC25A20Δ mutant cells. Shown are APOE content in lysates and conditioned media. p value, Mann-Whitney U test, n=4. All graphs depict average ± SEM.
-
Figure 5—figure supplement 2—source data 1
Original blots.
- https://cdn.elifesciences.org/articles/85779/elife-85779-fig5-figsupp2-data1-v2.zip
-
Figure 5—figure supplement 2—source data 2
Original blots.
- https://cdn.elifesciences.org/articles/85779/elife-85779-fig5-figsupp2-data2-v2.zip
Figure 5—figure supplement 3
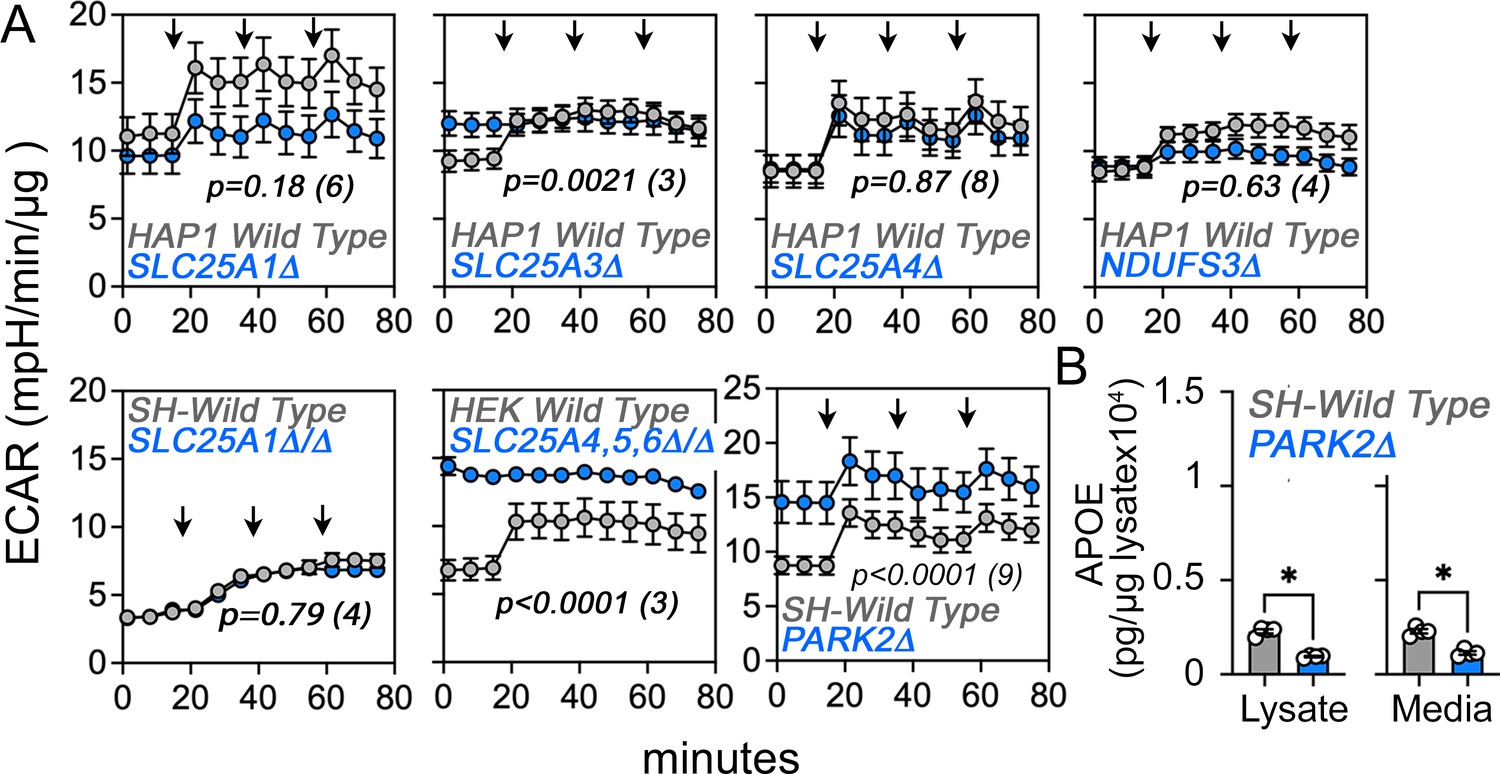
Extracellular acidification rate (ECAR) in wild-type and diverse mutant cells.
(A) ECAR was measured by Seahorse stress test in wild-type and mutant HAP1, SH-SY5Y, and HEK293 cells. Arrows mark the sequential addition of oligomycin, FCCP, and rotenone-antimycin during the Seahorse stress test. Average ± SEM, Two-way ANOVA followed by Bonferroni multiple comparisons test, p value represents the effect of genotype, n of experiments is in parentheses. (B) MesoScale ELISA determinations of human APOE in wild-type and PARK2Δ/Δ mutant SH-SY5Y cells. PARK2 mutants were selected as controls where there is strong acidification of media as measured by ECAR. Unpaired t-test with Welch’s correction.
Figure 5—figure supplement 4
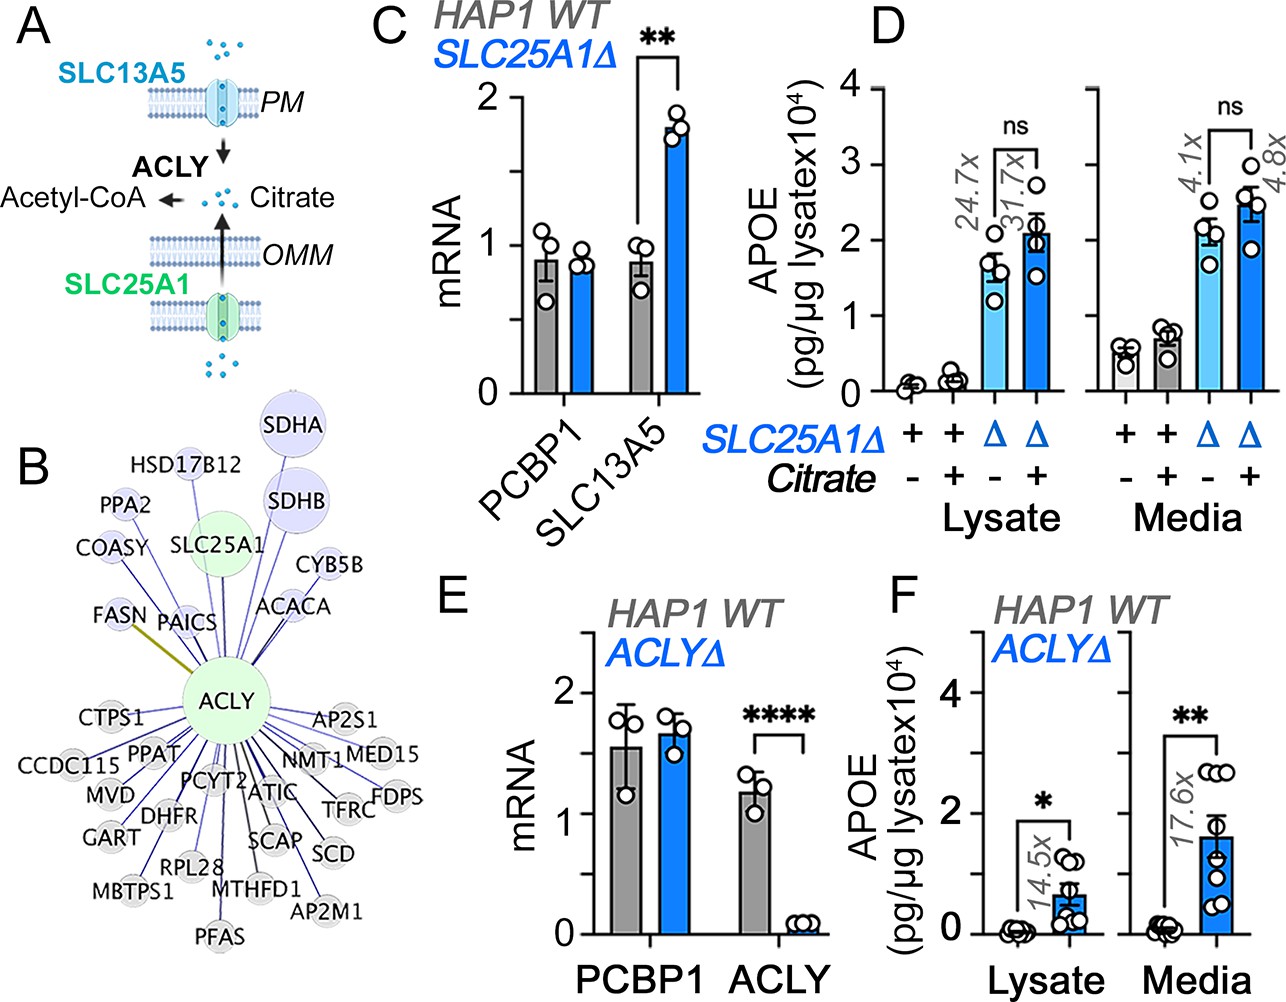
Citrate effects on APOE expression in HAP1 cells.
(A) Diagram of citrate pathways and genes studied. (B) Fireworks analysis of co-essentiality genes to identify genes connected to ACLY (Amici et al., 2021). Green denote hubs and purple marks MitoCarta annotated nodes. ACLY is a component of the SLC25A1 interactome, see Gokhale et al., 2021. (C) qRT-PCR quantification of citrate transporter SLC13A5 and a housekeeping control gene (PCBP1) in wild-type and SLC25A1Δ HAP1 cells. (C) MesoScale ELISA determinations of human APOE in wild-type and SLC25A1Δ HAP1 cells incubated with vehicle, 2.5 mM citrate for 48 hr. Average ± SEM, One-way ANOVA followed by Dunnett’s multiple comparisons test. (D) qRT-PCR quantification of ACLY and a housekeeping control gene (PCBP1) in wild-type and ACLYΔ mutant cells. Average ± SEM, One-way ANOVA followed by Dunnett’s multiple comparisons test. (E) MesoScale ELISA determinations of human APOE in wild-type and ACLYΔ HAP1 cells. Unpaired t-test with Welch’s correction.
Figure 5—figure supplement 5
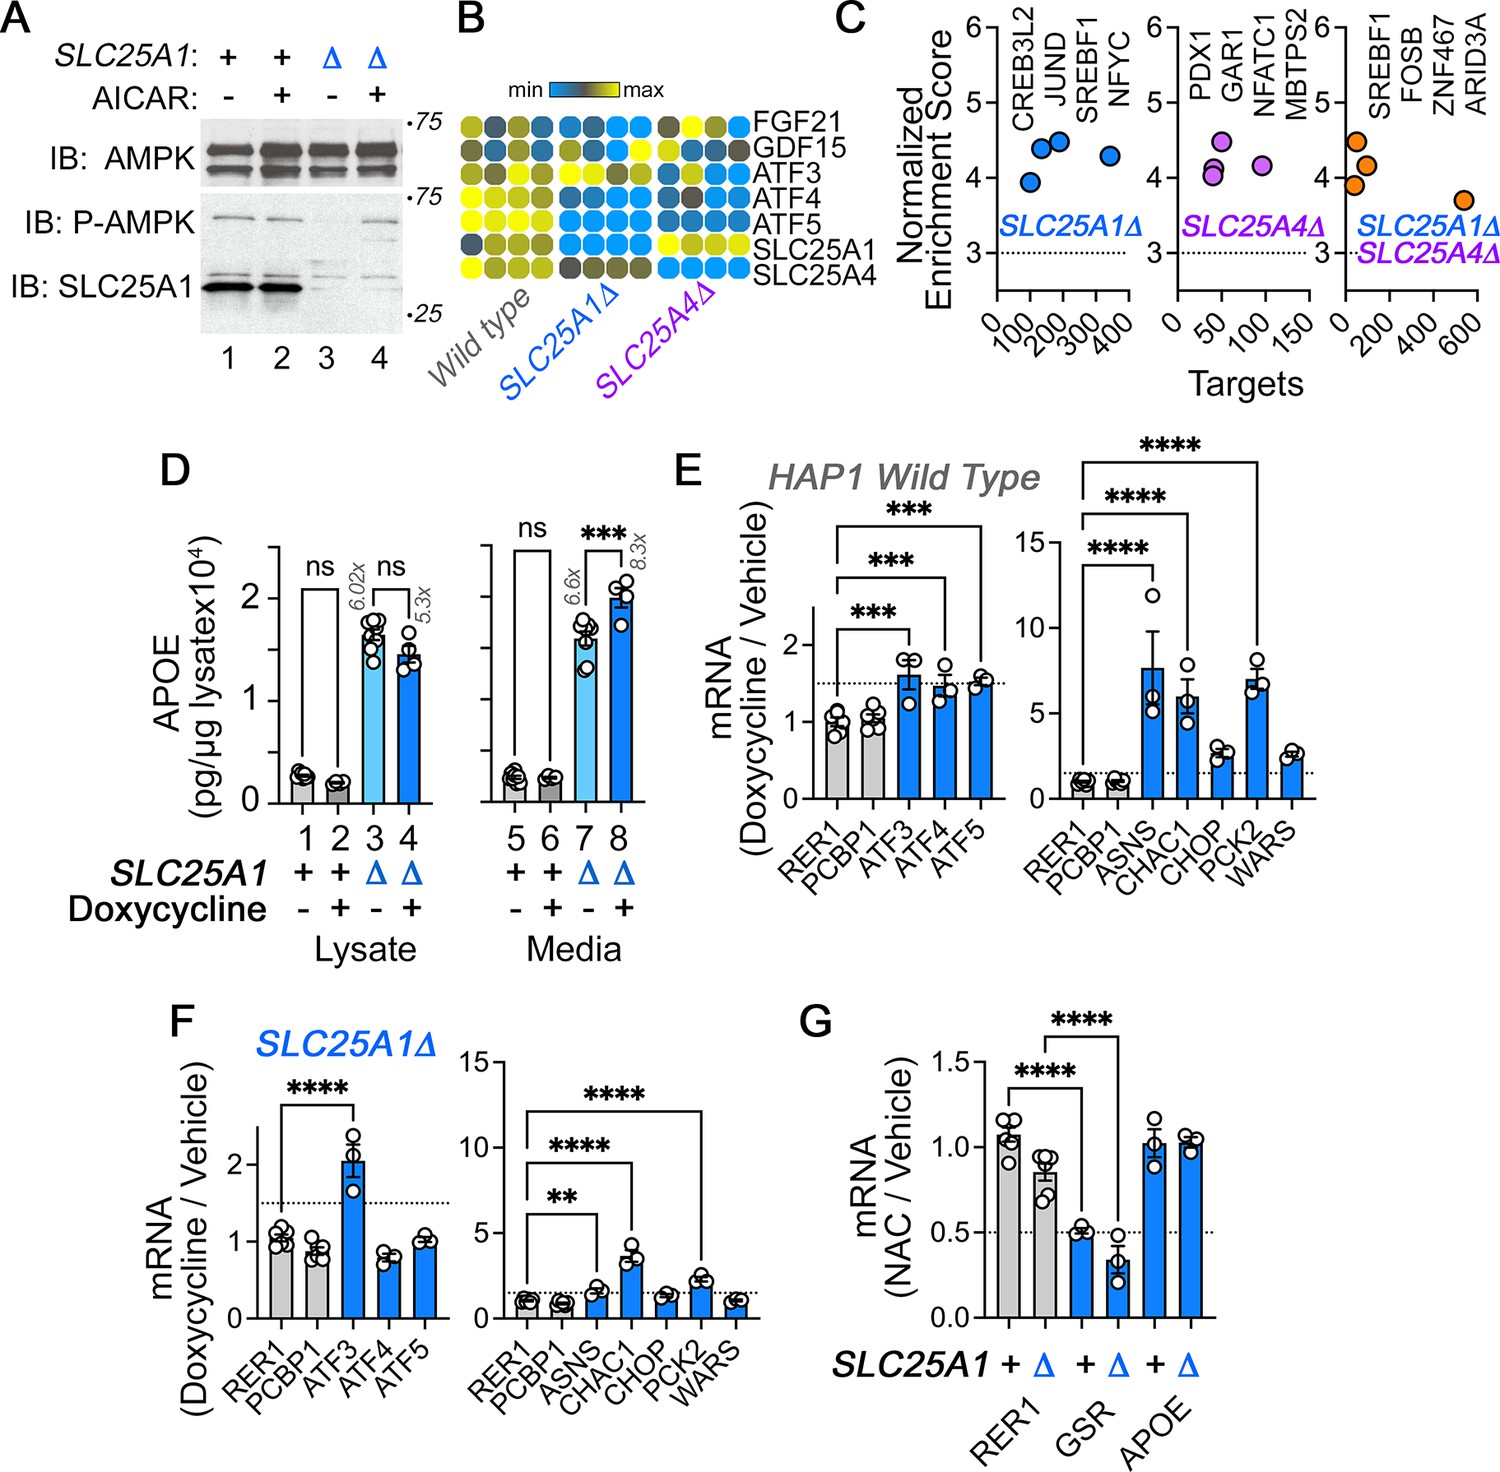
AMPK, mitochondrial stress, and redox responses in wild type and SLC25A1Δ HAP1 cells.
(A) Activity of AMPK in wild-type (lanes 1–2) and SLC25A1Δ (lanes 3–4) HAP1 cells was assessed with antibodies against AMPK, phospho-AMPK, and SLC25A1. Cells were treated with AICAR at 0.4 mM concentration for 72 hr to induce the activation of AMPK (lanes 2 and 4). (B) RNAseq determinations of FGF21 and GDF21 as well ATF transcription factors in wild-type and mutant cells. (C) Cis-regulatory sequence analysis with iRegulon to infer transcriptional responses activated in the SLC25A1Δ and SLC25A4Δ upregulated transcriptome (1429 transcripts p<0.001 and log2 fold of change = 1) (Janky et al., 2014). Significance threshold is set at 3. There are no ATF3, 4, or 5 target genes in the SLC25A1Δ upregulated transcriptome. (D) Activation of the mitochondrial stress response with doxycycline modestly increases APOE in conditioned media from SLC25A1Δ cells but not in wild-type cells. MesoScale ELISA determinations of human APOE in wild-type and SLC25A1Δ cells treated in the absence or presence of doxycycline at a concentration of 9.75 micromolar for 48 hr. APOE was measured in cell lysates and media. (E–F) Activation of the mitochondrial stress response with doxycycline in wild-type (D) and SLC25A1Δ (E) HAP1 cells. Doxycycline treatment was performed as in C. Gene expression was determined by qRT-PCR measuring the transcription factors ATF3-5 and their selected target genes ASNS, CHAC1, CHOP, PCK2, and WARS. RER1 and PCBP1 were used as housekeeping control transcripts. n=3. (G). Cells were treated with 2 mM N-acetyl cysteine (NAC) for 48 hr, n=3. RER1 was used as a control gene and glutathione-disulfide reductase (GSR) as a NAC-sensitive gene reporter. (E to G) show data as a ratio between drug/vehicle. All figures depict average ± SEM. For F and G, One-way ANOVA followed by Šydák’s multiple correction. (D and E) One-way ANOVA followed by Benjamini-Krieger-Yekuiteli multiple comparison corrections (FDR = 5%).
-
Figure 5—figure supplement 5—source data 1
Original blots.
- https://cdn.elifesciences.org/articles/85779/elife-85779-fig5-figsupp5-data1-v2.zip
-
Figure 5—figure supplement 5—source data 2
Original blots.
- https://cdn.elifesciences.org/articles/85779/elife-85779-fig5-figsupp5-data2-v2.zip
Figure 6 with 1 supplement
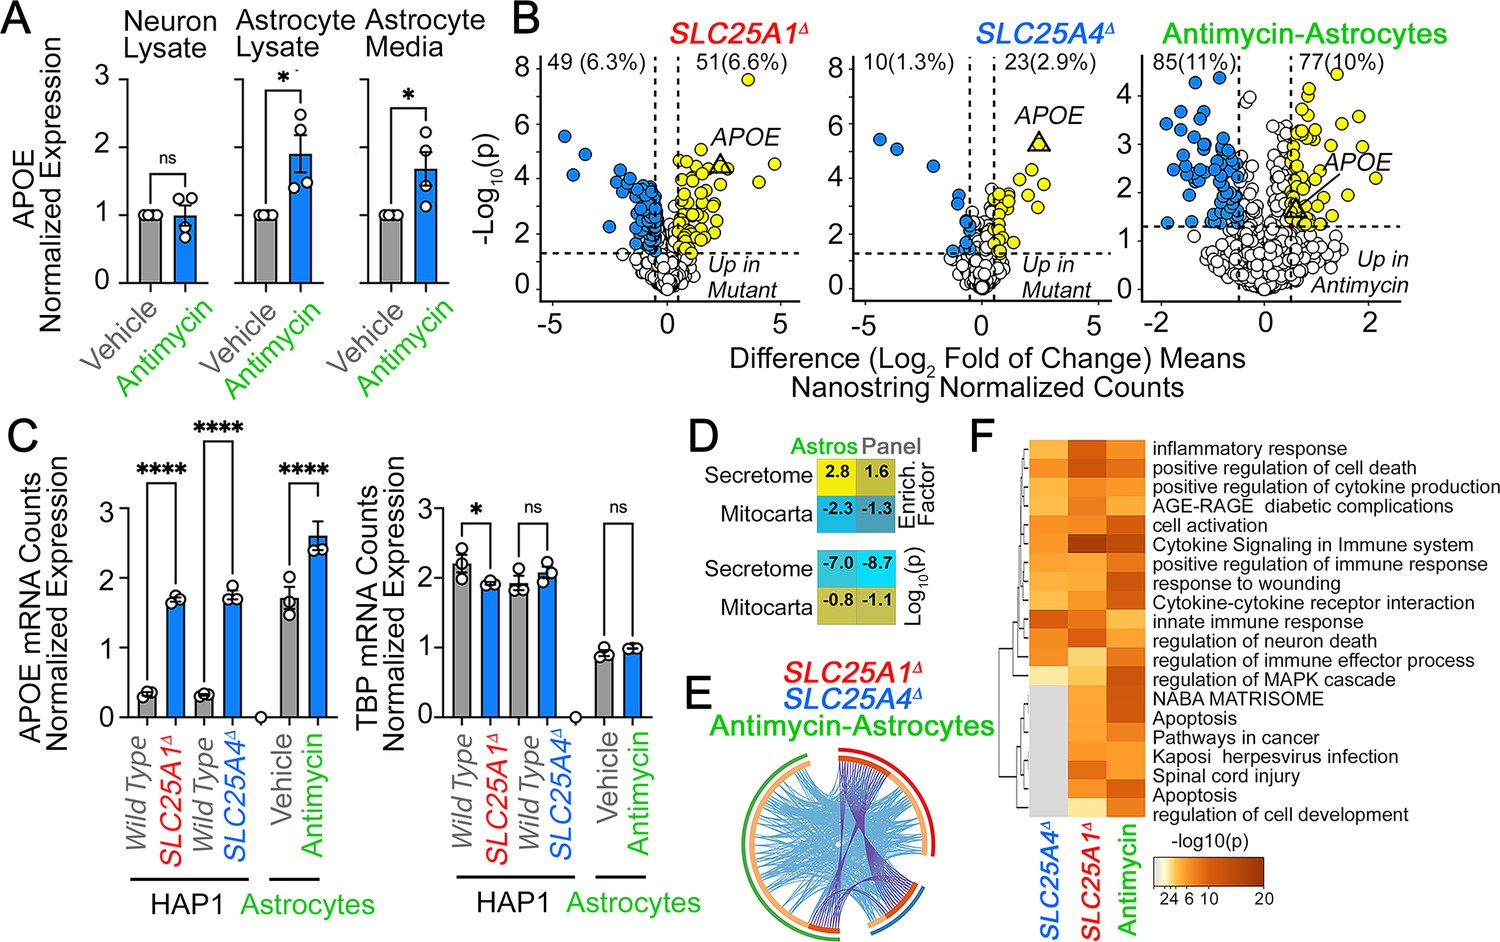
APOE expression is increased in human astrocytes after complex III inhibition.
(A) MesoScale ELISA determinations of human APOE in wild-type iPSC-derived human neurons and astrocytes treated with vehicle or 40–80 nM antimycin for 48 h. APOE determinations were performed in cell lysates and conditioned media and expressed normalized to a control value. n=4. p was obtained with two-sided estimation statistics. Untreated iPSC-derived astrocytes secrete ~70 x 104 pg/µg lysate. (B–G) Present analyses of changes in mRNA expression measured with NanoString Neuroinflammation panel. (B) Volcano plots of wild-type, SLC25A1Δ, and SLC25A4Δ HAP1 cells (n=3 per genotype) and iPSC-derived astrocytes treated with vehicle or 80 nM antimycin for 48 hr (n=3). Yellow symbols represent upregulated genes in mutant or drug treated cells. (C) mRNA expression of APOE and TBP was expressed as APOE /TADA2B or TBP/TADA2B ratios. TBP and TADA2B are both housekeeping control transcripts One-Way ANOVA followed by Benjamini-Krieger-Yekuiteli multiple comparison corrections (FDR = 5%). (D) Magnitude of compromise of significantly upregulated mRNAs annotated to secreted and mitochondrial proteomes in antimycin-treated astrocytes and compared to all genes present in the Neuroinflammation NanoString panel. p value was calculated with exact hypergeometric probability. (E) Circos plot of shared upregulated hits in SLC25A1Δ, SLC25A4Δ HAP1 cells, and iPSC-derived astrocytes treated with 80 nM antimycin. Outside arc represents the identity of each gene list. Inside arc represents a gene list, where each gene member of that list is assigned a spot on the arc. Dark orange color represents genes that are shared by multiple lists and light orange color represents genes that are unique to that gene list. Shared genes are presented by purple lines and different genes that belong to the same functional ontologies are connected by light blue lines. (F) Metascape ontology analysis and clustering of genes upregulated in SLC25A1Δ and SLC25A4Δ HAP1 cells and iPSC-derived astrocytes treated with 80 nM antimycin. Cumulative hypergeometric p-values.
Figure 6—figure supplement 1
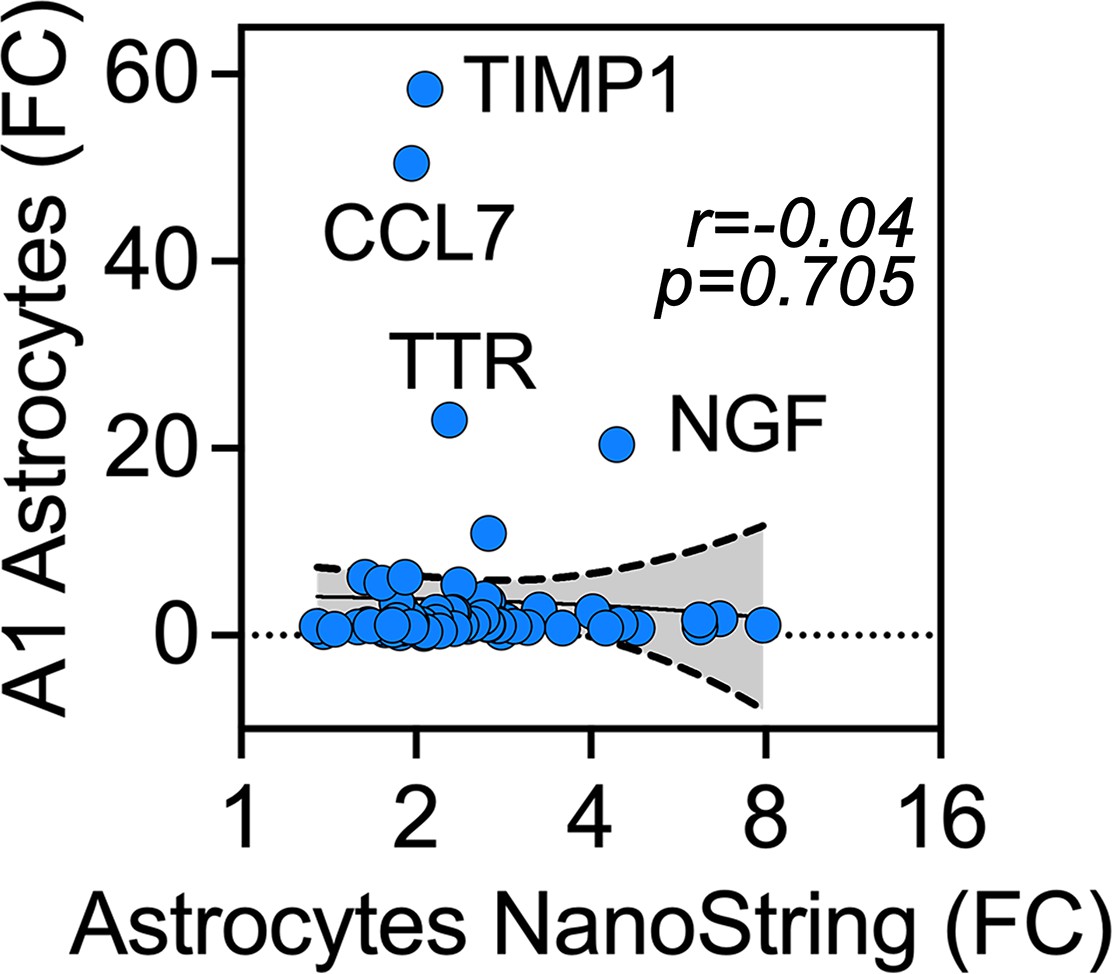
Human iPSC astrocytes treated with antimycin differ in their gene expression as compared to A1 astrocytes.
Figure 7 with 1 supplement
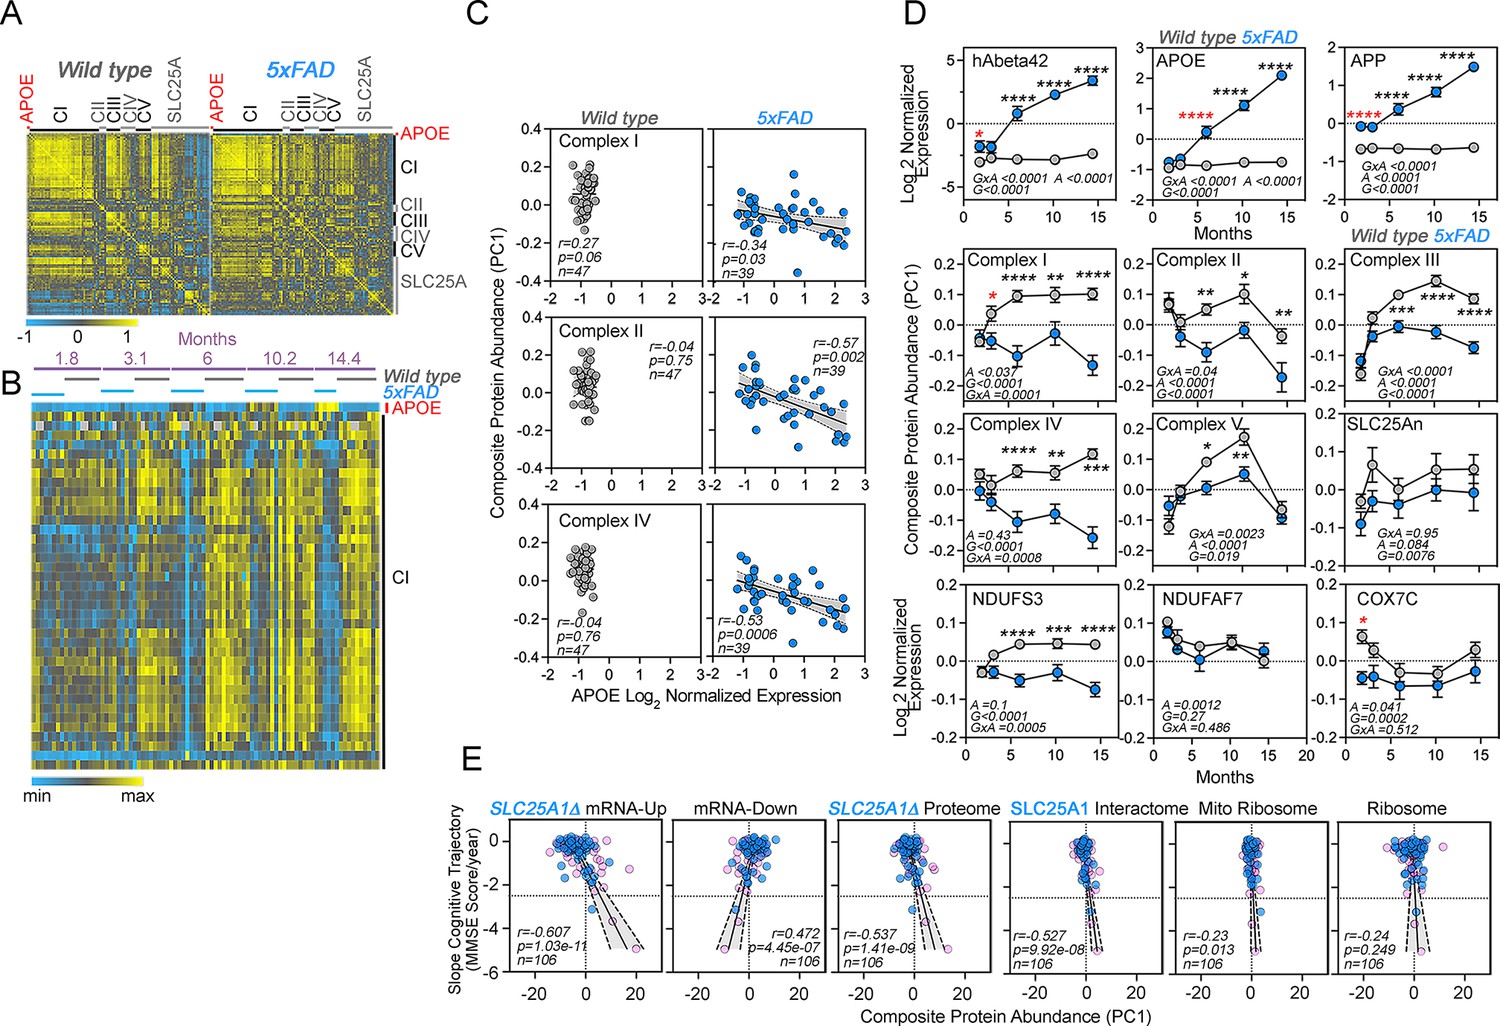
Correlative studies of APOE expression and electron transport chain subunits in an Alzheimer’s mouse model and aging humans.
(A) Protein expression similarity matrix of APOE, complexes I to V (CI-CV) of the electron transport chain, and transporters of the SLC25A family in wild-type and 5xFAD mouse models. Data were obtained by TMT mass spectrometry from mouse cortices. Similarity was calculated with Spearman Rank correlation. (B) Kendall Tau Hierarchical clustering of complex I subunits and APOE across ages and genotypes. (C) Correlation of composite protein abundance for complexes I, II, and IV in wild-type and 5xFAD mouse cortices with APOE levels. (D) Quantification of human A beta 42 peptide, APP, APOE, three mitochondrial Alzheimer’s risk factors (NDUFS3, NDUFAF7, and COX7C), and the composite protein abundance for complex I to V, as well as members of the SLC25A family of mitochondrial transporters in wild-type and 5xFAD mice (grey and blue symbols, respectively). Two-way ANOVA followed by Šídák’s multiple comparisons tests. Factors are age (A), genotype (G), and their statistical interaction (I). Asterisks denote significant differences between genotypes at a defined age. Red asterisks denote the earliest age with differences between genotypes. See Supplementary file 1 for all Mitocarta hits in the 5xFAD mouse study. (E) The SLC25A1 RNAseq, proteome, and interactome correlate with the cognitive trajectory of human subjects. Cytoplasmic and mitochondrial ribosome subunits were used as controls. Graphs depict the correlation between the cognitive trajectory (Mini-Mental State Examination (MMSE)) in subjects belonging to the Banner collection that were longitudinally followed for an average of 14 years (n=106) (Beach et al., 2015; Wingo et al., 2019). The SLC25A1Δ RNAseq, up and downregulated hits, proteome hits, as well as the SLC25A1 interactome hits principal components were derived by estimating eigenvectors of the expression matrix of protein abundance data. Best-fit regression line drawn in blue and the 99.9% confidence interval for the regression line shaded in gray. No covariate was applied because sex, age at enrollment, and education have been regressed out of cognitive trajectory (Wingo et al., 2019). Blue circles represent males, pink circles represent females (48.1%).
Figure 7—figure supplement 1
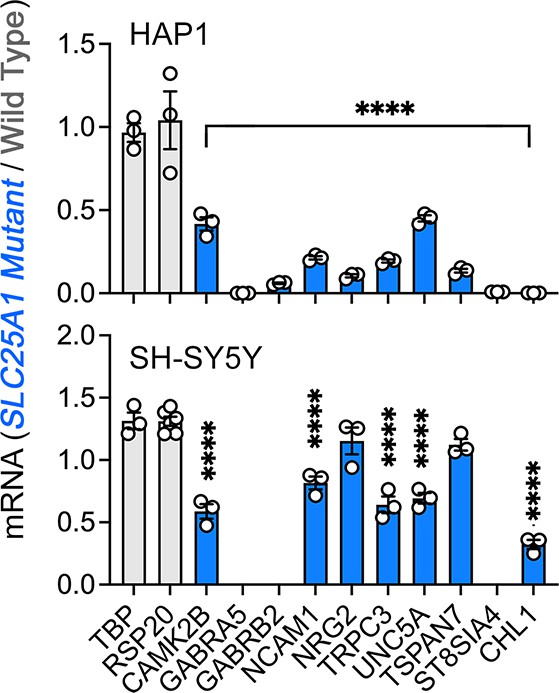
Interactions between SLC25A1 and NDUFS3 and neuronal ontology annotated genes downregulated in SLC25A1 mutant cells.
qRT-PCR quantification of neuronal ontology annotated genes and housekeeping controls (TBP and RPS20) in wild-type and SLC25A1 mutant HAP1 and SH-SY5Y cells. Average ± SEM, One-way ANOVA followed by Holm-Šydák’s multiple correction test. n=3.
Additional files
-
Supplementary file 1
Raw Data for Proteomics, Transcriptomics and Gene Ontologies.
- https://cdn.elifesciences.org/articles/85779/elife-85779-supp1-v2.xlsx
-
MDAR checklist
- https://cdn.elifesciences.org/articles/85779/elife-85779-mdarchecklist1-v2.docx
Download links
A two-part list of links to download the article, or parts of the article, in various formats.
Downloads (link to download the article as PDF)
Open citations (links to open the citations from this article in various online reference manager services)
Cite this article (links to download the citations from this article in formats compatible with various reference manager tools)
APOE expression and secretion are modulated by mitochondrial dysfunction
eLife 12:e85779.
https://doi.org/10.7554/eLife.85779


