Homeodomain-interacting protein kinase maintains neuronal homeostasis during normal Caenorhabditis elegans aging and systemically regulates longevity from serotonergic and GABAergic neurons
- Department of Biomedical Genetics, University of Rochester Medical Center, United States
- Division of Endocrinology, Diabetes and Metabolism, Department of Medicine, University of Rochester Medical Center, United States
- Department of Biology, University of Rochester, United States
- Department of Cell Biology, Skirball Institute of Biomolecular Medicine, NYU School of Medicine, United States
- Department of Biostatistics and Computational Biology, University of Rochester Medical Center, United States
- Department of Microbiology and Immunology, University of Rochester Medical Center, United States
Figures
Figure 1
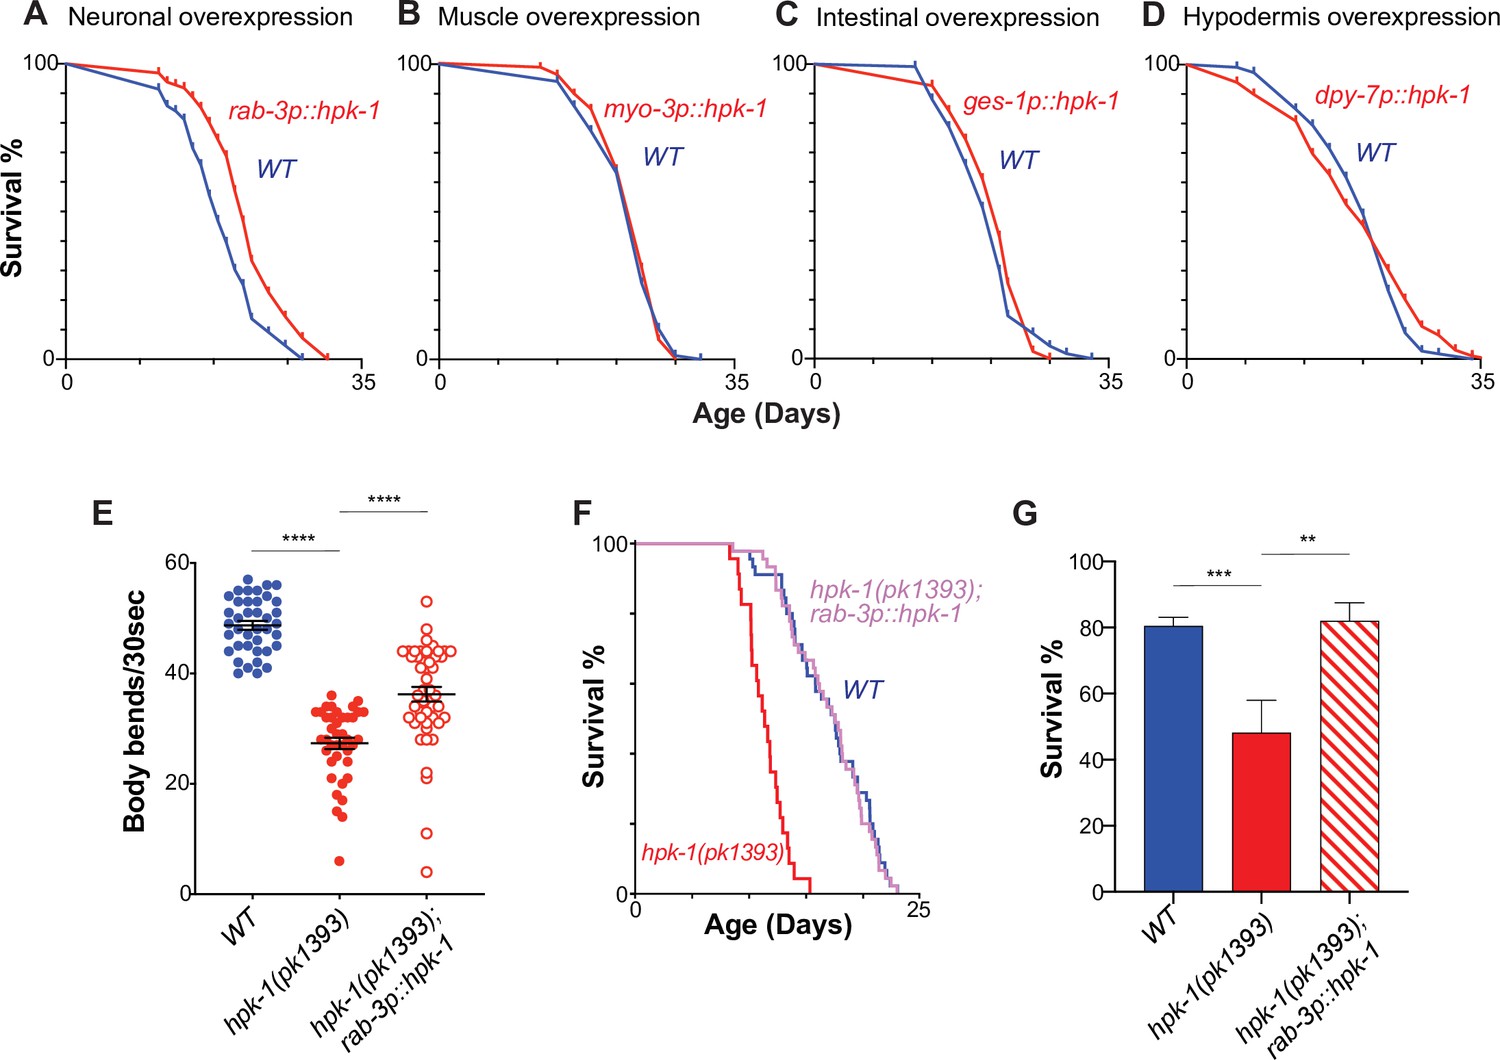
Neuronal homeodomain-interacting protein kinase (HPK-1) extends longevity and promotes healthspan.
Lifespan curves of animals overexpressing hpk-1 (red line) in the nervous system (A), muscle (B), intestine (C), and hypodermis (D) compared with control non-transgenic siblings (blue line). (n>175, log-rank test, p<0.0001 for A, n>78 for B, n>82 for C, and n>105 for D). Lifespan graphs are representative of two biological replicates. (E) Frequency of body bends of wild-type, rab-3p::hpk-1 and hpk-1(pk1393); rab-3p::hpk-1 day 2 adult animals (n>48). (F) Lifespan curves of wild-type (blue), hpk-1(pk1393) (red), and hpk-1(pk1393); rab-3p::hpk-1 animals (pink). (G) Survival of day 1 adult animals subjected to heat shock treatment. Graph represents one of the two individual trials (n>66). t-Test analysis with **p<0.01, ***p<0.001, and ***p<0.0001. On panels (E and G), bars represent ± SEM. See Supplementary file 1, Supplementary file 2 and Supplementary file 3 for details and additional trials.
Figure 2 with 4 supplements
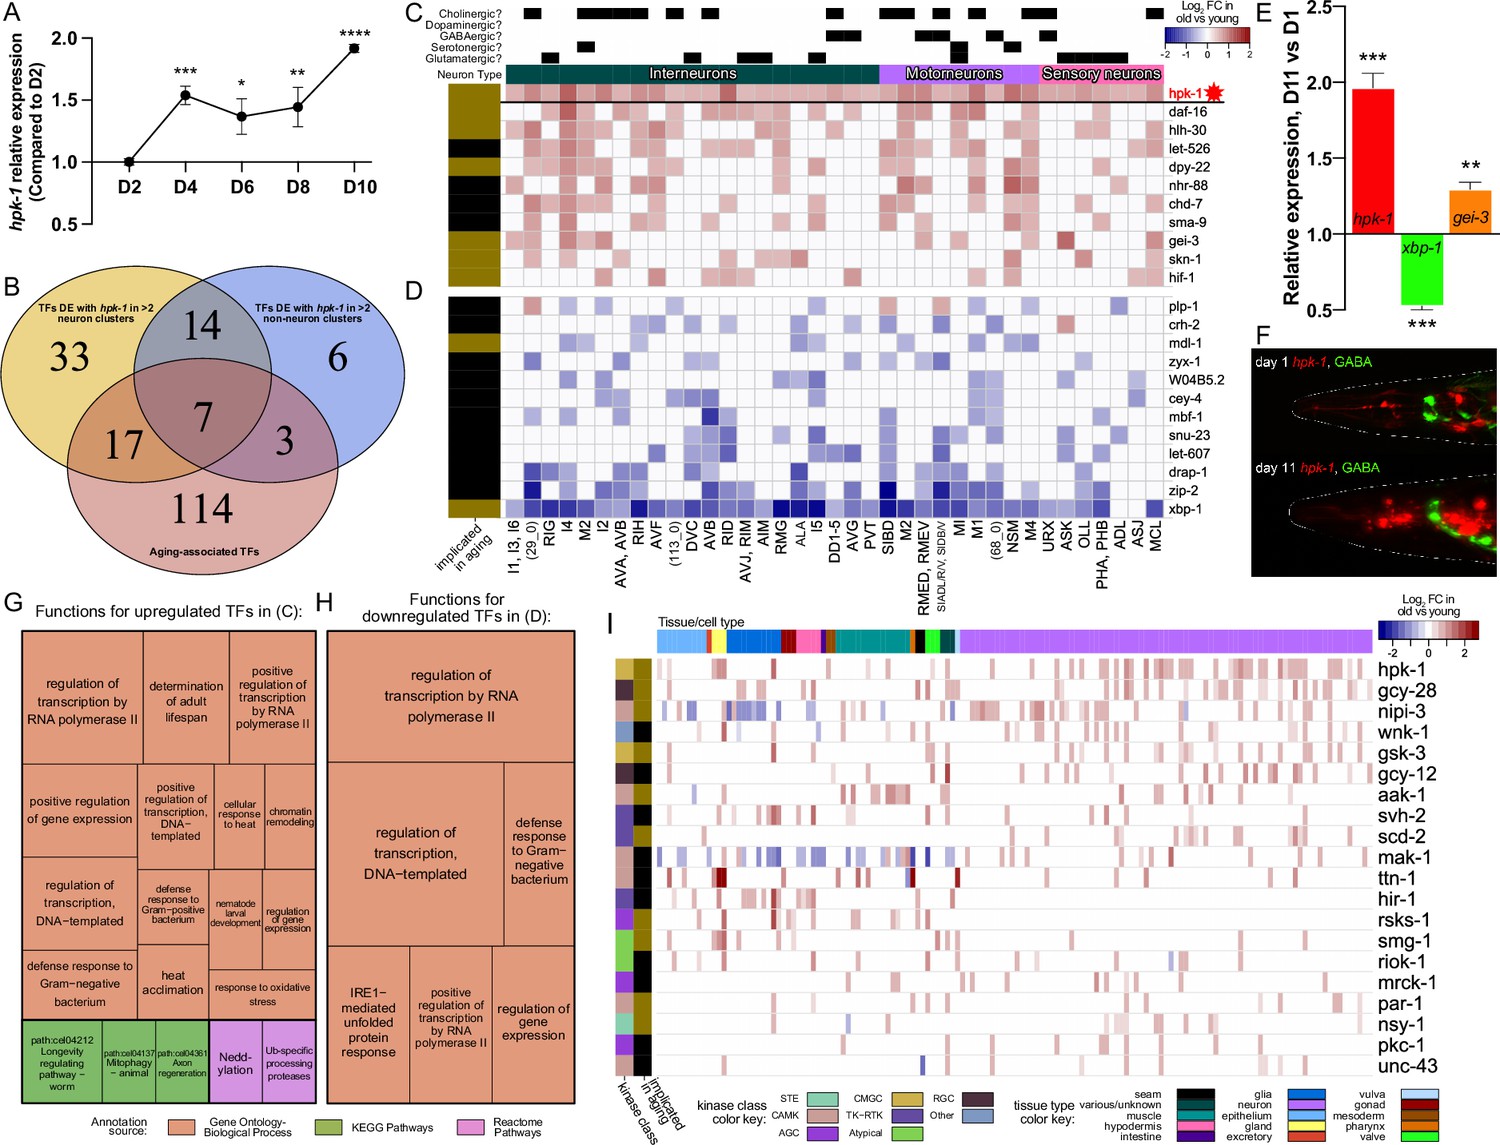
During normal aging hpk-1 is the most broadly upregulated kinase and overlaps with key longevity-associated transcription factors (TFs) within the nervous system.
(A) Relative expression of hpk-1 mRNA during normal aging, as measured by RT-qPCR. (B) Venn diagram depicting TFs with significant age-associated differential expression alongside hpk-1 within 3 or more of the 36 neuronal and/or 11 non-neuronal cell clusters (yellow and blue, respectively), and the intersection with TFs that have previously been implicated in C. elegans longevity (red). (C, D) Heat map of neuronal cell clusters in which hpk-1 expression increases during normal aging along with TFs that have the most broadly co-occurring differential expression with age (≥9 cell-clusters). Positive (red) and negative (blue) fold-change with aging of a given TF are shown in (C) and (D), respectively, grouped by average fold-change across the indicated clusters. Neuronal types, subtypes, cell cluster, or individual neuron pair, as well as whether a TF has previously been implicated in aging is indicated. Primary data for this analysis was generated in the C. elegans Aging Atlas (Roux et al., 2022) and significant differences in expression with aging were determined by filtering differential expression results from a comparison of old vs young animals, based on adjusted p-values <0.05 and a log2 fold-change magnitude of at least 0.5 (between days 8,11,15 and days 1,3,5). (E) Relative expression of hpk-1, xbp-1, and gei-3 mRNA of day 11 adult animals, compared to day 1 as measured by RT-qPCR. (F) Representative images of hpk-1 expression within the nervous system of day 1 and 11 adult animals (hpk-1p::mCherry; unc-47p::GFP). See Figure 7F and Figure 7—figure supplement 1A–C for representative images of whole animals (n>5). (G, H) Functions and pathways associated with two or more of the TFs listed in (C) and (D), respectively. (I) hpk-1 is differentially expressed with age in more cell clusters than any other kinase, and mostly in neurons. Heat map shows log2 fold-change in old vs young animals for kinases with differential expression in ≥10 cell clusters. Primary data for this analysis was generated in the C. elegans Aging Atlas (Roux et al., 2022) and filtered for significant age-associated expression changes as described in (C, D). On panels (A and E), bars represent ± SEM of 3 technical replicates with more than 500 animals per condition. t-Test analysis with *p<0.05, **p<0.01, ***p<0.001,and ****p<0.0001. See Supplementary file 4 for additional RT-qPCR details, and Supplementary files 5 and 6 for dataset.
Figure 2—figure supplement 1
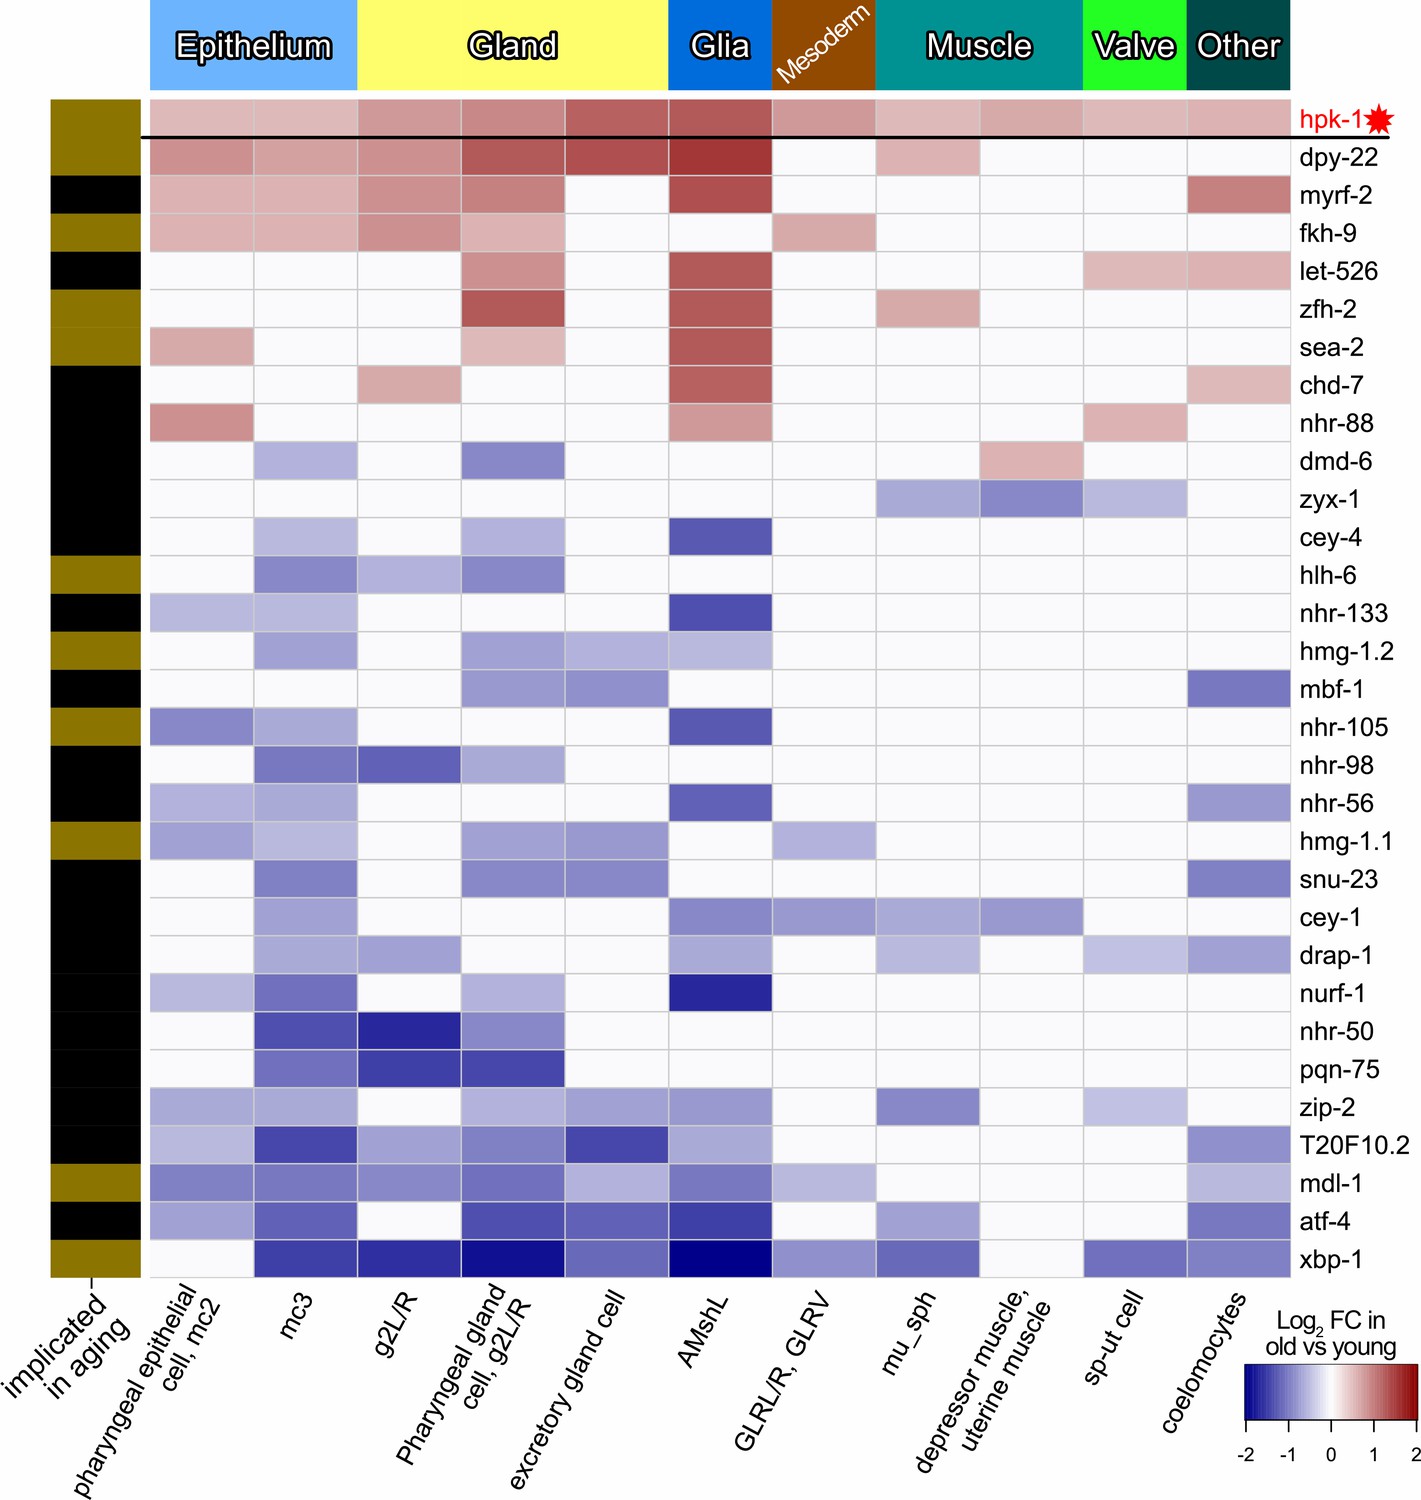
During normal aging hpk-1 is differentially expressed along with transcription factors (TFs) in cell clusters corresponding to tissues outside of the nervous system.
Heat map of non-neuronal cell clusters in which hpk-1 expression increases during normal aging along with TFs differentially expressed in three or more of the same non-neuron cell clusters. Fold-changes (FC) of a given TF from old versus young animals are shown, upregulation with aging in red and downregulation with aging in blue. Tissue types are indicated in the top, names of the cell cluster are given at the bottom, and whether a TF has previously been implicated in aging is indicated by the black and gold on the left side (genes with gold bars have previously published aging-associated phenotypes). Primary data for this analysis was generated in the C. elegans Aging Atlas (Roux et al., 2022) and differential expression with aging was based on adjusted p-values <0.05 and a log2 FC magnitude of at least 0.5 (between days 8,11,15 and days 1,3,5). Note hpk-1 is included for reference and is a transcriptional cofactor, but is not a bona fide TF. See Supplementary file 5 and Supplementary file 6 for dataset.
Figure 2—figure supplement 2

Hpk-1 and all transcription factors (TFs) differentially expressed in overlapping cell clusters within the C. elegans nervous system during aging.
Heat map of neuronal cell clusters in which hpk-1 expression increases during normal aging along with TFs differentially expressed in three or more neuron cell clusters. Fold-changes (FC) of a given TF from old versus young animals are shown, upregulation with aging in red and downregulation with aging in blue. Neuronal types, neurotransmitter subtypes are indicated in the top, names of the cell cluster or individual neuronal pair are given at the bottom, and whether a TF has previously been implicated in aging is indicated by the black and gold on the left side (genes with gold bars have previously published aging-associated phenotypes). Primary data for this analysis was generated in the C. elegans Aging Atlas (Roux et al., 2022) and differential expression with aging was based on adjusted p-values <0.05 and a log2 FC magnitude of at least 0.5 (between days 8,11,15 and days 1,3,5). Note hpk-1 is included for reference and is a transcriptional cofactor, but is not a bona fide TF. See Supplementary file 5 and Supplementary file 6 for dataset.
Figure 2—figure supplement 3
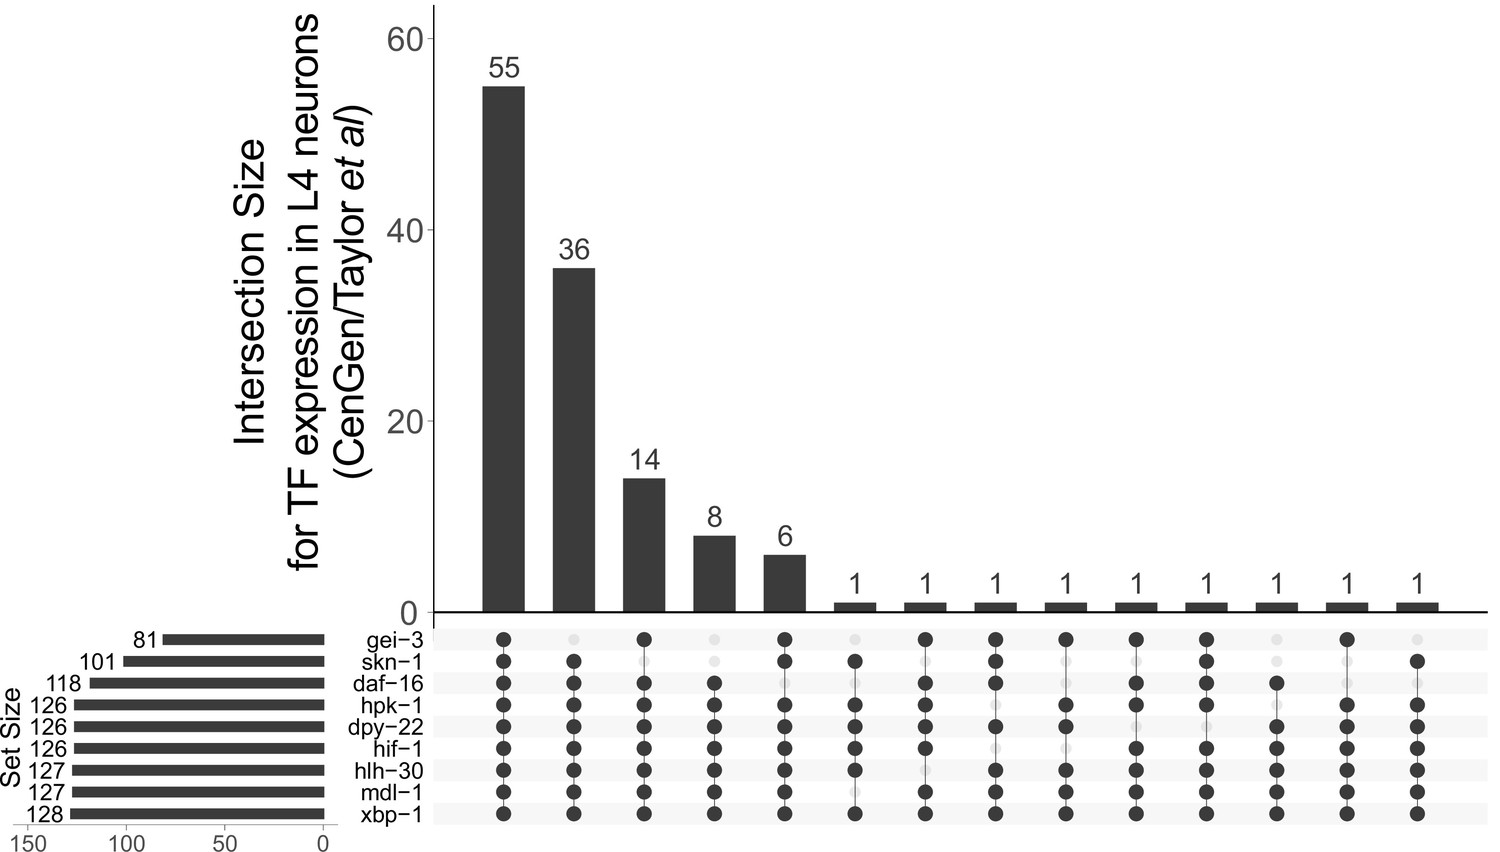
hpk-1 is broadly co-expressed with longevity-associated transcription factors (TFs) in late larval stage animals.
Vertical bars show the number of neurons expressing TFs or hpk-1 in the intersection indicated by the filled dots. The number of neurons where each individual gene is found expressed in late larval development is given by the horizontal bars, ‘set size’. Primary data for this analysis was generated in the CeNGEN project, expression was determined based on their ‘medium’ stringency threshold of average transcripts per million (TPM) per neuron type ≥0.1 (Taylor et al., 2021).
Figure 2—figure supplement 4
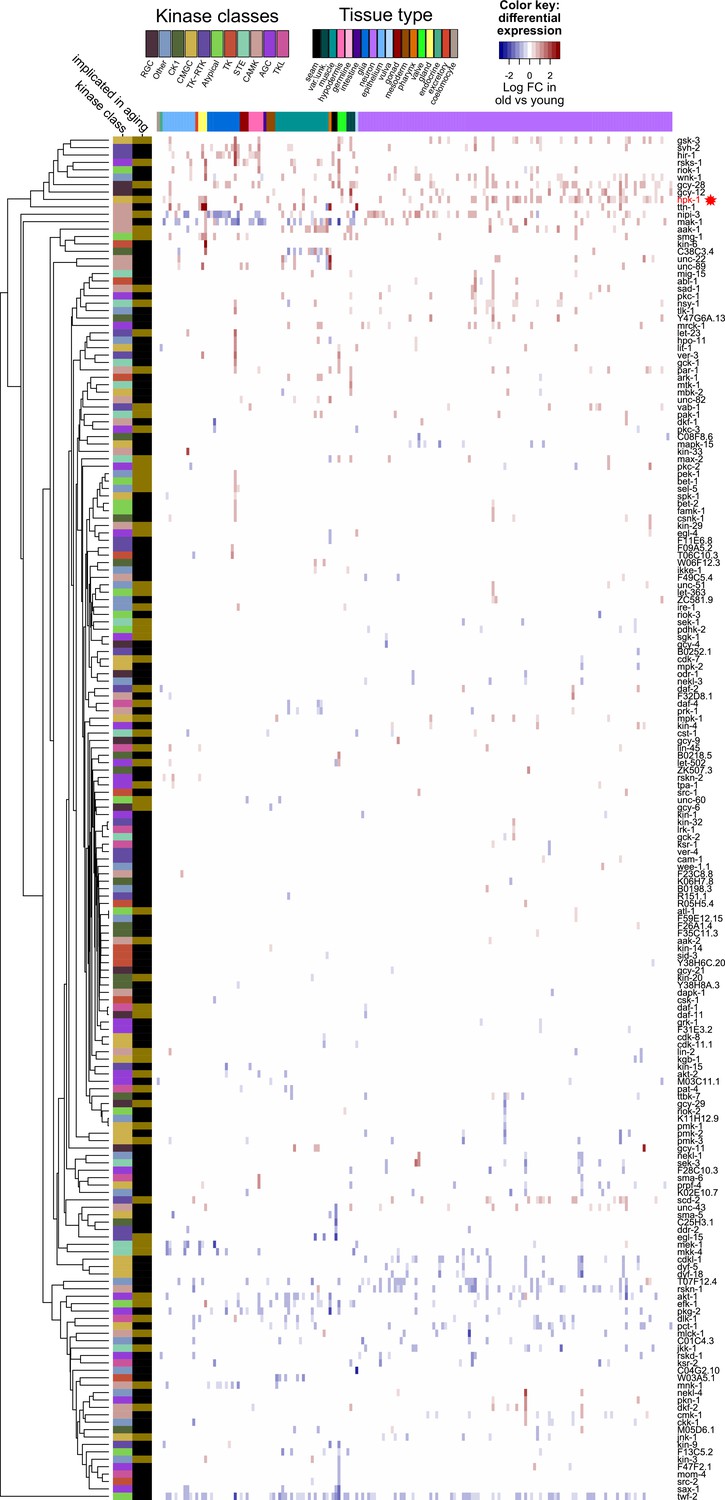
Only a limited subset of kinases change expression during normal aging.
Heat map of 184 kinases that change expression during normal aging in any cell cluster in the Aging Atlas dataset, of the 438 total kinases identified in C. elegans. Increased (red) and decreased (blue) expression with aging of a given kinase is shown. Major tissue types, kinase classes, as well as whether a kinase has previously been implicated in aging are indicated in the top and side bars, respectively. Primary data for this analysis was generated in the C. elegans Aging Atlas (Roux et al., 2022) and differential expression with aging was based on adjusted p-values <0.05 and a log2 FC (fold-change) magnitude of at least 0.5 (between days 8,11,15 and days 1,3,5). See Supplementary file 5 and Supplementary file 6 for dataset.
Figure 3
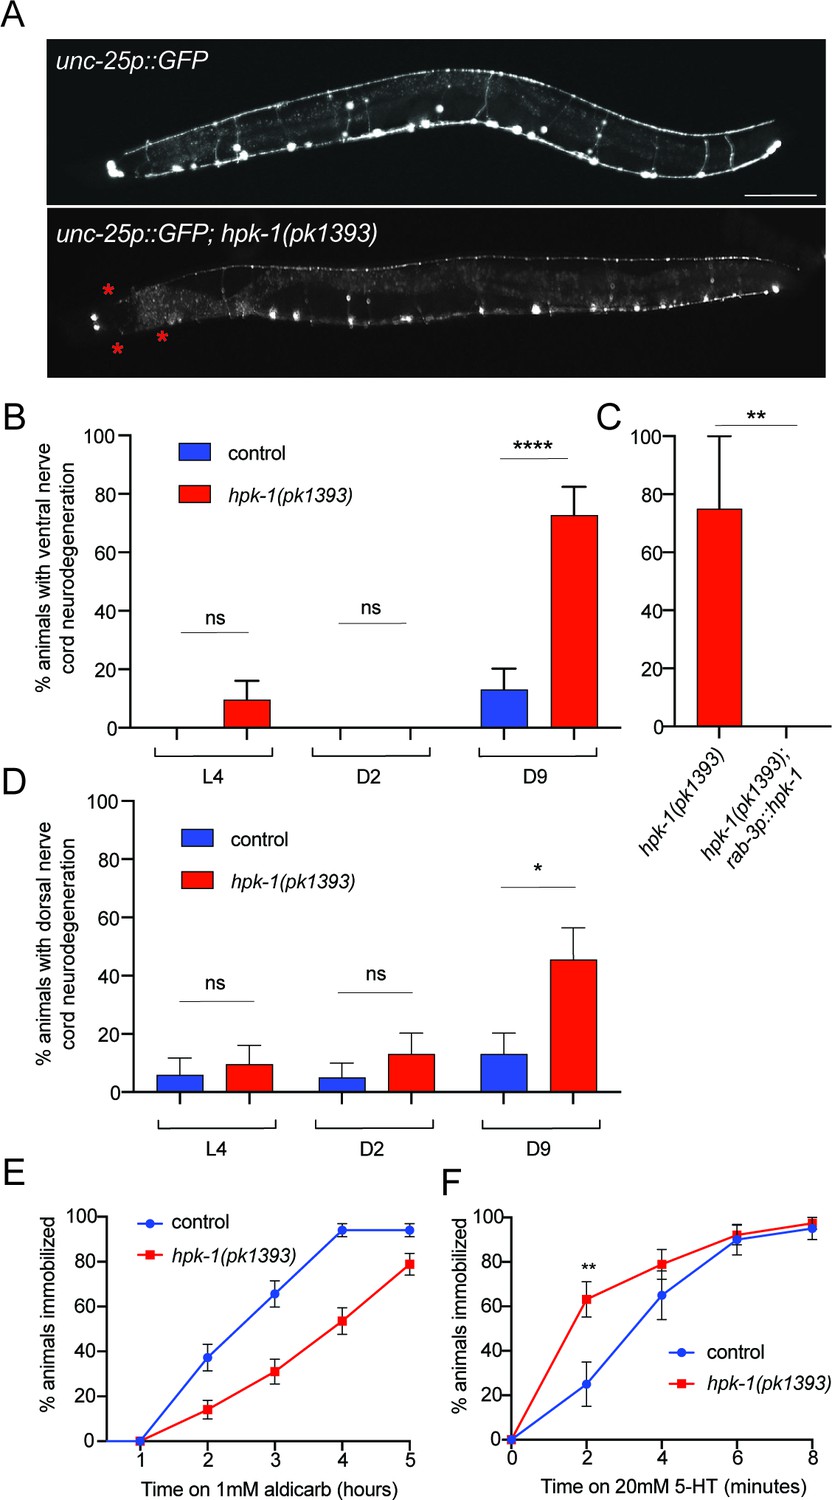
Neuronal homeodomain-interacting protein kinase (HPK-1) maintains neuronal integrity during aging.
(A) Fluorescent micrographs of control and hpk-1(pk1393) 9-day-old animals expressing GFP in γ-aminobutyric acid (GABA)ergic DD and VD motor neurons. Asterisks (*) indicate axonal breaks in the motor neurons. Scale bar, 100 μm. (B) Percentage of wild-type and hpk-1 mutant animals with neurodegeneration in VD motor neurons (n>23). (C) Percentage of hpk-1 rescue animals with neurodegeneration in VD motor neurons (n>10). (D) Percentage of wild-type and hpk-1 mutant animals with neurodegeneration in DD motor neurons (n>20). Percentage of immobilized animals after exposure to aldicarb (n>67) (D) and to 20 mM 5-HT (n>38) (E). t-Test analysis with **p<0.01 and ***p<0.001. Bars represent ± SEM. See Supplementary file 7, Supplementary file 8 and Supplementary file 9 for details and additional trials.
Figure 4
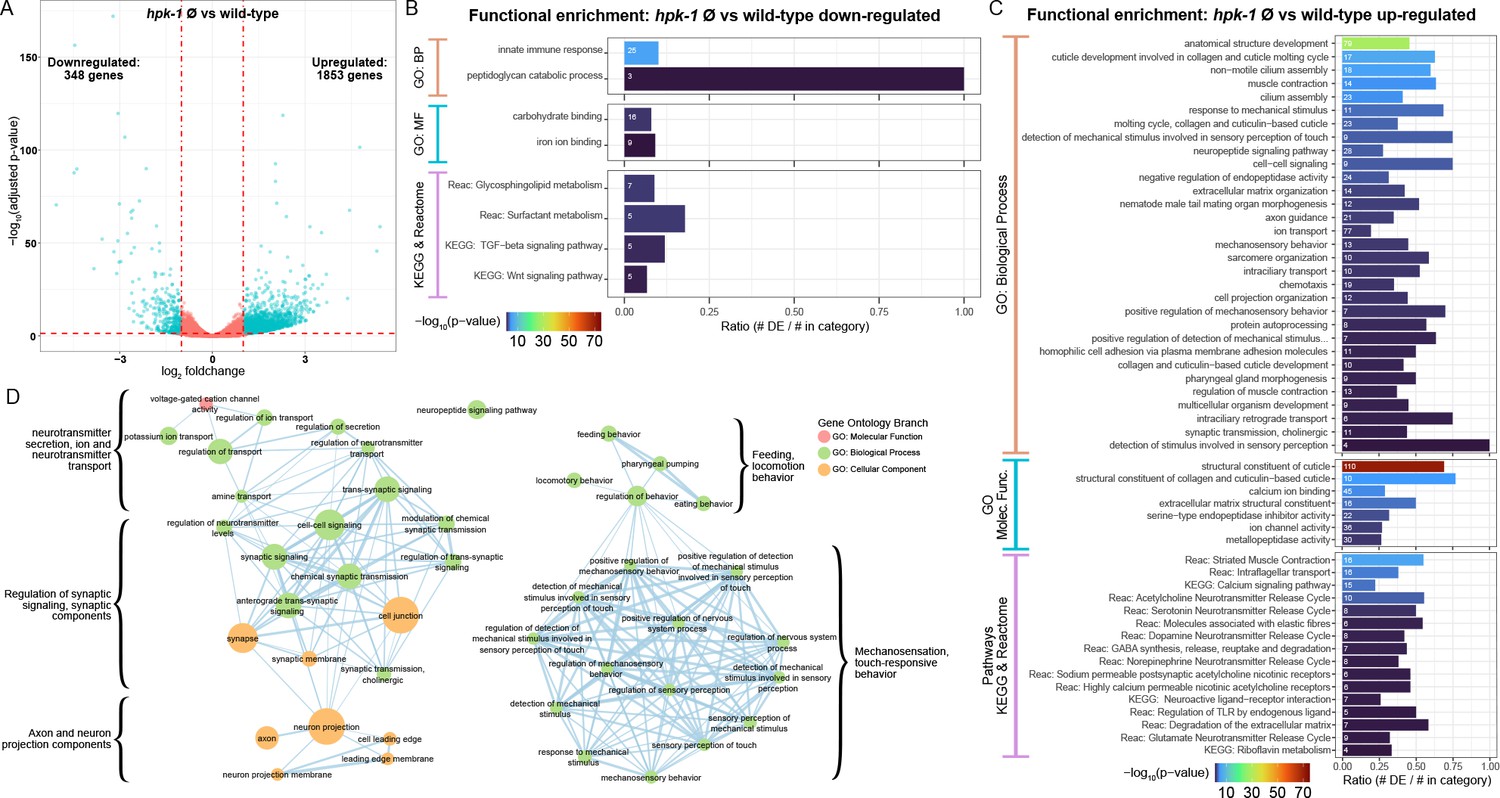
Loss of hpk-1 results in broad dysregulation of neuronal gene expression.
(A) Differential expression analysis for RNA-sequencing (RNA-Seq) of day 2 adult hpk-1 null mutant animals (n=3) compared to N2 wild-type animals (n=3) identified 2201 genes with significantly altered expression with loss of hpk-1 (adjusted p-value <0.05 and |log2 fold-change|≥1), 84% of which were upregulated in the mutants. The volcano plot illustrates the criteria applied for selecting genes with significant and substantial expression changes, shown as blue dots: vertical dashed lines are the fold-change threshold and the horizontal dashed line is the p-value threshold. (B, C) Enrichment for functions and pathways associated with the 348 downregulated genes (B) or the 1853 upregulated genes (C) in hpk-1 animals yields innate immune response as the most significantly over-represented term for downregulated genes, but reveals a large number of significant associations to pathways and processed for the upregulated genes – many of which are associated with neurons and neuronal signaling. Each bar represents a functional term or pathway from the Gene Ontology (GO), KEGG, or Reactome databases, as indicated. Bar colors show the –log10 transformed enrichment p-value. The number in each bar is the size of the overlap between the set of differentially expressed genes and the genes in the term or pathway. The x-axis indicates the fraction of the total genes in the term or pathway that were differentially expressed. All results shown have significant enrichment after adjustment for multiple testing. (D) Functional enrichment for 283 genes upregulated with hpk-1 loss that are specific to, or enriched in, C. elegans neurons shows broad dysregulation of functions associated with neurons including neurotransmitter transport and release, cell-cell junctions, axons, neuropeptides, and sensory processes, among others; 880 genes uniquely expressed or significantly enriched in neurons were derived from bulk tissue-specific RNA-Seq profiling results in Kaletsky et al., 2018, and 32% of these are significantly upregulated in hpk-1 null animals. See Supplementary file 10 and Supplementary file 11 for dataset and additional analysis.
Figure 5 with 2 supplements
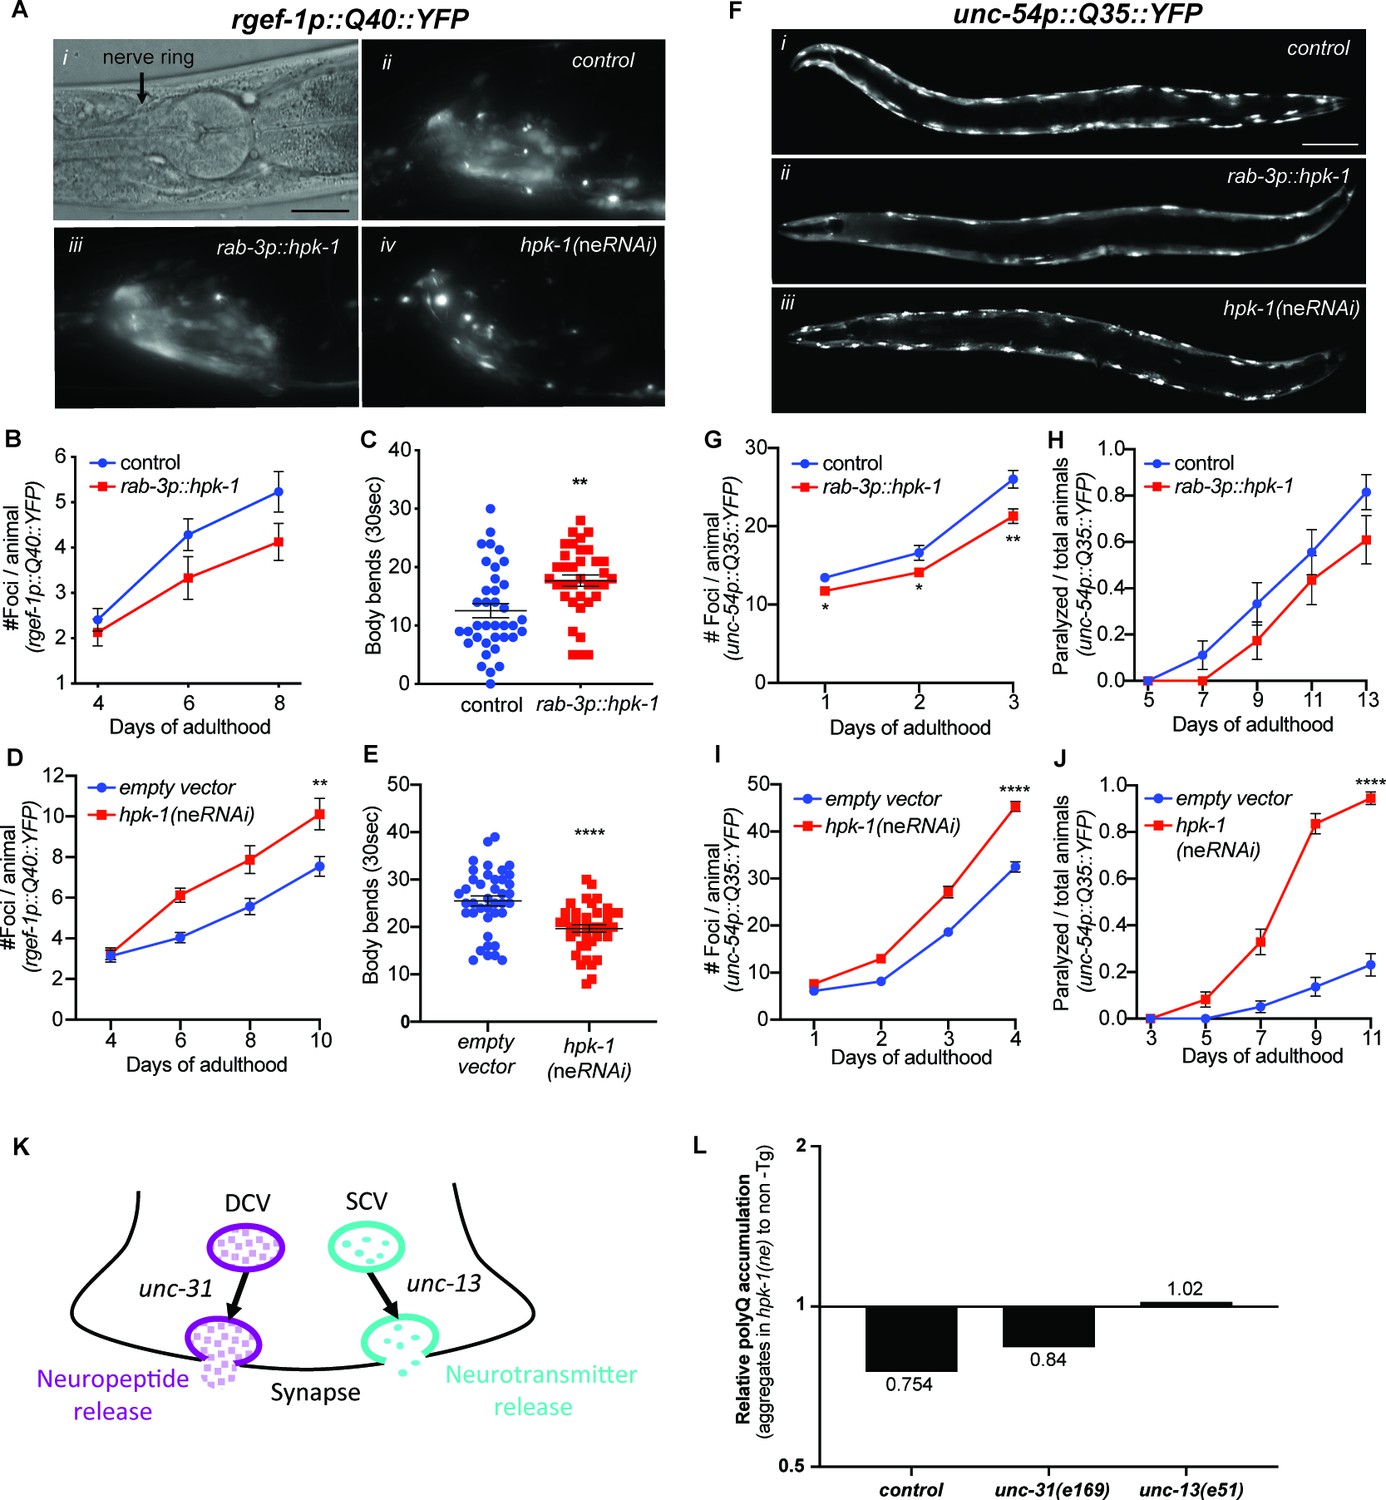
Neuronal homeodomain-interacting protein kinase (HPK-1) prevents the decline in proteostasis through neurotransmitter release.
(A) Nomarski (i) and fluorescent (ii–iv) micrographs of animals expressing polyglutamine fluorescent reporter within the nervous system. Scale bar, 25 μm. (B and C) Quantification of foci in the nerve ring (B) and body bend frequency (C) (n>21 for B and n>36 for C). (D and E) Quantification of foci in the nerve ring (D) and frequency of body bends (E) in neuronal enhanced RNAi animals (n>19 for D and n>39 for E). (F) Fluorescent micrographs of animals expressing the polyglutamine fluorescent reporter in muscle. Scale bar, 100 μm. (G and H) Quantification of foci in muscle (G) and paralysis rate (H). Graphs are representative of five individual transgenic lines (n>18 for G and n>23 for H). (I and J) Quantification of foci in muscle (I) and paralysis rate (J) in neuronal enhanced RNAi animals (n>22 for I and n>73 for J). (K) Neuropeptides and neurotransmitters are essential for neuronal signaling; vesicle release depends on unc-31 and unc-13, respectively. (L) Quantification of relative polyQ fluorescent foci in muscle cells after rab-3p::hpk-1 overexpression in control, unc-31(e169) and unc-13(e51) animals; see Figure 5—figure supplement 2 for absolute values and statistical analysis. t-Test analysis with **p<0.01 and ***p<0.001. Bars represent ± SEM. See Supplementary file 2, Supplementary file 12 and Supplementary file 13 for details and additional trials.
Figure 5—figure supplement 1

Homeodomain-interacting protein kinase (HPK-1) kinase activity is necessary to improve proteostasis.
(A) Multiple sequence alignment of the HPK-1 kinase domain across evolutionarily distant species. Alignment was conducted using Clustal Omega (Sievers et al., 2011), with sequence IDs: HIPK2 (NP_073577.3), HPK-1 (F20B6.8a), HIPK2 (Mus musculus, NP_001281073.1), HIPK (Drosophila melanogaster, CG17090), HPK-1 (Caenorhabditis briggsae, CBP26904), and Yak1 (SGDID:S000003677). (B) Overlap between the predicted tertiary structures of the kinase domain of C. elegans HPK-1 (green), Saccharomyces cerevisiae Yak1 (pink), and Homo sapiens HIPK2 (blue). The K176A and D272N mutations are indicated by a red triangle and purple star, respectively, falling within the catalytic domain (He et al., 2010). Predicted structures for these genes were downloaded from AlphaFold (Jumper et al., 2021; Varadi et al., 2022): HPK-1(Q8MQ70 HIPK_CAEEL), Yak1 (A0A7C8V8P7_ORBOL), (H7BXX9_HUMAN). Highly conserved regions observed using multiple sequence alignment were then aligned in 3D using PyMol alignment tool (DeLano, 2002). (C–F) Quantification of foci in muscle (C, D) and paralysis rate (E, F) of transgenic animals with neuronal overexpression of hpk-1(K176A) (C, E) and hpk-1(D272N) (D, F), respectively (n>20 for C, n>20 for D, n>48 for E, and n>30 for F). t-Test analysis was performed between transgenic and non-transgenic animals at every time point. Bars represent ± SEM. See Supplementary file 12 and Supplementary file 13 for details.
Figure 5—figure supplement 2
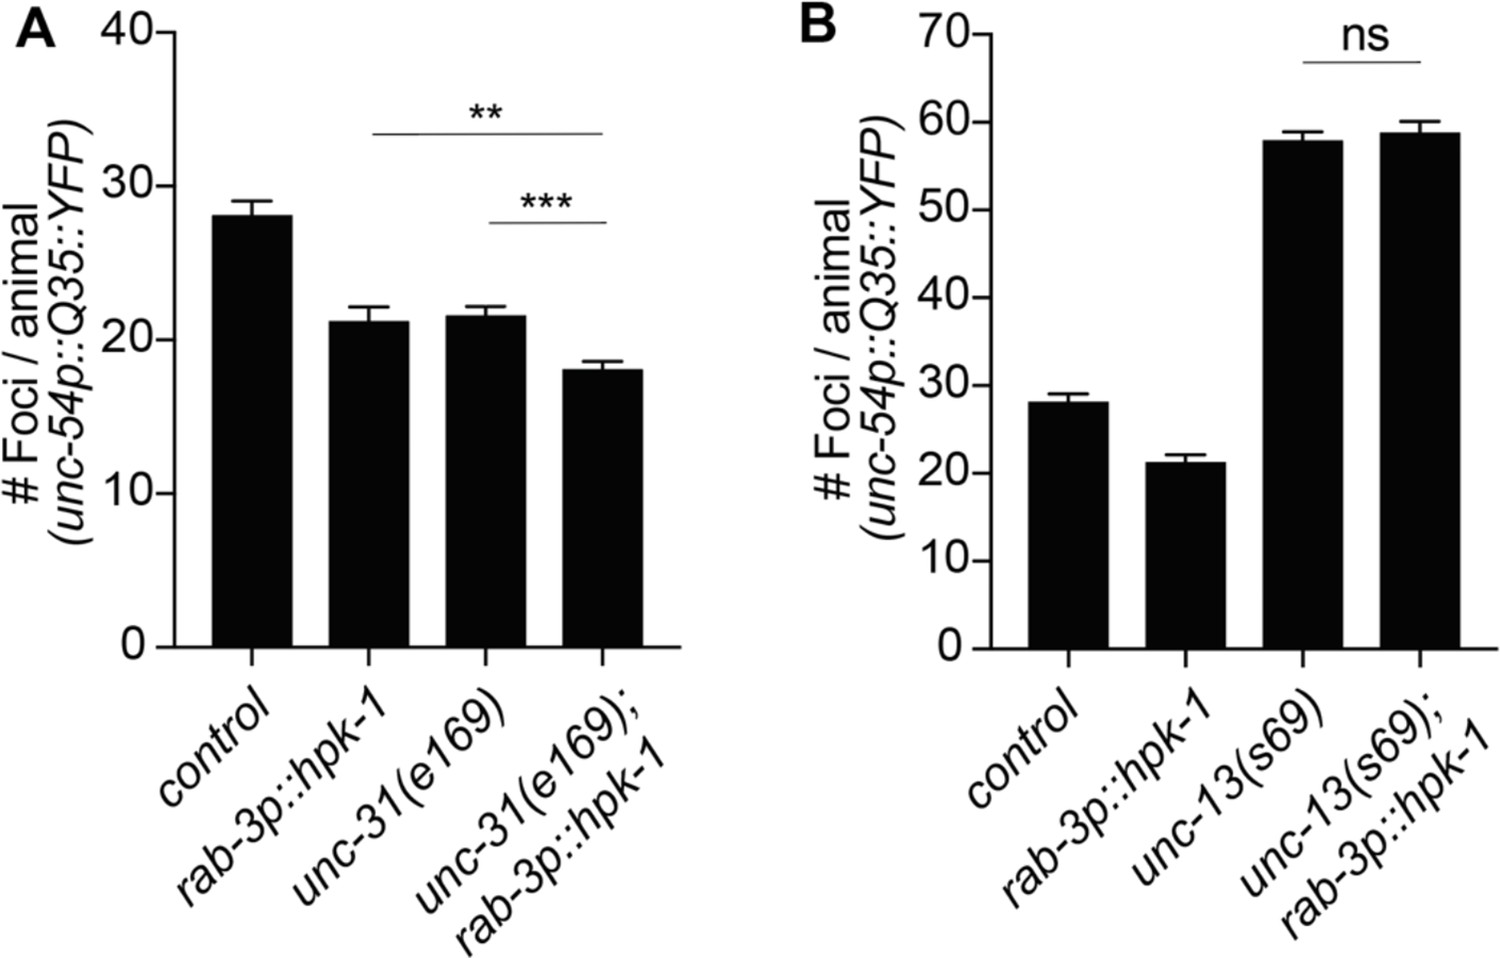
Homeodomain-interacting protein kinase (HPK-1) cell non-autonomous regulation of proteostasis depends on neurotransmitter signaling.
(A) Quantification of polyQ foci in muscle of wild-type and neuropeptide secretion mutants, unc-31(e169) (n>21). (B) Quantification of foci in muscle of wild-type and neurotransmitters secretion mutants, unc-13(e51) (n>21). t-Test analysis with **p<0.01 and ***p<0.001. Bars represent ± SEM. See Supplementary file 12 for details.
Figure 6
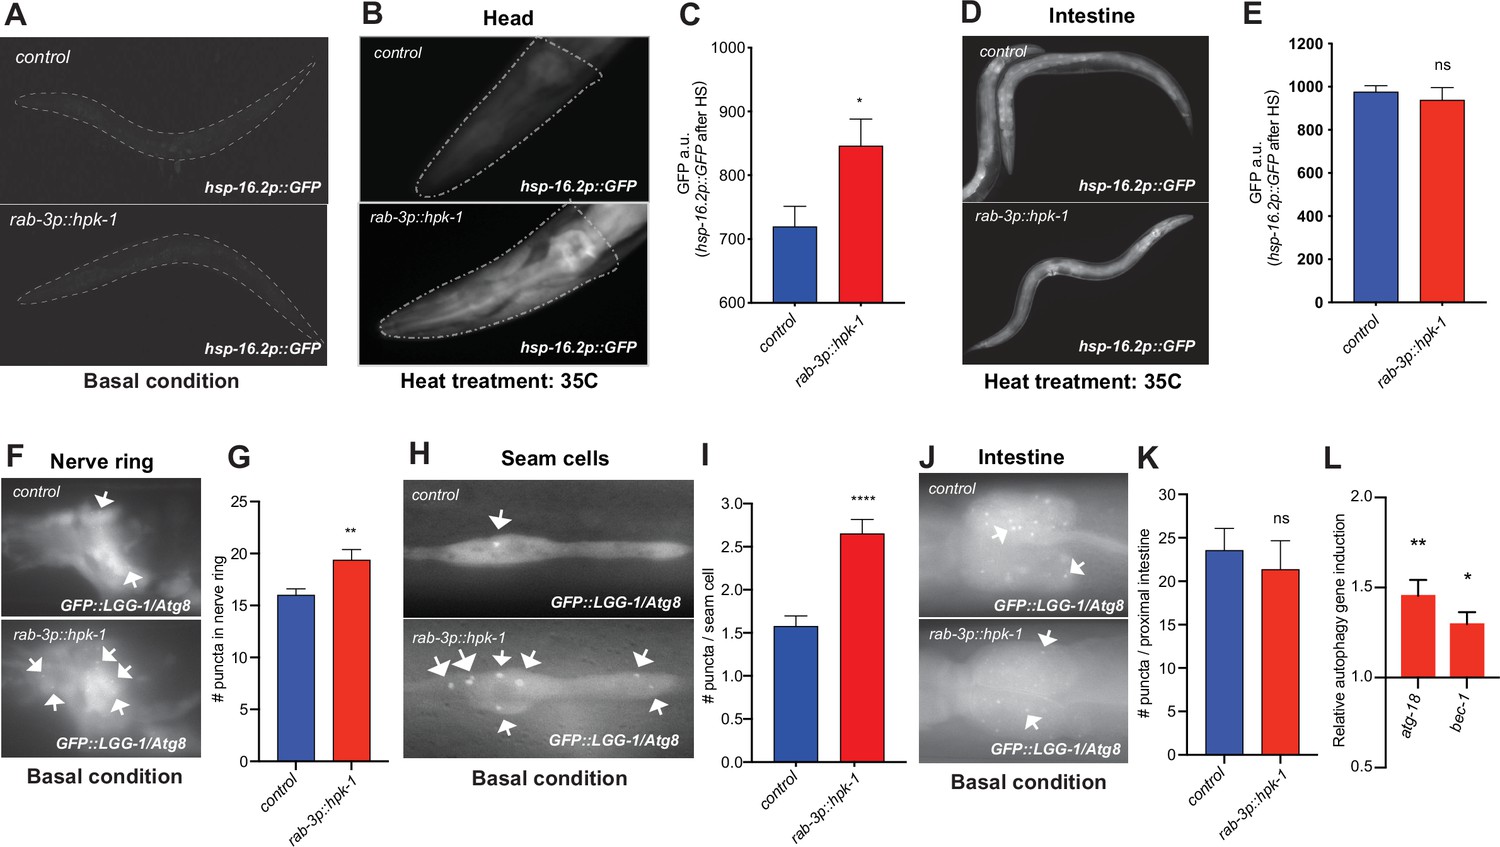
Neuronal homeodomain-interacting protein kinase (HPK-1) induces the proteostatic network in distal tissues.
(A) Fluorescent micrographs of animals expressing hsp-16.2p::GFP in basal conditions. (B and C) Fluorescent micrographs (B) and fluorescent density quantification (C) of control and rab-3p::hpk-1 day 1 adult animals expressing hsp-16.2p::GFP after heat shock (35°C) for 1 hr at (n>15). (D and E) Fluorescent micrographs and densitometry quantification of the intestinal fluorescence of hsp-16.2p::GFP after heat shock (n>24). (F and G) Fluorescent micrographs and quantification of fluorescent puncta in the nerve ring of control and rab-3p::hpk-1 L4 animals expressing rgef-1p::GFP::LGG-1/Atg8 (n>21). (H and I) Fluorescent micrographs (H) and quantification (I) of puncta in seam cells of control and rab-3p::hpk-1 animals expressing lgg-1p::GFP::LGG-1/Atg8 (n>43). (J and K) Fluorescent micrographs (J) and quantification (K) of puncta in proximal intestinal cells of control and rab-3p::hpk-1 animals expressing the lgg-1p::GFP::LGG-1/Atg8 autophagosome reporter (n>17). (L) Expression of autophagy genes atg-18 and bec-1 via RT-qPCR in rab-3p::HPK-1 animals compared to non-transgenic controls. t-Test analysis with *p<0.05, **p<0.01, ***p<0.001, and ****p<0.0001. Bars represent ± SEM. See Supplementary file 4, Supplementary file 14 and Supplementary file 15 for details and additional trials.
Figure 7 with 2 supplements
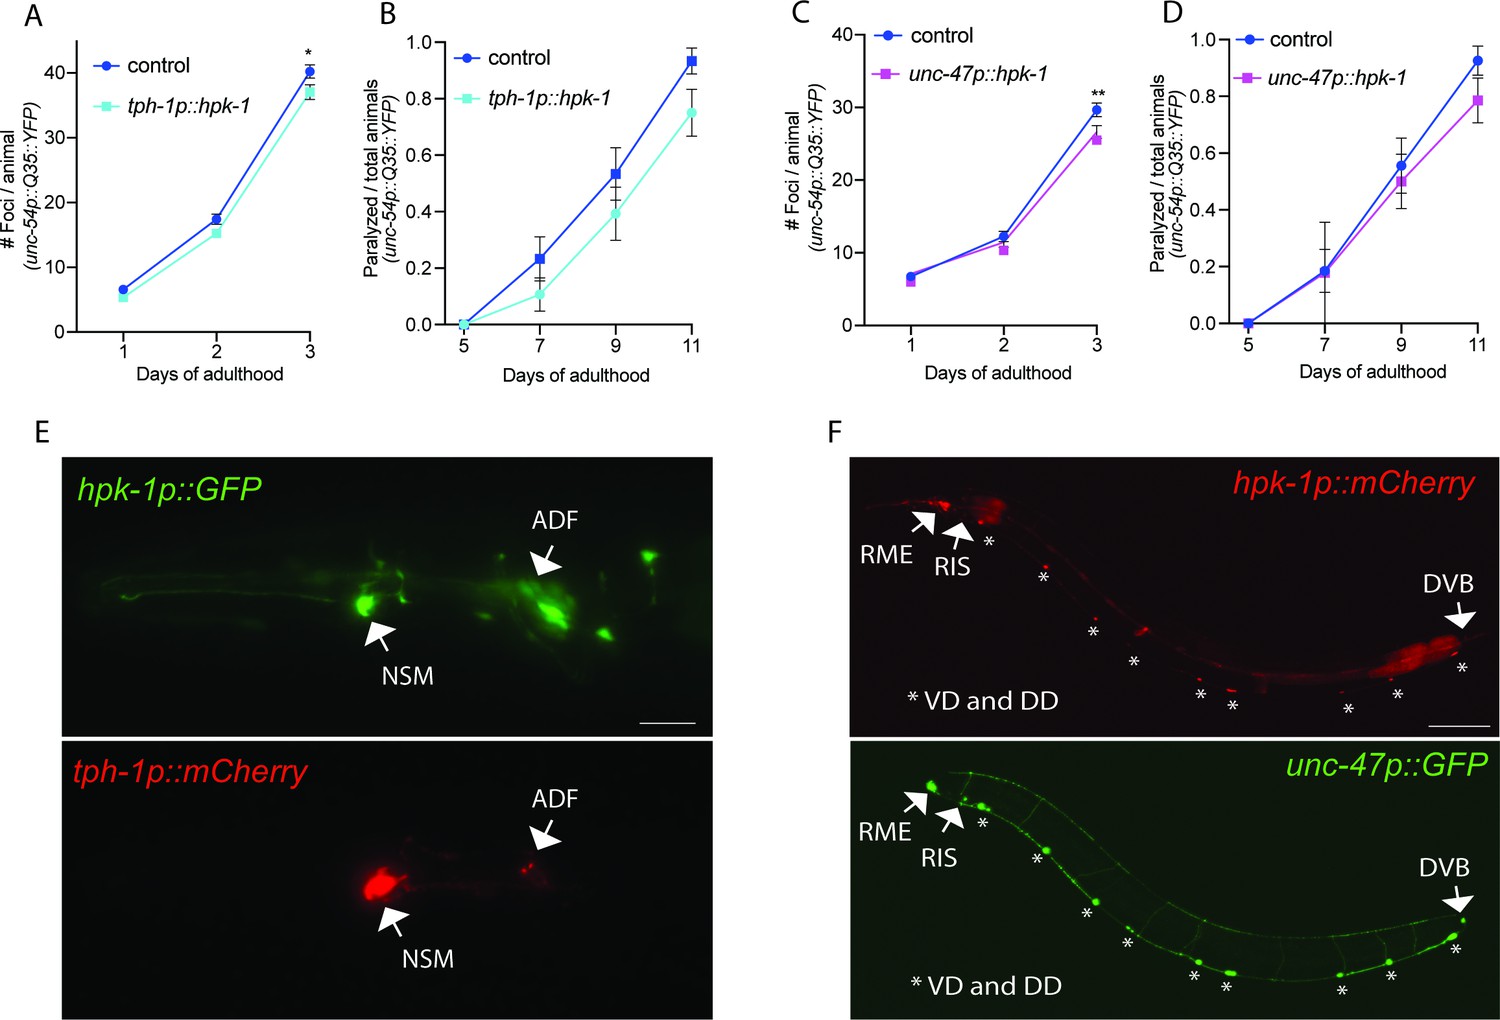
Expression of homeodomain-interacting protein kinase (HPK-1) in serotonergic and γ-aminobutyric acid (GABA)ergic prevents the decline in proteostasis in muscle tissue.
(A and B) Quantification of foci (A) and paralysis rate (B) of animals expressing hpk-1 in serotonergic neurons (n>17 for A and n>28 for B). (C and D) Quantification of foci (C) and paralysis rate (D) of animals expressing hpk-1 in GABAergic neurons (n>19 for C and n>27 for D). (E) Representative fluorescent micrographs of hpk-1 expression in serotonergic neurons. Scale bar, 25 μm. (F) Representative fluorescent micrographs of hpk-1 expression in GABAergic neurons. Scale bar, 100 μm. t-Test analysis performed to each time point with *p<0.05 and **p<0.01. Bars represent ± SEM. See Supplementary file 12 and Supplementary file 13 for details and additional trials.
Figure 7—figure supplement 1

Hpk-1 expression in glutamatergic and dopaminergic neurons is not sufficient to prevent the decline in proteostasis.
(A and B) Quantification of number of foci (A) and paralysis rate (B) of animals expressing hpk-1 in the glutamatergic neurons (eat-4p::hpk-1; green line) and control non-transgenic siblings (blue line) (n>18 for A and n>29 for B). (C and D) Quantification of number of foci (C) and paralysis rate (D) of animals expressing hpk-1 in the dopaminergic neurons (cat-2p::hpk-1; orange line) and control non-transgenic siblings (blue line) (n>16 for C and n>34 for D). Bars represent ± SEM. See Supplementary file 12 and Supplementary file 13 for details and additional trials.
Figure 7—figure supplement 2
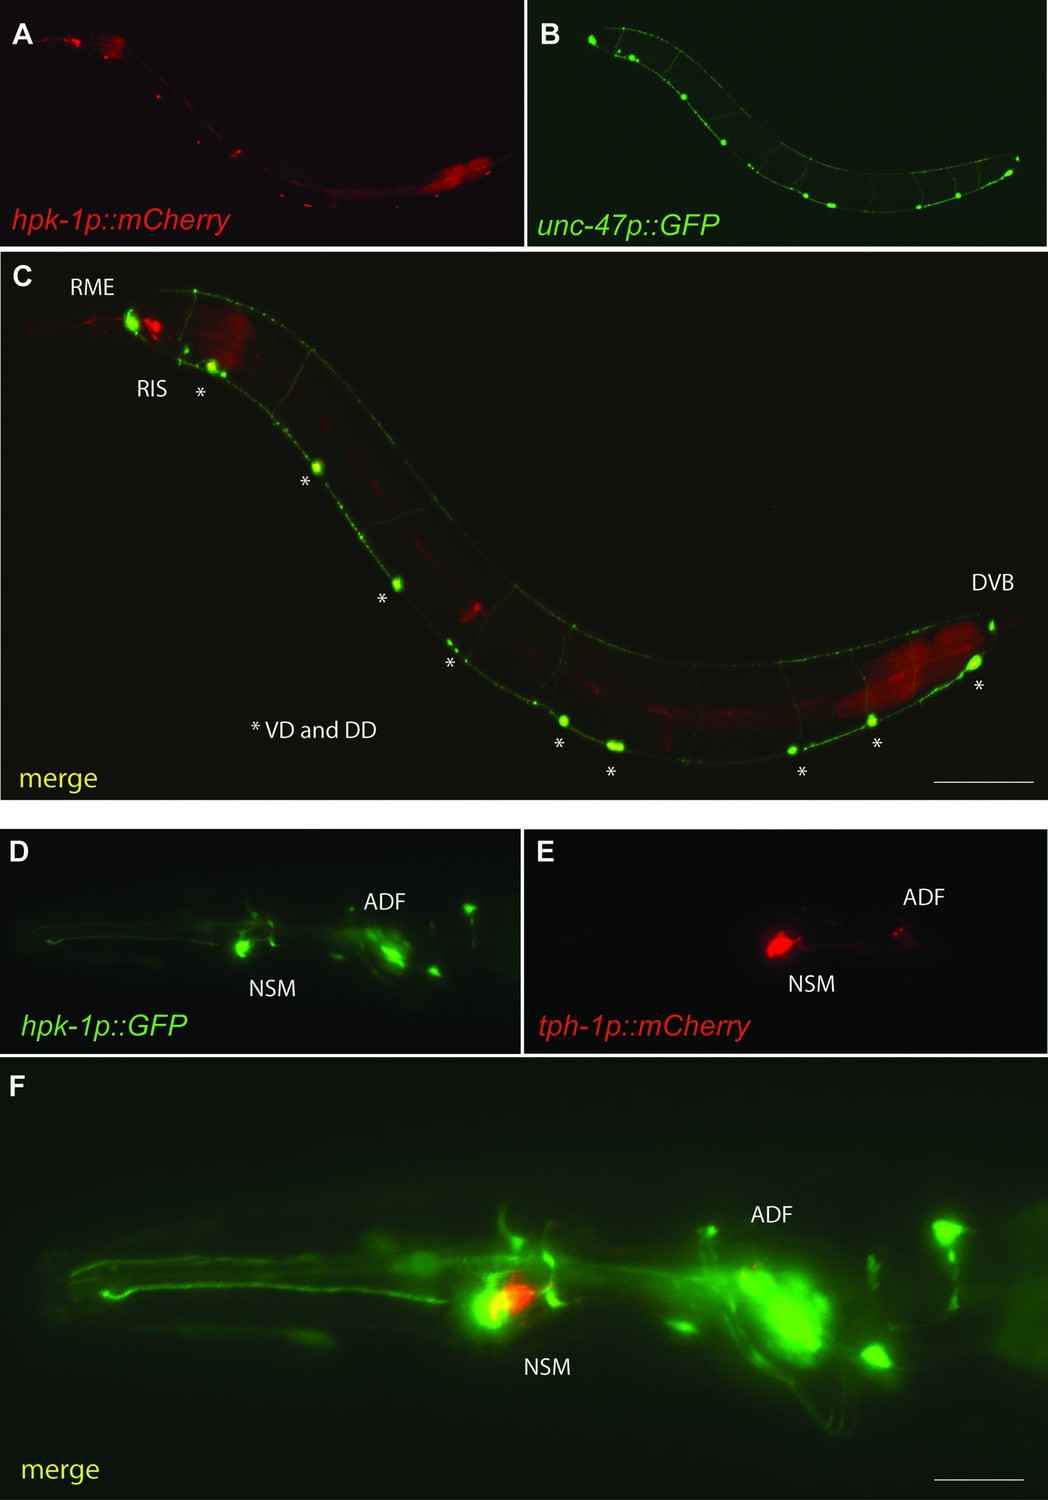
Hpk-1 is expressed in γ-aminobutyric acid (GABA)ergic and serotonergic neurons.
Representative fluorescent micrographs of day 1 adult animals co-expressing hpk-1p::mCherry and unc-47p::GFP (A–C); and hpk-1p::GFP and tph-1p::mCherry (D–F). Scale bars, 100 μm for (C) and 25 μm for (F).
Figure 8 with 2 supplements
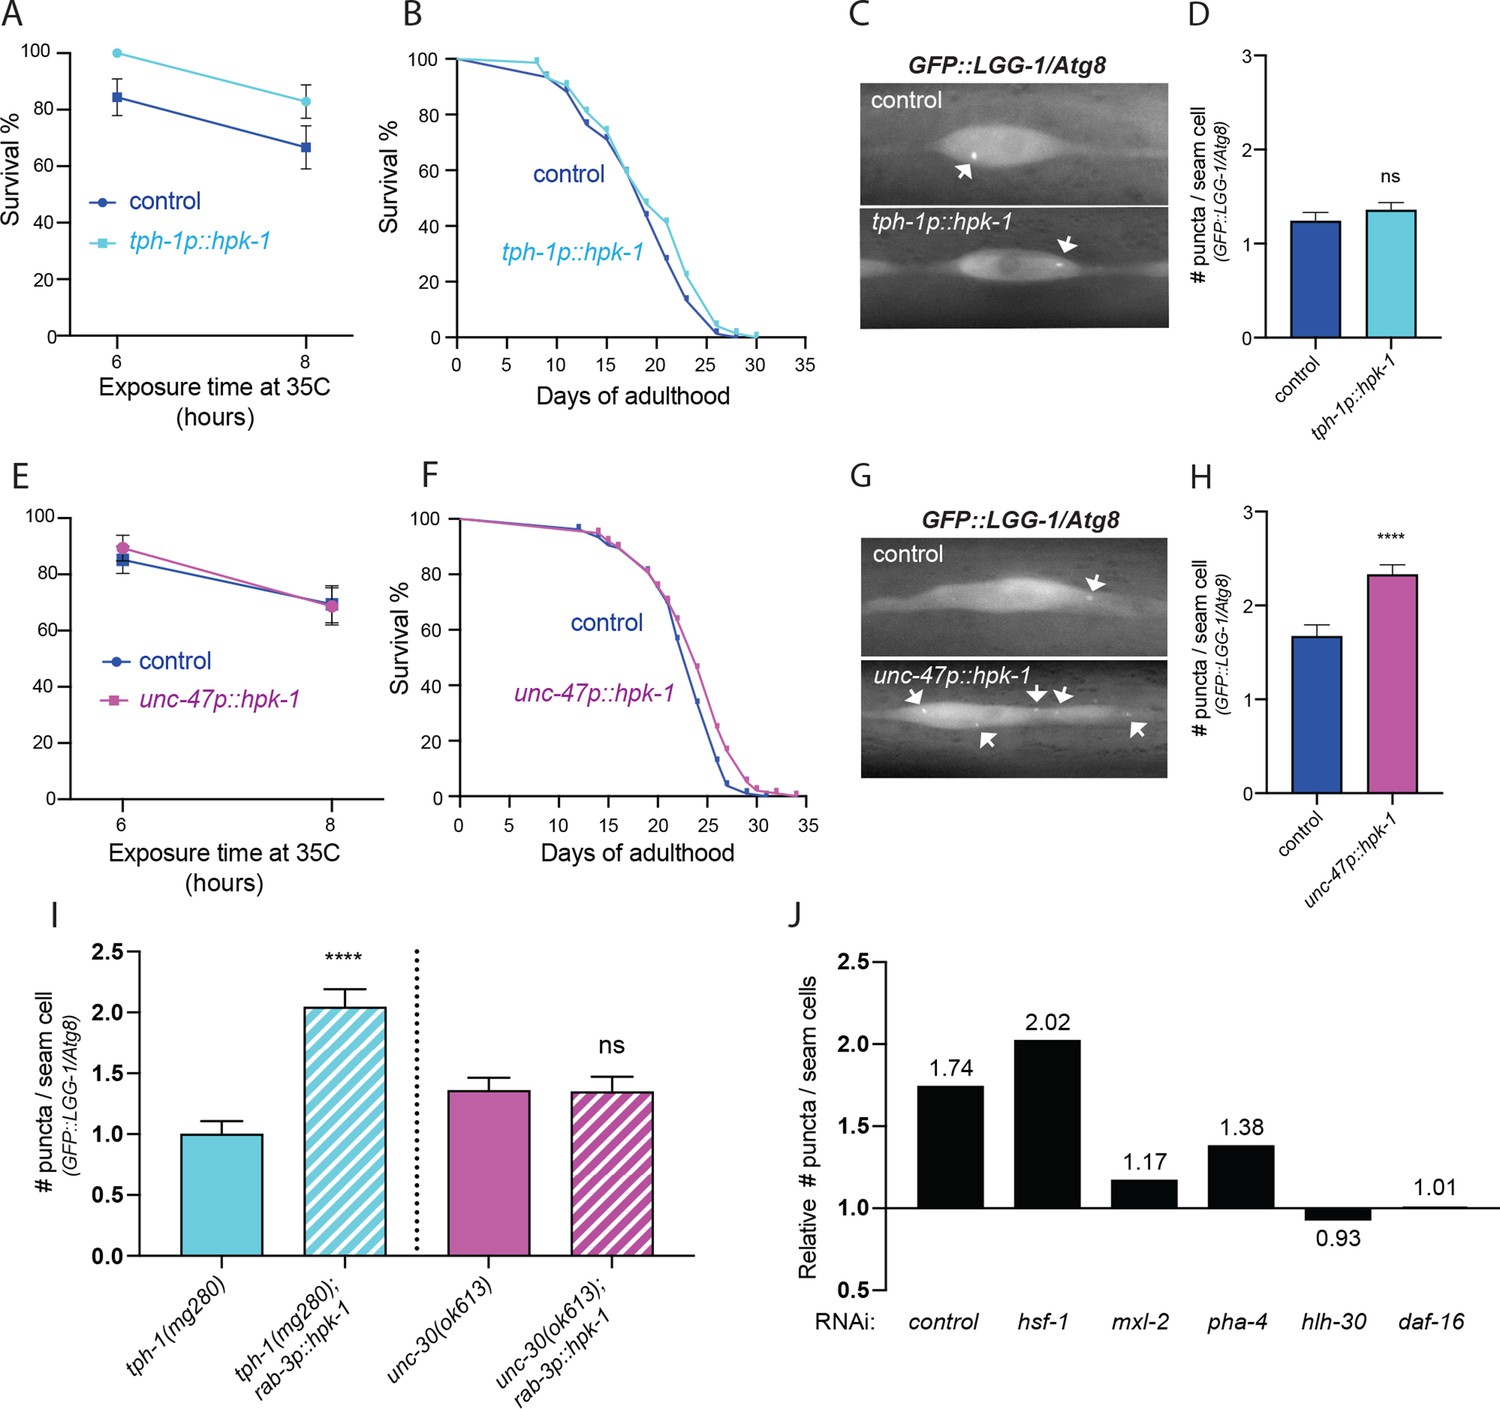
Serotonergic and γ-aminobutyric acid (GABA)ergic homeodomain-interacting protein kinase (HPK-1) signaling activates distinct adaptive responses to regulate stress resistance and longevity.
(A) Survival of serotonergic HPK-1 expressing day 1 adult animals after heat shock (n>32). (B) Lifespan of serotonergic HPK-1 expressing animals (n>76). (C and D) Representative fluorescent micrographs (C) and quantification (D) of autophagosomes in hypodermal cells of serotonergic HPK-1 day 1 adult animals (n>80). (E) Survival of GABAergic HPK-1 expressing day 1 adult animals after heat shock (n>47). (F) Lifespan of GABAergic HPK-1 expressing animals (n>119). (G and H) Representative fluorescent micrographs (G) and quantification of autophagosomes in hypodermal cells of GABAergic HPK-1 day 1 adult animals (n>64). (I) Quantification of autophagosomes in hypodermal cells of mutant animals of serotonin and GABAergic signaling (tph-1 and unc-30, respectively), expressing pan-neuronal hpk-1 (day 1 adults, n>67). (J) Relative change in number of puncta in seam cells of unc-47p::hpk-1 animals expressing lgg-1p::GFP::LGG-1/Atg8, compared to non-transgenic controls after indicated gene inactivation (n>28) for all conditions; see Figure 8—figure supplement 1 for absolute values and statistical analysis. t-Test analysis with *p<0.05, **p<0.01, and ****p<0.0001. Bars represent ± SEM. See Supplementary file 1, Supplementary file 3, and Supplementary file 15 for details and additional trials.
Figure 8—figure supplement 1
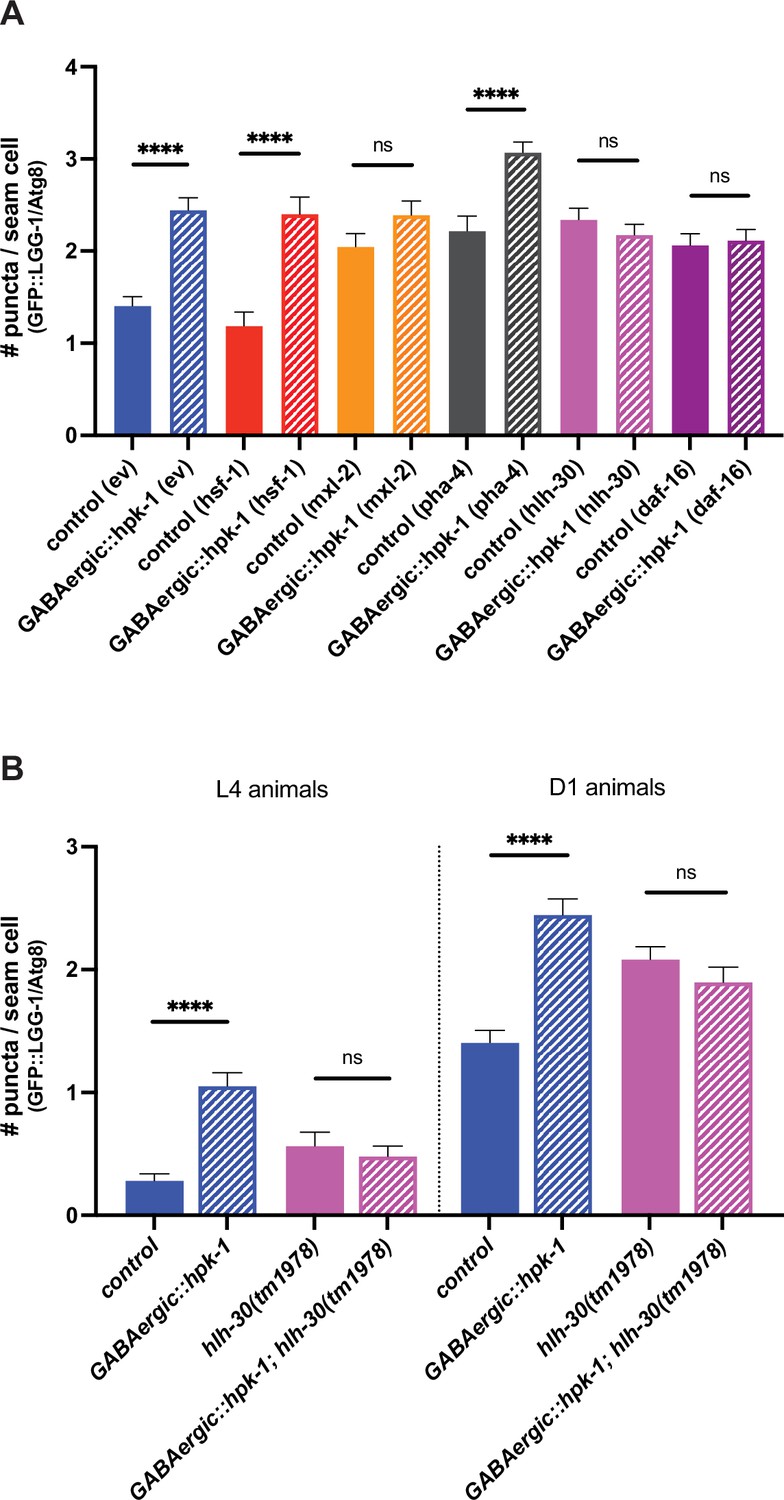
HLH-30 (TFEB), MXL-2 (Mlx), and DAF-16 (FoxO) are required for homeodomain-interacting protein kinase (HPK-1)-mediated induction of autophagy.
(A) Quantification of puncta in seam cells of unc-47p::hpk-1 and non-transgenic control animals expressing lgg-1p::GFP::LGG-1/Atg8 after either RNAi treatment with empty vector (ev), hsf-1, mxl-2, pha-4, hlh-30, or daf-16 (n>28). (B) Quantification of puncta in seam cells of unc-47p::hpk-1 and non-transgenic control animals expressing lgg-1p::GFP::LGG-1/Atg8 in otherwise wild-type or hlh-30(tm1978) mutant animals at L4 (left) or day 1 of adulthood (right) (n>57). t-Test analysis with ****p<0.0001. Bars represent ± SEM. See Supplementary file 15 for details and additional trials.
Figure 8—figure supplement 2
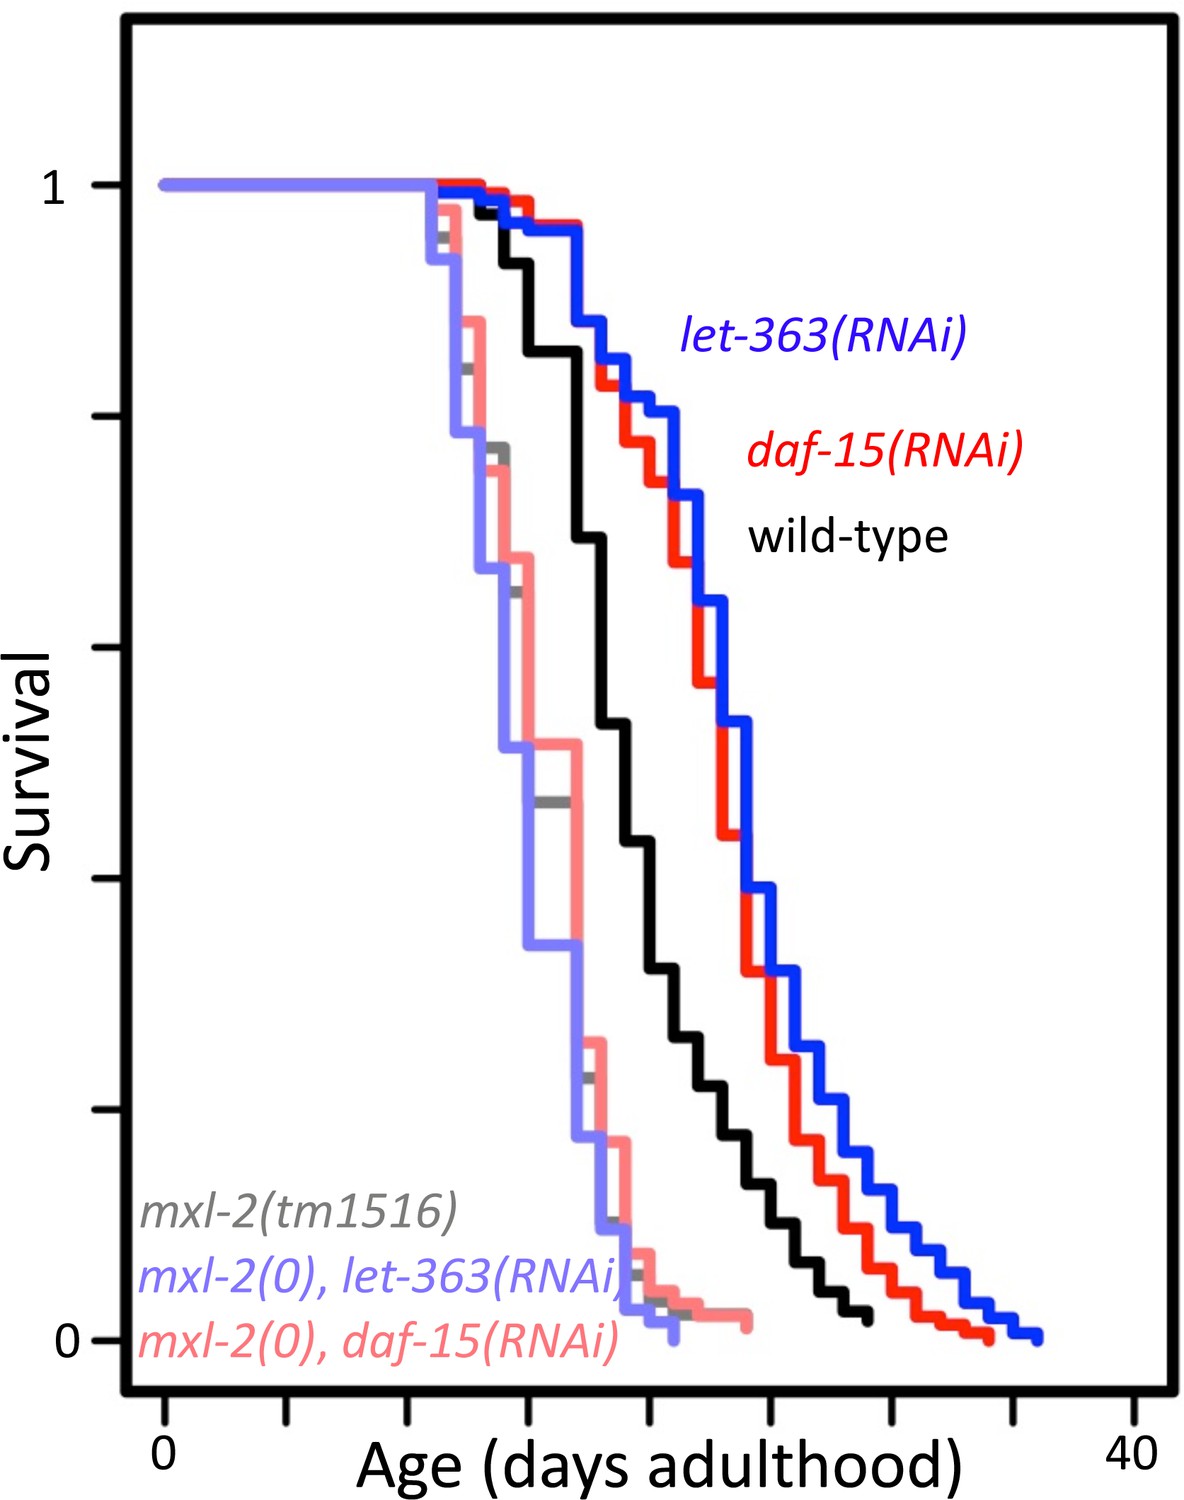
mxl-2 is required for decreased target of rapamycin complex 1 (TORC1) signaling to increase longevity.
Lifespan of wild-type (N2, darker shades) or mxl-2(tm1516) null mutant animals (lighter shades) treated with either empty vector (black/gray), let-363(RNAi) (blues), or daf-15(RNAi) (reds). Lifespan graph is representative of one trial with two replicates. Curves were plotted using WormLife (https://github.com/samuelsonlab-urmc/wormlife) (Cornwell et al., 2018). See Supplementary file 1 for details and additional trial.
Figure 9
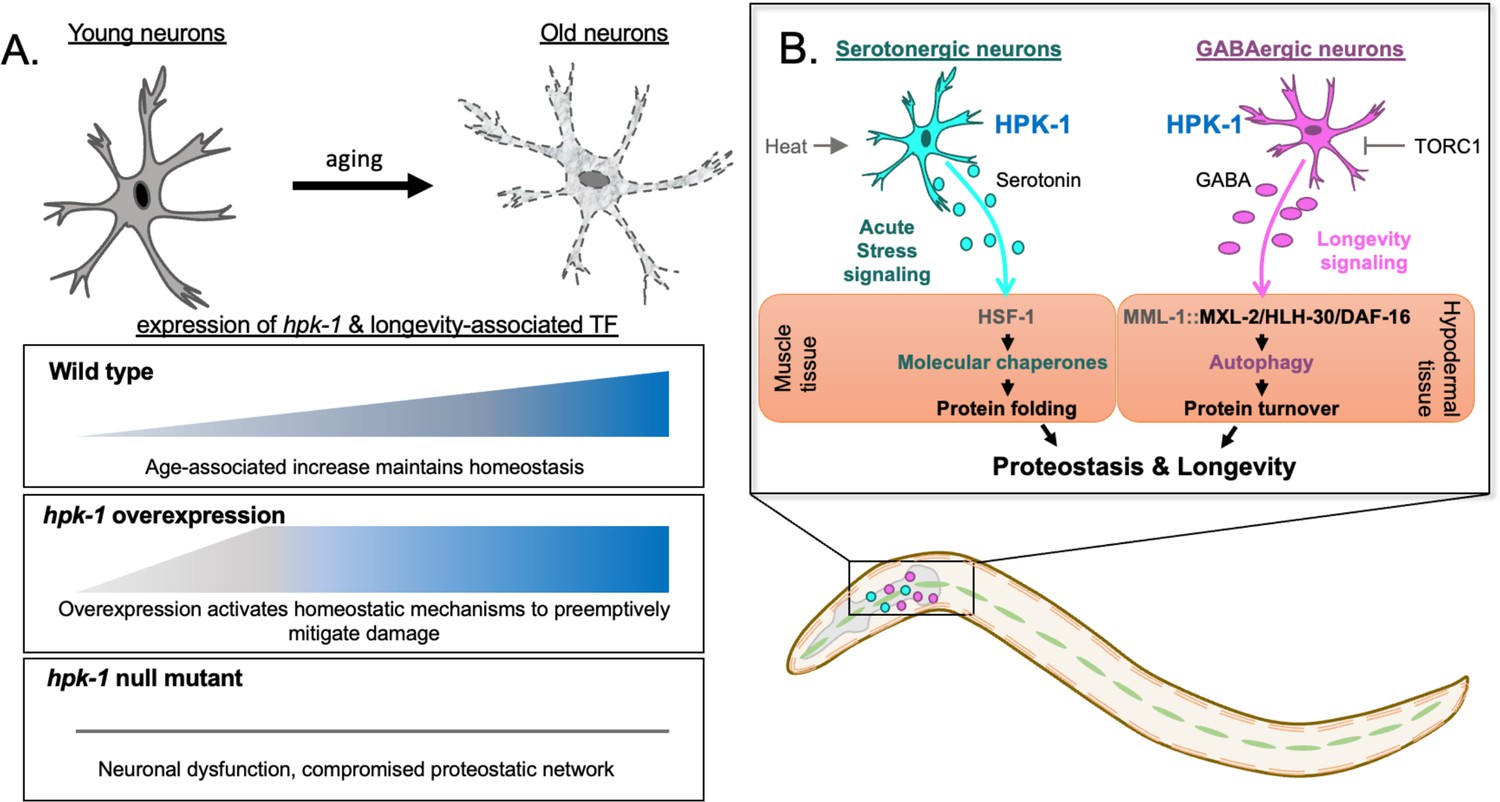
Differential regulation of the proteostatic network through homeodomain-interacting protein kinase (HPK-1) activity in serotonergic and γ-aminobutyric acid (GABA)ergic neurons.
(A) During normal aging hpk-1 expression increases broadly throughout the nervous system in response to accumulating damage and dysfunction. Overexpression of hpk-1 within the nervous system fortifies proteostasis by priming and preemptively activating mechanisms that delay the progression of aging. In the absence of hpk-1 the proteostatic network is compromised, resulting in neuronal dysfunction and increased expression compensatory mechanisms to maintain homeostasis (see text for details). (B) HPK-1 activity in serotonergic and GABAergic neurons initiates distinct adaptive responses, either of which improve proteostasis in a cell non-autonomous manner. Serotonergic HPK-1 protects the proteome from acute heat stress, while GABAergic HPK-1 fortifies the proteome by regulating autophagy activity in response to metabolic stress, such as changes in target of rapamycin complex 1 (TORC1) activity. The MXL-2, HLH-30 (TFEB), and DAF-16 (FOXO) transcription factors are all required for hypodermal induction of autophagy in response to increased HPK-1 activity in GABAergic neurons. Gray indicates predicted interactions based on our prior genetic analysis (Das et al., 2017). MML-1 and MXL-2 heterodimerize and encode the orthologs of the Myc-family of transcription factors Mondo A/ChREBP and Mlx, respectively.
Appendix 1—figure 1
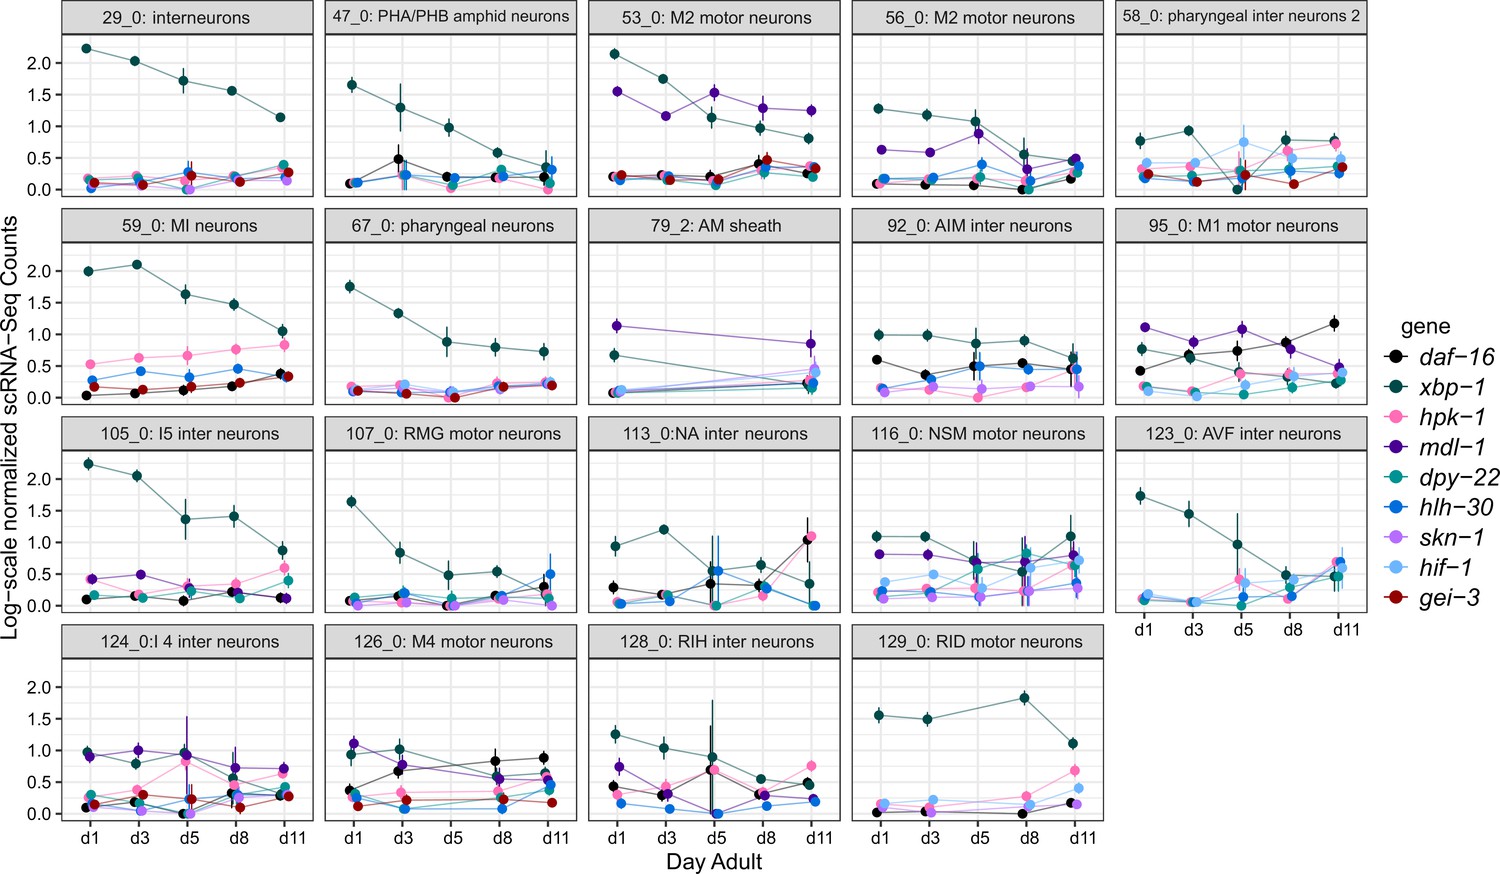
hpk-1 and longevity-associated transcription factors are upregulated in overlapping cell clusters, but timing of the age-associated changes varies between cell clusters.
Per-age expression summary for cell clusters with 4 or more differentially expressed longevity-associated transcription factors, of the 48 cell clusters in which hpk-1 is upregulated in old vs young animals. Each sub-plot shows log-scale normalized scRNA-Seq expression (mean and SEM) for the indicated cluster. Only genes which were significantly differentially expressed in the cluster are shown (old vs young animals, up- or downregulated). Primary data for this analysis was generated in the C. elegans Aging Atlas (Roux et al., 2022).
Videos
Video 1
Homeodomain-interacting protein kinase (HPK-1) functions within the nervous system to regulate healthspan.
Video of wild-type, hpk-1(pk1393) null animals, and hpk-1 null animals with neuronal expression of hpk-1 (rab-3p::HPK-1). Videos were generated from consecutive images taken approximately every 15 min over the course of the animals lifespan on 6 cm plates using the Lifespan Machine method (Stroustrup et al., 2013).
Tables
Key resources table
| Reagent type (species) or resource | Designation | Source or reference | Identifiers | Additional information |
|---|---|---|---|---|
| Genetic reagent (C. elegans) | N2 | N2 (CGCM) | Wild type | |
| Genetic reagent (C. elegans) | AVS392 | EK273 | hpk-1(pk1393) X | |
| Genetic reagent (C. elegans) | AVS543 | This paper | artEx41 | artEx41 [rab-3p::hpk-1::CFP+pCFJ90 (myo-2p::mCherry)] |
| Genetic reagent (C. elegans) | AVS609 | This paper | artEx43 | artEx43 [myo-3p::hpk-1+pCFJ90 (myo-2p::mCherry)] line 1 |
| Genetic reagent (C. elegans) | AVS614 | This paper | artEx48 | artEx48 [dpy-7p::hpk-1+pCFJ90 (myo-2p::mCherry)] line 1 |
| Genetic reagent (C. elegans) | AVS627 | This paper | artEx52 | artEx52 [ges-1p::hpk-1+pCFJ90 (myo-2p::mCherry)] line 1 |
| Genetic reagent (C. elegans) | AVS420 | This paper | artEx41 | hpk-1(pk1393) X; artEx41 [rab-3p::hpk-1::CFP+pCFJ90 (myo-2p::mCherry)] |
| Genetic reagent (C. elegans) | AVS602 | CZ13799 | juls76 | juIs76 [unc-25p::GFP+lin-15(+)] II |
| Genetic reagent (C. elegans) | AVS608 | This paper | juls76 | hpk-1(pk1393); juIs76 [unc-25p::GFP+lin-15(+)] II |
| Genetic reagent (C. elegans) | AVS752 | This paper | artEx41 | artEx41 [rab-3p::hpk-1::CFP+pCFJ90 (myo-2p::mCherry)]; hpk-1(pk1393); juIs76 [unc-25p::GFP+lin-15(+)] II |
| Genetic reagent (C. elegans) | AVS832 | This paper | rmIs132; artEx58 | rmIs132 [unc-54p::Q35::YFP] I; artEx58 [rab-3p::hpk-1+pCFJ90 (myo-2p::mCherry)] line 1 |
| Genetic reagent (C. elegans) | AVS833 | This paper | rmIs132; artEx59 | rmIs132 [unc-54p::Q35::YFP] I; artEx59 [rab-3p::hpk-1+pCFJ90 (myo-2p::mCherry)] line 2 |
| Genetic reagent (C. elegans) | AVS834 | This paper | rmIs132; artEx60 | rmIs132 [unc-54p::Q35::YFP] I; artEx60 [rab-3p::hpk-1+pCFJ90 (myo-2p::mCherry)] line 3 |
| Genetic reagent (C. elegans) | AVS835 | This paper | rmIs132; artEx61 | rmIs132 [unc-54p::Q35::YFP] I; artEx61 [rab-3p::hpk-1+pCFJ90 (myo-2p::mCherry)] line 4 |
| Genetic reagent (C. elegans) | AVS744 | This paper | rmIs132; artEx75 | artEx75 rab-3p::hpk-1(K176A)+pCFJ90 (myo-2p::mCherry); rmIs132 [Punc-54::Q35::YFP] I line 1 |
| Genetic reagent (C. elegans) | AVS748 | This paper | rmIs132; artEx79 | artEx79 rab-3p::hpk-1(D272N)+pCFJ90 (myo-2p::mCherry); rmIs132 [Punc-54::Q35::YFP] I line 1 |
| Genetic reagent (C. elegans) | AVS562 | This paper | rmIs132; artEx41 | rmIs132 [unc-54p::Q35::YFP] I; artEx41 [rab-3p::hpk-1::CFP+pCFJ90 (myo-2p::mCherry)] line 5 |
| Genetic reagent (C. elegans) | AVS563 | This paper | rmIs110; artEx41 | rmIs110 [F25B3.3p::Q40::YFP]; artEx41 [rab-3p::hpk-1::CFP+pCFJ90 (myo-2p::mCherry)] line 1 |
| Genetic reagent (C. elegans) | AVS837 | This paper | rmIs110; artEx92 | rmIs110 [F25B3.3p::Q40::YFP]; artEx92 [rab-3p::hpk-1::CFP+pCFJ90 (myo-2p::mCherry)] line 2 |
| Genetic reagent (C. elegans) | AVS838 | This paper | rmIs110; artEx93 | rmIs110 [F25B3.3p::Q40::YFP]; artEx93 [rab-3p::hpk-1::CFP+pCFJ90 (myo-2p::mCherry)] line 3 |
| Genetic reagent (C. elegans) | AVS839 | This paper | rmIs110; artEx94 | rmIs110 [F25B3.3p::Q40::YFP]; artEx94 [rab-3p::hpk-1::CFP+pCFJ90 (myo-2p::mCherry)] line 4 |
| Genetic reagent (C. elegans) | AVS214 | HC196 | sid-1(qt9) V | |
| Genetic reagent (C. elegans) | AVS265 | TU3401 | uIs69 | sid-1(pk3321)V; uIs69 [unc-119p::sid-1; myo-2p::mCherry]V |
| Genetic reagent (C. elegans) | AVS540 | This paper | rmIs132; uIs69 | rmIs132 [unc-54p::Q35::YFP] I; sid-1(pk3321)V; uIs69[unc-119p::sid-1; myo-2p::mCherry]V |
| Genetic reagent (C. elegans) | AVS541 | This paper | rmIs110; uIS69 | rmIs110 [F25B3.3p::Q40::YFP]; sid-1(pk3321)V; uIs69[unc-119p::sid-1; myo-2p::mCherry]V |
| Genetic reagent (C. elegans) | AVS713 | This paper | rmIs132; artEx41 | rmIs132 [unc-54p::Q35::YFP] I; artEx41rab-3p::hpk-1::CFP+pCFJ90 (myo-2p::mCherry)]; unc-31(e169)V |
| Genetic reagent (C. elegans) | AVS810 | This paper | rmIs132; artEx41 | rmIs132 [unc-54p::Q35::YFP] I; artEx41 [rab-3p::hpk-1::CFP+pCFJ90 (myo-2p::mCherry)]; unc-13(e51)I |
| Genetic reagent (C. elegans) | AVS84 | TJ375 | gpIs1 | gpIs1 [hsp-16.2p::GFP] IV |
| Genetic reagent (C. elegans) | AVS397 | This paper | gpIs1; artEx35 | gpIs1 [hsp-16.2p::GFP]; artEx35 [sur-5p::hpk-1::CFP+pCFJ90 (myo-2p::mCherry)] |
| Genetic reagent (C. elegans) | AVS399 | This paper | gpIs1; artEx33 | gpIs1 [hsp-16.2p::GFP]; artEx33 [rab-3p::hpk-1::CFP+pCFJ90 (myo-2p::mCherry)] |
| Genetic reagent (C. elegans) | AVS715 | This paper | artEx41; sqIs24 | artEx41 [rab-3p::hpk-1::CFP+pCFJ90 (myo-2p::mCherry)]; sqIs24 [rgef-1p::GFP::lgg-1+unc-122p::RFP] |
| Genetic reagent (C. elegans) | AVS716 | This paper | artEx41; sqIs13 | artEx41 [rab-3p::hpk-1::CFP+pCFJ90 (myo-2p::mCherry)]; sqIs13 [lgg-1p::GFP::lgg-1+odr-1p::RFP] |
| Genetic reagent (C. elegans) | AVS682 | This paper | rmIs132; artEx62 | artEx62 [tph-1p::hpk-1+pCFJ90 (myo-2p::mCherry)] line 1; rmIs132 [unc-54p::Q35::YFP] I |
| Genetic reagent (C. elegans) | AVS683 | This paper | rmIs132; artEx63 | artEx63 [tph-1p::hpk-1+pCFJ90 (myo-2p::mCherry)] line 2; rmIs132 [unc-54p::Q35::YFP] I |
| Genetic reagent (C. elegans) | AVS685 | This paper | rmIs132; artEx65 | artEx65 [unc-47p::hpk-1+pCFJ90 (myo-2p::mCherry)] line 1; rmIs132 [unc-54p::Q35::YFP] I |
| Genetic reagent (C. elegans) | AVS686 | This paper | rmIs132; artEx66 | artEx66 [unc-47p::hpk-1+pCFJ90 (myo-2p::mCherry)] line 2; rmIs132 [unc-54p::Q35::YFP] I |
| Genetic reagent (C. elegans) | AVS691 | This paper | rmIs132; artEx71 | artEx71 [eat-4p::hpk-1+pCFJ90 (myo-2p::mCherry)] line 1; rmIs132 [unc-54p::Q35::YFP] I |
| Genetic reagent (C. elegans) | AVS692 | This paper | rmIs132; artEx72 | artEx72 [eat-4p::hpk-1+pCFJ90 (myo-2p::mCherry)] line 2; rmIs132 [unc-54p::Q35::YFP] I |
| Genetic reagent (C. elegans) | AVS693 | This paper | rmIs132; artEx73 | artEx73 [cat-2p::hpk-1+pCFJ90 (myo-2p::mCherry)] line 1; rmIs132 [unc-54p::Q35::YFP] I |
| Genetic reagent (C. elegans) | AVS694 | This paper | rmIs132; artEx74 | artEx74 [cat-2p::hpk-1+pCFJ90 (myo-2p::mCherry)] line 2; rmIs132 [unc-54p::Q35::YFP] I |
| Genetic reagent (C. elegans) | AVS809 | This paper | sqIs13; artEx62 | artEx62 [tph-1p::hpk-1+pCFJ90 (myo-2p::mCherry)] line 1; sqIs13 [lgg-1p::GFP::lgg-1+odr-1p::RFP] |
| Genetic reagent (C. elegans) | AVS794 | This paper | sqIs13; artEx65 | artEx65 [unc-47p::hpk-1+pCFJ90 (myo-2p::mCherry)] line 1; sqIs13 [lgg-1p::GFP::lgg-1+odr-1p::RFP] |
| Genetic reagent (C. elegans) | AVS709 | This paper | artEx62 | artEx62 [tph-1p::hpk-1+pCFJ90 (myo-2p::mCherry)] line 1 |
| Genetic reagent (C. elegans) | AVS710 | This paper | artEx65 | artEx65 [unc-47p::hpk-1+pCFJ90 (myo-2p::mCherry)] line 1 |
| Genetic reagent (C. elegans) | AVS888 | This paper | aetEx99 | artEx99 [unc-47p::hpk-1+pCFJ90 (myo-2p::mCherry)] line 2 |
| Genetic reagent (C. elegans) | AVS816 | This paper | sqIs13; artEx41 | artEx41(rab-3p::hpk-1::CFP+pCFJ90 (myo-2p::mCherry); sqIs13 [lgg-1p::GFP::lgg-1+unc-122p::RFP]; unc-30(ok613) |
| Genetic reagent (C. elegans) | AVS872 | This paper | sqIs13; artEx41 | artEx41(rab-3p::hpk-1::CFP+pCFJ90 (myo-2p::mCherry); sqIs13 [lgg-1p::GFP::lgg-1+unc-122p::RFP]; tph-1(mg280) |
| Genetic reagent (C. elegans) | AVS836 | This paper | artEx91 | artEx91 [hpk-1p::GFP+tph-1p::mCherry] line 1 |
| Genetic reagent (C. elegans) | AVS757 | This paper | artEx87 | artEx87 [hpk-1p::mCherry+unc-47p::GFP] line 1 |
| Genetic reagent (C. elegans) | AVS001 | CB1370 | daf-2(e1370) | |
| Genetic reagent (C. elegans) | AVS022 | GR1309 | daf-2(e1370); daf-16(mgDf47) | |
| Genetic reagent (C. elegans) | AVS495 | CL6264 | uIs60 | uls60 [unc-119p::YFP+unc119p::sid-1]; eri-1(mg366) |
| Genetic reagent (C. elegans) | AVS817 | This paper | uls60; artIs1 | artIs1 [sur-5p::HPK-1::CFP+pCFJ90 (myo-2p::m-cherry)]; uls60 [unc-119p::YFP+unc119p::sid-1]; eri-1(mg366) |
| Genetic reagent (C. elegans) | AVS488 | This paper | mxl-2(tm1516) | |
| Genetic reagent (C. elegans) | AVS1000 | This paper | sqIs13; artEx65 | artEx65 [unc-47p::hpk-1+pCFJ90 (myo-2p::mCherry)] line 1; sqIs13 [lgg-1p::GFP::lgg-1+odr-1p::RFP]; hlh-30(tm1978) |
| Recombinant DNA reagent | pAVS1 | This paper | Plasmid | rab-3p, hpk-1 cDNA, pPD95.75 backbone |
| Recombinant DNA reagent | pAVS2 | This paper | Plasmid | dyp-7p, hpk-1 cDNA, pPD95.75 backbone |
| Recombinant DNA reagent | pAVS3 | This paper | Plasmid | myo-3p, hpk-1 cDNA, pPD95.75 backbone |
| Recombinant DNA reagent | pAVS4 | This paper | Plasmid | cat-2p, hpk-1 cDNA, pPD95.75 backbone |
| Recombinant DNA reagent | pAVS5 | This paper | Plasmid | eat-4p, hpk-1 cDNA, pPD95.75 backbone |
| Recombinant DNA reagent | pAVS6 | This paper | Plasmid | tph-1p, hpk-1 cDNA, pPD95.75 backbone |
| Recombinant DNA reagent | pAVS7 | This paper | Plasmid | unc-47p, hpk-1 cDNA, pPD95.75 backbone |
| Recombinant DNA reagent | pAVS8 | This paper | Plasmid | rab-3p, hpk-1(K176A), derived from pAVS1 |
| Recombinant DNA reagent | pAVS9 | This paper | Plasmid | rab-3p, hpk-1(D272N), derived from pAVS1 |
| Recombinant DNA reagent | pPD95.75 | Addgene | Plasmid #1494 | |
| Sequence-based reagent | atg-18F | This paper | PCR primer | 5’-ACTTGAGAAAACGGAAGGTGTT |
| Sequence-based reagent | atg-18R | This paper | PCR primer | 5’-TGATAGCATCGAACCATCCA |
| Sequence-based reagent | cdc-42F | This paper | PCR primer | 5’-AGCCATTCTGGCCGCTCTCG |
| Sequence-based reagent | cdc-42R | This paper | PCR primer | 5’-GCAACCGCTTCTCGTTTGGC |
| Sequence-based reagent | bec-1F | This paper | PCR primer | 5’-TTTTGTTGAAAGAGCTCAAGGA |
| Sequence-based reagent | bec-1R | This paper | PCR primer | 5’-CAACCAGTGAATCAGCATGAA |
| Sequence-based reagent | hpk-1F | This paper | PCR primer | 5’-AGTATGCACAGCTCCATCAC |
| Sequence-based reagent | hpk-1R | This paper | PCR primer | 5’-CCATTATTGGGACCGGAACA |
| Sequence-based reagent | xbp-1F | This paper | PCR primer | 5’-TGCCTTTGAATCAGCAGTGG |
| Sequence-based reagent | xbp-1R | This paper | PCR primer | 5’-ACCGTCTGCTCCTTCCTCAATG |
| Sequence-based reagent | gei-3F | This paper | PCR primer | 5’-AAGTCCGAGTCGCTGAACAC |
| Sequence-based reagent | gei-3R | This paper | PCR primer | 5’- ATGCCTGAATGCTGACGCTC |
| Chemical compound, drug | Isopropylthiogalactoside (IPTG) | GoldBio | I2481c-100 | |
| Chemical compound, drug | TRIzol reagent | Life Technologies | Catalog: 15596026 | |
| Chemical compound, drug | FUdR | Fisher/Alfa Aesar | CAS 50-91-9 | |
| Chemical compound, drug | Aldicarb | Fluka Analytical | # 33386 | |
| Chemical compound, drug | Serotonin (5-HT) | Sigma | H9623-100mg | |
| Commercial assay kit | QuikChange II XL Site-Directed Mutagenesis Kit | Agilent | Catalog #200521 | |
| Commercial assay kit | RNeasy Plus Mini Kit | QIAGEN | Cat. No.:74034 | |
| Commercial assay kit | cDNA synthesis kit | Bio-Rad | #1708890 | |
| Commercial assay kit | PerfeCTa SYBR green FastMix | Quantabio | #101414-276 | |
| Commercial assay kit | TruSeq Stranded mRNA | Illumina | ||
| Software, algorithm | Prism | GraphPad | Version 7 | |
| Software, algorithm | AxioVision | v4.8.2.0 | ||
| Software, algorithm | FastQC | Andrews, 2010 | ||
| Software, algorithm | Trimmomatic | Bolger et al., 2014 | ||
| Software, algorithm | STAR 2.4.2a | Dobin et al., 2013 | ||
| Software, algorithm | featureCounts | Liao et al., 2014 | Version 1.4.6-p5 | |
| Software, algorithm | RSEM | Li and Dewey, 2011 | ||
| Software, algorithm | R statistical software environment | Team, 2013 | Version 4.0.2 | |
| Software, algorithm | DESeq2 | Love et al., 2014 | ||
| Software, algorithm | GOSeq | Young et al., 2010 | ||
| Software, algorithm | MuDataSeurat | Hao et al., 2021 |
-
All strains generated in this study are available upon request from the Samuelson laboratory or can be found at the Caenorhabditis Genetics Center (https://cgc.umn.edu/).
-
All plasmids generated in this study are available upon request from the Samuelson laboratory.
-
All primers were generated at Integrated DNA Technologies (https://www.idtdna.com/pages).
Additional files
-
Supplementary file 1
Trials, data, strains, genotypes, number of animals, and statistics for lifespan data presented in Figures 1a–d, f–8b, f , Figure 8—figure supplement 2, and Figure 8—figure supplement 2.
- https://cdn.elifesciences.org/articles/85792/elife-85792-supp1-v3.xlsx
-
Supplementary file 2
Experimental data, strains, genotypes, number of animals, and statistical analysis for data presented in Figures 1e, 5c and e.
- https://cdn.elifesciences.org/articles/85792/elife-85792-supp2-v3.xlsx
-
Supplementary file 3
Trials, data, analysis, strains, genotypes, number of animals, and statistics for thermotolerance data presented in Figures 1g, 8a and e.
- https://cdn.elifesciences.org/articles/85792/elife-85792-supp3-v3.xlsx
-
Supplementary file 4
Trials, data, analysis, strains, genotypes, RNAi conditions, and statistics for RT-qPCR expression analysis presented in Figures 2a, e, 6l.
- https://cdn.elifesciences.org/articles/85792/elife-85792-supp4-v3.xlsx
-
Supplementary file 5
Transcription factors differentially expressed in old vs young animals in the same cell clusters where hpk-1 has significant expression changes with age in the Aging Atlas dataset.
This includes a summary of which clusters exhibit upregulation and which exhibit downregulation for a transcription factor (TF), and if the gene has been previously shown to have aging or lifespan-associated phenotypes in RNAi or loss-of-function mutant experiments. Primary data was from the C. elegans Aging Atlas, and association to aging phenotypes was determined based on curated annotations from WormBase and GenAge. File is associated with Figure 2, Figure 2—figure supplements 1 and 2, Figure 2—figure supplement 4.
- https://cdn.elifesciences.org/articles/85792/elife-85792-supp5-v3.xlsx
-
Supplementary file 6
Kinases differentially expressed in old vs young animals out of any of the 200 clusters with DE analysis results from the Aging Atlas dataset.
Out of 438 kinases identified in C. elegans, 186 have significant age-associated expression changes in at least one Aging Atlas cell cluster. For these kinases, we summarized the number of age-associated up- and downregulated changes, if they have been previously identified as having aging or lifespan phenotypes in loss-of-function experiments, and the fold-changes in hpk-1 null vs WT animals for significant changes in our bulk RNA-Seq experiment. Primary data was from the C. elegans Aging Atlas, and association to aging phenotypes was determined based on curated annotations from WormBase and GenAge. File is associated with Figure 2, Figure 2—figure supplement 1, Figure 2—figure supplement 2, and Figure 2—figure supplement 4.
- https://cdn.elifesciences.org/articles/85792/elife-85792-supp6-v3.xlsx
-
Supplementary file 7
Experimental data, strains, genotypes, number of animals/cells, age, and statistical analysis for data presented in Figure 3b–d.
- https://cdn.elifesciences.org/articles/85792/elife-85792-supp7-v3.xlsx
-
Supplementary file 8
Experimental data, strains, genotypes, number of animals, hours on aldicarb, and statistical analysis for data presented in Figure 3e.
- https://cdn.elifesciences.org/articles/85792/elife-85792-supp8-v3.xlsx
-
Supplementary file 9
Experimental data, strains, genotypes, number of animals, minutes on 5-HT, and statistical analysis for data presented in Figure 3f.
- https://cdn.elifesciences.org/articles/85792/elife-85792-supp9-v3.xlsx
-
Supplementary file 10
Differential expression analysis results for RNA-Seq of hpk-1(pk1393) null mutant animals compared to wild-type, presented in this manuscript.
Sheet 1: Differential expression for all 16,828 genes considered to be expressed in any sample in the experiment. Sheet 2: The subset of genes with significant expression changes between groups (adjusted p-value <0.05, log2 fold-change magnitude ≥1). Additional columns in both sheets include a summary of the raw and normalized expression for each group, and the human homologs from OrthoList, where applicable. File is associated with Figure 4.
- https://cdn.elifesciences.org/articles/85792/elife-85792-supp10-v3.xlsx
-
Supplementary file 11
Of the genes significantly differentially expressed in hpk-1(pk1393) null mutant animals vs wild-type, we found 280 overlap a set of genes with important functions in neurons (Hobert, 2013).
For these genes, table includes a summary of their function, the differential expression fold-change and raw expression level in the hpk-1(pk1393) vs wild-type RNA-Seq comparison, and the clusters from the Aging Atlas dataset with significant age-associated expression changes (where applicable). File is associated with Figure 4.
- https://cdn.elifesciences.org/articles/85792/elife-85792-supp11-v3.xlsx
-
Supplementary file 12
Trials, data, analysis, strains, genotypes, number of animals, age, and statistical analysis of polyglutamine foci formation data presented in Figure 5b, d, g, i, l, Figure 7a, c, Figure 5—figure supplement 1c,d, Figure 6a,b, and Figure 7—figure supplement 1a,c.
- https://cdn.elifesciences.org/articles/85792/elife-85792-supp12-v3.xlsx
-
Supplementary file 13
Trials, data, analysis, strains, genotypes, number of animals, age, and statistical analysis of data for paralysis onset in animals expressing polyQ::YFP presented in Figure 5h, j, Figure 7b, d, Figure 5—figure supplement 1e,f, and Figure 7—figure supplement 1b,d.
- https://cdn.elifesciences.org/articles/85792/elife-85792-supp13-v3.xlsx
-
Supplementary file 14
Trials, fluorescent quantification, analysis, strains, genotypes, number of animals, heat shock conditions, and statistical analysis of data presented in Figure 6c and e.
- https://cdn.elifesciences.org/articles/85792/elife-85792-supp14-v3.xlsx
-
Supplementary file 15
Trials, autophagosome quantification, analysis, strains, genotypes, number of cells, age, and statistical analysis of data presented in Figure 6, Figure 8d, h, i, j, and Figure 8—figure supplement 1.
- https://cdn.elifesciences.org/articles/85792/elife-85792-supp15-v3.xlsx
-
MDAR checklist
- https://cdn.elifesciences.org/articles/85792/elife-85792-mdarchecklist1-v3.docx
Download links
A two-part list of links to download the article, or parts of the article, in various formats.
Downloads (link to download the article as PDF)
Open citations (links to open the citations from this article in various online reference manager services)
Cite this article (links to download the citations from this article in formats compatible with various reference manager tools)
Homeodomain-interacting protein kinase maintains neuronal homeostasis during normal Caenorhabditis elegans aging and systemically regulates longevity from serotonergic and GABAergic neurons
eLife 12:e85792.
https://doi.org/10.7554/eLife.85792


