Activation-pathway transitions in human voltage-gated proton channels revealed by a non-canonical fluorescent amino acid
- Department of Physiology, School of Medicine, Universidad Nacional Autónoma de México, Mexico
Figures
Figure 1 with 3 supplements

Anap as a fluorescent probe in hHV1.
(A) Ribbon representation of transmembrane segments S1–S4 of closed hHV1 based on the model of Randolph et al., 2016. S1–S3 are in gray, whereas S4 is in light blue. S4 positively charged arginine residues are shown as cyan sticks, whereas the residues where Anap was incorporated individually in the S4 segment are depicted as green sticks and with green arrow heads in the S3–S4 sequence below; positively charged arginine residues are indicated in marine blue. (B) Structure of non-canonical amino acid Anap (left), and a schematic representation (right) that shows the incorporation of Anap (green star) into the hHV1 dimer expressed in HEK293 cells. An mCherry fluorescent protein (magenta cylinder) was fused to the C-terminal end of hHV1 as an Anap incorporation reporter. (C) Images of a representative patch-clamp fluorometry (PCF) experiment, showing the voltage-clamped cell and the co-localization of Anap and mCherry fluorescence in the cell membrane for Anap incorporated at position Q191 of hHV1. (D) G-V curves obtained from currents produced by each hHV1 mutant rescued by Anap incorporation. All G-V curves were obtained at ΔpH = 1 and compared with hHV1 WT (n=5); Q191(n=13); A197(n=6); L198(n=7); G199(n=5); L200(n=1); L201(n=4); I202(n=4). Continuous lines are the fit of the conductance data to equation 1; fit parameters are summarized in Supplementary file 1. The incorporation of Anap at the I202 site sifts the G-V ~65 mV to more negative potentials. Data shown are mean ± SEM. (E) Normalized mean emission spectrum of Anap (continuous lines) and mCherry (dashed lines) at each incorporation site (color code from D) recorded at resting potential in non-patched cells. Q191(n=15); A197(n=8); L198(n=7); G199(n=6); L200(n=10); L201(n=8); I202(n=10). The vertical blue line indicates the peak emission of Anap in water (486 nm). A second emission peak can be distinguished in every position inside S4 where Anap was incorporated, except Q191Anap. This peak is located around 610 nm which coincides with the peak emission of mCherry.
-
Figure 1—source data 1
Data for each experiment and sumary of experiments for Figure 1D and E.
- https://cdn.elifesciences.org/articles/85836/elife-85836-fig1-data1-v2.xlsx
Figure 1—figure supplement 1
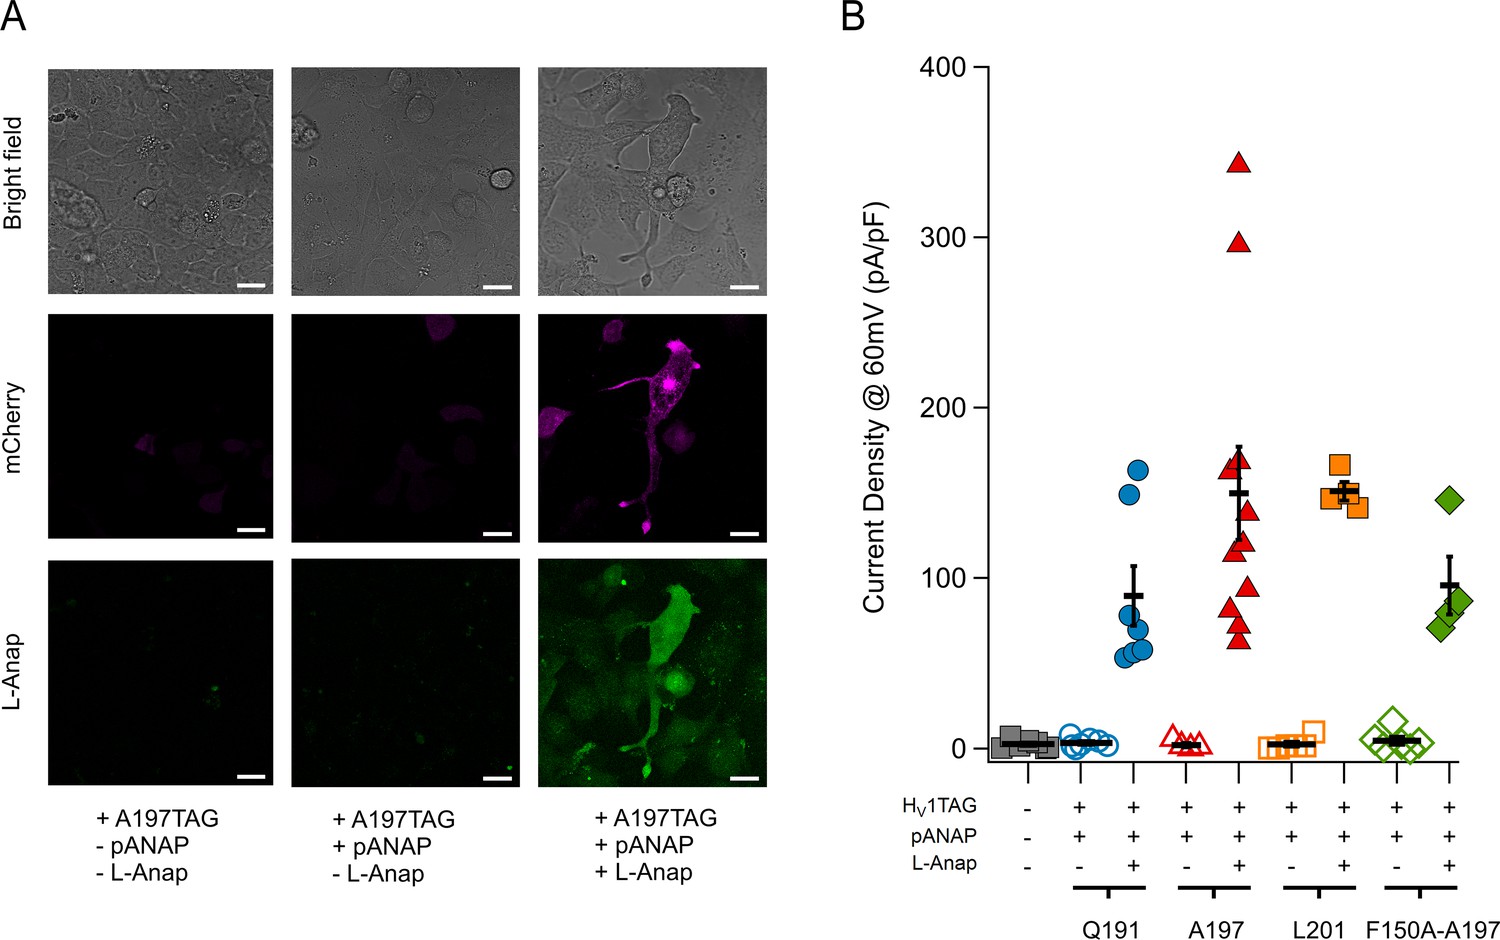
L-Anap incorporation suppresses amber codons inserted in hHV1.
(A) Confocal images of HEK 293 cells in bright-field (top panel), mCherry fluorescence (middle row, magenta), and Anap fluorescence (bottom row, green). Each column shows the same field, and the bottom labels indicate transfection of the HV1-A197TAG plasmid in the presence or absence pAnap plasmid and L-Anap in the culture media. The images were obtained with a Leica TCS SP5 inverted confocal microscope (RRID:SCR_020233 Leica Microsystems, Germany). Fluorescence of mCherry was excited with a He-Ne laser at 543 nm, and the emission was filtered at 580–610 nm, while Anap was excited with a 405 nm laser diode, and the emission was filtered at 415–458 nm. Scale bar = 10 µm. (B) Summary of current density quantification at 60 mV test pulse (ΔpH = 1) in HEK293 cells cotransfected with the hHV1-TAG plasmid in different positions (Q191, blue circles; A197, red triangles; L201, orange squares; F150A-A197, green diamonds) and the pAnap plasmid with (+, filled markers) or without (−, empty markers) L-Anap added to incubation media. Note that the cells that were not incubated with L-Anap presented similar current density as non-transfected cells (gray marks), showing a low probability of non-specific amino acid incorporation. Current density values: non-transfected cells: 2.6±0.98 pA/pF, n=7. HV1-Q191TAG +pAnap: 3.4±1.04 pA/pF (n=7). HV1-Q191TAG + pAnap + L-Anap: 89.7±17.53 pA/pF (n=7). HV1-A197TAG +pAnap: 2.1±1.2 pA/pF (n=4). HV1-A197TAG +pAnap + L-Anap: 149.9±27.42 pA/pF (n=11). HV1-L201TAG +pAnap: 2.6±1.47 pA/pF (n=6). HV1-L201TAG +pAnap + L-Anap: 151.1±5.4 pA/pF (n=4). HV1-F150A-A197TAG +pAnap: 4.6±2.4 pA/pF (n=6). HV1-F150A-A197TAG +pAnap + L-Anap: 95.7±16.98 pA/pF (n=4). Horizontal bars and error bars represent these mean ± SEM values, and markers are individual experiments.
Figure 1—figure supplement 2
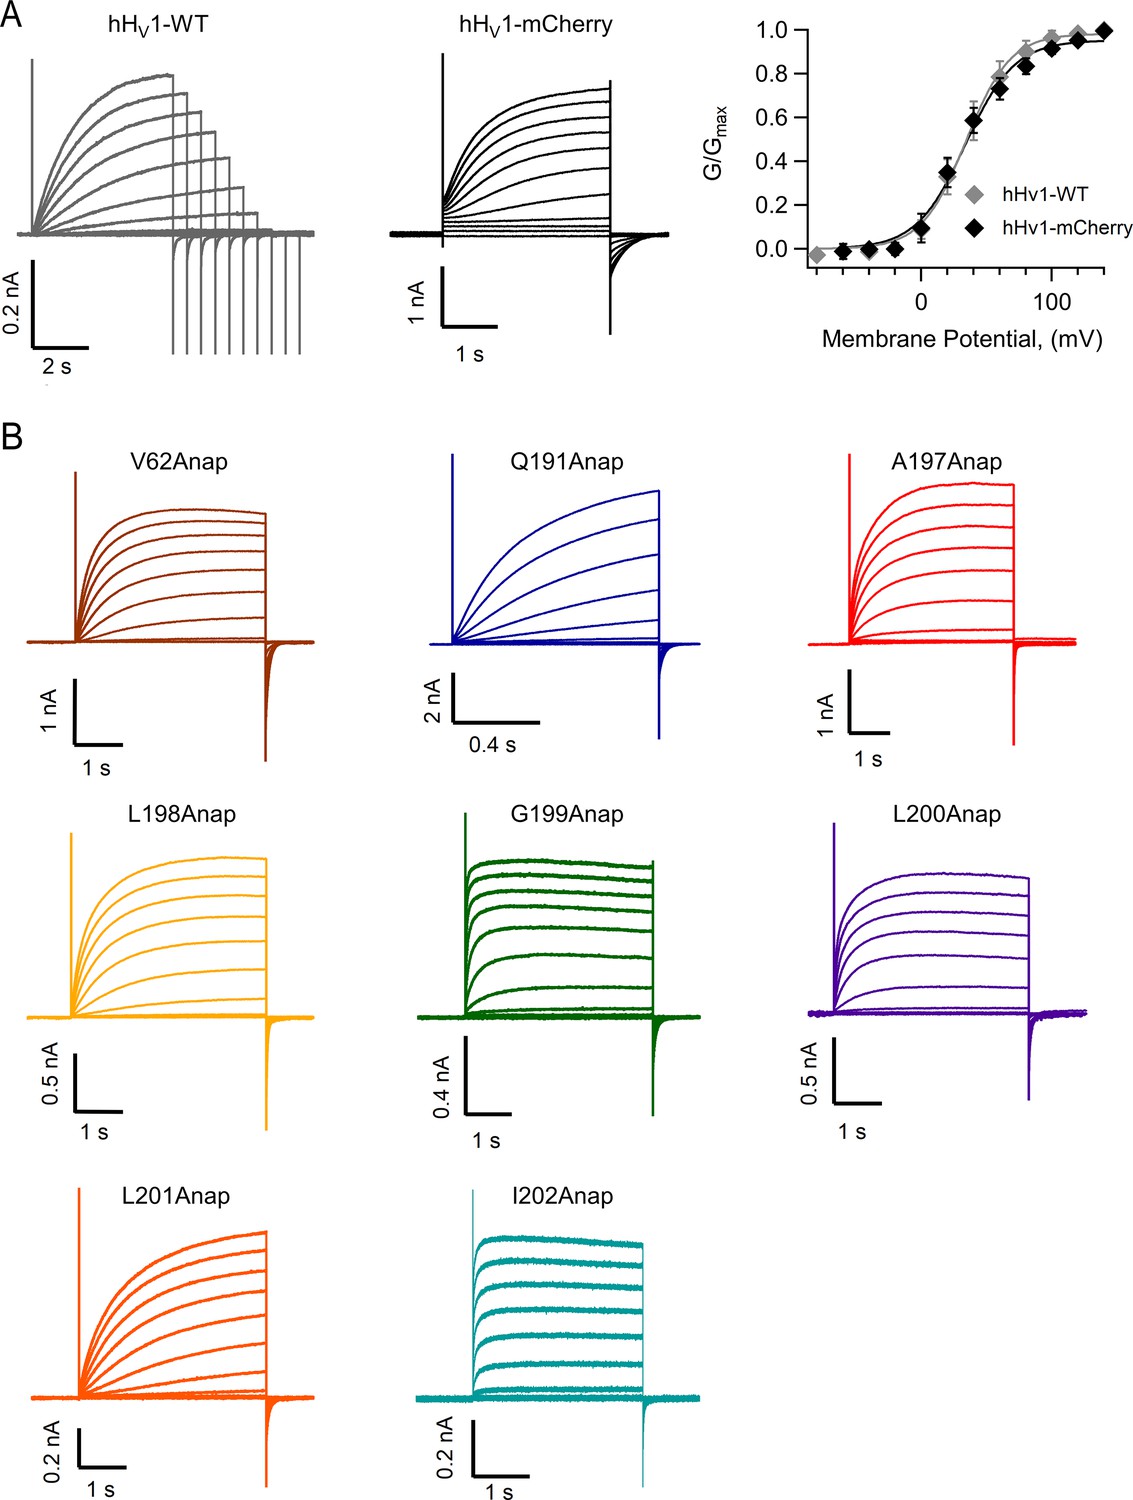
The fusion of mCherry in the C-terminus does not affect channel function and incorporating L-Anap in hHV1 produces functional channels.
(A) Family of currents of hHV1-WT (gray traces, n=4) and hHV1 with the fluorescent protein mCherry attached to channel’s C-terminus (black traces, n=5). The right panel shows the conductance vs. voltage relationship of these two constructs. Notice the similar behavior. (B) Current families of channels incorporating Anap at the indicated position. Each family was obtained with a protocol of voltage pulses from –100 mV to +140 mV in 20 mV steps from a holding potential of –100 mV. AI experiments were performed at a ∆pH = 1. The parameters of the Boltzmann fits are summarized in Supplementary file 1.
Figure 1—figure supplement 3
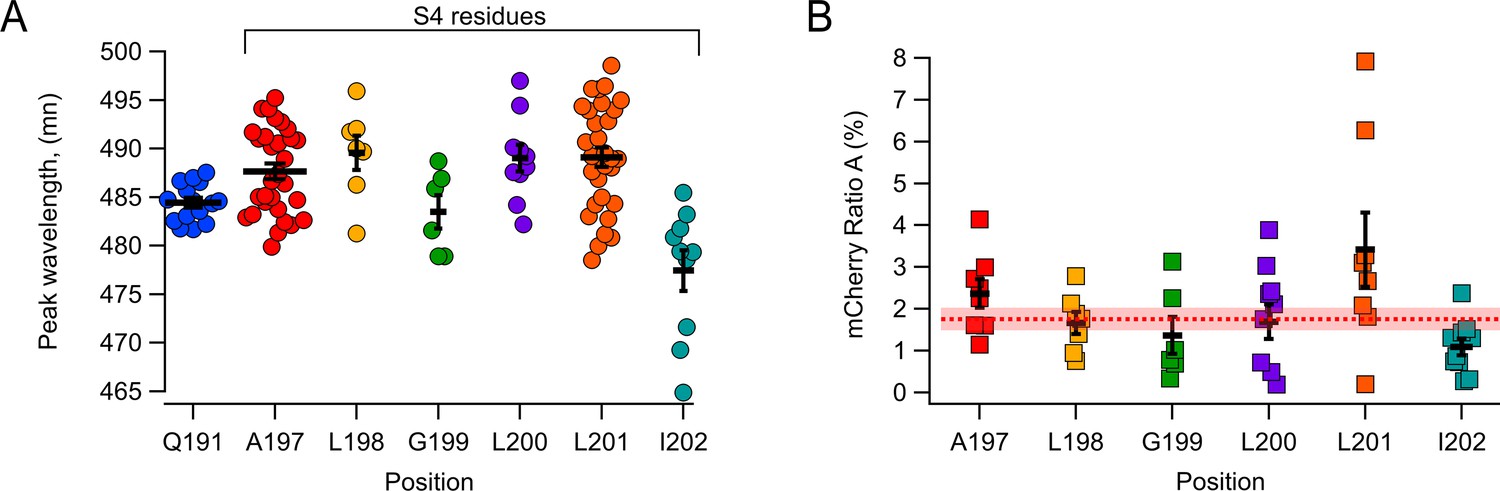
Fluorescence of L-Anap attached at different hHV1 S4 positions.
(A) Measurements of L-Anap emission spectrum peak wavelength incorporated in S3–S4 loop (Q191: 484.4±0.5 nm, n=15), and the sites in extracellular half of S4 studied in this work (A197: 487.7±0.8 nm, n=30; L198: 489.6±1.8 nm, n=7; G199: 483.5±1.7 nm, n=6; L200: 489±1.4 nm, n=10; L201: 489.1±1 nm, n=30; I202: 477.4±2.1 nm, n=10). (B) Quantification of direct excitation (Ratio A) of mCherry emission spectra peak (610 nm) excited by 405 nm laser. Ratio values per position: A197: 2.4 ± 0.3%, n=8; L198: 1.7 ± 0.3%, n=7; G199: 1.4 ± 0.4%, n=6; L200: 1.7 ± 0.4%, n=10; L201: 3.4 ± 0.9%, n=8; I202: 1.1 ± 0.3%, n=10. The horizontal red dotted line is the ratio A of WT-hHV1-mCherry (1.87%), and the shaded area is the SEM. In both figures, the horizontal bars and error bars represent these mean ± SEM values, and markers are individual experiments.
Figure 2 with 1 supplement
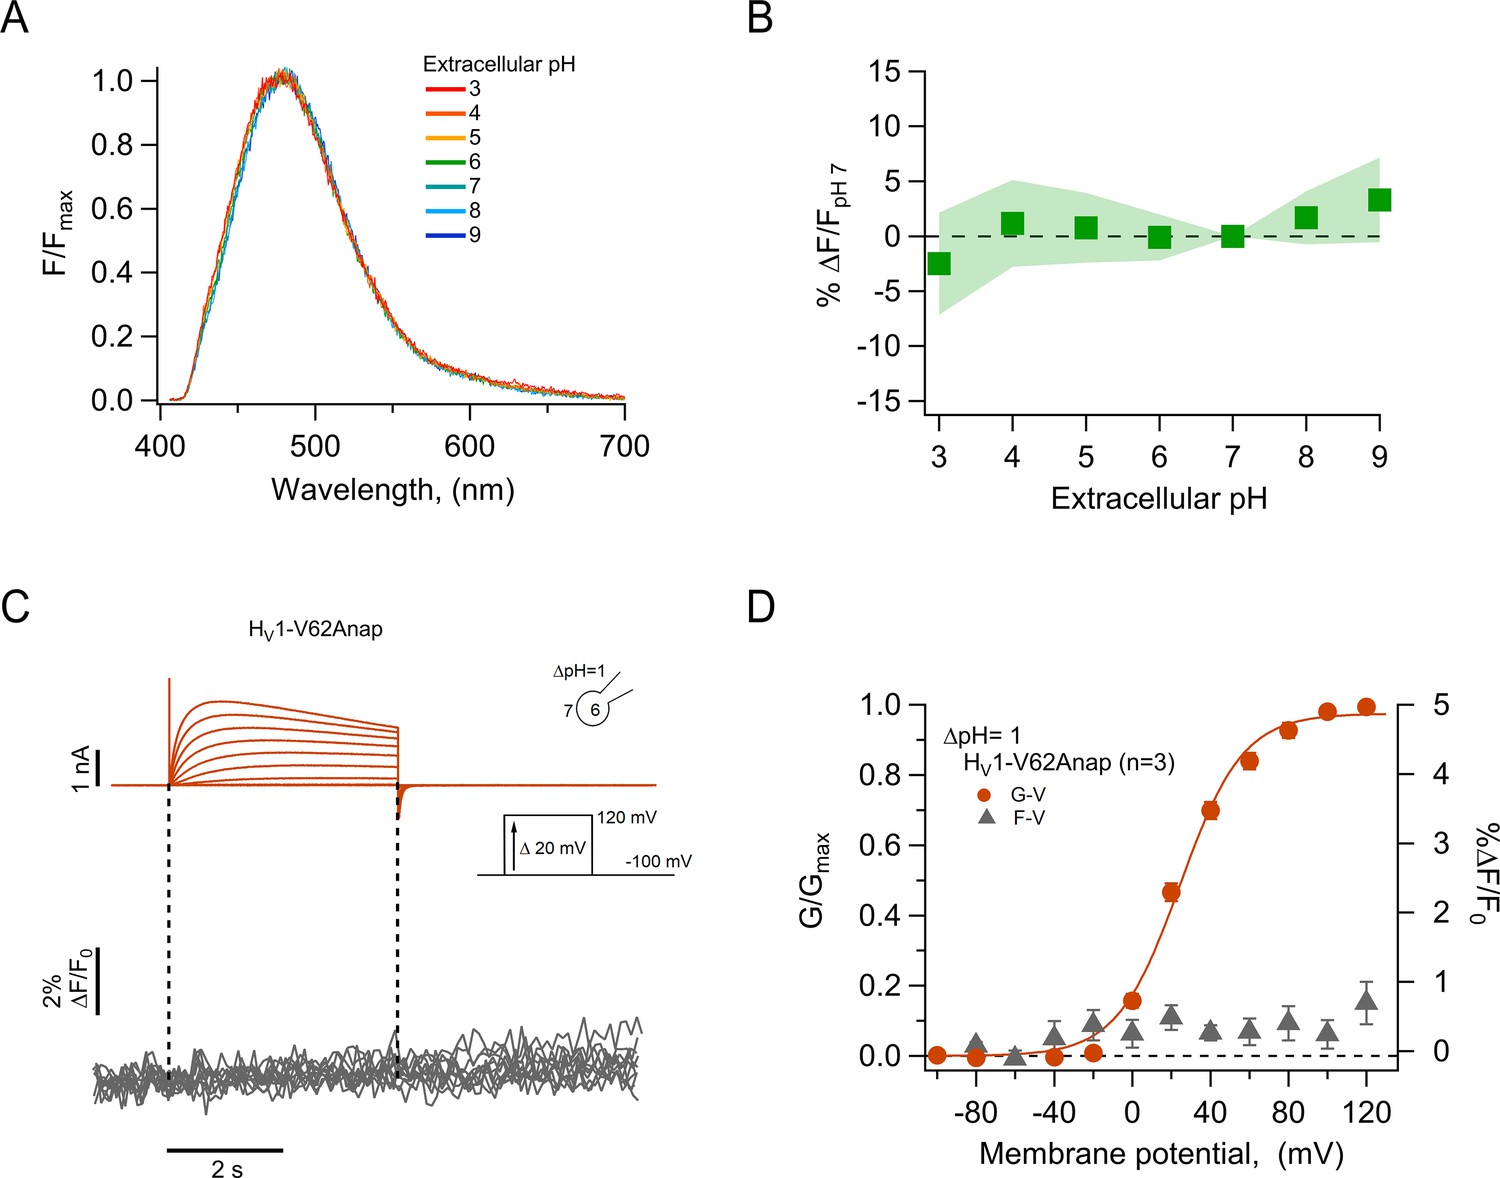
The fluorescence of incorporated Anap is stable to external acidity and local pH changes.
(A) Mean spectra of Anap fluorescence in the hHV1-Q191Anap mutant at each external pH tested (pHo) recorded at the resting potential in non-patched cells. The emission peak of spectra of Anap remained inside the wavelength range of 475–480 nm. (B) Percentage of fluorescence intensity change normalized to fluorescence at pHo 7 in hHV1-Q191Anap mutant (n=13). The intensity was measured from the peak of emission spectra and found not to be significantly different with a two-way ANOVA test that evaluated the brightness at each value of pHo (F-statistic=0.09, degrees of freedom = 6, and p=0.99). (C) Representative patch-clamp fluorometry (PCF) experiments with the hHV1-V62Anap mutant. Currents (upper panel, orange traces) and fluorescent signal (lower panel, gray traces) were elicited in response to voltage pulses from –100 mV to 120 mV in steps of 20 mV. (D) F-V and G-V relationships from the experiments shown in C. Relative fluorescence changes at the end of voltage test pulses are shown in gray triangles, and conductance is shown in orange circles (n=3). The orange continuous line is the fit to equation 1 of G-V data (fit parameters: V0.5=24.4 ± 1.6 mV; q=1.5 ± 0.1 e0). Data in B and D are mean ± SEM.
-
Figure 2—source data 1
Data for each experiment and summary data for Figure 2.
- https://cdn.elifesciences.org/articles/85836/elife-85836-fig2-data1-v2.xlsx
Figure 2—figure supplement 1
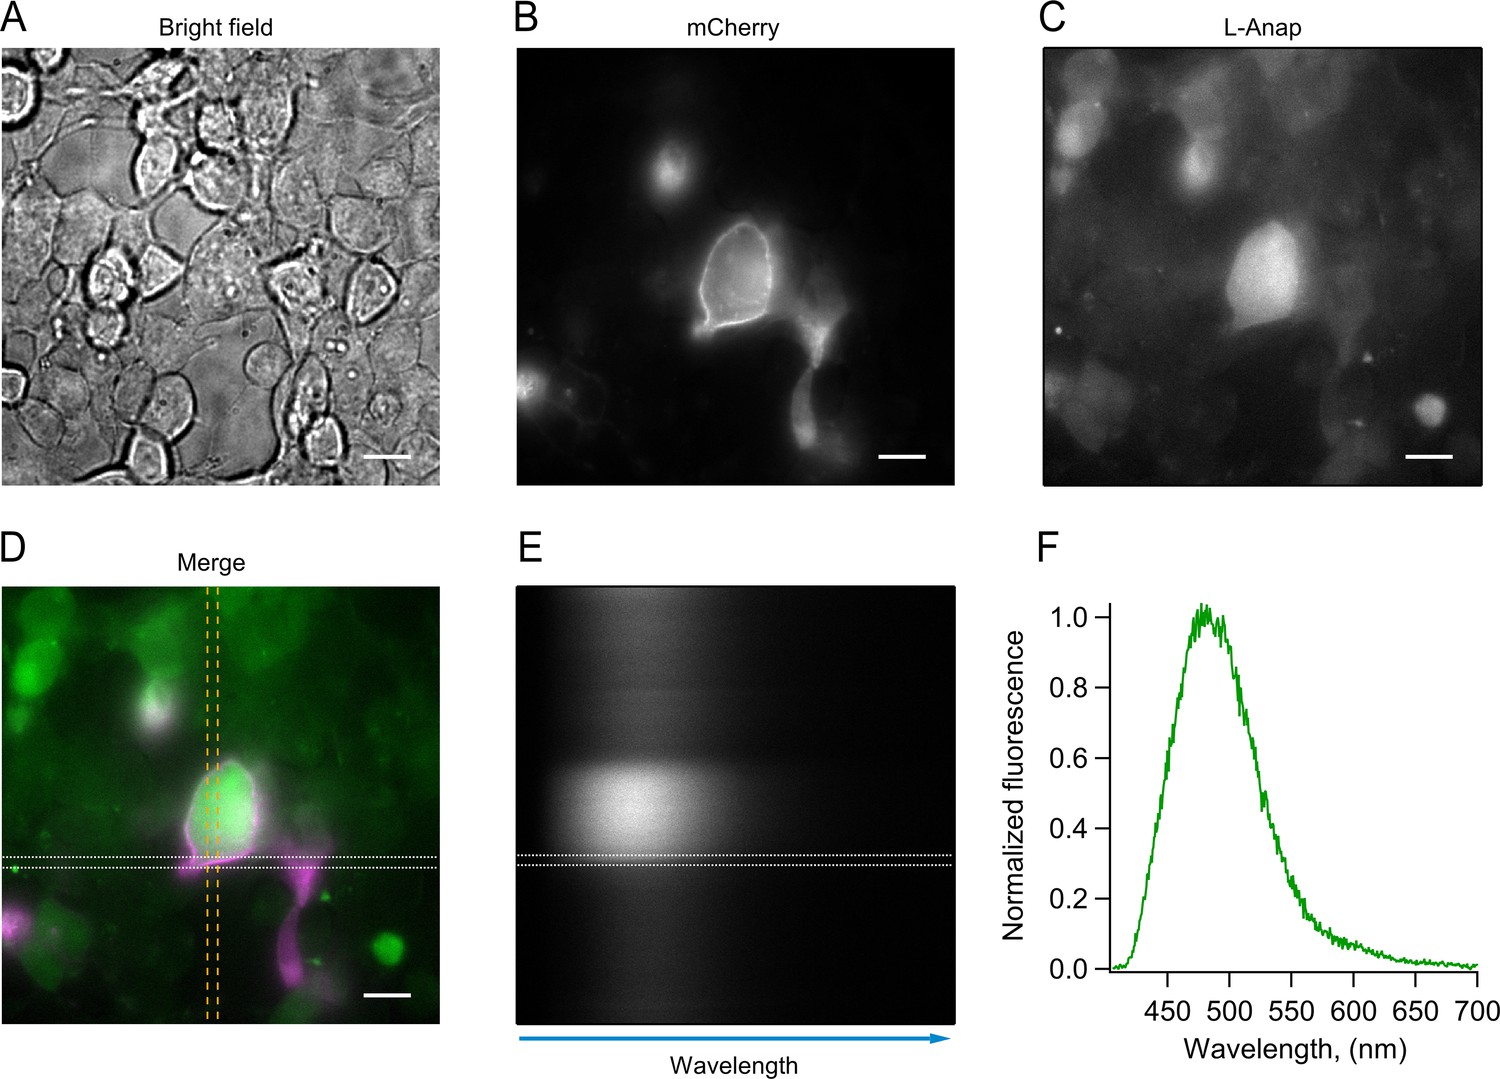
Procedure for Anap spectrum measurement in cells subjected to L-Anap incorporation conditions (pAnap +HV1 TAG+L Anap).
The HEK293 cell to be recorded is chosen in the bright field (A) and exciting the fluorescent signal of mCherry (B) at 514 nm. When the L-Anap fluorescence is confirmed, exciting the cell at 405 nm (C), a portion of the cellular membrane is isolated with the spectrograph slit (D, discontinuous vertical yellow lines; mCherry signal in magenta; L-Anap signal in green). The spectrograph scatters the L-Anap light that goes through this slit (E), producing a spectral image, and a line scan is performed (white discontinuous horizontal lines in E and D) from the membrane identified by mCherry fluorescence. The fluorescence intensity measured in this scan is presented in F. Scale bar = 10 µM.
Figure 3 with 1 supplement
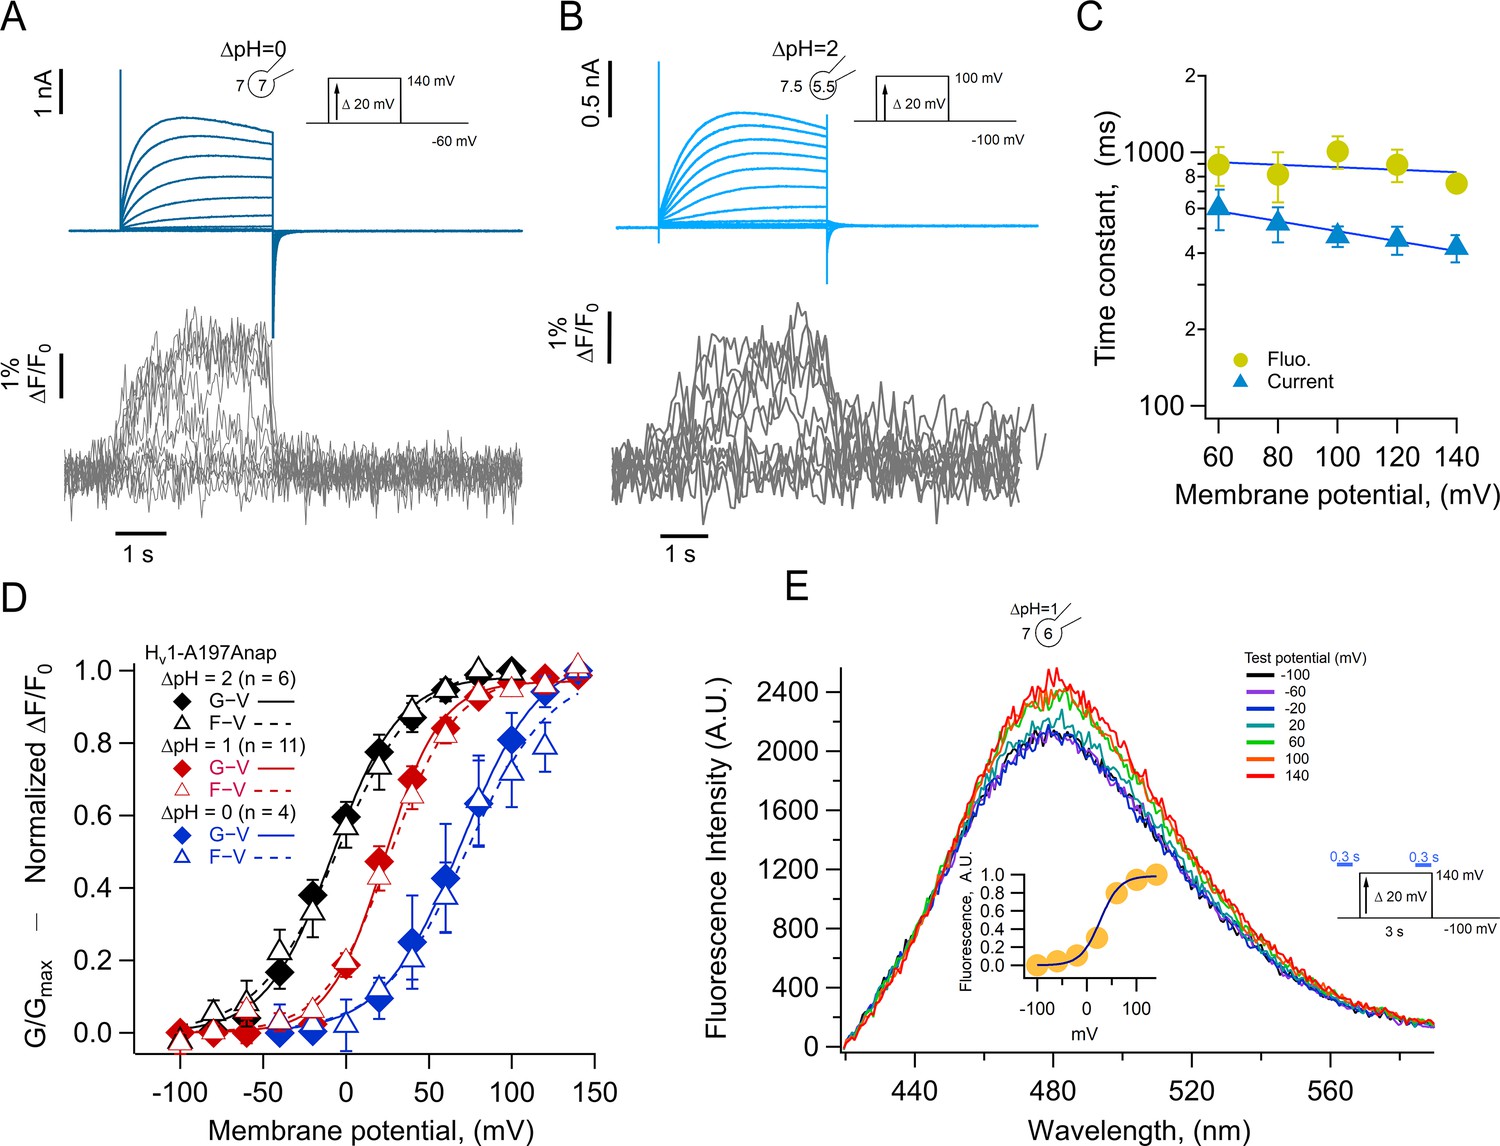
Anap incorporation in position A197 reveals that the movement of S4 is modulated by ΔpH.
(A–B) Representative patch-clamp fluorometry (PCF) experiment with A197Anap at ΔpH = 0 and ΔpH = 2, respectively. Proton current families (upper panels) are shown in blue traces and fluorescent Anap signal (lower panel) in gray traces. (C) Activation time constant of current (blue) and fluorescent (lemon) signals at ΔpH = 0 obtained by fitting Equation 3 (n=3). The dark blue curve shows the exponential fit to Equation 4. The fit parameters were: τ(0)=976ms and q=–0.03 e0 for fluorescence and 768 ms and –0.12 e0 for current. (D) F-V (empty triangles) and G-V (filled diamonds) curves and different ΔpH values (ΔpH = 0 in blue, n=4; ΔpH = 1 in red, n=11; ΔpH = 2 in black, n=6). The data were fit to Equation 1 (G-V, continuous curves; F-V, discontinuous curves) with the following parameters: ∆pH = 0; F-V: V0.5=72.7 ± 6 mV; q=1.0 ± 0.1 e0. G-V: V0.5=69.6 ± 1.5 mV; q=1.1 ± 0.1 e0. ∆pH = 1; F-V: V0.5=26.6 ± 1.5 mV; q=1.3 ± 0.1 e0. G-V: V0.5=23.4 ± 1.3 mV; q=1.5 ± 0.1 e0. ∆pH = 2; F-V: V0.5=–4.5 ± 1.7 mV; q=1.0 ± 0.1 e0. G-V: V0.5=–8.1 ± 2.6 mV; q=1.2 ± 0.1 e0. (E) Emission spectra of Anap in the A197Anap mutant obtained in steady-state (300 ms at the end of holding potential and the end of the test pulse, green bars in the inset) in response to different voltages (color code indicates the test pulse in mV: purple, –60; dark blue, –40; light blue, 20; cyan, 0; light green, 20; dark green, 40; olive, 60; yellow, 80; orange, 100; dark red, 120; red, 140). The inset plots the amplitude of the emission peak as a function of test voltage. The smooth curve is the fit of the fluorescence data at ΔpH = 1 shown in panel D. Summary data shown in C and D are mean ± SEM.
-
Figure 3—source data 1
Data for each experiment and summary data for Figure 3C, D and E.
- https://cdn.elifesciences.org/articles/85836/elife-85836-fig3-data1-v2.xlsx
Figure 3—figure supplement 1
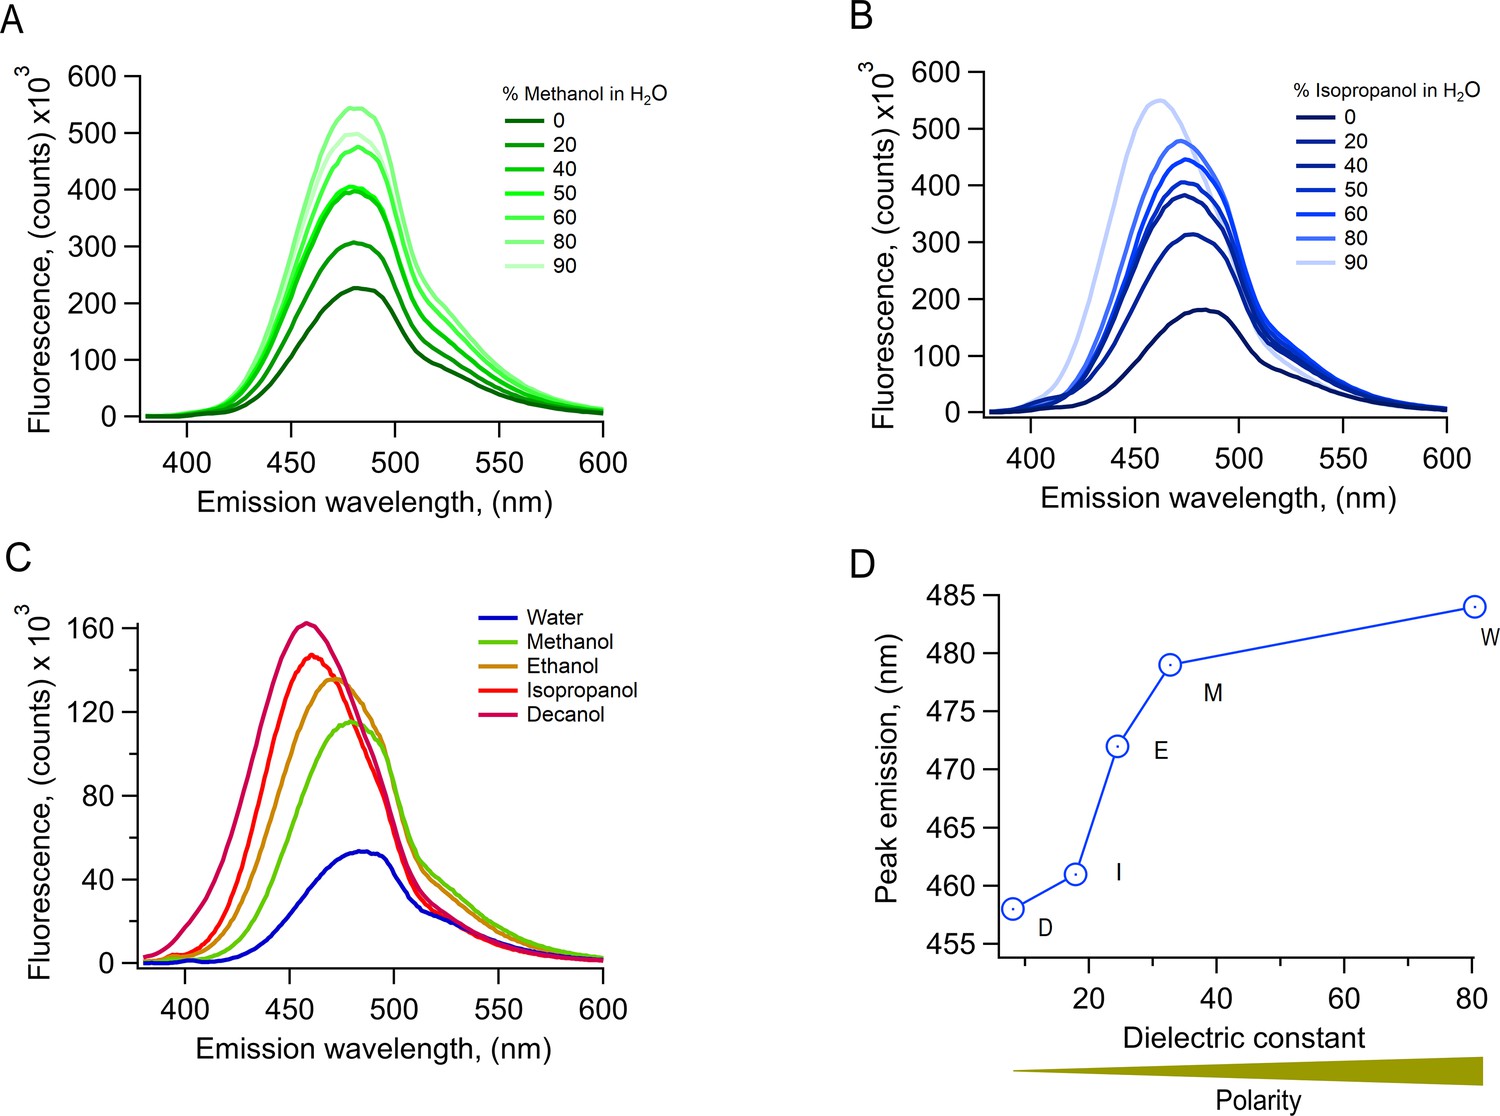
Properties of L-Anap fluorescence in solutions of solvents of different polarities.
(A) Emission spectrum of L-Anap in methanol-water mixtures. The percentage of methanol is indicated in the figure. Increasing methanol concentrations increase the fluorescence intensity and produce a blue shift in the peak emission wavelength. (B) Emission spectrum of L-Anap in isopropanol-water mixtures. As with methanol, the percentage of isopropanol is indicated in the figure. Increasing concentrations of isopropanol also increase fluorescence intensity and a more evident blue shift in the peak emission wavelength. (C) Comparison of emission spectra of L-Anap in pure solvents. Lower polarity solvents produce an increased fluorescence intensity. (D) The peak emission wavelength of L-Anap obtained from spectra as in C is red-shifted at higher dielectric constants (higher polarity). All spectra were measured in a UV-VIS spectrofluorometer (PC1, ISS, USA). The excitation wavelength was 360 nm.
Figure 4 with 1 supplement
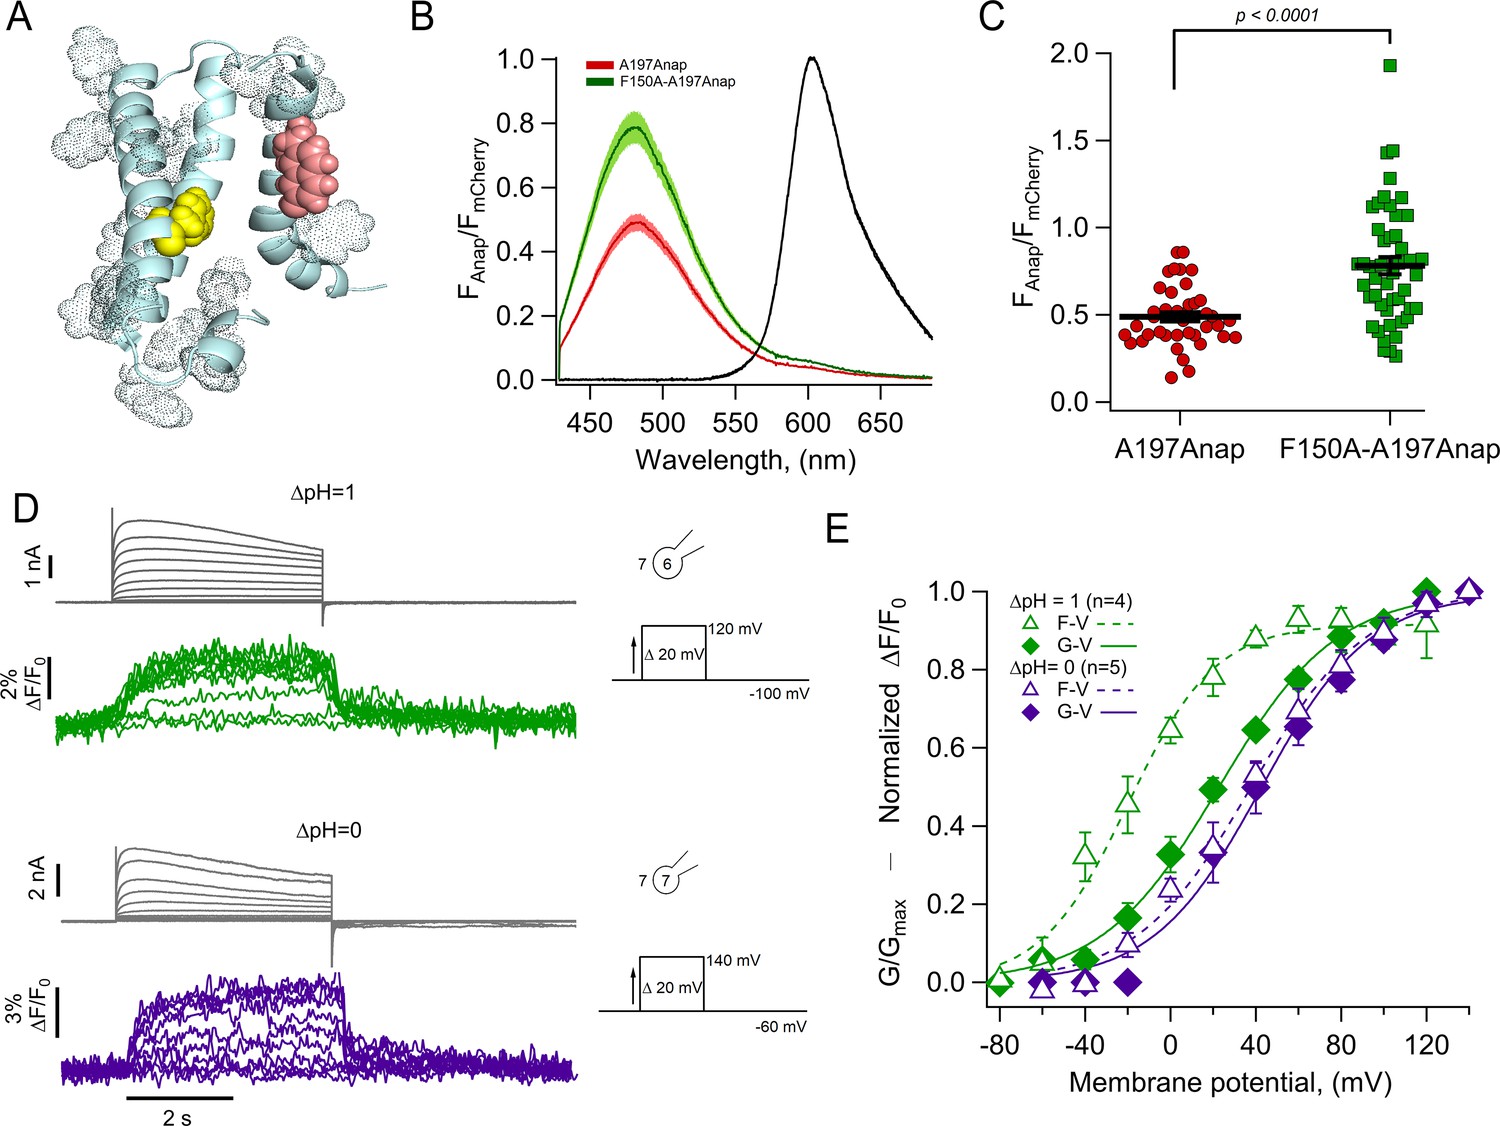
The charge transfer center (F150) is an Anap quencher.
(A) Cartoon showing the presence of aromatic residues in hHV1 (rendered as space-filling dots, main chain in light blue, S3 was removed for illustration). F150 in yellow and Anap in pink. (B) Averages of spectra of Anap incorporated in both mutants (HV1-A197Anap, red; HV1-F150A-A197Anap, green) normalized to the fluorescence of mCherry (black). Spectra were obtained at the resting potential in non-patched cells. The double mutant’s brightness is approximately 60% higher. Shadows represent SEM. (C) Comparison of the intensity of the emission spectrum peak of Anap normalized to the intensity of the fluorescent protein mCherry between the mutant HV1-A197Anap-Cherry (0.49±0.03) and double mutant HV1-F150A-A197Anap-Cherry (0.79±0.05), taken at 48 hr post-transfection. Each point indicates an individual spectrum measured from a single cell; n=41 and 49, respectively. Black horizontal lines are the mean ± SEM. Unpaired Student’s t-test with Welch’s correction: T-statistic=5.2, degrees of freedom = 71.18, and p=1.6 × 10⁻⁶. (D) Representative current and fluorescence traces from patch-clamp fluorometry (PCF) experiments of the double mutant HV1-F150A-A197Anap at ∆pH = 1 (upper panel) and ∆pH = 0 (lower panel). (E) Comparison of G-V (diamonds) and F-V (triangles) relationship between both ∆pH conditions (∆pH = 1 in green, n=4; ∆pH = 0 in purple, n=5) of the double mutant HV1-F150A-A197Anap. F-V curve of HV1-F150A-A197Anap at ∆pH = 0 is shifted negatively around 58 mV compared to ∆pH = 1. Boltzmann fit parameters of HV1-F150A-A197Anap were: ∆pH = 1 F-V: V0.5=−19.8 ± 2.7 mV; q=1.2 ± 0.1 e0; G-V: V0.5=22.7 ± 2.3 mV; q=0.9 ± 0.1 e0. ∆pH = 0 F-V: V0.5=38.0 ± 3.0 mV; q=0.9 ± 0.1 e0; G-V: V0.5=42.6 ± 3.8 mV; q=1.0 ± 0.1 e0. Data shown in B, C, and E are mean ± SEM.
-
Figure 4—source data 1
Data for each experiment and summary data for Figure 4B, C and E.
- https://cdn.elifesciences.org/articles/85836/elife-85836-fig4-data1-v2.xlsx
Figure 4—figure supplement 1
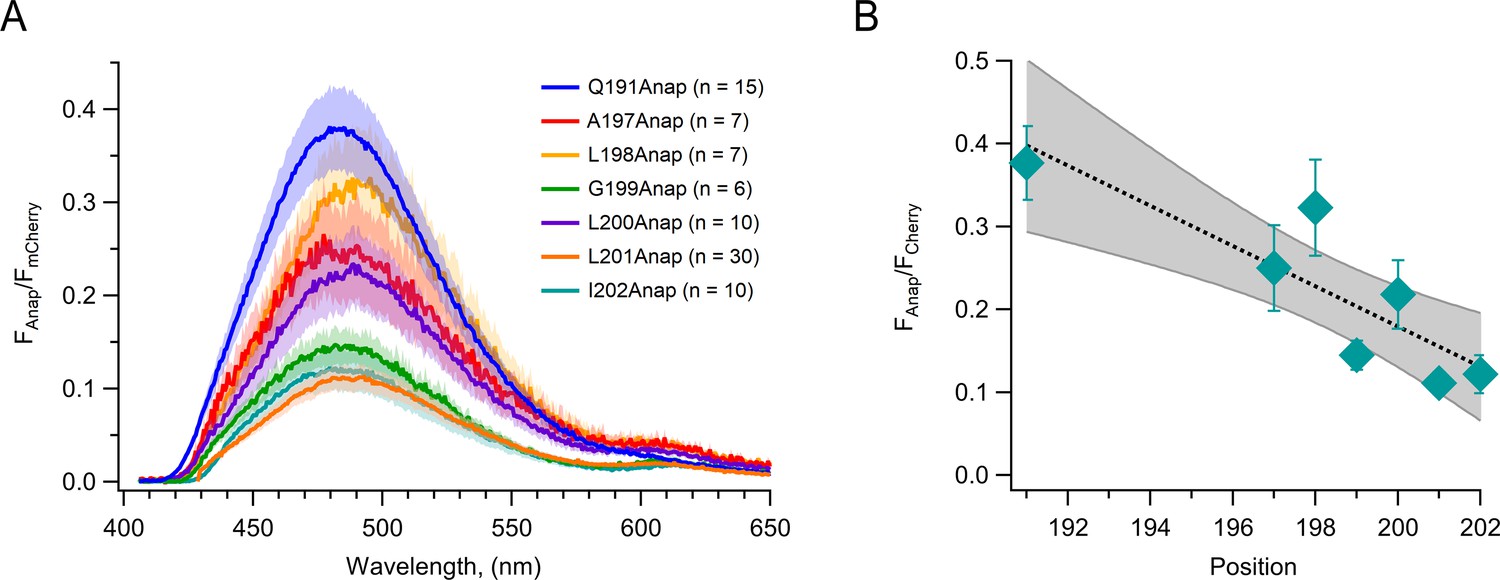
The fluorescence of Anap is diminished as it is incorporated in residues closer to the center of the S4 segment.
(A) Fraction of Anap fluorescence in relation to mCherry fluorescence determined from emission spectra. Data are averaged spectra; the shaded regions are ± SEM. (B) The Anap/mCherry fluorescence ratio measured at the peak emission wavelength for each construct as a function of incorporation site position. The dotted line is a linear fit, and the shaded area is the 96% CI. Data are mean ± SEM.
Figure 5 with 2 supplements
The kinetics of fluorescent signal during deactivation are strongly modulated by pH.
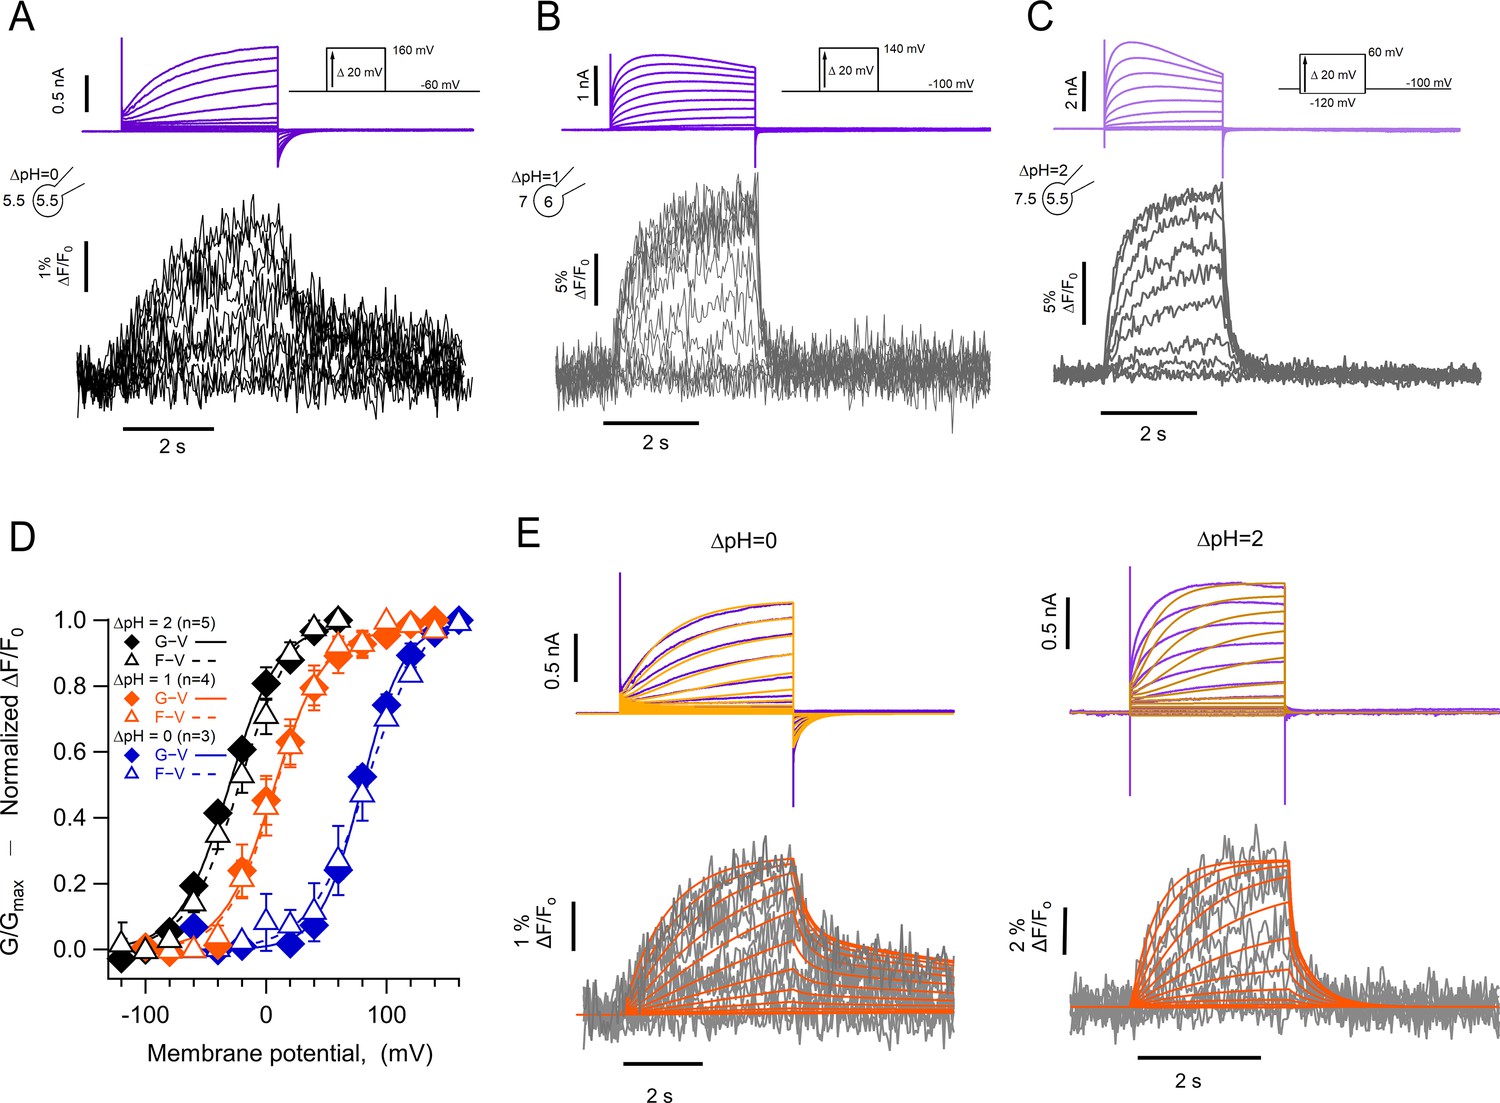
Representative patch-clamp fluorometry (PCF) experiments with the hHV1-L201Anap mutant at: (A) ∆pH = 0. (B) ∆pH = 1. (C) ∆pH = 2. Current families are shown in the upper panel (purple traces) and fluorescent signals in the lower panel (black and gray traces). (D) G-V (filled diamonds) and F-V (empty triangles) relationships at ∆pH = 0 (blue markers, n=3), ∆pH = 1 (orange markers, n=4), and ∆pH = 2 (black markers, n=5) of mutant hHV1-L201Anap. Data are mean ± SEM. Note that the difference between the activation at ∆pH = 1 and ∆pH = 0 is around 77 mV/∆pH unit. Boltzmann fit parameters: ∆pH = 0, F-V; V0.5=84.6 ± 2.1 mV, q=1.0 e0 ±0.1. G-V; V0.5=79.7 ± 1.8 mV, q=1.4 ± 0.1 e0. ∆pH = 1, F-V; V0.5=7.7 ± 1.6 mV, q=1.2 ± 0.1 e0. G-V: V0.5=6.3 ± 2.2 mV; q=1.2 ± 0.1 e0. ∆pH = 2, F-V: V0.5=–21.1 ± 2.3 mV; q=1.1 ± 0.1 e0. G-V: V0.5=–30.6 ± 2.1 mV; q=1.2 ± 0.1 e0. (E) Comparison of the current and fluorescence at two values of ∆pH with the predictions of the sequential activation model in Scheme 1. Experimental current and fluorescence traces are color coded as in (A). Simulated current traces are mustard colored, and fluorescence traces are orange. Simulation parameters can be found in Supplementary file 2. Source code files: DefinitionSchemeI_Fig5E.ipf and ProcedureToSimulateFig5E.ipf.
-
Figure 5—source code 1
Definition of equations for scheme I.
- https://cdn.elifesciences.org/articles/85836/elife-85836-fig5-code1-v2.zip
-
Figure 5—source code 2
Code to simulate current and fluorescence from scheme I.
- https://cdn.elifesciences.org/articles/85836/elife-85836-fig5-code2-v2.zip
-
Figure 5—source data 1
Data for each experiments and summary data for Figure 5D.
- https://cdn.elifesciences.org/articles/85836/elife-85836-fig5-data1-v2.xlsx
Figure 5—figure supplement 1
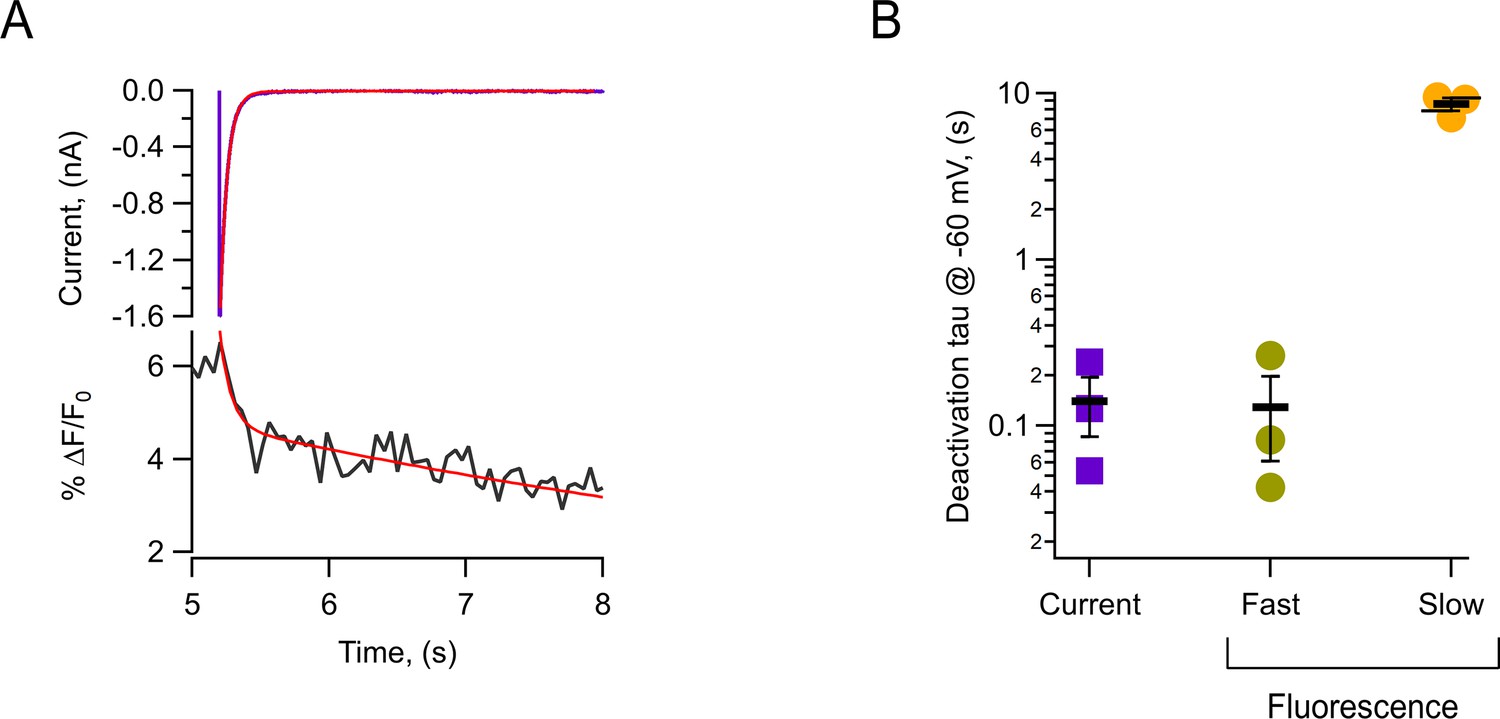
Kinetics of the OFF-fluorescence signals from HV1-L201Anap channels.
(A) Tail current (purple trace) with a superimposed exponential fit (red). Simultaneous fluorescence decay signal (black) with a double exponential fit (red). Both recordings were obtained at –60 mV after a test pulse to 160 mV and a ∆pH = 0 (pHi = 5.5/pHo = 5.5). (B) Summary of time constants obtained from traces as in (A). The horizontal bars and error bars represent mean ± SEM values, and markers are individual experiments.
Figure 5—figure supplement 2
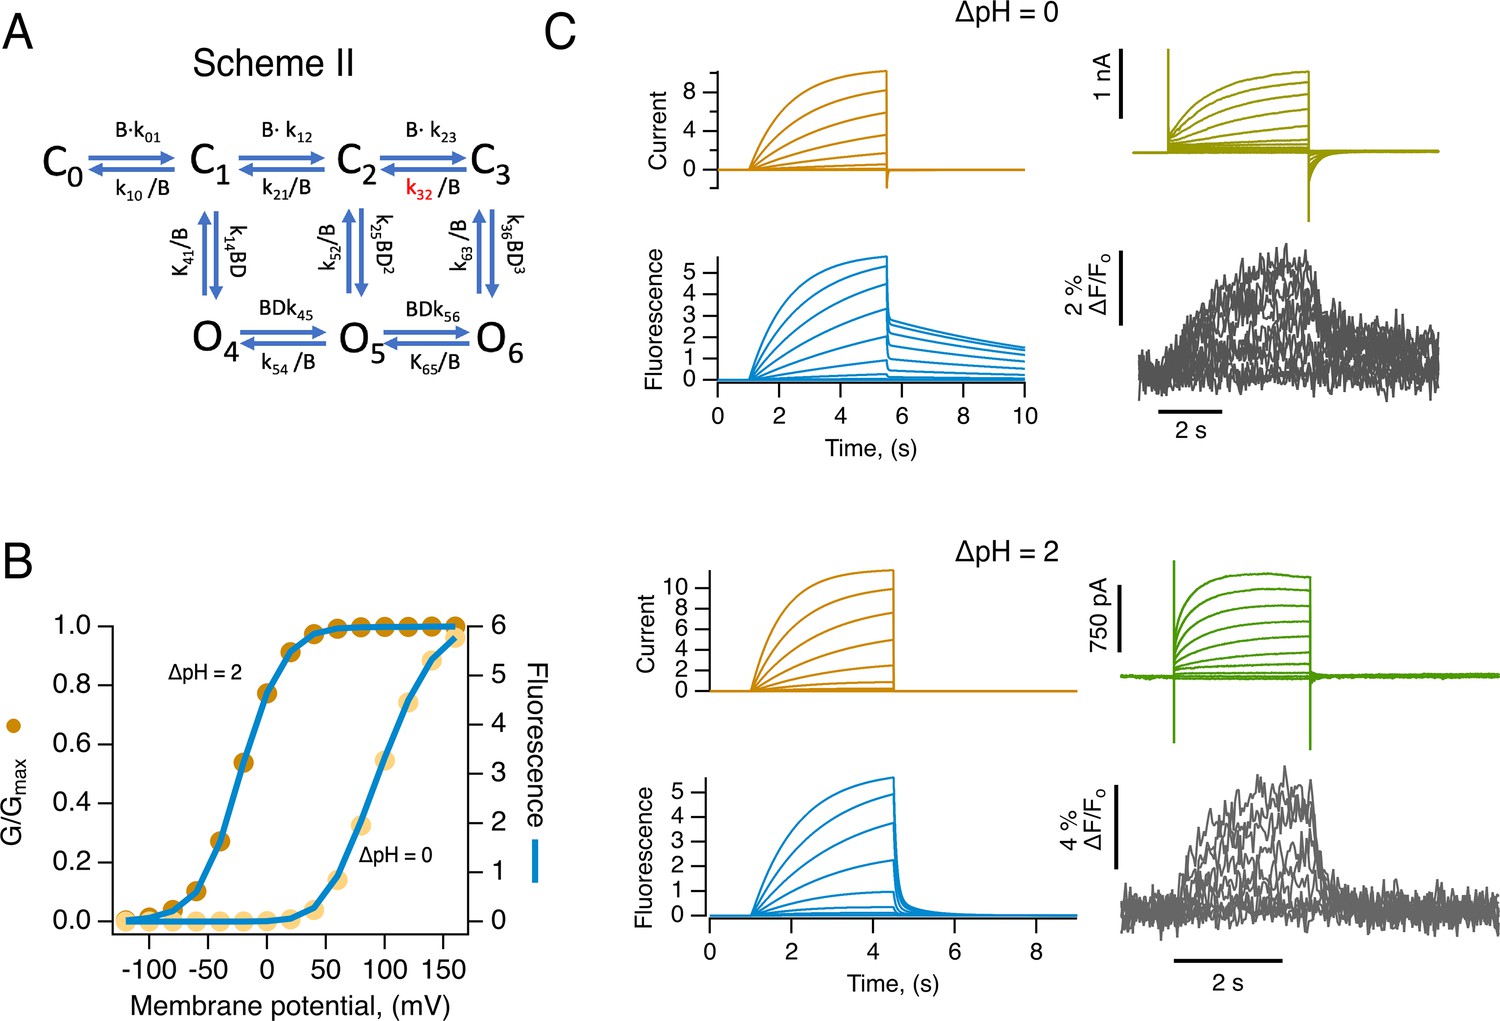
An allosteric model can explain the kinetics and voltage-dependence of fluorescence and conductance.
(A) Allosteric model of HV1 activation by voltage. The kij’s are rate constants, and D is an allosteric coupling factor for channel opening. (B) is an empirical factor that accounts for the pH-dependence of the rate constants. In this model, channel opening can occur without full voltage-sensor movement. The closing rate constant indicated in red has a value much smaller than all others (at 0 mV) and is responsible for the slow return of the fluorescence signal upon repolarization. (B) Simulation comparing the steady-state conductance and fluorescence as a function of voltage. In this mechanism, fluorescence appears at the same voltages as conductance since channel opening can occur from early closed states, and currents can flow without full-voltage sensor activation. (C) Comparison of simulated currents (orange traces) and fluorescence signals (blue traces) with experimentally recorded currents (green) and fluorescence (gray) at the two indicated values of ∆pH, using the parameters given in Supplementary file 3. Source code files: DefinitionSchemeII_Fig5-Sup2.ipf andProcedureToSimulate_Figure ig5_Sup2.ipf.
-
Figure 5—figure supplement 2—source code 1
Definition of equations for scheme II.
- https://cdn.elifesciences.org/articles/85836/elife-85836-fig5-figsupp2-code1-v2.zip
-
Figure 5—figure supplement 2—source code 2
Code to simulate current and fluorescence from scheme II.
- https://cdn.elifesciences.org/articles/85836/elife-85836-fig5-figsupp2-code2-v2.zip
Scheme 1
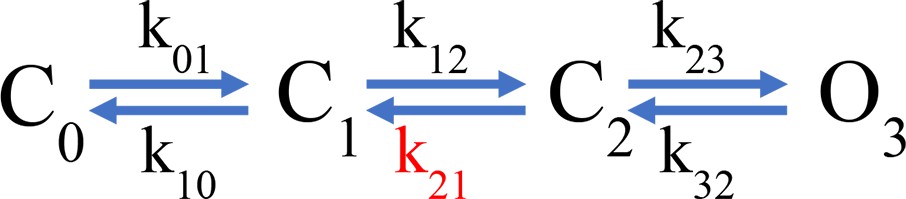
Simple gating scheme.
Figure 6
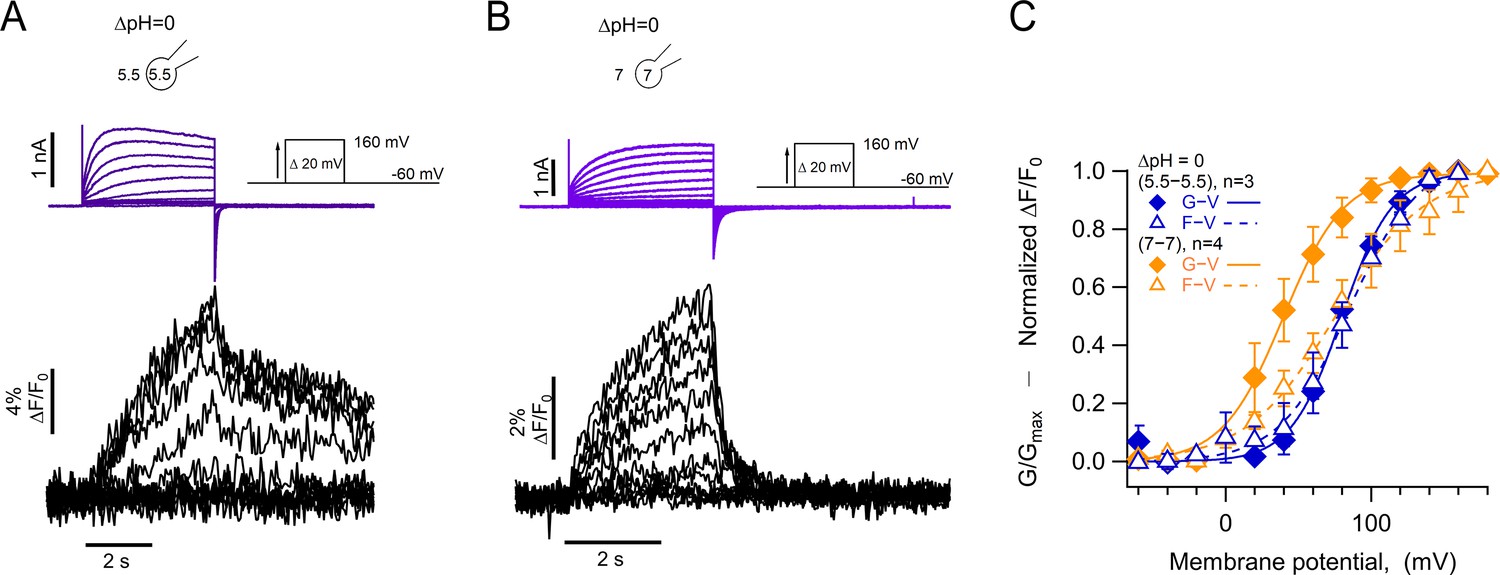
Absolute pH values are gating determinants in hHV1-L201Anap.
(A) Representative patch-clamp fluorometry (PCF) experiment at ∆pH = 0 (5.5o-5.5i). Currents are purple and fluorescence black. (B) Similar experiment to (A) with ∆pH = 0 (7o-7i). Current and fluorescence traces are color coded as in (A). (C) G-V (filled diamonds) and F-V (empty triangles) curves at ∆pH = 0 but with different absolute pH values (pHo/pHi = 5.5/5.5 in blue n=3; pHo/pHi = 7/7 in orange, n=4). Boltzmann fit parameters were pHo/pHi = 7/7 F-V: V0.5=75.3 ± 2.2 mV; q=0.8 ± 0.04 e0. G-V: V0.5=39.6 ± 1.3 mV; q=1.2 ± 0.1 e0. pHo/pHi = 5.5/5.5 F-V: V0.5=84.6 ± 2.1 mV; q=1.0 e0 ±0.1. G-V: V0.5=79.7 ± 1.8 mV; q=1.4 ± 0.1 e0. Data are mean ± SEM.
-
Figure 6—source data 1
Data for each experiment and summary data for Figure 6C.
- https://cdn.elifesciences.org/articles/85836/elife-85836-fig6-data1-v2.xlsx
Additional files
-
Supplementary file 1
Boltzmann equation fit parameters of each mutant at ∆pH = 1 (equation 1).
- https://cdn.elifesciences.org/articles/85836/elife-85836-supp1-v2.xlsx
-
Supplementary file 2
Parameters used in the fits to the data in Figure 5D of the model in Scheme 1.
Parameters with values labeled in bold indicate that these are ∆pH dependent.
- https://cdn.elifesciences.org/articles/85836/elife-85836-supp2-v2.xlsx
-
Supplementary file 3
Parameters used in the simulations with Scheme II shown in Figure 5—figure supplement 2.
Parameter with values labeled in bold indicate that these are ∆pH dependent.
- https://cdn.elifesciences.org/articles/85836/elife-85836-supp3-v2.xlsx
-
MDAR checklist
- https://cdn.elifesciences.org/articles/85836/elife-85836-mdarchecklist1-v2.docx
Download links
A two-part list of links to download the article, or parts of the article, in various formats.
Downloads (link to download the article as PDF)
Open citations (links to open the citations from this article in various online reference manager services)
Cite this article (links to download the citations from this article in formats compatible with various reference manager tools)
Activation-pathway transitions in human voltage-gated proton channels revealed by a non-canonical fluorescent amino acid
eLife 12:e85836.
https://doi.org/10.7554/eLife.85836


