Oxytocin administration enhances pleasantness and neural responses to gentle stroking but not moderate pressure social touch by increasing peripheral concentrations
- The Clinical Hospital of Chengdu Brain Science Institute, MOE Key Laboratory for NeuroInformation, Center for Information in Medicine, University of Electronic Science and Technology of China, China
- School of Educational Sciences, Chongqing Normal University, China
- West China School of Pharmacy, Sichuan University, China
Figures
Figure 1 with 1 supplement
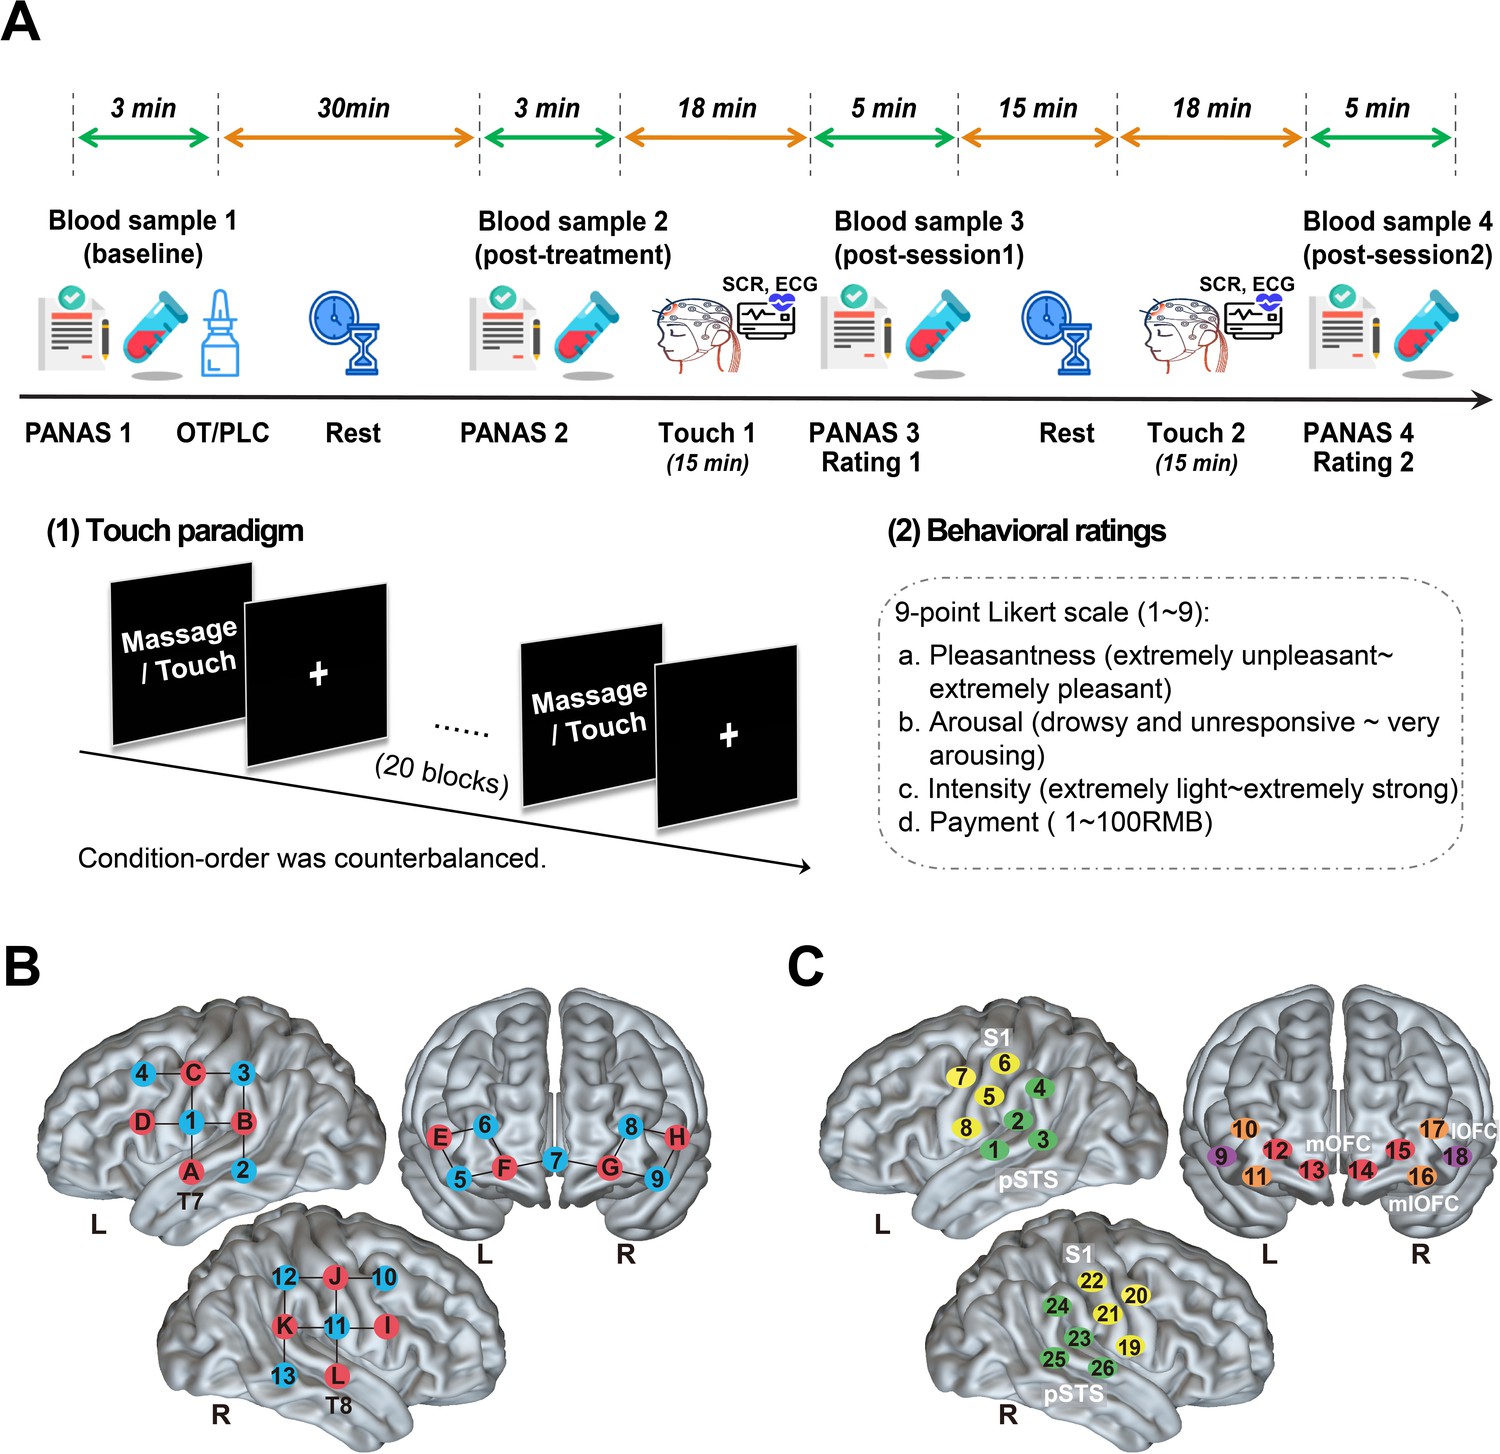
The study procedure and layout of fNIRS optodes and channels.
(A) The study protocol and sequences of the experimental task. A total of four blood samples (6 ml for each) were collected for each subject before and after the treatment and after each session to measure OT concentration changes. Subjects completed the positive and negative affective schedule (PANAS) before and after the intranasal/oral OT or PLC treatment. During each touch session, neural responses were acquired using functional near-infrared spectroscopy (fNIRS) measures and physiological measures of autonomic nervous system changes including the skin conductance response - SCR and the electrocardiogram - ECG were recorded as well. Subjects were subsequently asked to rate their mood (PANAS) and subjective experience of the massage/touch including the perceived pleasantness, arousal, intensity, and willingness to payment after each session. (B) The array design displayed the locations of the sources (red) and detectors (blue). (C) Channels according to the international 10–20 placement system. A 26-channel array consisting of 12 sources and 13 detectors were used to record hemodynamic activity of the bilateral lateral orbitofrontal cortex (lOFC: channels 9, 18), medial orbitofrontal cortex (mOFC: channels 12–15) and mediolateral orbitofrontal cortex (mlOFC: channels 10, 11, 16, 17), posterior superior temporal sulcus (pSTS: channels 1–4, 23–26) and the somatosensory area (S1: channels 5–8, 19–22).
Figure 1—figure supplement 1
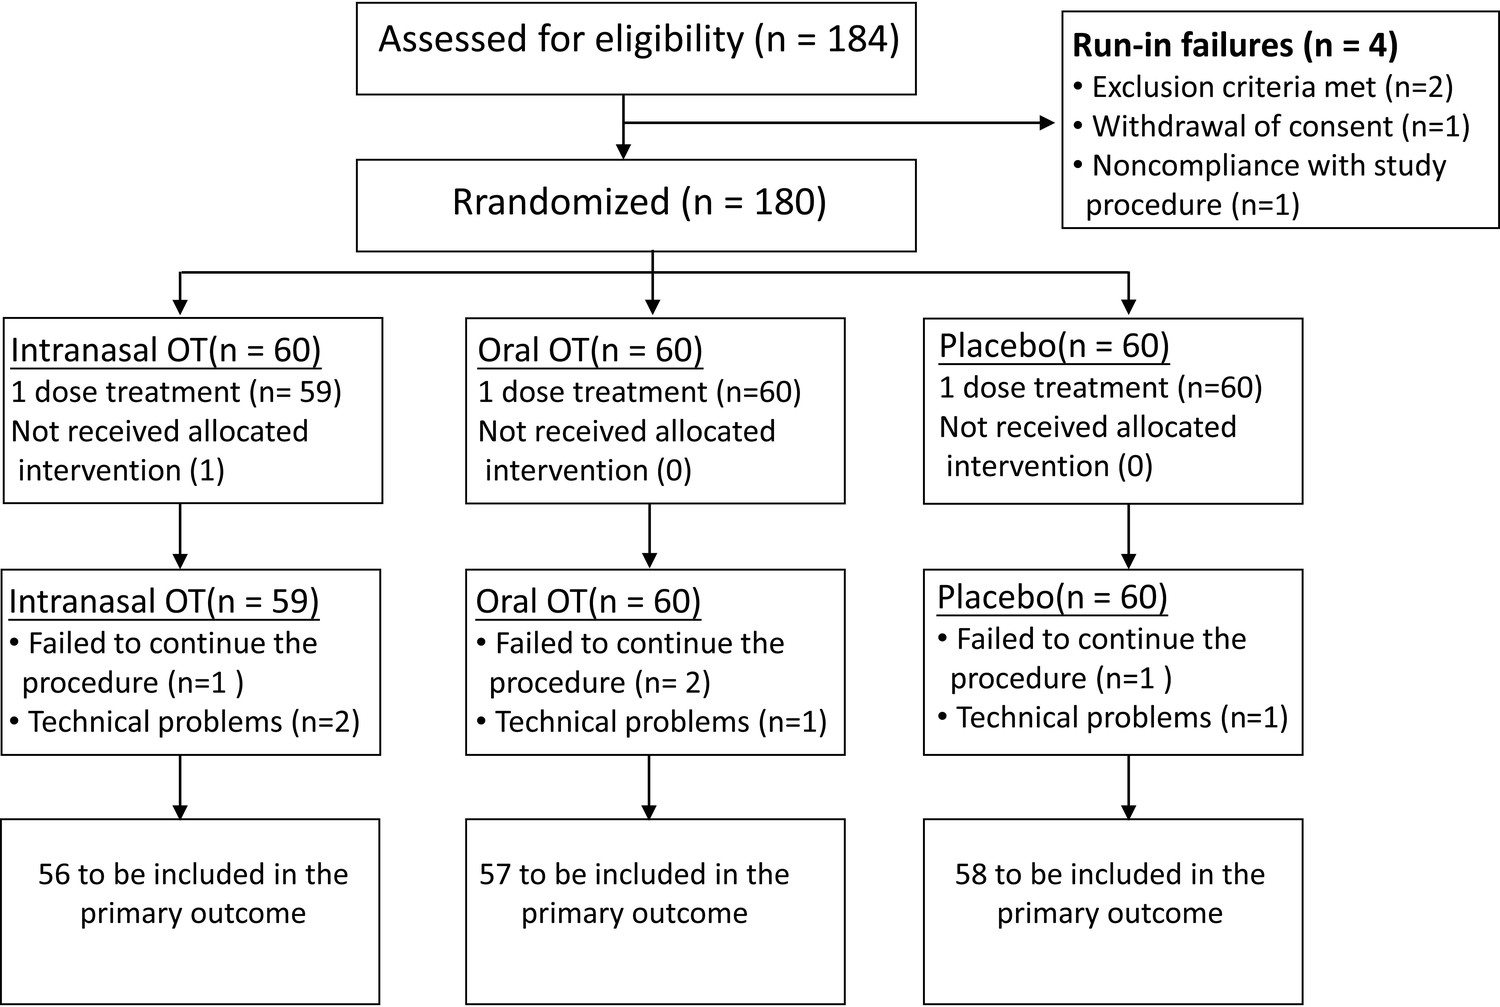
CONSORT flow diagram.
Figure 2

Effects of oxytocin on plasma OT concentration changes and behavioral rating scores.
(A) Post-treatment changes of plasma OT concentrations (compared with pre-treatment baseline). (B) Plasma OT concentration changes (compared with pre-treatment baseline) after gentle stroking touch and medium pressure massage following the OT and PLC treatments. Behavioral rating scores of pleasantness, arousal, intensity, and payment willingness following intranasal OT (N = 56), oral OT (N = 57) and PLC (N = 58) treatments in response to (C) gentle stroking touch and (D) medium pressure massage. One-way ANOVA for post-treatment OT concentration changes (minus the basal OT concentrations) was conducted to compare group differences. Repeated-measures ANOVAs were applied to investigate changes of plasma OT concentrations and treatment effects on behavioral response after the gentle stroking touch versus the medium pressure massage. Error bars show standard errors. *p < 0.05, **p < 0.01, **p < 0.001 between group comparisons.
Figure 3 with 1 supplement
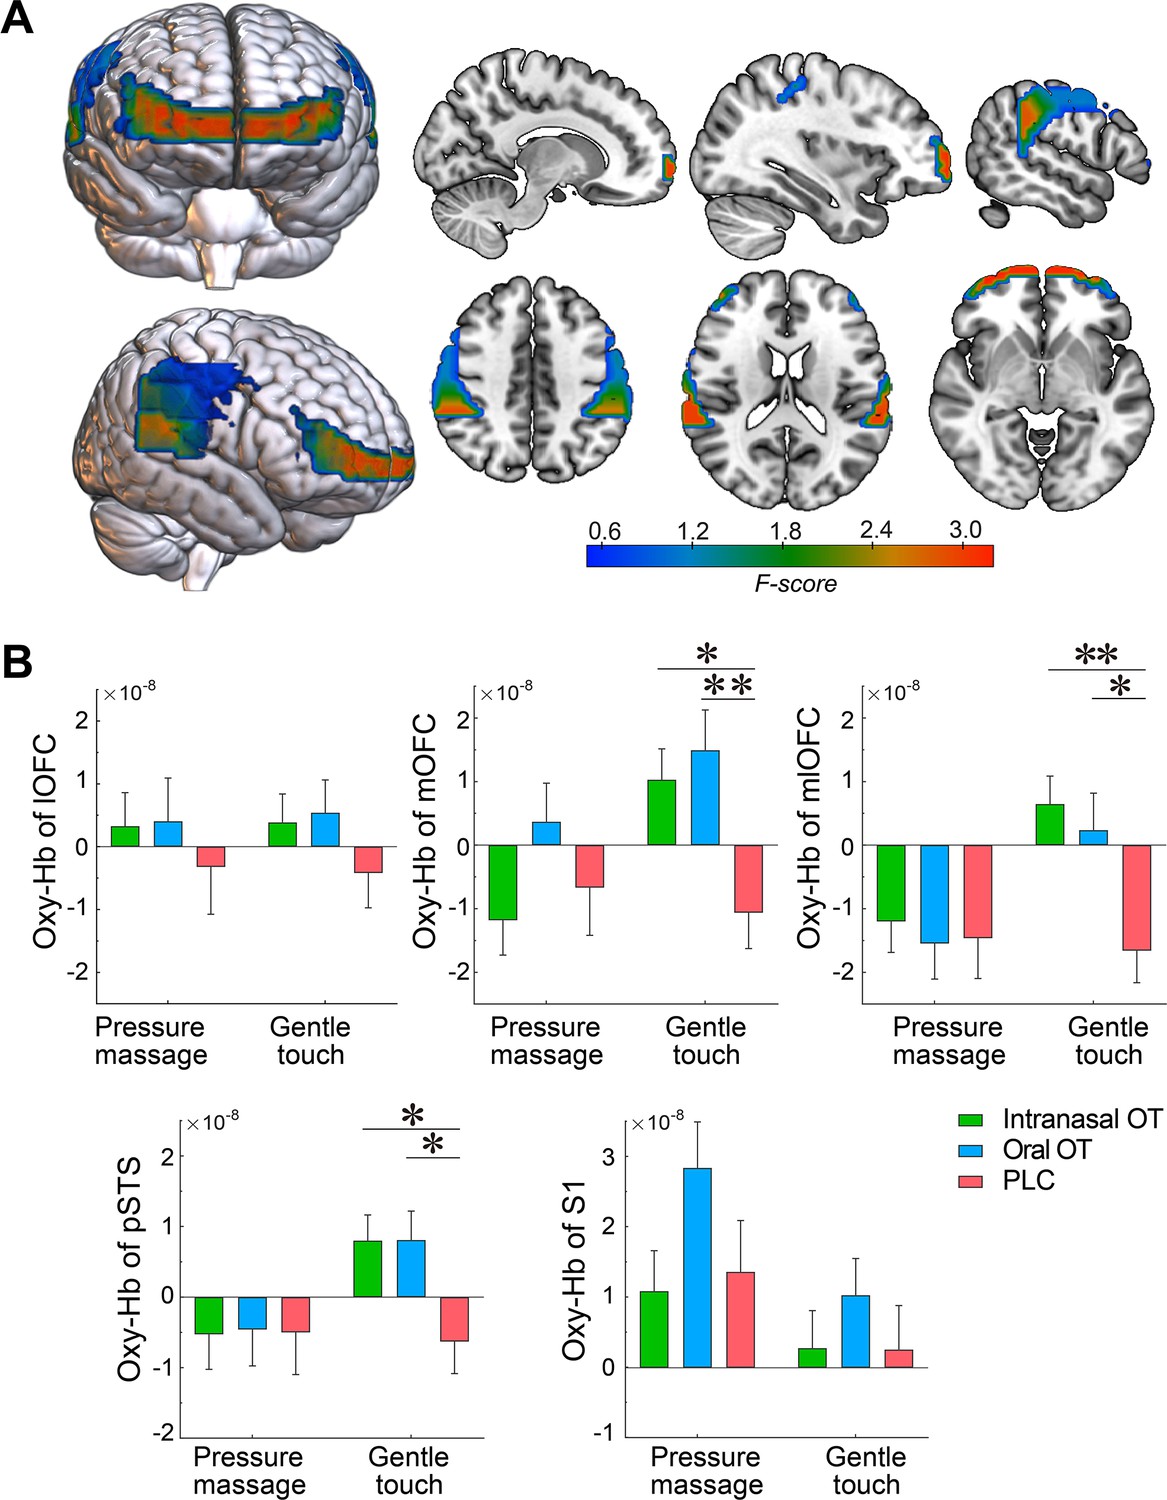
Effects of intranasal and oral OT on neural responses to gentle stroking touch.
(A) Heat brain maps show treatment x condition interaction effects (F values) on neural activations in each ROI using repeated-measures ANOVAs. (B) Averaged oxy-Hb concentration changes in the bilateral lOFC, mOFC, mlOFC, pSTS and S1 (mean ± SEM) in response to the gentle stroking touch and medium pressure massage in intranasal OT (N = 56), oral OT (N = 57) and PLC (N = 58) groups. Repeated-measures ANOVAs were applied to investigate treatment effects on neural response to the gentle stroking touch versus the medium pressure massage. *p < 0.05, **p < 0.01.
Figure 3—figure supplement 1
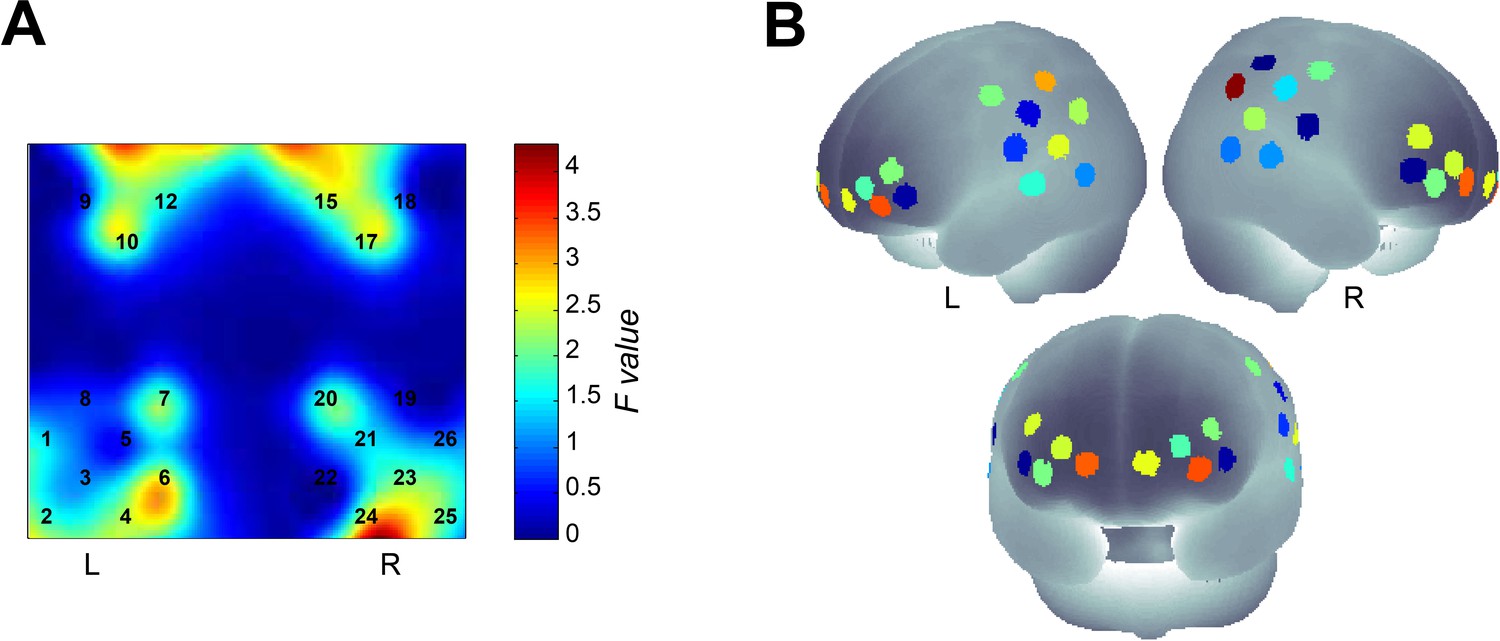
Activation maps of the channel-by-channel analysis.
Figure 4

Time courses of oxy-Hb concentration changes in response to medium pressure massage and gentle stroking touch in the bilateral mlOFC, mOFC and pSTS for intranasal OT (N = 56), oral OT (N = 57) and PLC (N = 58) groups, respectively.
The dotted gray lines indicate the onset and offset of the stimulation and the shaded areas represent ± SEM.
Figure 5 with 1 supplement
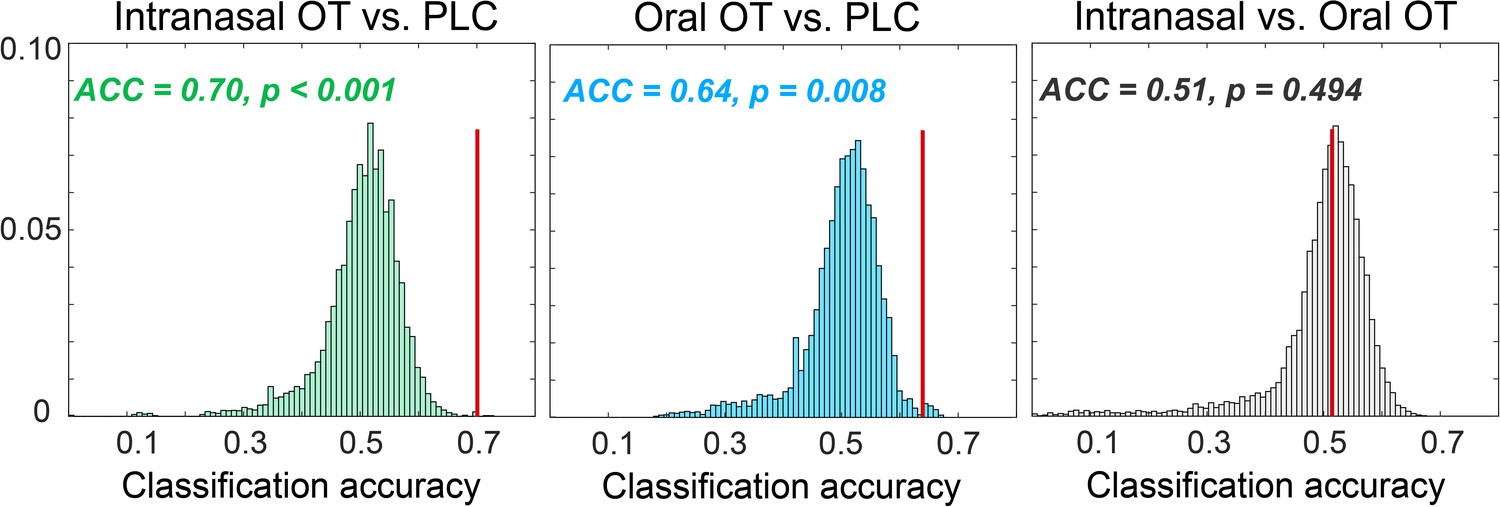
Null distribution for classification accuracies for discriminating intranasal OT versus PLC, oral OT versus PLC, and intranasal versus oral OT groups, respectively.
Histograms show the distribution of accuracies from permutation tests (permutations = 10,000). The red lines indicate the actual accuracy and p values for the actual classification accuracies.
Figure 5—figure supplement 1
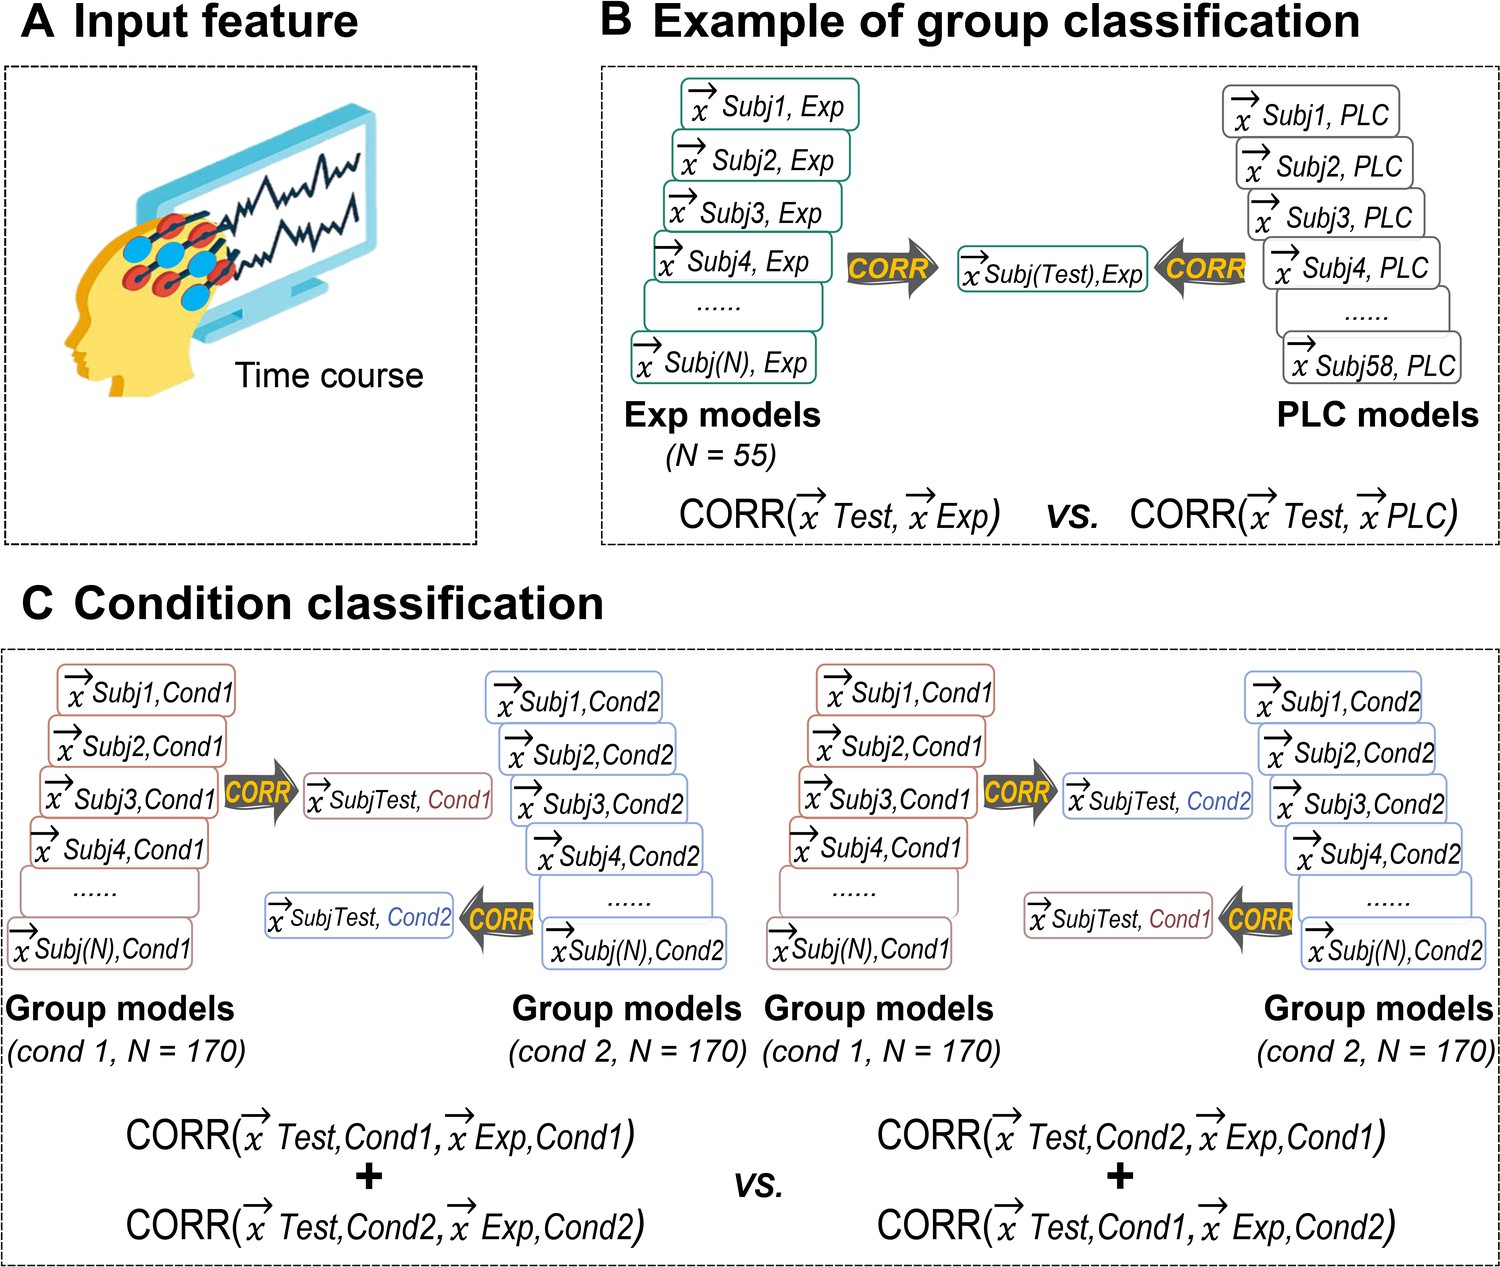
Illustration of the multivariate analysis method.
Figure 6
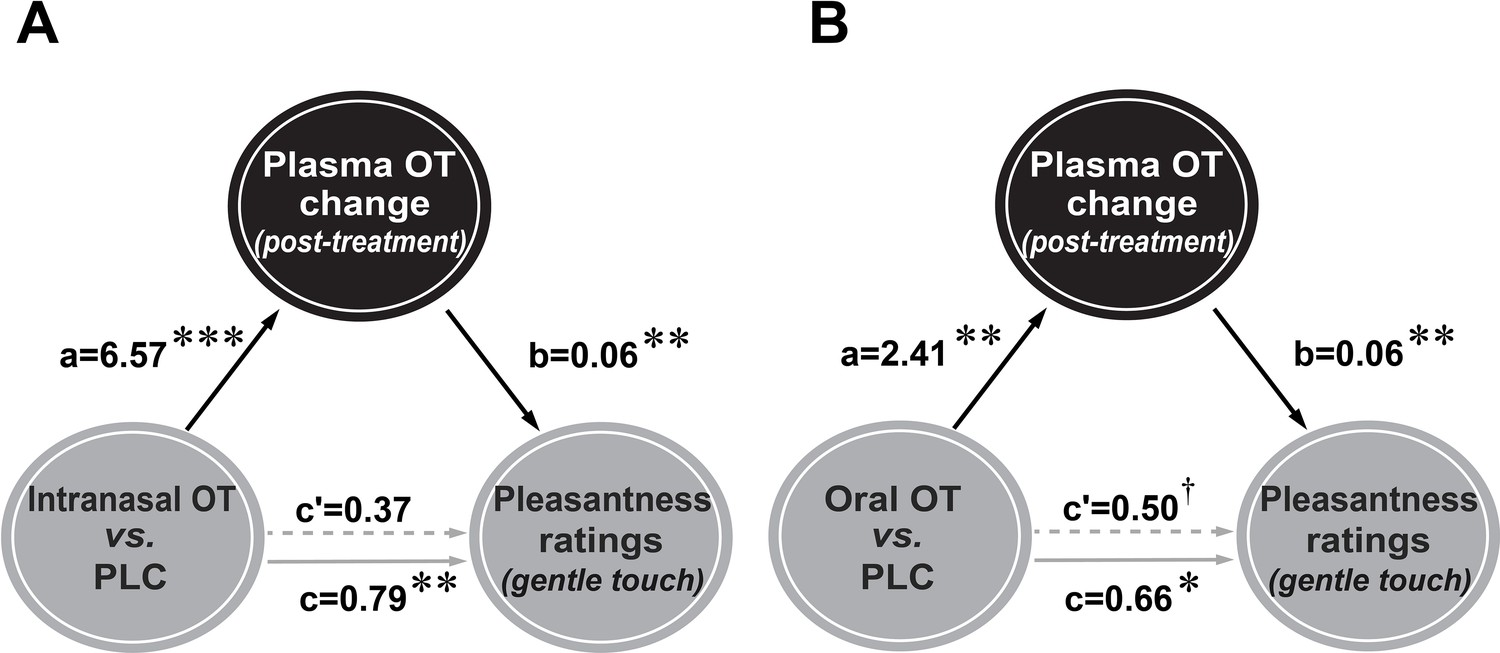
Mediation analyses for intranasal and oral oxytocin (OT) effects on pleasantness ratings via plasma OT concentrations.
Enhanced pleasantness ratings in response to gentle stroking touch following intranasal (A) and oral (B) OT administration were significantly mediated by post-treatment plasma OT concentration changes. †p=0.05, *p < 0.05, **p < 0.01, ***p < 0.001.
Tables
Table 1
Demographic, physiological, and psychometric assessments in the three groups (M±SD).
| Intranasal OT | Oral OT | PLC | value | p | |
|---|---|---|---|---|---|
| Number (males) | n=56(26) | n=57(27) | n=58(31) | χ2 = 0.67 | 0.721 |
| Age | 21.79±1.96 | 21.46±2.05 | 21.50±1.84 | F=0.48 | 0.618 |
| ASQ | 21.43±5.48 | 20.09±5.05 | 21.66±5.84 | F=1.37 | 0.256 |
| STQ | 40.36±8.51 | 41.32±9.60 | 40.79±7.67 | F=0.18 | 0.840 |
| SP | 13.16±5.28 | 12.86±5.50 | 13.38±5.48 | F=1.13 | 0.876 |
| SR | 13.20±4.07 | 14.26±4.22 | 14.16±3.60 | F=1.24 | 0.293 |
| SOR | 22.66±9.43 | 20.88±10.23 | 23.17±9.64 | F=0.87 | 0.421 |
| BDI | 9.21±9.11 | 8.39±7.36 | 9.79±8.39 | F=0.42 | 0.660 |
| TAI | 42.96±9.32 | 43.47±9.10 | 43.21±9.77 | F=0.04 | 0.959 |
| SAI | 38.59±9.61 | 38.51±8.37 | 39.02±10.33 | F=0.05 | 0.953 |
| CBSS | 39.46±9.56 | 36.21±9.38 | 38.28±8.98 | F=1.77 | 0.173 |
| CTQ | 38.50±8.57 | 36.51±9.03 | 37.97±9.10 | F=0.76 | 0.469 |
| IRI | 48.89±10.99 | 48.95±10.26 | 50.36±11.09 | F=0.34 | 0.710 |
| AAS | 57.84±6.23 | 58.11±6.04 | 57.26±6.02 | F=0.29 | 0.748 |
| PANAS | |||||
| Positive affect | 18.71±0.80 | 19.63±0.78 | 17.42±0.78 | F=2.04 | 0.132 |
| Negative affect | 11.00±0.37 | 11.31±0.36 | 11.15±0.36 | F=0.17 | 0.840 |
| HF | |||||
| Gentle stroking touch | 47.24±16.62 | 49.32±17.29 | 49.48±16.47 | Fa = 0.40 | 0.878 |
| Medium pressure massage | 51.89±17.18 | 53.68±16.20 | 52.89±15.74 | ||
| DFAα1 | |||||
| Gentle stroking touch | 0.92±0.25 | 0.89±0.24 | 0.88±0.23 | Fa = 0.33 | 0.922 |
| Medium pressure massage | 0.99±0.25 | 0.94±0.27 | 0.95±0.25 | ||
| Heart rate | |||||
| Gentle stroking touch | 72.78±8.25 | 74.47±10.45 | 72.47±9.96 | Fa = 0.70 | 0.653 |
| Medium pressure massage | 71.73±9.56 | 72.09±8.09 | 70.67±9.48 | ||
| SCR | |||||
| Gentle stroking touch | 1.45±1.81 | 1.20±1.47 | 1.09±1.52 | Fa = 0.43 | 0.862 |
| Medium pressure massage | 2.48±2.15 | 2.58±2.39 | 2.49±187 | ||
| Basal OT concentrations | 8.12±0.54 | 8.49±0.60 | 9.71±0.48 | F=2.39 | 0.105 |
-
a: F values of the group x condition interaction analyses.
Additional files
-
Supplementary file 1
Supplementary Tables 1A through 1D.
Table 1A. Treatment effects on mood. Table 1B. Treatment effects on post-treatment plasma OT change (pg/ml). Table 1C. Confounding effects of individual perceived gender on behavioral pleasantness rating scores. Table 1D. Treatment effects on physiological indices.
- https://cdn.elifesciences.org/articles/85847/elife-85847-supp1-v2.docx
-
Supplementary file 2
CONSORT 2010 checklist.
- https://cdn.elifesciences.org/articles/85847/elife-85847-supp2-v2.doc
-
MDAR checklist
- https://cdn.elifesciences.org/articles/85847/elife-85847-mdarchecklist1-v2.docx
Download links
A two-part list of links to download the article, or parts of the article, in various formats.
Downloads (link to download the article as PDF)
Open citations (links to open the citations from this article in various online reference manager services)
Cite this article (links to download the citations from this article in formats compatible with various reference manager tools)
Oxytocin administration enhances pleasantness and neural responses to gentle stroking but not moderate pressure social touch by increasing peripheral concentrations
eLife 12:e85847.
https://doi.org/10.7554/eLife.85847


