Single-cell RNA sequencing reveals cellular and molecular heterogeneity in fibrocartilaginous enthesis formation
- Department of Sports Medicine, Xiangya Hospital Central South University, China
- Key Laboratory of Organ Injury, Aging and Regenerative Medicine of Hunan Province, China
- National Clinical Research Center for Geriatric Disorders, Xiangya Hospital, Central South University, China
- Department of Spine Surgery and Orthopaedics, Xiangya Hospital, Central South University, China
Figures
Figure 1
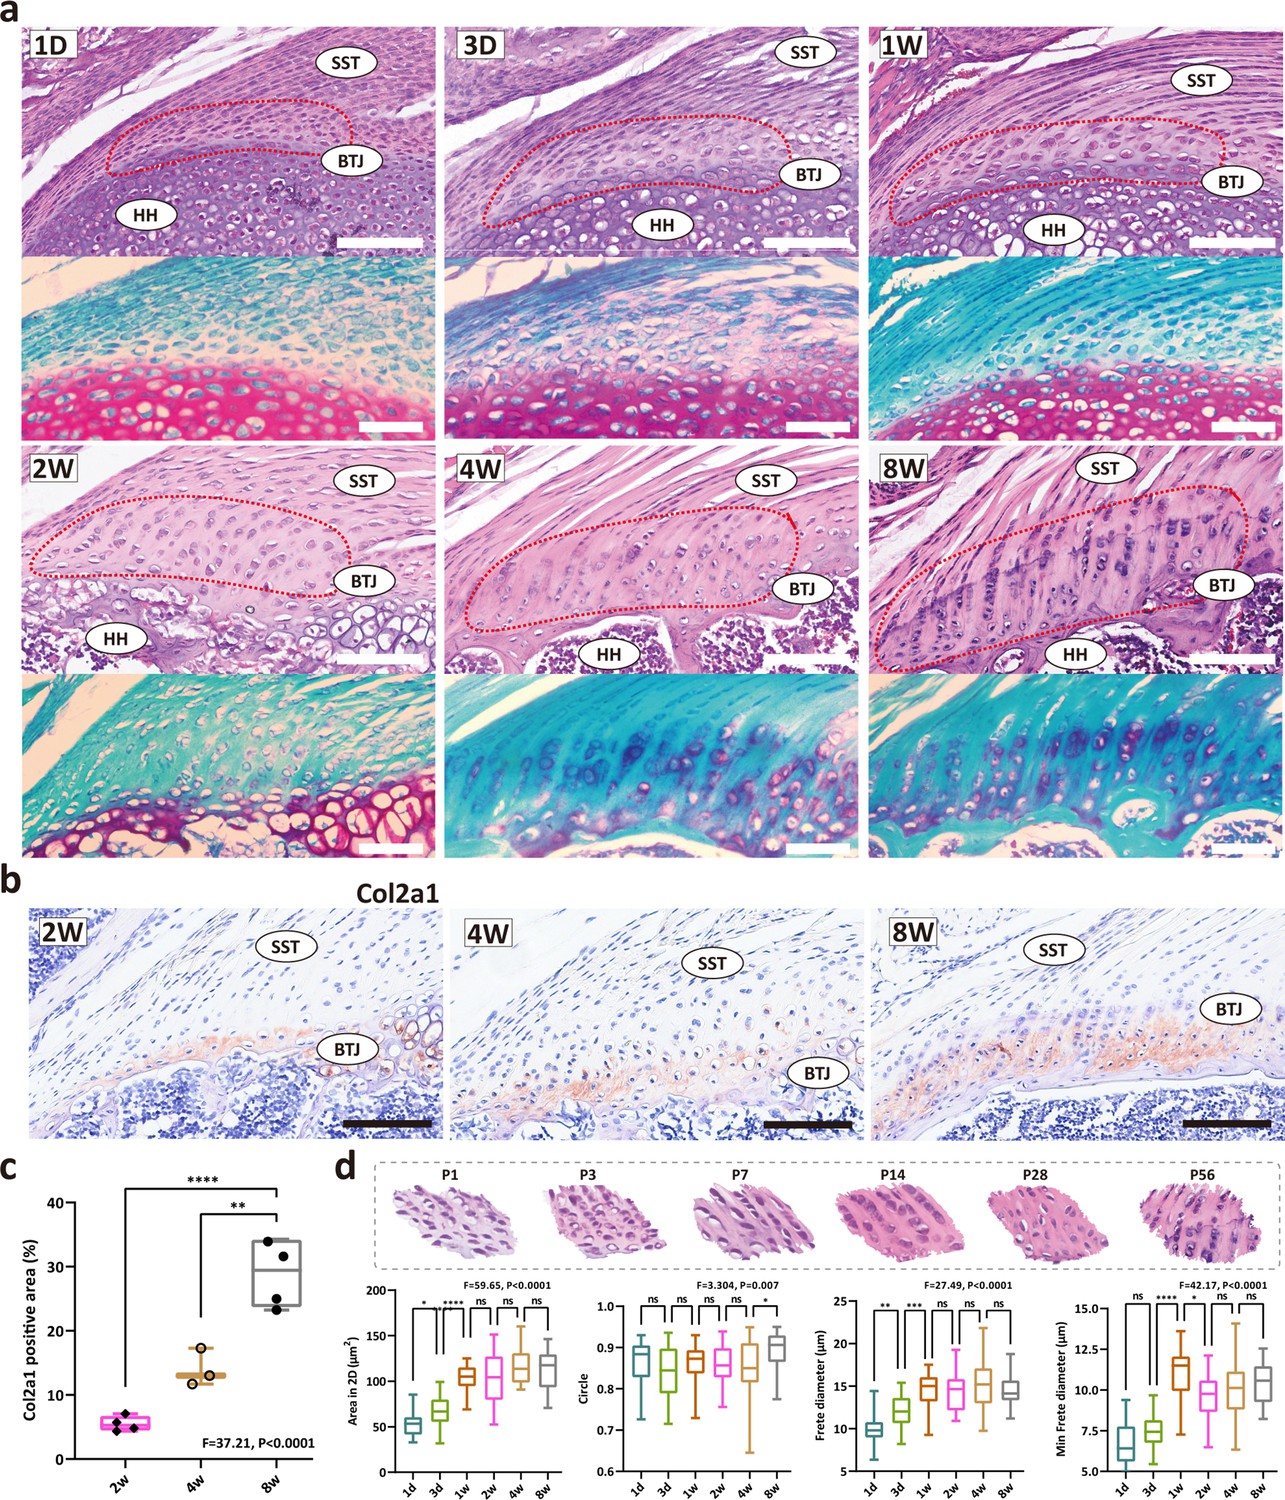
The development of fibrocartilage in the enthesis occurs postnatally.
(a) H&E staining of P1, P3, P7, P14, P28, and P58 mouse supraspinatus tendon entheses (n=4). Scale bars, 100 μm. (b) Immunohistochemistry images of cartilage-abundant collagen II at P14, P28 and P56. Scale bars, 100 μm. (c) Comparison of the col2a1 positive area derived from IHC results. Error bars represent SEM. N=3-4. **p<0.01, ****p<0.0001. (d) Comparison of the morphological parameters (2D area, roundness, frete diameter, and minimal frete diameter) between P1, P3, P7, P14, P28, and P56. Error bars represent SEM. *p<0.05, ***p<0.001, ****p < 0.0001.
Figure 2 with 2 supplements
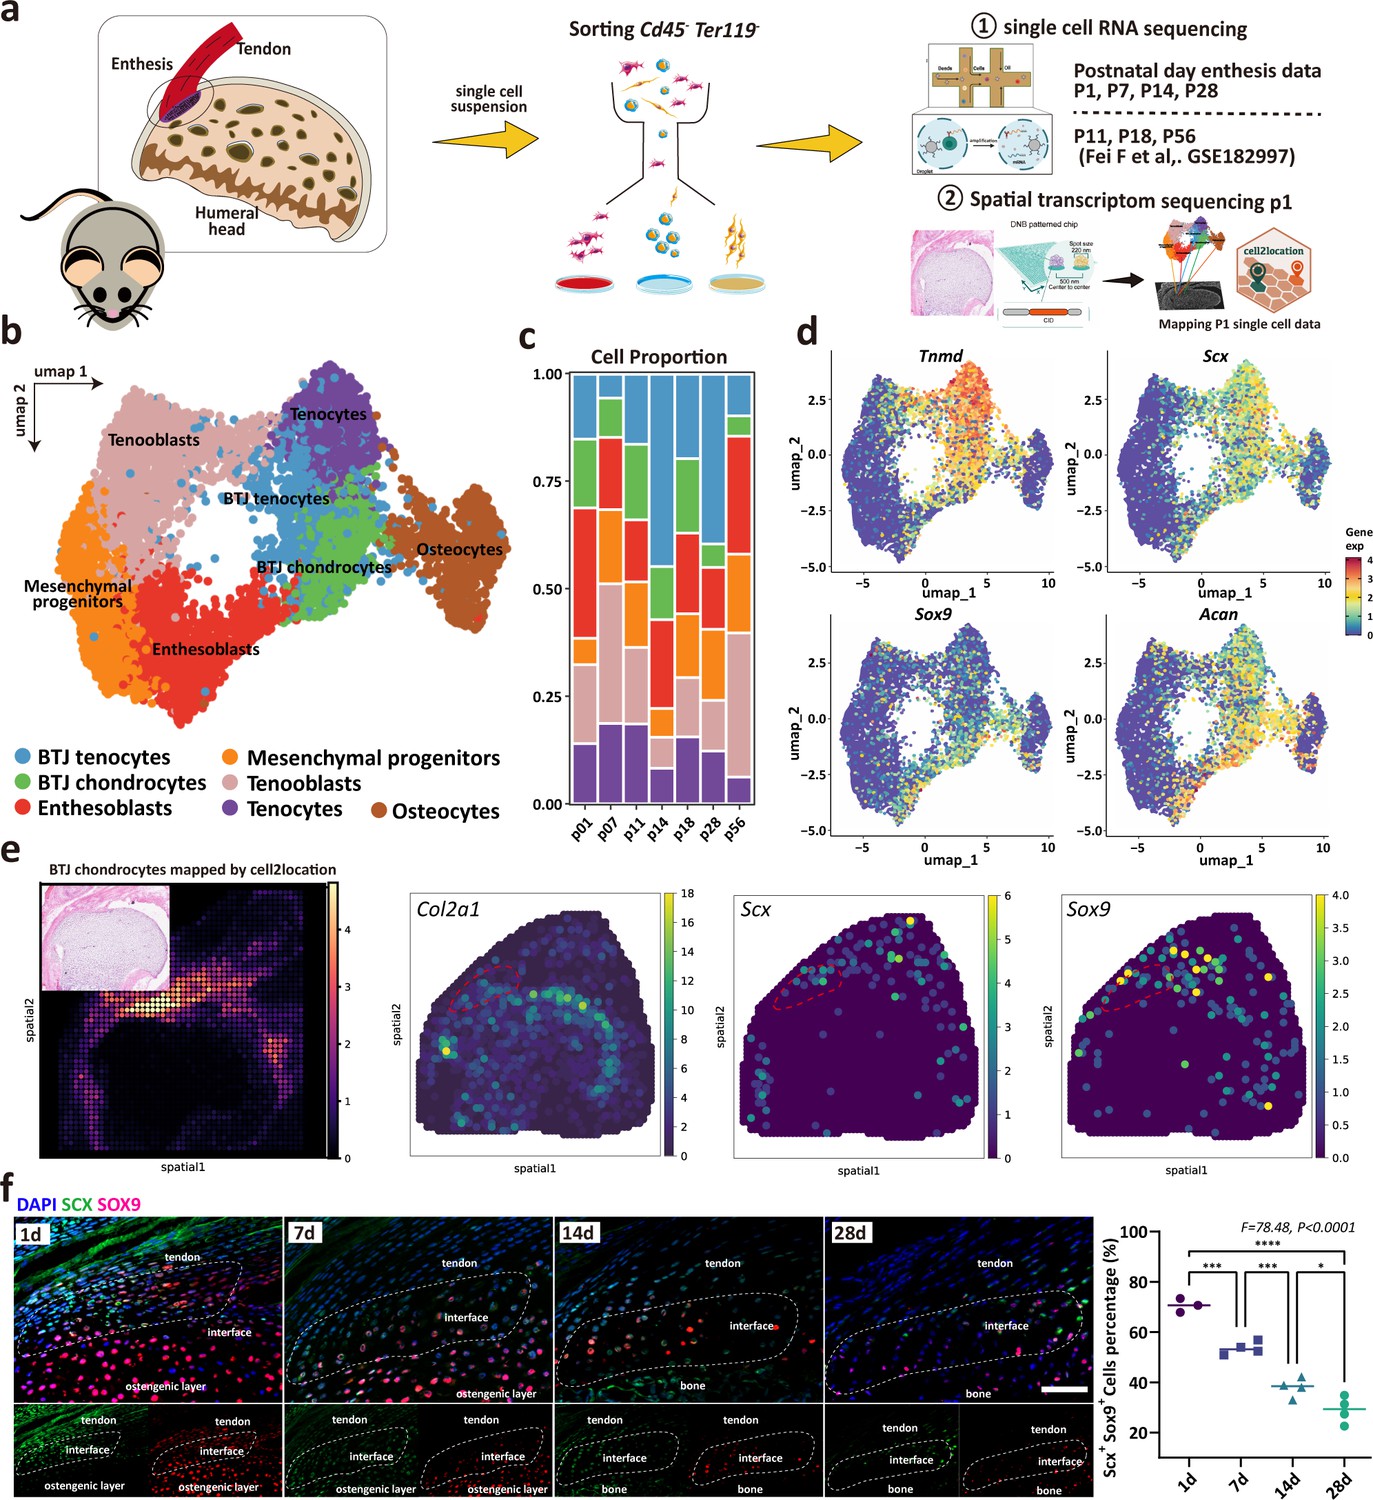
Unbiased clustering identified Known Cell Populations in postnatal enthesis development.
(a) Schematic workflow of the study design. (b) Distributions of seven cell clusters on UMAP plot, including bone-tendon junction (BTJ) chondrocytes, BTJ tendons, tenocytes, osteocytes, enthesoblasts, tenoblasts, and mesenchymal progenitors. (c) Fractions of cell clusters in enthesis development at P1, P7, P11, P14, P18, P28, and P56. (d) The average expression of curated feature genes for previously reported enthesis marker genes and enthesis-specific extracellular matrix (ECM) genes. (e) Spatial transcriptomic spot map revealing the expression of chondrocyte marker genes in each spatial spot. (f) Representative immunofluorescence staining to validate the spatial distribution of Sox9+ and Scx+ cells in the enthesis area, at P1, P7, and P14. Scale bars, 100 μm. N=3-5. *p<0.05, ***p<0.001, ****p<0.0001.
Figure 2—figure supplement 1
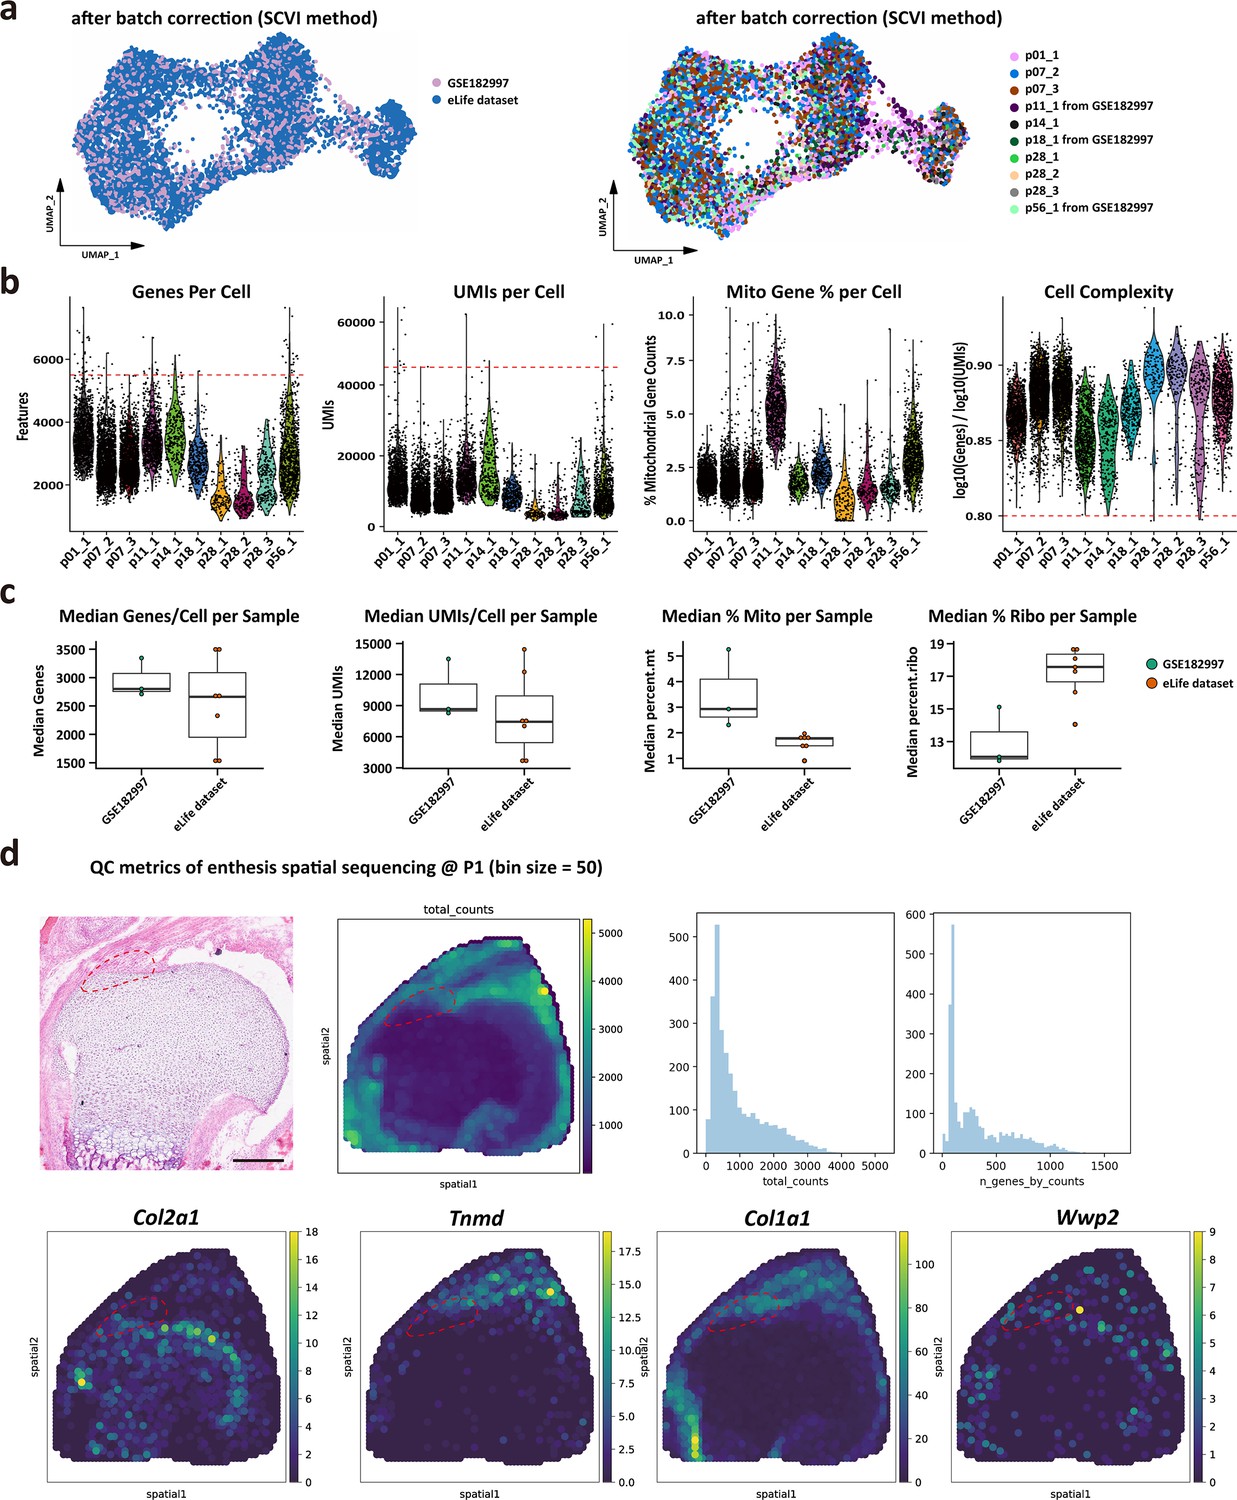
Technical and quality control measures for each single-cell RNA sequencing (scRNA-seq) datasets and single-cell transcriptomic dataset, related to Figure 2.
(a) Batch information of single cells between our dataset and GSE182997 datasets. (b) Major quality control parameters of each single-cell sample, including genes per sample, UMIs per sample, percentage of mitochondrial gene per sample, and cell complexity of each sample. (c) The comparison of quality control parameters between our dataset and GSE182997 datasets. (d) Quality control metrics (total UMIs at each spot and total genes at each spot) of P1 enthesis single-cell spatial transcriptomic data, as well as chondrocyte marker genes (Col2a1, Wwp2), and tendon marker genes (Tnmd, Col1a1).
Figure 2—figure supplement 2
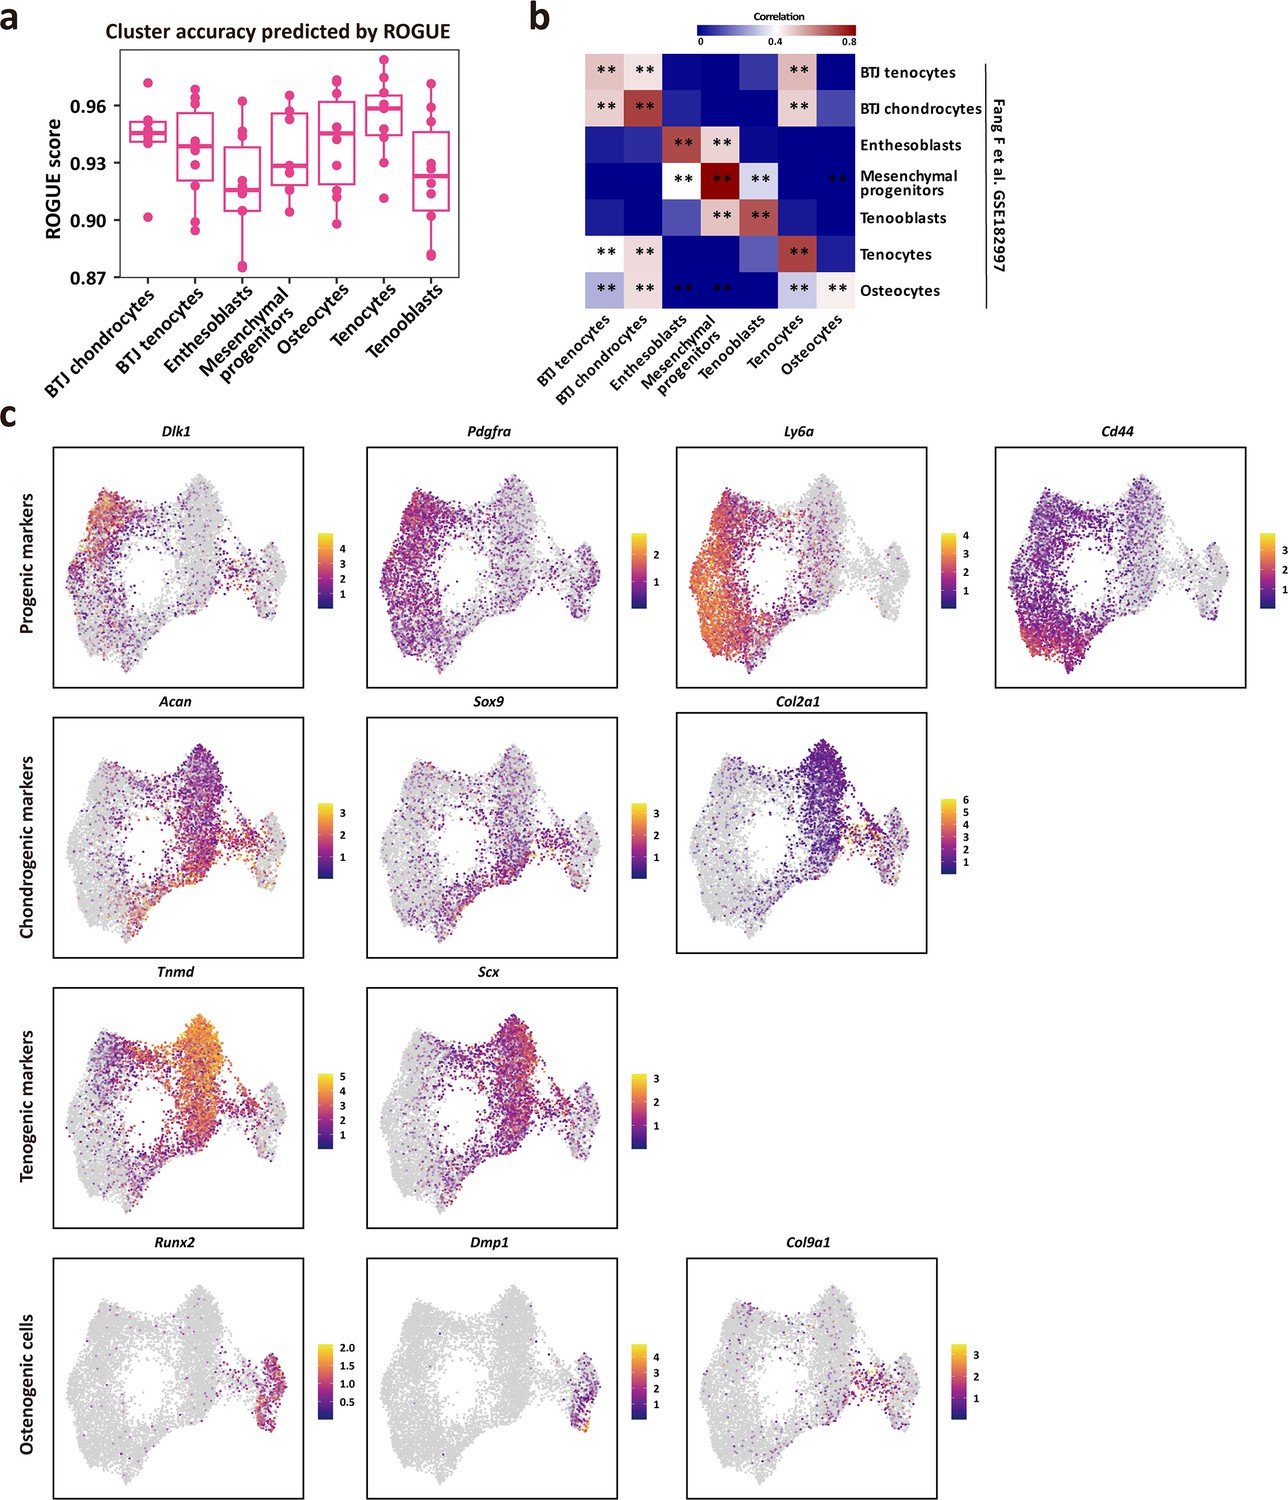
Top differentially expressed genes per cluster in the dataset, related to Figure 2e.
(a) The purity of single-cell populations, all these clusters achieved high ROGUE values of >0.9. The center line indicates the median ROUGE value. The lower and upper hinges represent the 25th and 75th percentiles, respectively. (b) The relation and consistency between our dataset and open-source GSE182997 datasets (three samples) provided by Fang et al., (c) Gene expression plots of the progenic, chondrogenic, tenogenic, and osteogenic genes expressed in each single-cell.
Figure 3
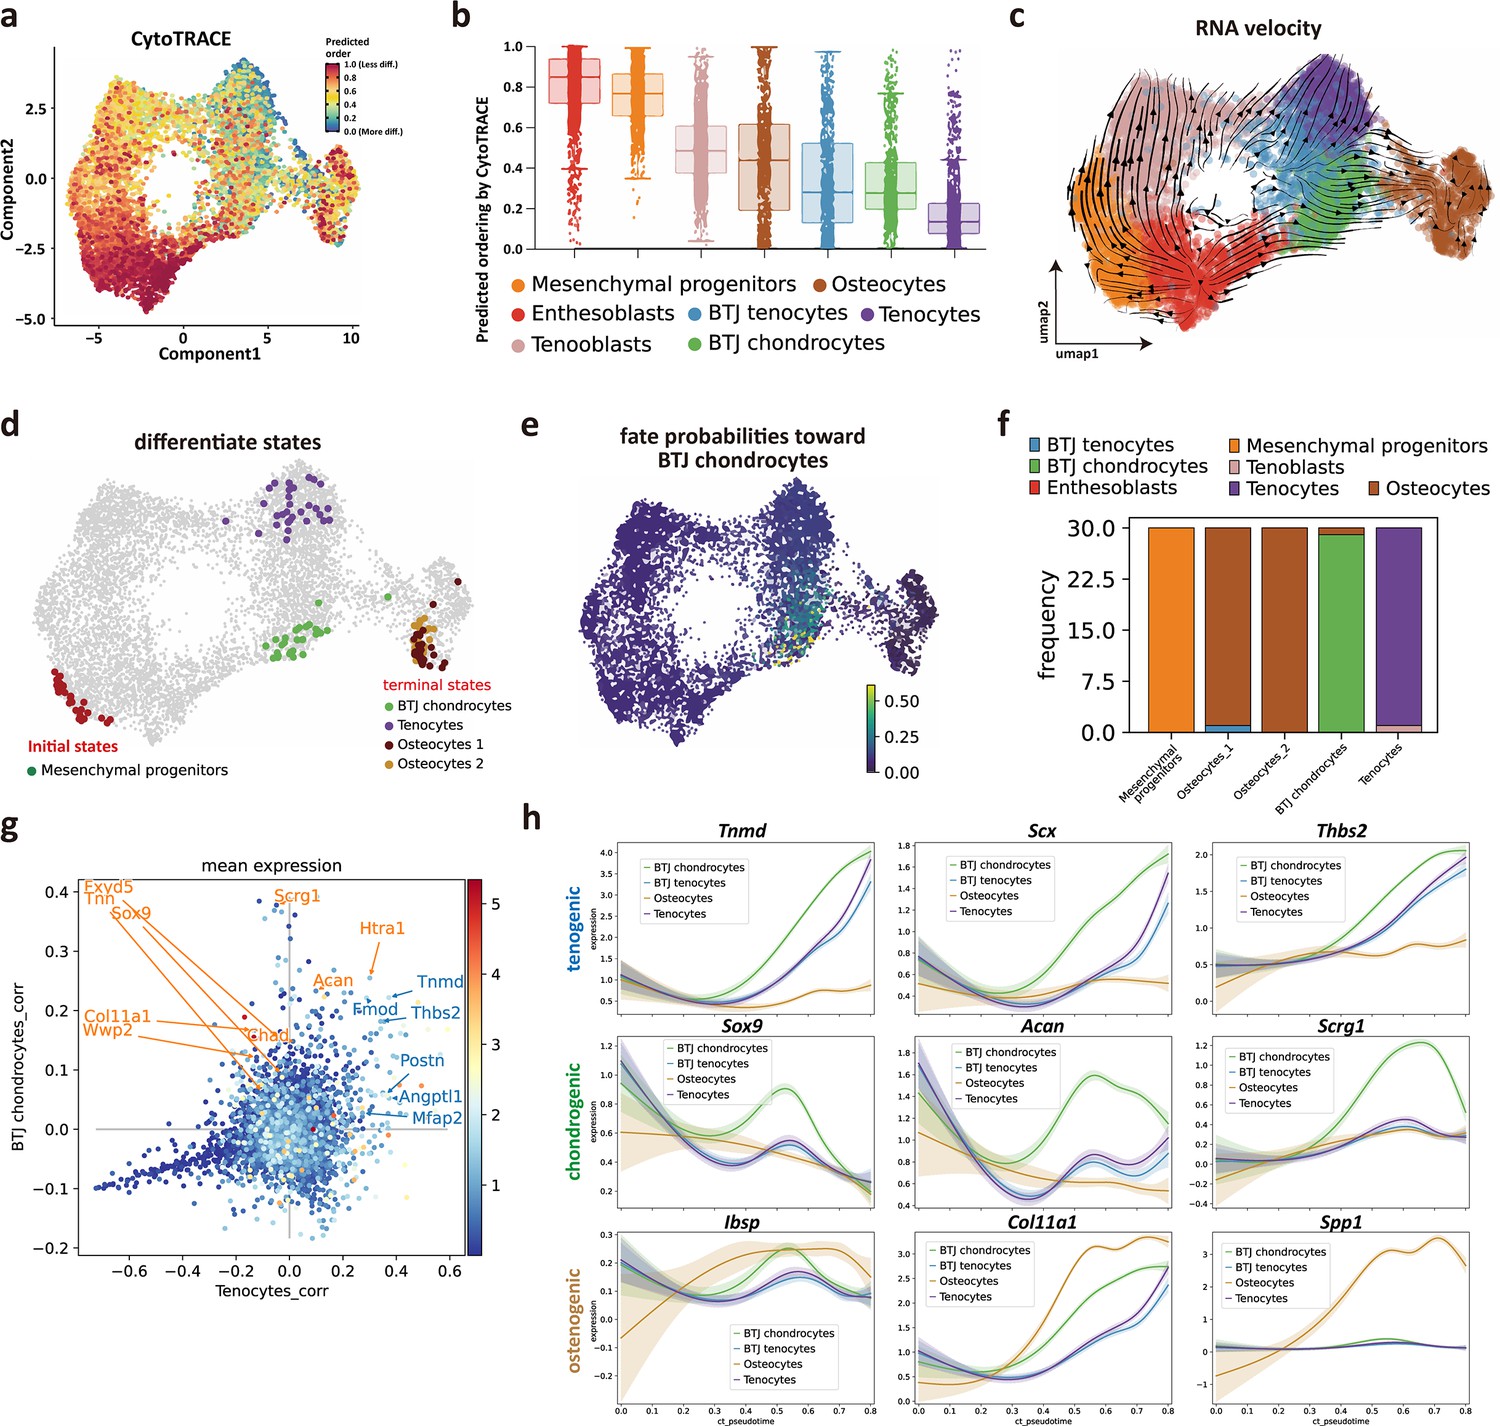
Identifying developmental trajectories for tenocytes, chondrocytes, and osteocytes differentiation in enthesis.
(a) Uniform Manifold Approximation and Projection (UMAP) plot of enthesis single-cell RNA sequencing (scRNA-seq) data overlaid with CytoTRACE scores. (b) Boxplot of predicted differentiation score distributions for each cell cluster. (c) Results of RNA velocity analysis show that postnatal enthesis fibrocartilage origin from mesenchymal progenitors, instead of tendon cells. (d) Cellrank identified three differentiation terminal cell types, including bone-tendon junction (BTJ) chondrocytes, tenocytes, and osteocytes. (e) Fate probabilities uncovered putative BTJ chondrocytes lineage drivers. (f) Distribution over cluster membership for each of the cells assigned to a certain terminal state. (g) Genes that correlate positively with the BTJ chondrocyte fate correlate moderately with the tendon fate and vice versa. (h) Representative tenogenic, chondrogenic, and osteogenic gene expression dynamics along four terminal differentiation trajectories.
Figure 4 with 1 supplement
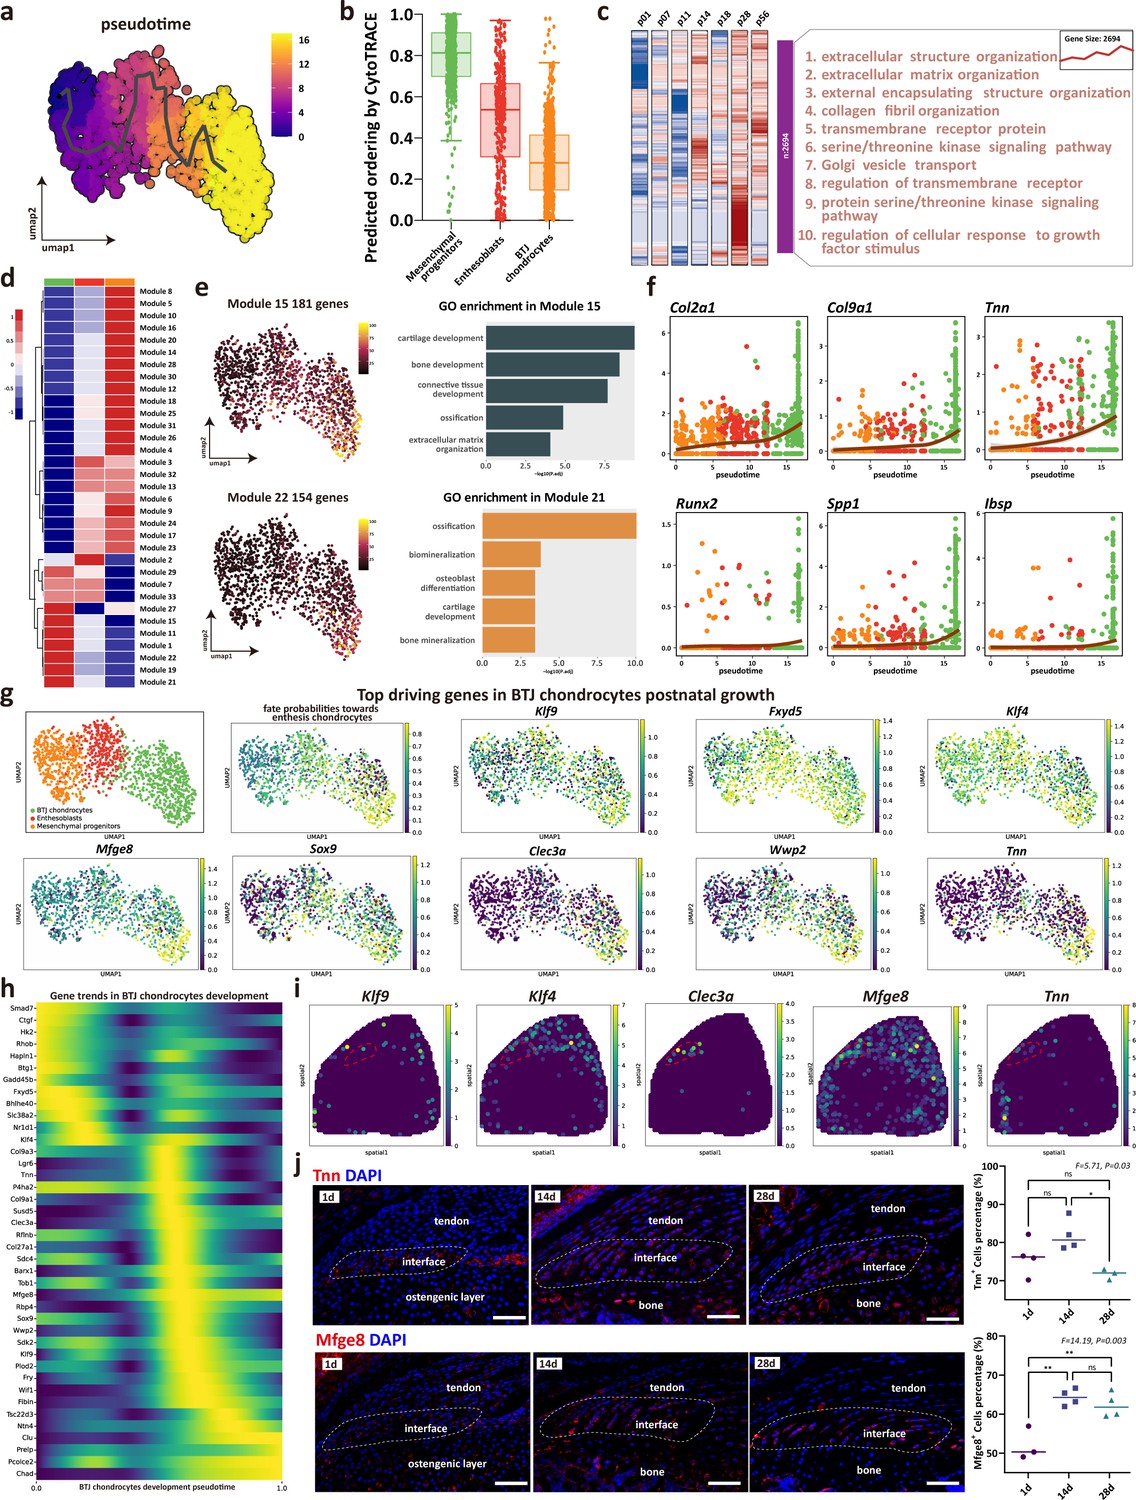
The trajectory and gene dynamics in bone-tendon junction (BTJ) chondrocytes differentiation.
(a) Pseudotime analysis of the three clusters of mesenchymal progenitors, enthesoblasts, and enthesis chondrocytes. (b) Cytotrace scores and predicted ordering of the three subclusters. (c) Heatmap revealing the scaled expression of differentially expressed genes (DEGs) and their annotated function for each timepoint. (d) Heatmap showing the modules of coregulated genes grouped by Louvain community analysis. (e) Uniform Manifold Approximation and Projection (UMAP) plots and functional annotation of the representative gene modules, showing the top five gene ontology (GO) annotations of indicated biological process among each timepoint. (f) Line plots showing representative gene trends in modules 15 and 22, respectively. (g) Feature plots showing top driving genes in BTJ chondrocyte growth. (h) Heatmap showing the gene expression dynamics along differentiation trajectories of BTJ chondrocytes. (i) Spatial transcriptomic spot map reveals the expression of driving genes in each spatial spot. (j) Immunofluorescence shows distribution and dense level of Tnn and Mfge8 during the different postnatal times. Scale bars, 100 μm. N=3-4. *p<0.05, **p<0.01.
Figure 4—figure supplement 1
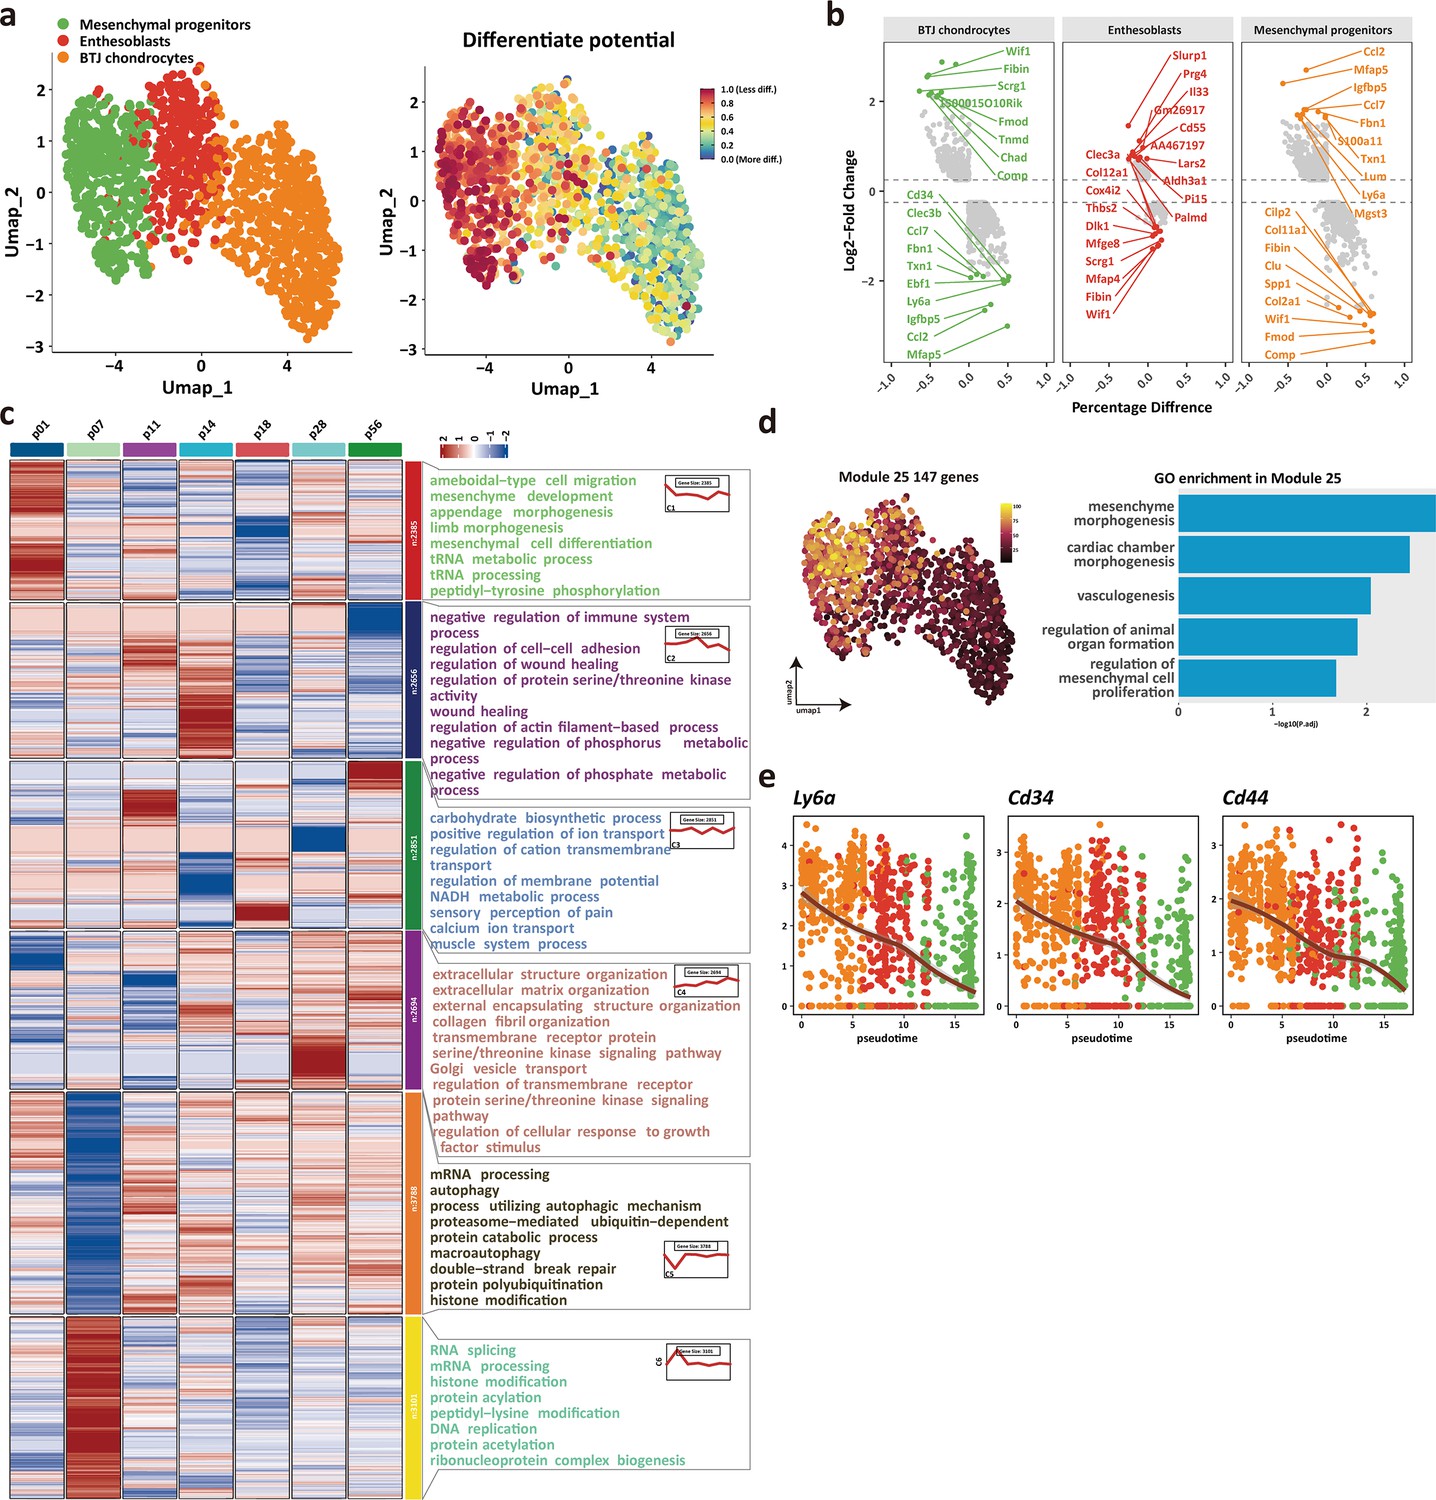
The trajectory and gene dynamics in bone-tendon junction (BTJ) chondrocytes differentiation, related to Figure 4e.
(a) Cytotrace scores and predicted orderin projected on Uniform Manifold Approximation and Projection (UMAP) dimensions. (b) The top upregulated or downregulated genes in BTJ chondrocytes, enthesoblasts, and mesenchymal progenitors. (c) Heatmap revealing the scaled expression of differentially expressed genes (DEGs) and their annotated function for each timepoint between different cell clusters. (d) UMAP plots and functional annotation of the representative gene modules, showing the top five gene ontology (GO) annotations of indicated biological process among each timepoint. (e) Line plots showing representative stemness-related gene trends in module 25.
Figure 5
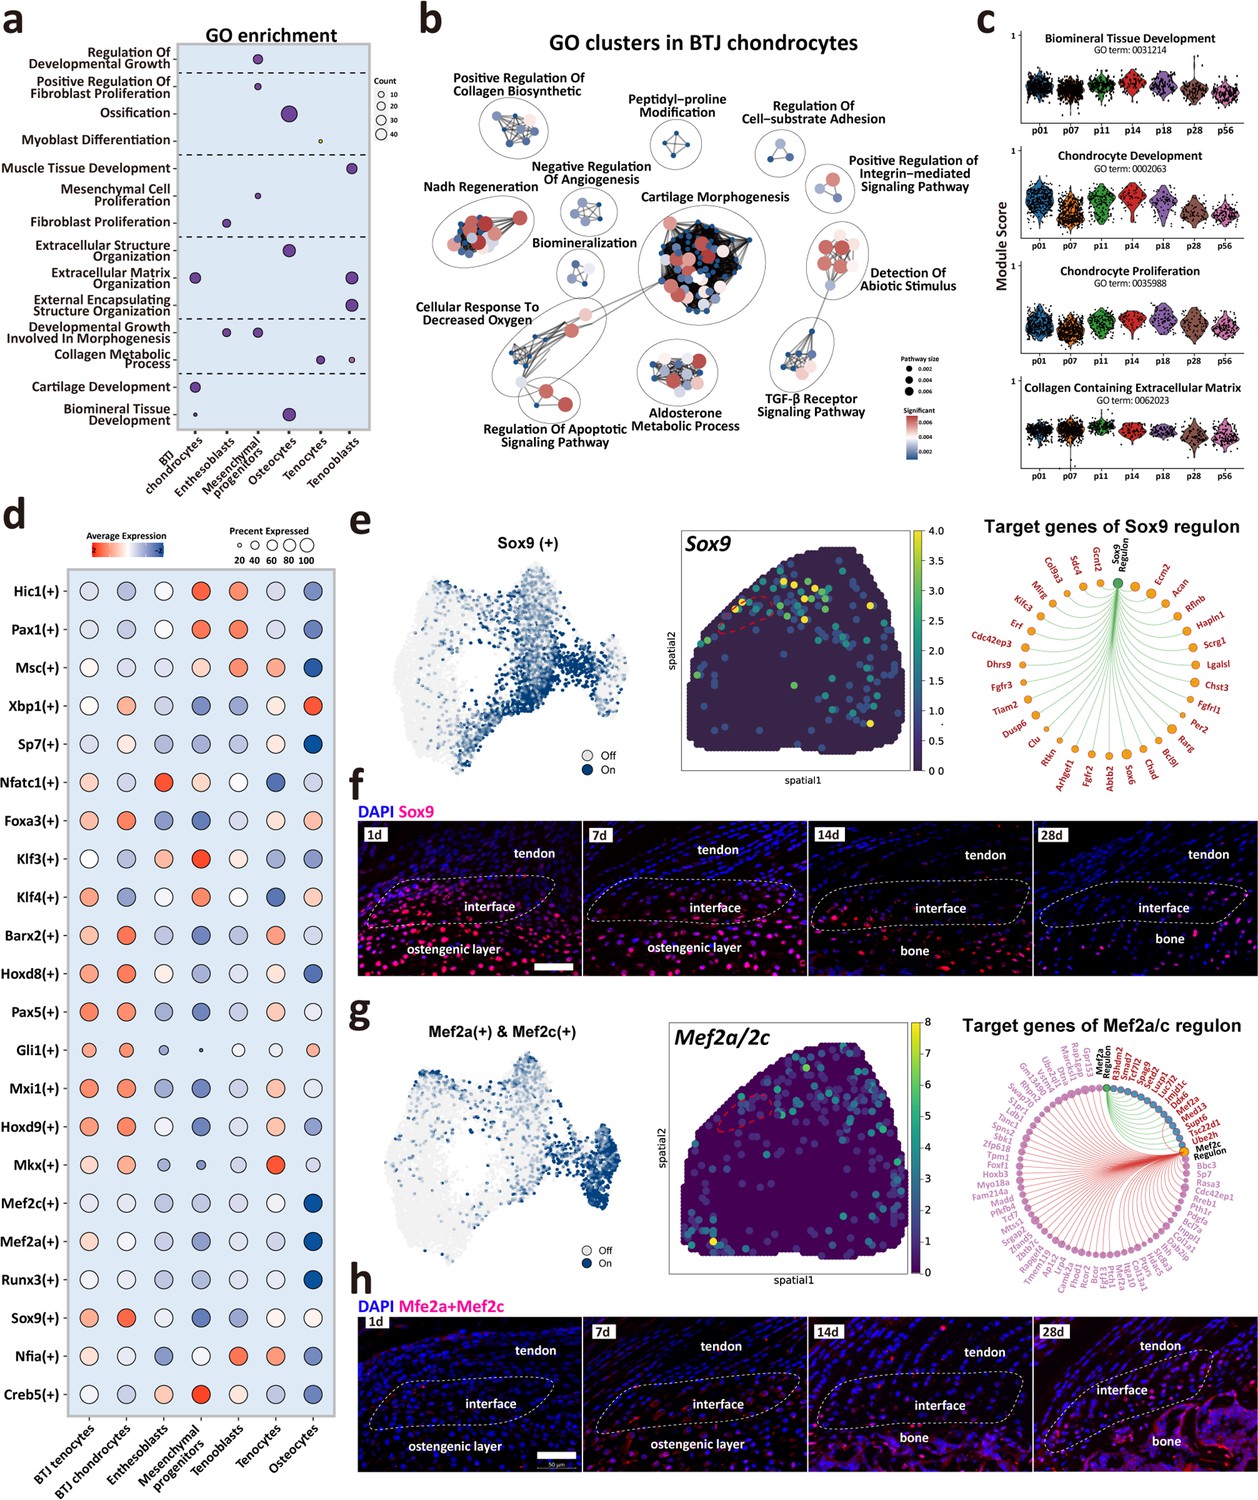
Biological processes and regulators governing enthesis chondrocytes differentiation.
(a) Heatmap shows the typical biological processes enriched in each cellular cluster. (b) Dot plots show the gene ontology (GO) clusters in bone-tendon junction (BTJ) chondrocytes in enthesis development. (c) Time-dependent analysis of GO annotations including chondrocyte proliferation, development, and biomineral tissue development decreased with time increased. (d) Heatmap shows the most significant regulatory regulons in each subcluster. (e, g) Uniform Manifold Approximation and Projection (UMAP) plots and spatial expression of Sox9 and Mef2a/Mef2c regulons and their target genes in enthesis chondrocytes. (f, h) Immunofluorescence shows distribution and dense level of Sox9 and Mef2a/Mef2c during different postnatal time. Scale bars, 100 μm.
Figure 6 with 1 supplement
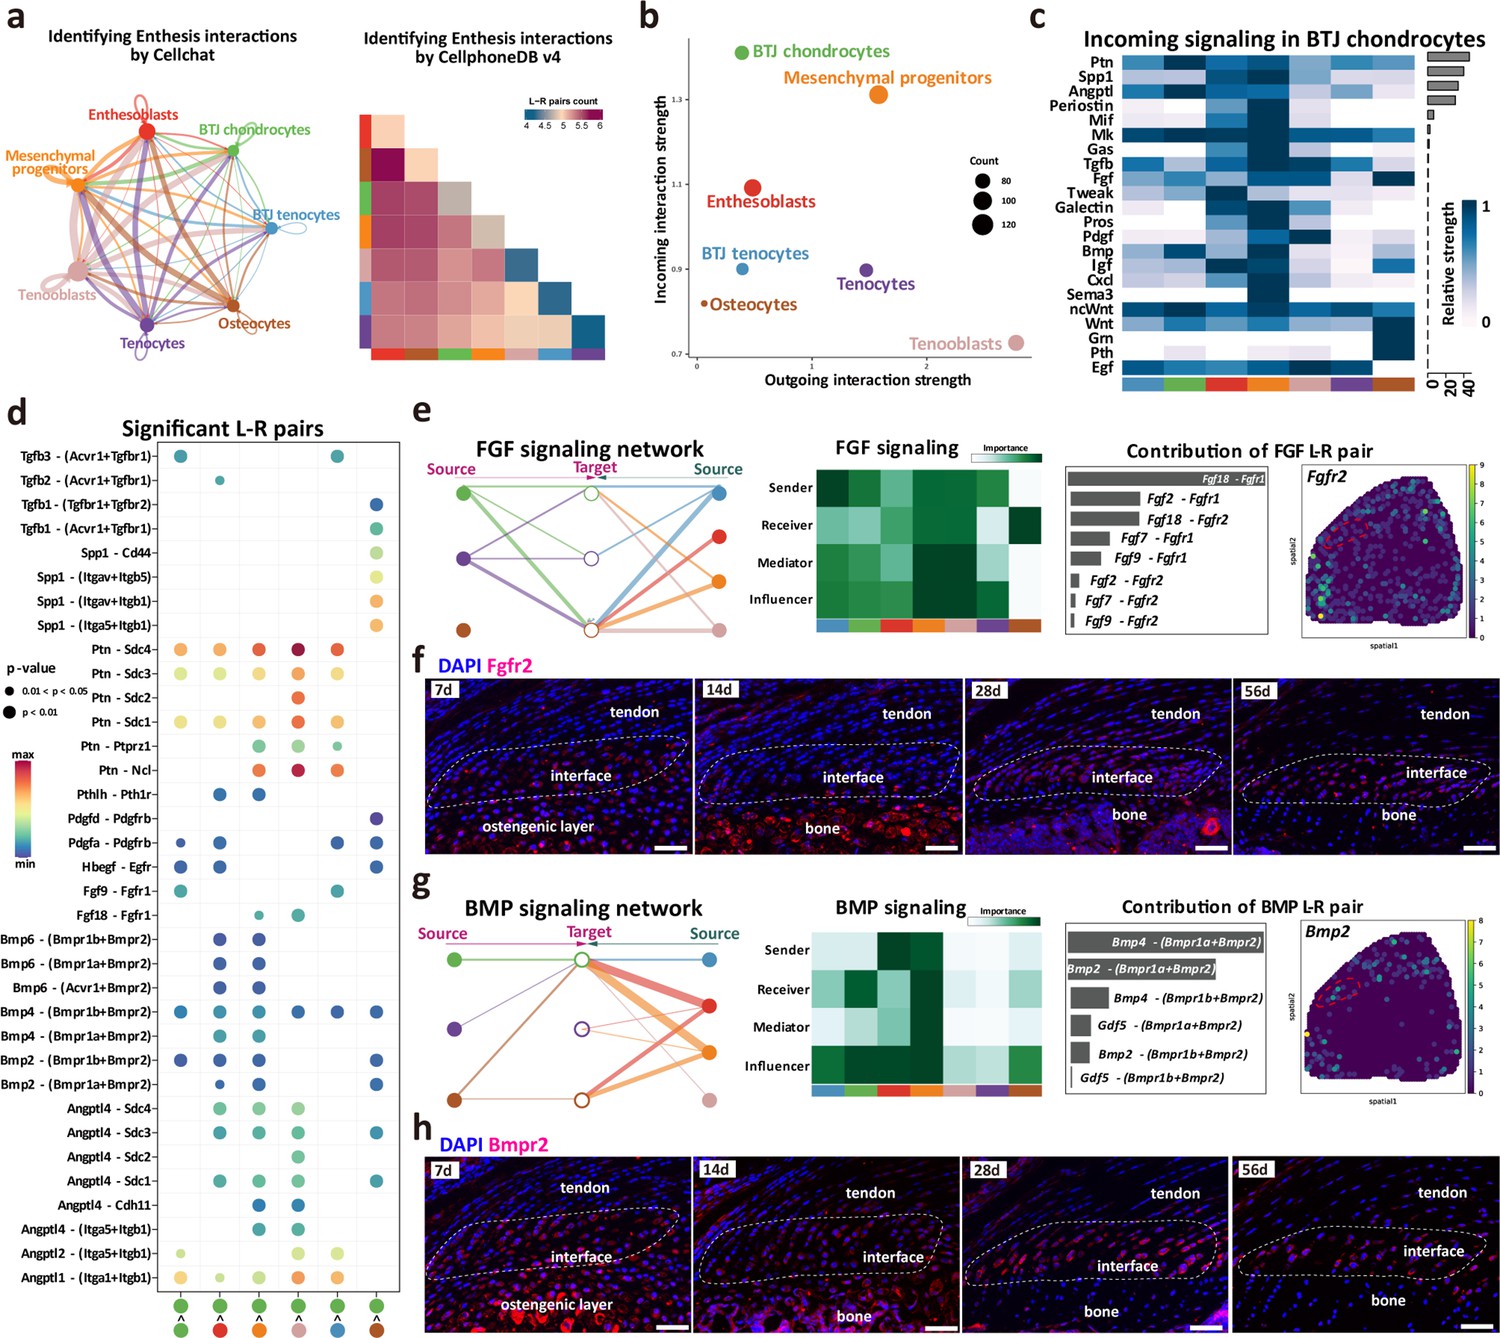
Intercellular crosstalk signaling networks regulating enthesis postnatal growth.
(a) Overview of the cellular network regulating the postnatal enthesis growth predicted by CellChat and Cellphone DB. (b) The dominant senders (sources) and receivers (targets) among seven cell clusters. (c) Identify signals contributing most to the incoming signaling of bone-tendon junction (BTJ) chondrocytes. (d) Heatmap shows the most significant signaling networks among each subcluster. (e, g) Overview of FGF and BMP signalings networks in enthesis development. Hierarchy plots show the inferred signaling networks among all cell clusters. Heatmaps show the signaling roles of cell groups. Bar plots show the ligand-receptor pairs contributed significantly to BTJ chondrocytes. Feature plot shows the validation of Bmpr2 and Fgfr2 in spatial transcriptomic data. (f, h) Validations Fgfr2 and Bmpr2 protein in enthesis by immunofluorescence stainings. Scale bars, 100 μm.
Figure 6—figure supplement 1
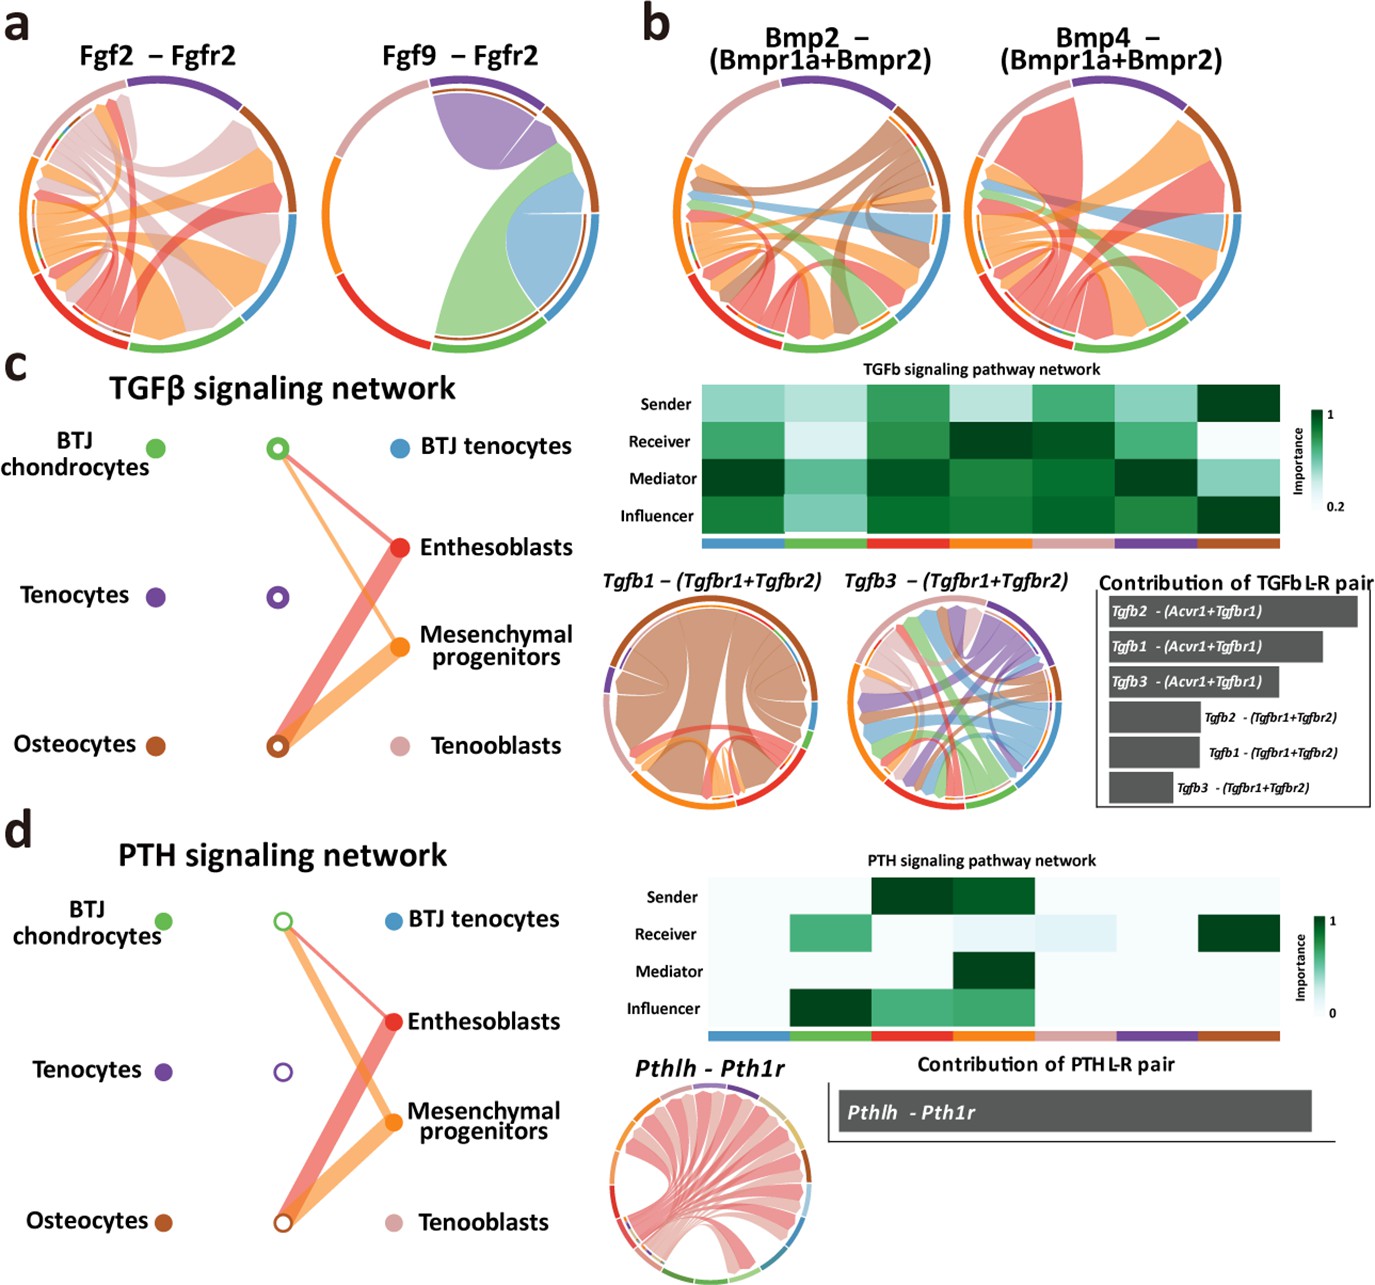
Intercellular crosstalk signaling networks regulating enthesis postnatal growth, related to Figure 6.
(a, b) Chord plots showing the ligand-receptor pairs highly expressed in bone-tendon junction (BTJ) chondrocytes. (c, d) Overview of TGFb and PTH signalings networks in enthesis development. Hierarchy plots showing the inferred signaling networks among all cell clusters. Heatmaps show the signaling roles of cell groups. Chord plots showing the ligand-receptor pairs highly expressed in the BTJ cluster.
Additional files
-
Supplementary file 1
Table Antibodies used in this study.
- https://cdn.elifesciences.org/articles/85873/elife-85873-supp1-v2.docx
-
Supplementary file 2
Filtered out genes, related to Figure 2.
- https://cdn.elifesciences.org/articles/85873/elife-85873-supp2-v2.zip
-
Supplementary file 3
Cluster markers, related to Figure 2.
- https://cdn.elifesciences.org/articles/85873/elife-85873-supp3-v2.zip
-
Supplementary file 4
Enthesis chondrocyte time-dependent markers, related to Figure 4.
- https://cdn.elifesciences.org/articles/85873/elife-85873-supp4-v2.zip
-
Supplementary file 5
Monocle3 gene module signature, related to Figure 4.
- https://cdn.elifesciences.org/articles/85873/elife-85873-supp5-v2.xlsx
-
Supplementary file 6
Pyscenic topRegulators, related to Figure 5.
- https://cdn.elifesciences.org/articles/85873/elife-85873-supp6-v2.zip
-
MDAR checklist
- https://cdn.elifesciences.org/articles/85873/elife-85873-mdarchecklist1-v2.docx
Download links
A two-part list of links to download the article, or parts of the article, in various formats.
Downloads (link to download the article as PDF)
Open citations (links to open the citations from this article in various online reference manager services)
Cite this article (links to download the citations from this article in formats compatible with various reference manager tools)
Single-cell RNA sequencing reveals cellular and molecular heterogeneity in fibrocartilaginous enthesis formation
eLife 12:e85873.
https://doi.org/10.7554/eLife.85873


