PM2.5 leads to adverse pregnancy outcomes by inducing trophoblast oxidative stress and mitochondrial apoptosis via KLF9/CYP1A1 transcriptional axis
Abstract
Epidemiological studies have demonstrated that fine particulate matter (PM2.5) is associated with adverse obstetric and postnatal metabolic health outcomes, but the mechanism remains unclear. This study aimed to investigate the toxicological pathways by which PM2.5 damaged placental trophoblasts in vivo and in vitro. We confirmed that PM2.5 induced adverse gestational outcomes such as increased fetal mortality rates, decreased fetal numbers and weight, damaged placental structure, and increased apoptosis of trophoblasts. Additionally, PM2.5 induced dysfunction of the trophoblast cell line HTR8/SVneo, including in its proliferation, apoptosis, invasion, migration and angiogenesis. Moreover, we comprehensively analyzed the transcriptional landscape of HTR8/SVneo cells exposed to PM2.5 through RNA-Seq and observed that PM2.5 triggered overexpression of pathways involved in oxidative stress and mitochondrial apoptosis to damage HTR8/SVneo cell biological functions through CYP1A1. Mechanistically, PM2.5 stimulated KLF9, a transcription factor identified as binding to CYP1A1 promoter region, which further modulated the CYP1A1-driven downstream phenotypes. Together, this study demonstrated that the KLF9/CYP1A1 axis played a crucial role in the toxic progression of PM2.5 induced adverse pregnancy outcomes, suggesting adverse effects of environmental pollution on pregnant females and putative targeted therapeutic strategies.
Editor's evaluation
This study offers a valuable finding using a mouse model exposed to PM2.5 samples collected from highly polluted city air. The solid evidence provided strongly supports the assertions of the authors that PM2.5 triggers a KLF9/CYP1A1 signaling pathway, resulting in placental dysfunction, oxidative stress, mitochondrial issues, and adverse gestational outcomes. This research holds substantial relevance for medical biologists engaged in studying environmental factors impacting maternal and fetal health.
https://doi.org/10.7554/eLife.85944.sa0Introduction
Particulate matter (PM) is one of the most widespread and harmful air pollutants, consisting of a complex mixture of airborne particles and various chemicals, such as organic chemicals, transition metal oxides, acids, dust, and sulfates (Daellenbach et al., 2020). The toxicity of PM is closely related to the properties of the particles, such as the composition, quantity, mass, shape, size, and surface area concentration (Gao et al., 2020). PM2.5 is defined as the aerodynamic diameter of less than 2.5 μm. PM2.5 has been proven to penetrate into the alveoli through inhalation, depositing on the alveolar wall and eventually enter the systemic blood circulation, leading to negative effects on primary organs, including the lung, cardiovascular, immune system, nervous system and genital system (Chu et al., 2019; Yue et al., 2019; Qiu et al., 2018). Moreover, the respirable particles have been classified as a known human carcinogen by the International Agency for Research on Cancer, with a growing number of studies uncovering the adverse effects in human and animals (Loomis et al., 2013; Jeong et al., 2021). Globally, China is considered to be one of the most severely polluting countries by PM2.5 as a result of the rapid economic development it has experienced. Long-term exposure to PM2.5 is estimated to cause around one million premature deaths annually (Xue et al., 2019). In response, the Chinese Government enacted a series of strict laws in 2013 to combat environment pollution (Huang et al., 2018). As a result, the annual average PM2.5 level in China dropped to 45.5 μg/m3 in 2017, compared to 67.4 μg/m3 in 2013 (Zhang et al., 2019). However, according to the air quality monitoring system of the United Nations Environment Program (UNEP) in cooperation with the Swiss technology company IQAir (https://www.iqair.com/), the 2021 average PM2.5 concentration in China was still 6.5 multiples of the World Health Organization’s annual air quality guideline value. PM2.5 pollution continues to be significant due to economic development and geographical conditions especially in the northern plains of China (Jin et al., 2022).
Due to the toxic action of PM2.5, mounting evidence attests that exposure to PM2.5 during pregnancy leads to a variety of adverse pregnancy outcomes, such as placental dysfunction, ovarian dysfunction, impaired fetal development, lower birth weights, preterm births, reduced gestational age, congenital disability, and stillbirth (Zhou et al., 2020; Bekkar et al., 2020; Leung et al., 2022; Wang et al., 2017). Exposure to PM2.5 during gestation can also have adversely effects on the health of the offspring, such as cardiovascular disease, respiratory damage, and neurodevelopmental impairment, as it has been reported that the etiology of many adult diseases may originate in the fetal period (Hart et al., 2021; Lavigne et al., 2016). However, most of the present research on PM2.5 in adverse obstetric outcomes is focused on the epidemiological aspects, and thus the underlying mechanisms are not yet clear. The placenta is the most important organ from the mother to deliver oxygen and nutrients to the fetus to support its regular growth. Additionally, the placenta is uniquely able to adapt to environmental changes through active metabolism to guarantee the needs of the mother and fetus (Blake et al., 2020). When exceeding the regulatory range of the placenta, PM2.5 can adversely affect the development of the placenta and the fetal growth (Iyengar and Rapp, 2001). In in vivo human placenta perfusion studies, the PM2.5 could enter the circulating bloodstream through the alveolar wall and deposited in the placenta, thus negatively affecting or even destroying placental function and creating a potential risk to the fetus (Martens et al., 2017; Michikawa et al., 2022). Previous studies have found that urban PM2.5 affects the function of the placenta, such as placental thrombosis, chorioamnionitis, and inadequate trophoblast formation and invasion, which adversely impacts fetal growth by interfering with mother-fetus interactions (Martens et al., 2017; Ghosh et al., 2021; Guo et al., 2021). PM2.5 exposure during pregnancy also induces abnormal alterations in the placental genome DNA methylation profile, which is primarily concentrated in genes associated with reproductive development, immune regulation and material metabolism (Nawrot et al., 2018). Moreover, Nääv Å et al. demonstrated that PM2.5 caused placental trophoblast cytotoxicity, impaired hormone regulation, inflammation and oxidative stress (Nääv et al., 2020). However, as a significant target of PM2.5 stimulation, the underlying molecular mechanisms associated with placental trophoblastic PM2.5 exposure have not been completely elucidated.
Metabolism of xenobiotics by cytochrome P450 signaling pathway is mainly responsible for the intracellular degradation of exogenous substances such as polycyclic aromatic hydrocarbons (PAHs), halogen-containing organic compounds and heterocyclic amines (Lu et al., 2021). As a cytochrome P450 (CYP) enzyme, CYP1A1 plays an essensial role in the metabolism of endogenous substrates (such as hormones 17β estradiol [Kisselev et al., 2005], melatonin [Goh et al., 2021], inflammatory mediators arachidonic acid [Sroczyńska et al., 2022] and eicosapentaenoic acid [Schwarz et al., 2004]) and exogenous substrates (such as PAHs [Chen et al., 2022b], doxin [Molcan et al., 2017], and halogenated aromatic hydrocarbons [Kasai et al., 2008]). Many PAH compounds, such as benzo[a]pyrene, are not toxic in themselves and only become cytotoxic and carcinogenic after activation by CYP1A1. For example, CYP1A1 converts benzo[a]pyrene into the carcinogenic 7,8-dihydroxy-9,10-epoxybenzo[a]pyrene by multiple oxidation steps which causes severe oxidative damage to cells by generating excess reactive oxygen species (ROS) (Zajda et al., 2019; Gastelum et al., 2020). It has been proven that PM2.5 contributes to the increase of CYP1A1 in human neutrophils, bronchial epithelial cells, and alveolar macrophage due to the adsorption of adsorbs aromatic hydrocarbons on their surface, which in-turn inducing oxidative stress, inflammatory responses, and apoptosis (Chen et al., 2019; Van Winkle et al., 2015; Abbas et al., 2009). Yue C et al. also found that PM2.5 induced malformations in zebrafish embryonic heart development by activating CYP1A1 (Yue et al., 2017). However, very little research has examined the role of CYP1A1 in PM2.5 induced placental dysplasia and adverse pregnancies.
Our previous epidemiological study identified that prenatal exposure to increased PM2.5 could shorten the gestation period and increased the risk of preterm birth in Jinan, the capital of Shandong Province, China (Wang et al., 2022). Jinan is a large city in northern China, with an area of 7.6×10³ km2 and a population of more than 9 million, and its geographical structure is a typical basin texture surrounded by mountains on 3 of its 4 sides, hindering the dispersion of environmental pollutants. In this study, we collected PM2.5 from the atmosphere in the urban area of Jinan to investigate its effects on the placenta and on pregnancy outcomes. First, scanning electron microscope (SEM) and energy dispersive spectroscopy (EDS) were used to analyze the morphology of PM2.5 particles and the elemental composition. We then investigated the effects of PM2.5 on pregnancy outcomes, placental function of mice and trophoblast cell line HTR8/SVneo. Subsequently, we performed a comprehensive analysis of the transcriptional landscape of PM2.5-exposed trophoblast cells by RNA-Seq. We found that the activation of the cytochrome P450 pathway was most prominent after PM2.5 exposure and verified that PM2.5 could trigger oxidative stress resulting in mitochondrial apoptosis, with CYP1A1 being the key gene involved in this process. Based on bioinformatics analysis, we further found for the first time that PM2.5 activated the transcription factor KLF9, which transcriptionally promoted the expression of CYP1A1, thereby modulating oxidative stress damage and mitochondrial apoptosis. Overall, this research elucidated the mechanism of PM2.5-mediated trophoblast apoptosis and adverse pregnancy outcomes, suggesting that the KLF9/CYP1A1-related pathway could be a promising target for clinical prevention and treatment.
Results
Characterization of PM2.5
Microscopic morphology and structure analysis of PM2.5 particles was performed using SEM coupled with EDS. As shown in Figure 1B, we explicitly observed that the PM2.5 particles had randomly aggregated and scattered in the field of view, with most of them being less than 2.5 μm in length. The particles were primarily flocculent in shape, with only a few flakes and rods. Elemental analysis is conclusive evidence that directly indicated the source of pollution. Therefore, we randomly selected three locations of the collected PM2.5 to detect and quantify the elemental composition by EDS. As shown in Figure 1C, the elements O, N, and C were predominantly present, while other elements such as Cl, Si, and the heavy metals S, Al, and Ni were also detected. The proportion of the elements displayed the following trend: O>N > C>Cl > Si>S > Na>K > Al>Ca > Ni.

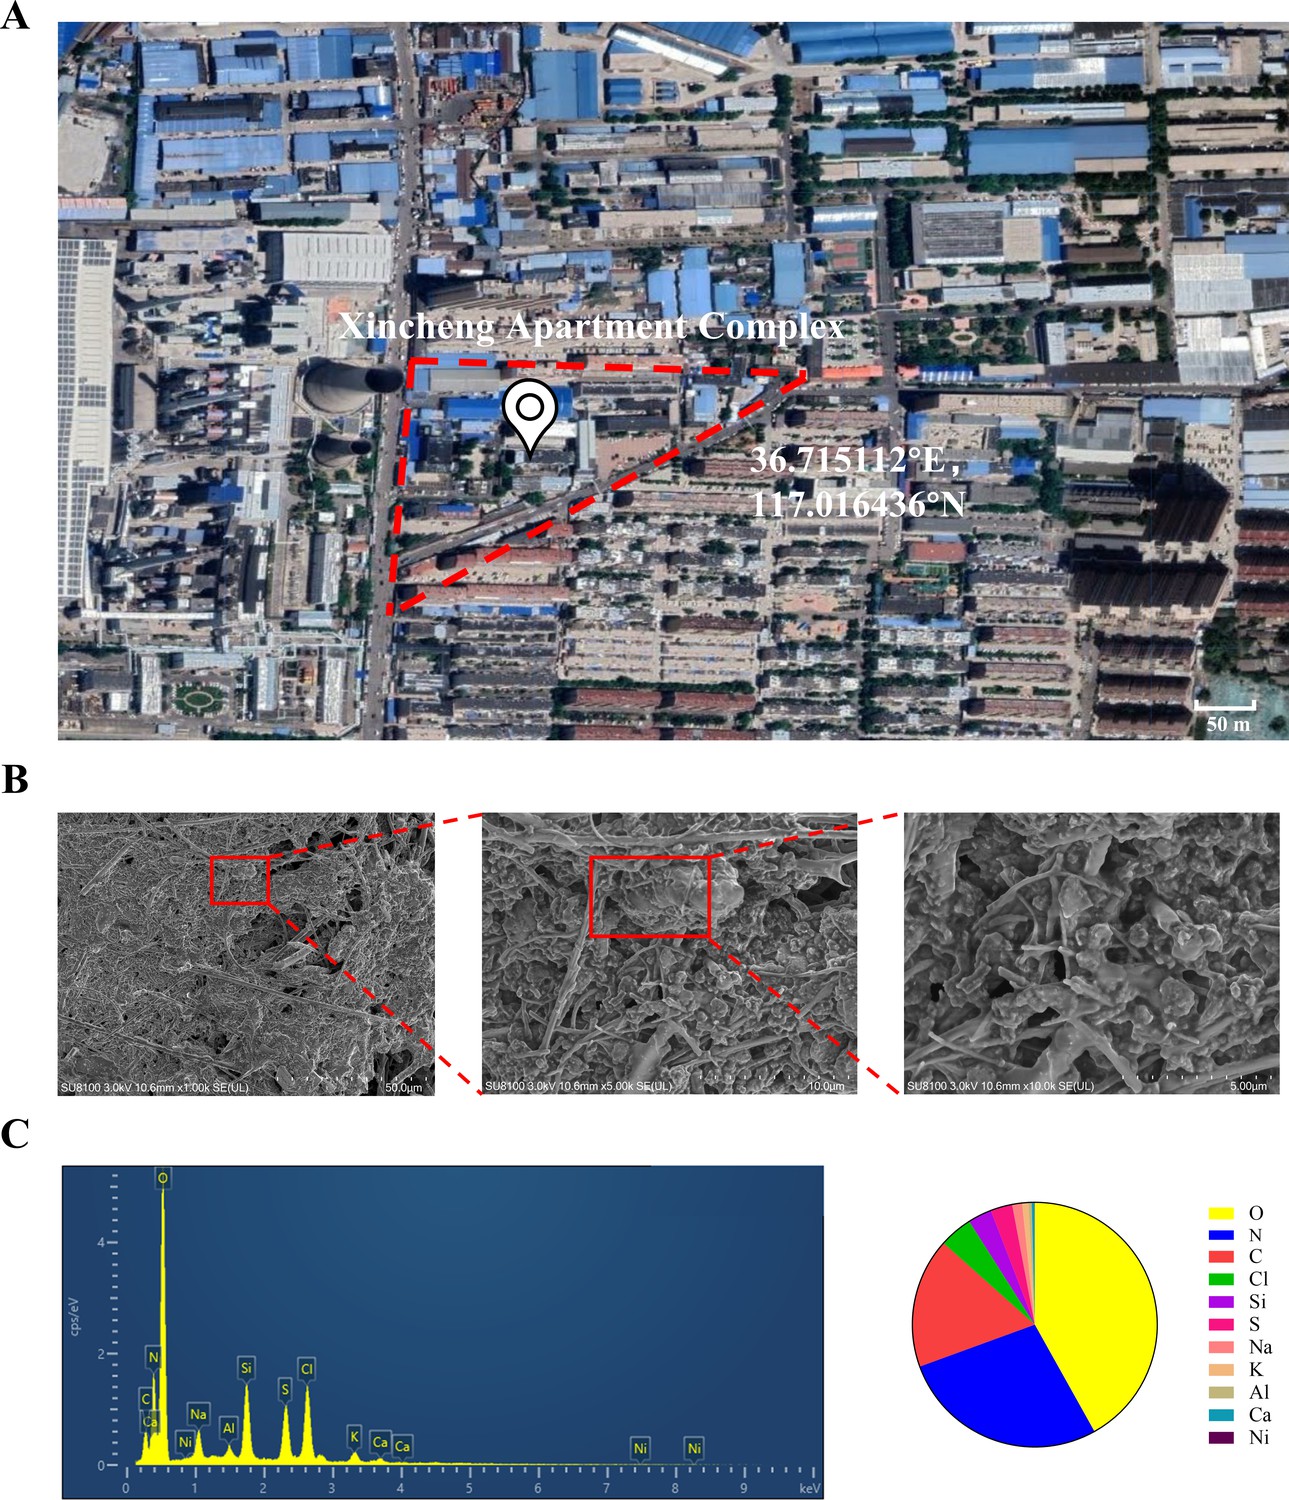
The geographic location of the PM2.5 collection site and analysis of PM2.5 morphological and elemental composition.
(A) Map and coordinates of the PM2.5 sampling site. The image was obtained from Google Maps. (B) SEM images of PM2.5 in an enlarged field. Scale bar, 50 μm (left image), 10 μm (middle image) and 5 μm (right image). (C) Analysis of PM2.5 elemental composition via SEM coupled with EDS.
Gestational PM2.5 exposure results in adverse pregnancy outcomes and impaired placental development
The PM2.5-exposed mouse model was established by intratracheal instillation of PM2.5 at 1.5 d, 7.5 d, and 12.5 d of pregnancy (Figure 2A). The amount of PM2.5 particulate in the tracheal droplets was calculated based on 2020 PM2.5 exposure of pregnant women in Jinan, Shandong province (Wang et al., 2022), combined with physiological indicators of pregnant mice (Vermillion et al., 2018). Mice were euthanized and dissected on 15.5 d, and the weight of the fetus, the number of fetuses, and the weight of the placenta were assessed. As shown in Figure 2B and C, PM2.5 treatment resulted in a significant reduction in fetal numbers, embryo resorption, and the increase of stillbirths (n=8). The weight of the placenta of the pregnant mice was also decreased. These results suggested that PM2.5 had a deleterious effect on the placenta and fetal development in vivo. Next, we examined the tissue and cellular structure of the placenta by HE staining. As shown in Figure 2D, the placental cells in the normal group were well differentiated and densely arranged, with uniform and regular intercellular gaps; the capillaries were evenly distributed and a large number of red blood cells were visible in the vessels. Notably, compared with the control group, the cells of the labyrinth layer in the PM2.5-exposed group were loosely distributed, and disorganized, with more vacuoles and larger intercellular gaps. The distribution of the placental capillaries was reduced and the number of red blood cells was significantly lower. In addition, we used TUNEL staining to detect the occurrence of apoptosis in the placental cells and fluorescent staining with CK-7 to label trophoblast cells. As shown in Figure 2E, PM2.5 exposure resulted in increased levels of apoptosis in the mouse placental labyrinth cells compared with the normal group, with apoptosis being primarily observed in the trophoblasts of the mouse placental labyrinth. Apoptosis was also evident below the labyrinth layer in the PM2.5-exposed group. This site was dominated by fetal mouse umbilical cords, and increased apoptosis in this area could be caused by placenta prolonged placement during placental removal or external damage. The expression of apoptosis-related proteins including cleaved-caspase 3, BCL-2 and BAX were measured using western blotting (n=3), which also confirmed the increased levels of apoptosis in the placenta of PM2.5-exposed mice (Figure 2F). In summary, PM2.5 exposure resulted in poor pregnancy outcomes in mice, and this was most likely related to cellular damage and apoptosis in the placenta.

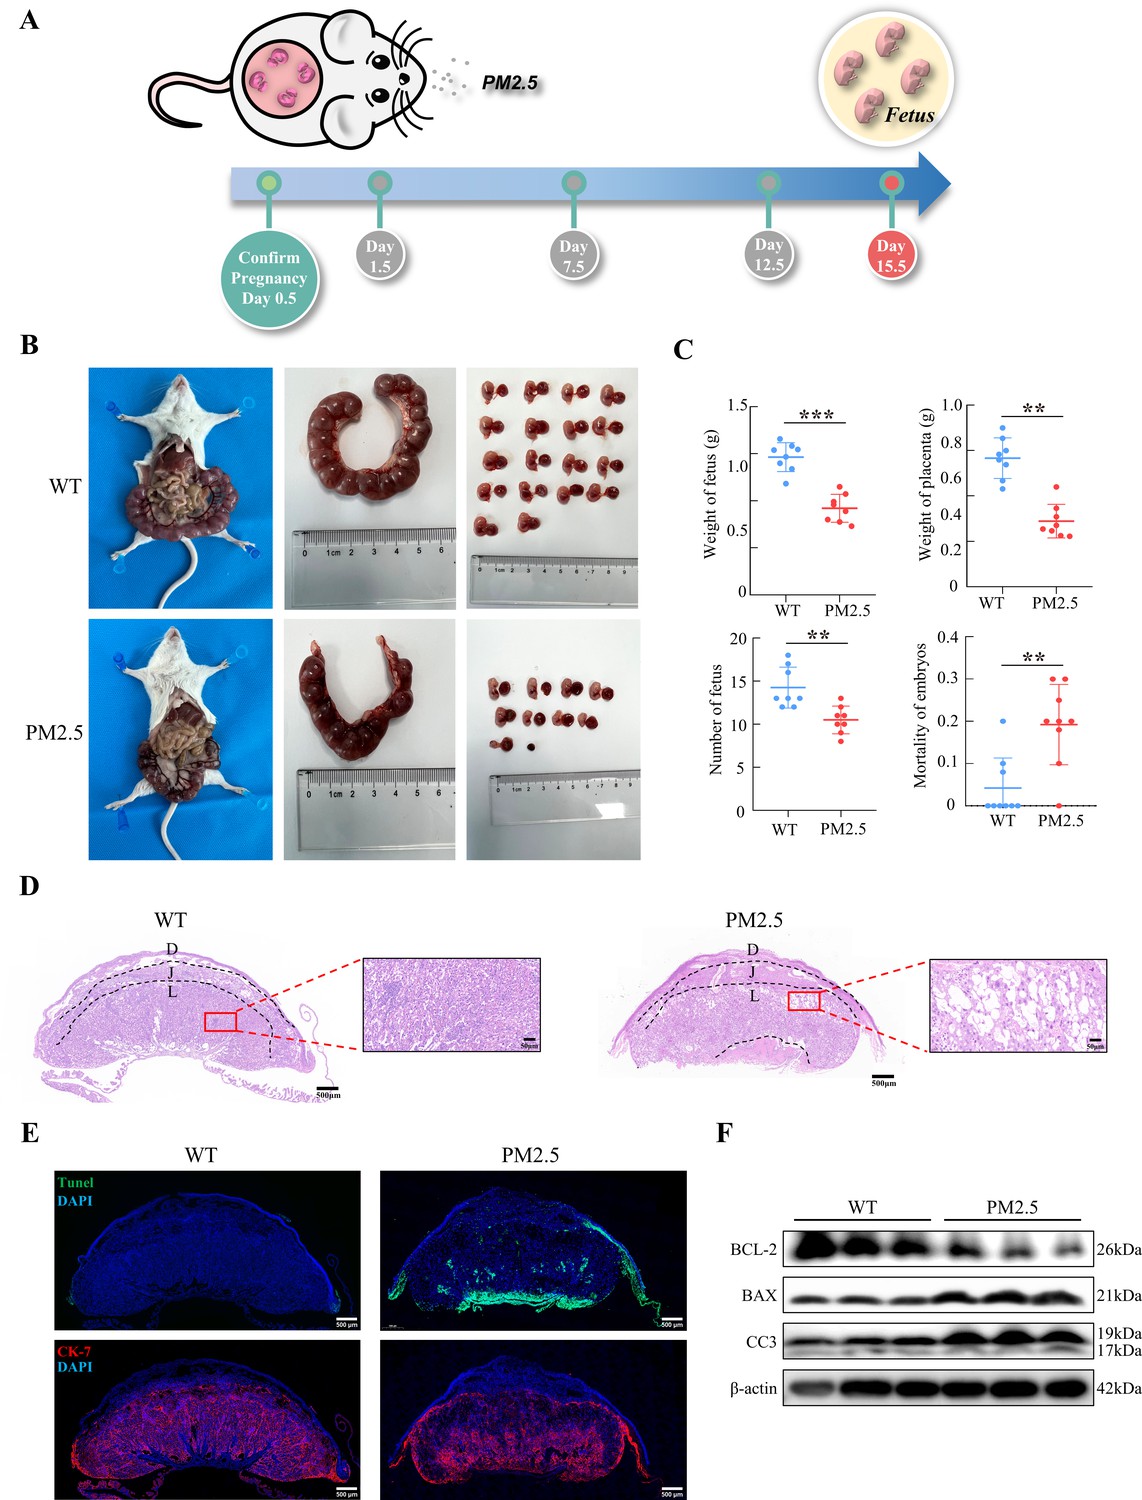
Gestational PM2.5 exposure resulted in adverse pregnancy outcomes and impaired placental development in mice.
(A) Schematic diagram of the in vivo exposure model constructed by intratracheal instillation of PM2.5 in mice at 1.5 d, 7.5 d, and 12.5 d of pregnancy. (B) Representative images of uterine, fetal, and placental morphology in wild-type and PM2.5 exposed mice at 15.5 d of gestation. (C) The effect of PM2.5 on the fetus and placenta, including the weight of the fetus, the weight of the placenta, the number of the fetuses, and the mortality of the embryos (n=8, the dots in the top two graphs indicate the average placental or fetal mouse weight per pregnant mouse) (**, p<0.01; ***, p<0.001). (D) Representative HE staining of placental tissues from the wild-type and PM2.5-exposed mice. Compared with the wild-type placental tissues, the labyrinth layer in the PM2.5-exposed group was loosely distributed and disorganized, with a large number of vacuolated structures and large intercellular gaps (D: Decidual; J: Junctional zone; L: Labyrinth). Scale bar, 500 μm (upper images) and 50 μm (lower images) (E) Apoptosis of placental cells was detected by TUNEL staining. TUNEL: apoptotic cells; DAPI: nuclei; CK-7: trophoblast cells. Scale bar, 500 μm. (F) The expression of apoptosis-related proteins in the placental tissue of mice was detected by western blotting. PM2.5 decreased the expression of the anti-apoptotic protein BCL-2 and increased the expression of the pro-apoptotic proteins BAX and Cleaved-caspase 3 (CC3).
-
Figure 2—source data 1
Labelled gel images.
(Figure 2F-BCL-2) The expression of BCL-2 expression in the placental tissue of Wild Type (The first three columns) and PM2.5-treated mice (the last three columns). (Figure 2F-BAX) The expression of BAX expression in the placental tissue of Wild Type (The first three columns) and PM2.5-treated mice (the last three columns). (Figure 2F-CC3) The expression of Cleaved-Caspase 3 expression in the placental tissue of Wild Type (The first three columns) and PM2.5-treated mice (the last three columns). (Figure 2F-β-actin) The expression of β-actin expression in the placental tissue of Wild Type (The first three columns) and PM2.5-treated mice (the last three columns).
- https://cdn.elifesciences.org/articles/85944/elife-85944-fig2-data1-v2.zip
-
Figure 2—source data 2
Raw unlabelled gel images.
(Figure 2F-BCL-2) The expression of BCL-2 expression in the placental tissue of Wild Type (The first three columns) and PM2.5-treated mice (the last three columns). (Figure 2F-BAX) The expression of BAX expression in the placental tissue of Wild Type (The first three columns) and PM2.5-treated mice (the last three columns). (Figure 2F-CC3) The expression of Cleaved-Caspase 3 expression in the placental tissue of Wild Type (The first three columns) and PM2.5-treated mice (the last three columns). (Figure 2F-β-actin) The expression of β-actin expression in the placental tissue of Wild Type (The first three columns) and PM2.5-treated mice (the last three columns).
- https://cdn.elifesciences.org/articles/85944/elife-85944-fig2-data2-v2.zip
PM2.5 impairs multiple biological functions of placental trophoblast cells
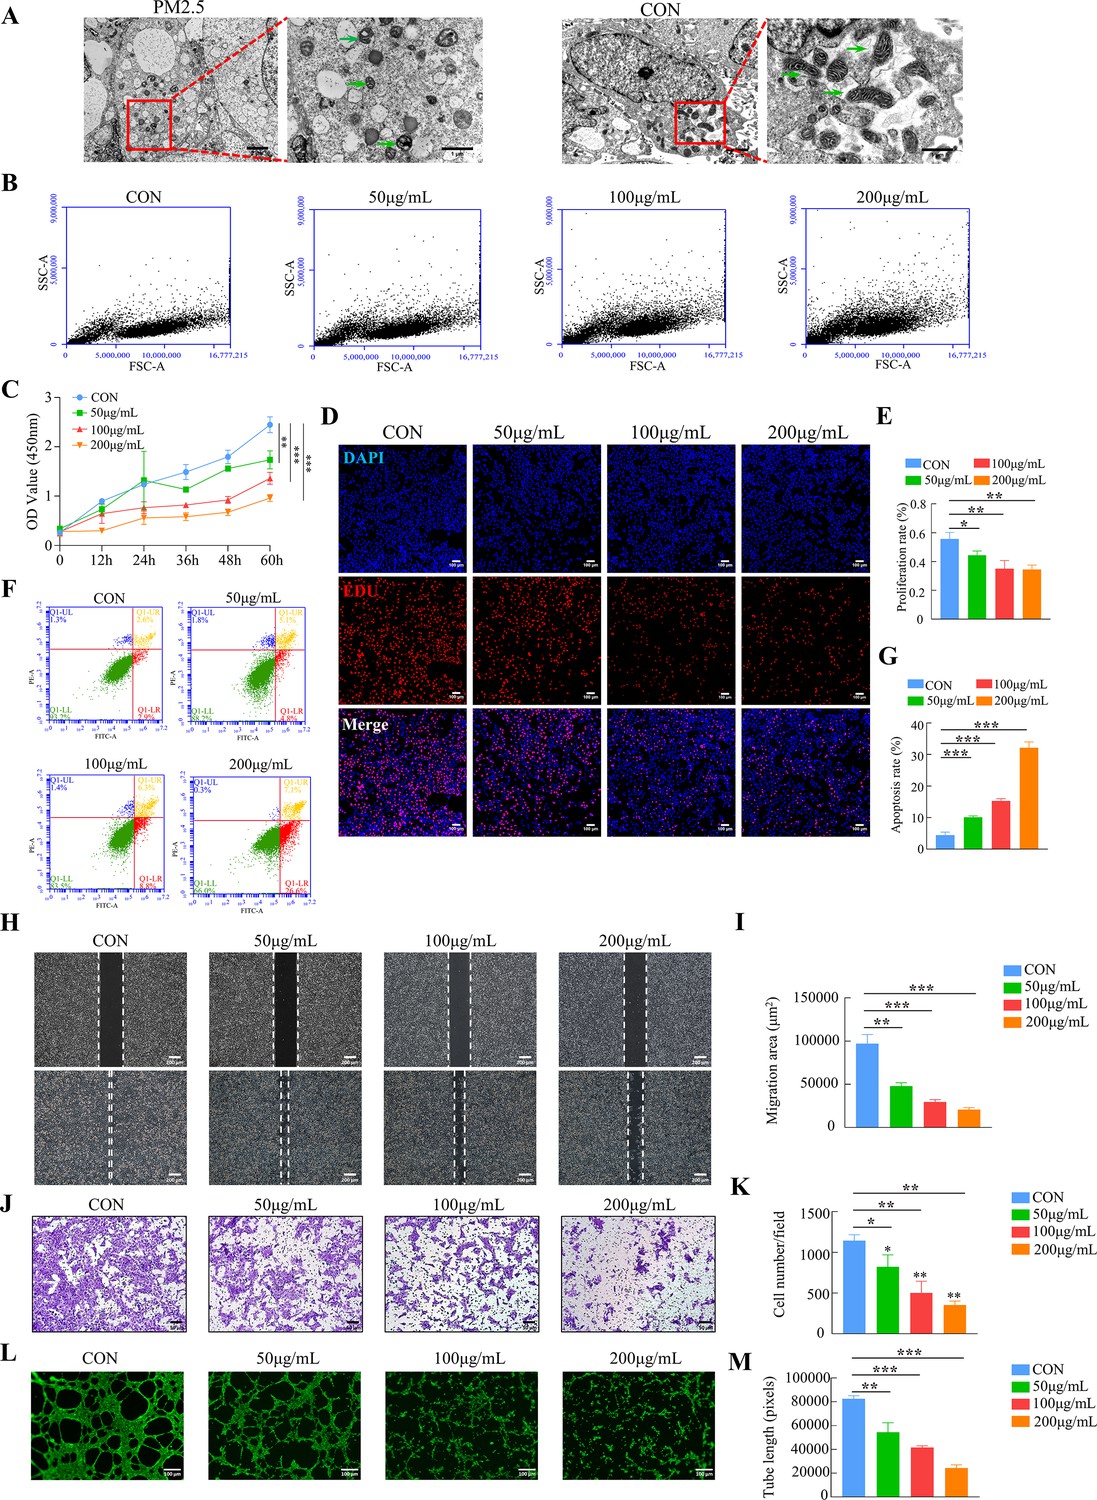
The placental trophoblast cell line HTR8/SVneo was incubated with different concentrations of PM2.5 (50, 100, and 200 μg/ml) for 24 hr based on previous studies (Duan et al., 2020; Guo et al., 2022). Transmission electron microscopy clearly indicated that PM2.5 particles significantly changed the morphology of the cells (Figure 3A). Compared with the control group, the PM2.5-exposed cells were swollen and deformed, with a large number of vacuoles in the cytoplasm, and with mitochondria exhibiting visibly damaged intracellular ultrastructure. The mitochondria in the cells of the PM2.5-exposed group were round or oval, with some becoming solid. The mitochondrial volume was reduced, the matrix was thickened, the cristaes were inconspicuous, and the interior of the mitochondria were precipitated with dense, indefinite material. Flow cytometry was used to assess whether cells had taken up PM2.5 based on the changes of the SSC-A (Side Scatter Area) values (Zhao and Ibuki, 2015). As shown in Figure 3B, the FSC-A remained largely the same as the control group after PM2.5 treatment, but the SSC-A increased significantly in a concentration-dependent manner. This result further proved that PM2.5 could be taken up by HTR8/SVneo cells. CCK-8 assays showed that PM2.5 significantly inhibited cell proliferation with a concentration-dependent way (Figure 3C). EDU staining results also showed that PM2.5 significantly inhibited cell proliferation (Figure 3D and E). When the PM2.5 concentration reached 100 μg/mL, cell proliferation decreased by nearly 50%. Annexin V-FITC/PI staining and flow cytometry analysis were used to detect cell apoptosis and it was found that PM2.5 significantly increased cell apoptosis (Figure 3F and G). The wound healing assay was carried out to assess the migration of HTR8/SVneo cells. The results indicated that the cells in the PM2.5-exposed group migrated more slowly compared to the corresponding migration rate in the control group (Figure 3H and I). In support of this, the Transwell invasion assays showed that the invasive activity of PM2.5-exposed HTR8/SVneo cells was significantly reduced, with very few cells visible across the bottom membrane at PM2.5 concentrations up to 200 μg/mL (Figure 3J and K). Finally, we detected the angiogenic ability of HTR8/SVneo cells, a process that mimics the formation of blood vessels after trophoblast invades the endometrium (Belyakova et al., 2019). As expected, PM2.5 had a detrimental effect on angiogenesis in trophoblast cells, and we found that at PM2.5 concentrations of 200 μg/mL, cells were largely unable to form lumen structures (Figure 3L and M). In conclusion, these results confirmed that PM2.5 could be phagocytosed by placental trophoblasts and it impaired trophoblast biological functions including invasion, migration, tube formation, while increasing apoptosis.

PM2.5 impaired the biological functions of HTR8/SVneo.
(A) Representative TEM images of morphological changes of HTR8/SVneo caused by PM2.5. The green arrows indicated mitochondria in the cell. Scale bar, 2 μm (left images) and 1 μm (right images) (B) Detection of PM2.5 particles internalized by HTR8/SVneo cells using flow cytometry. The horizontal coordinates of the FSC-A represented the size of the particles, and the vertical coordinates of the SSC-A represented intracellular particle complexity. (FSC-A: Forward Scatter-Area; SSC-A: Side Scatter-Area) (C) Proliferation curves were determined by CCK-8 assays. The plots represented the proliferative ability of HTR8/SVneo cells. (D) Representative images showing the suppressed proliferation of HTR8/SVneo cells by PM2.5. The nuclei were stained with DAPI (blue), the cells in the proliferation stage were stained with EDU (red). Scale bar, 100 μm. (E) Quantitative analysis of the proliferation rate of HTR8/SVneo cells. (F) Annexin V-FITC/PI staining and flow cytometry analysis were used to determine the percentage of apoptotic cells following treatment with different concentrations of PM2.5. (G) Histogram analysis indicated the apoptotic rate of the cells in each group. (H) Representative images of the wound healing assay of HTR8/SVneo cells at 0 and 24 hr time points following treatment with different concentrations of PM2.5. Scale bar, 200 μm. (I) The histogram indicated the migration area (μm2) in each group. (J) The representative images of Transwell invasion assay at 24 h in the different groups. Scale bar, 50μm. (K) The histogram indicated the proportion of cells in each group. (L) Representative images showing cell tube formation following treatment with different concentrations of PM2.5 for 4 hr. Scale bar, 100μm. (M) The histogram indicated the comparison of the tube length of HTR8/SVneo cells (*, p<0.05; **, p<0.01; ***, p<0.001).
Identification of PM2.5-exposed trophoblast gene expression profiles using high-throughput sequencing
To elucidate the molecular mechanism by which PM2.5 affected trophoblast biological functions, we performed RNA-Seq analysis. After analyzing a total of 17,795 genes identified in the sequencing data, the dispersion of the expression distribution of these genes was determined (Figure 4—figure supplement 1A), and the density plot in Figure 4—figure supplement 1B demonstrated the trends and regions of gene abundance with expression in the samples. In addition, 3D principal component analysis showed that the clusters of samples with high similarity were consistent with the actual exposure grouping, suggesting that PM2.5 significantly changed the gene expression of the HTR8 cells (Figure 4—figure supplement 1C). By applying the cut-off criteria of Q value﹤0.05 and |log2[Fold Change]|≥1, we identified 32 coding genes that exhibited differential expression between the control and PM2.5 treatment groups, comprising 24 up-regulated genes and 8 down-regulated genes. These findings were visually represented through volcano plots and heat maps (Figure 4A and B). The KEGG pathway enrichment analysis was performed to predict the potential regulatory mechanisms of PM2.5-induced trophoblast damage (Figure 4C and D). Our findings were further supported by GSEA, which revealed significant upregulation of four enriched pathways - cytochrome P450 pathway, chemical carcinogenesis pathway, ovarian steroidogenesis pathway and Steroid biosynthesis pathway - in the PM2.5-exposed group (Figure 4E). The results from both analyses suggest that cytochrome P450 is the most significantly enriched pathway. Activation of this pathway mediates oxidative stress and modifies mitochondrial function, while exacerbating the production and accumulation of toxic metabolic intermediates, typically reactive oxygen species (ROS) (Yuan et al., 2019; Martínez et al., 2018; Leung et al., 2013). We hypothesized that the cytochrome P450 pathway may play a key role in PM2.5-induced placental pathogenesis.

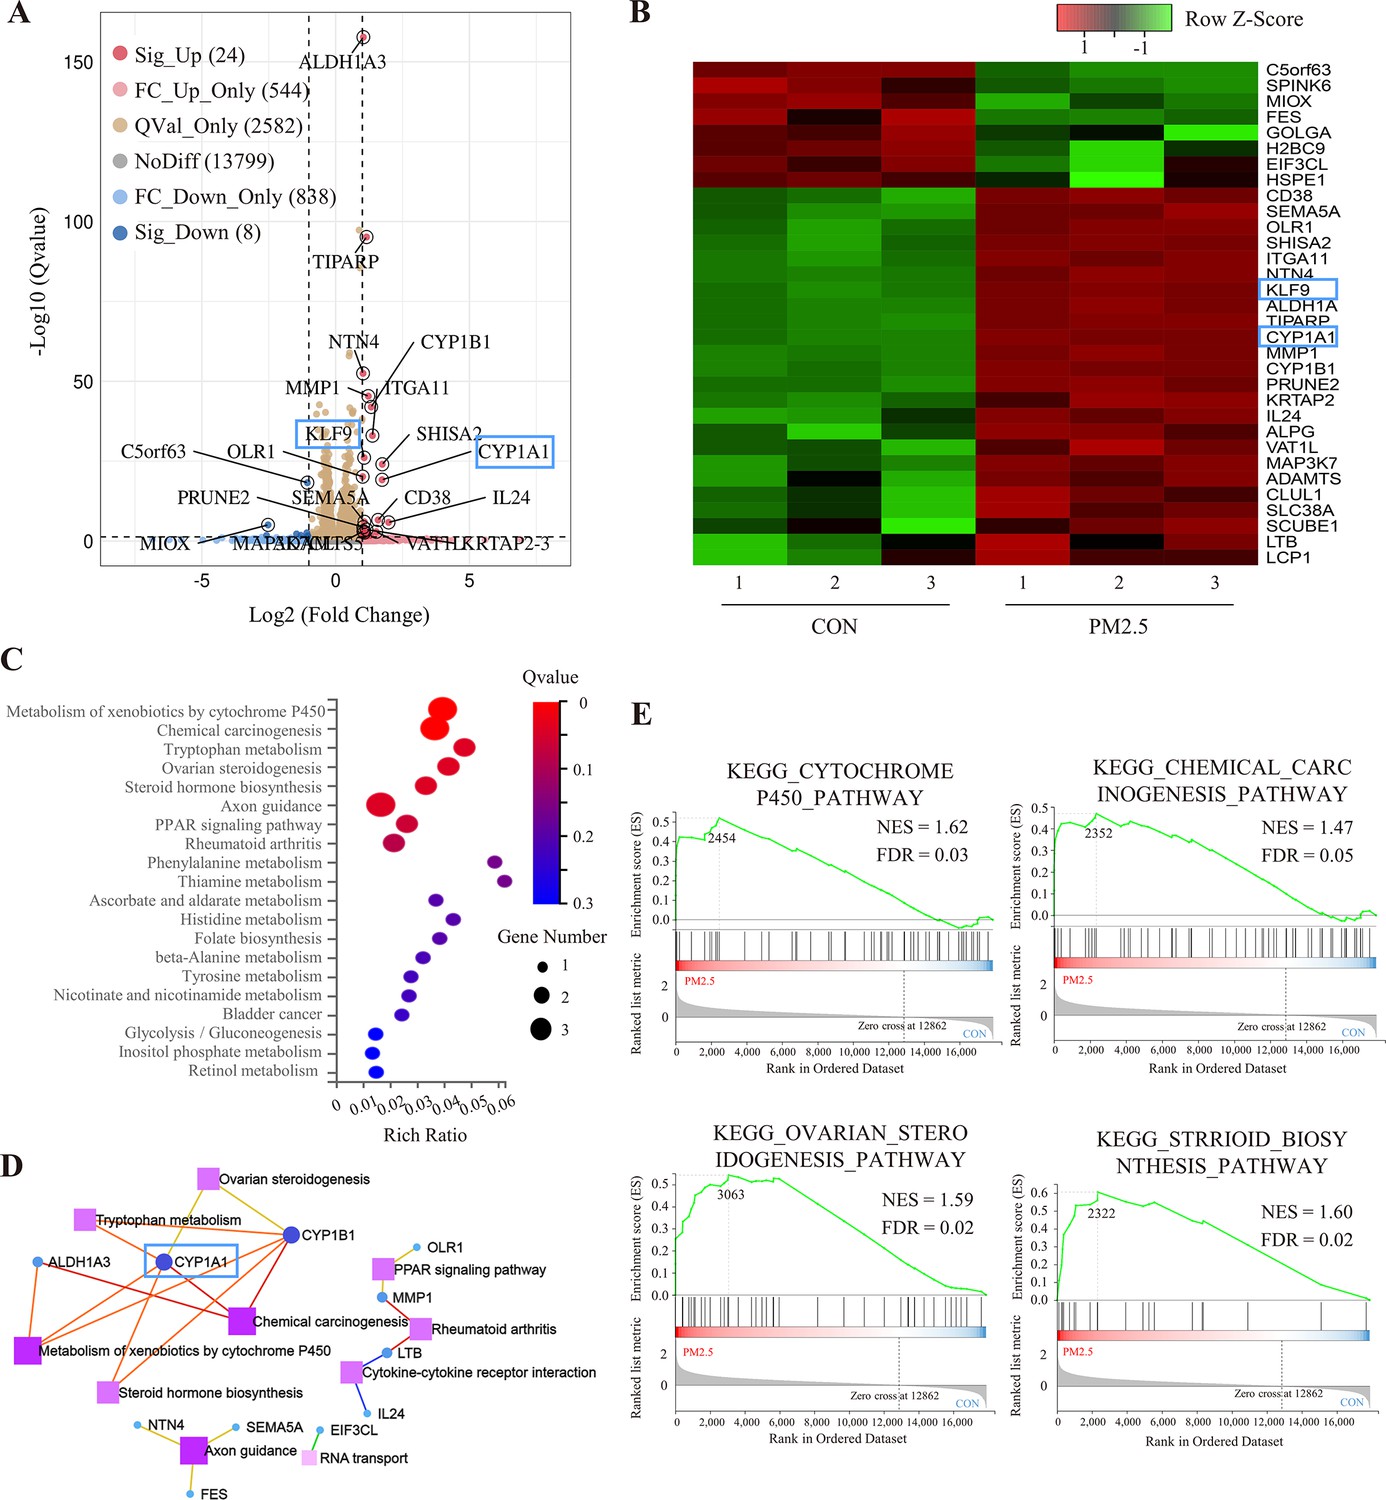
RNA sequencing and bioinformatic analysis of PM2.5-induced genomic alterations in HTR8/SVneo cells.
(A) Volcano plot of the differentially expressed genes (DEGs) in the RNA-Seq (Qvalue <0.05; |Log2 (fold change) |>1). (B) Heat map visualization of sequencing data with the Row Z-Score scaling method for gene expression between samples. (C) Bulb map of KEGG analysis for the DEGs. The rich ratio represented the enrichment degree of DEGs. (D) Topological networks based on altered gene enrichment analysis. (E) GSEA of RNA-Seq data showed the enrichment of genes in the pathway. The zero-cross line indicates the point in which the difference between expression in the PM2.5-treated and control groups is zero. NES, normalized enrichment score; FDR, false discovery rate.
PM2.5 induces trophoblast damage by triggering oxidative stress
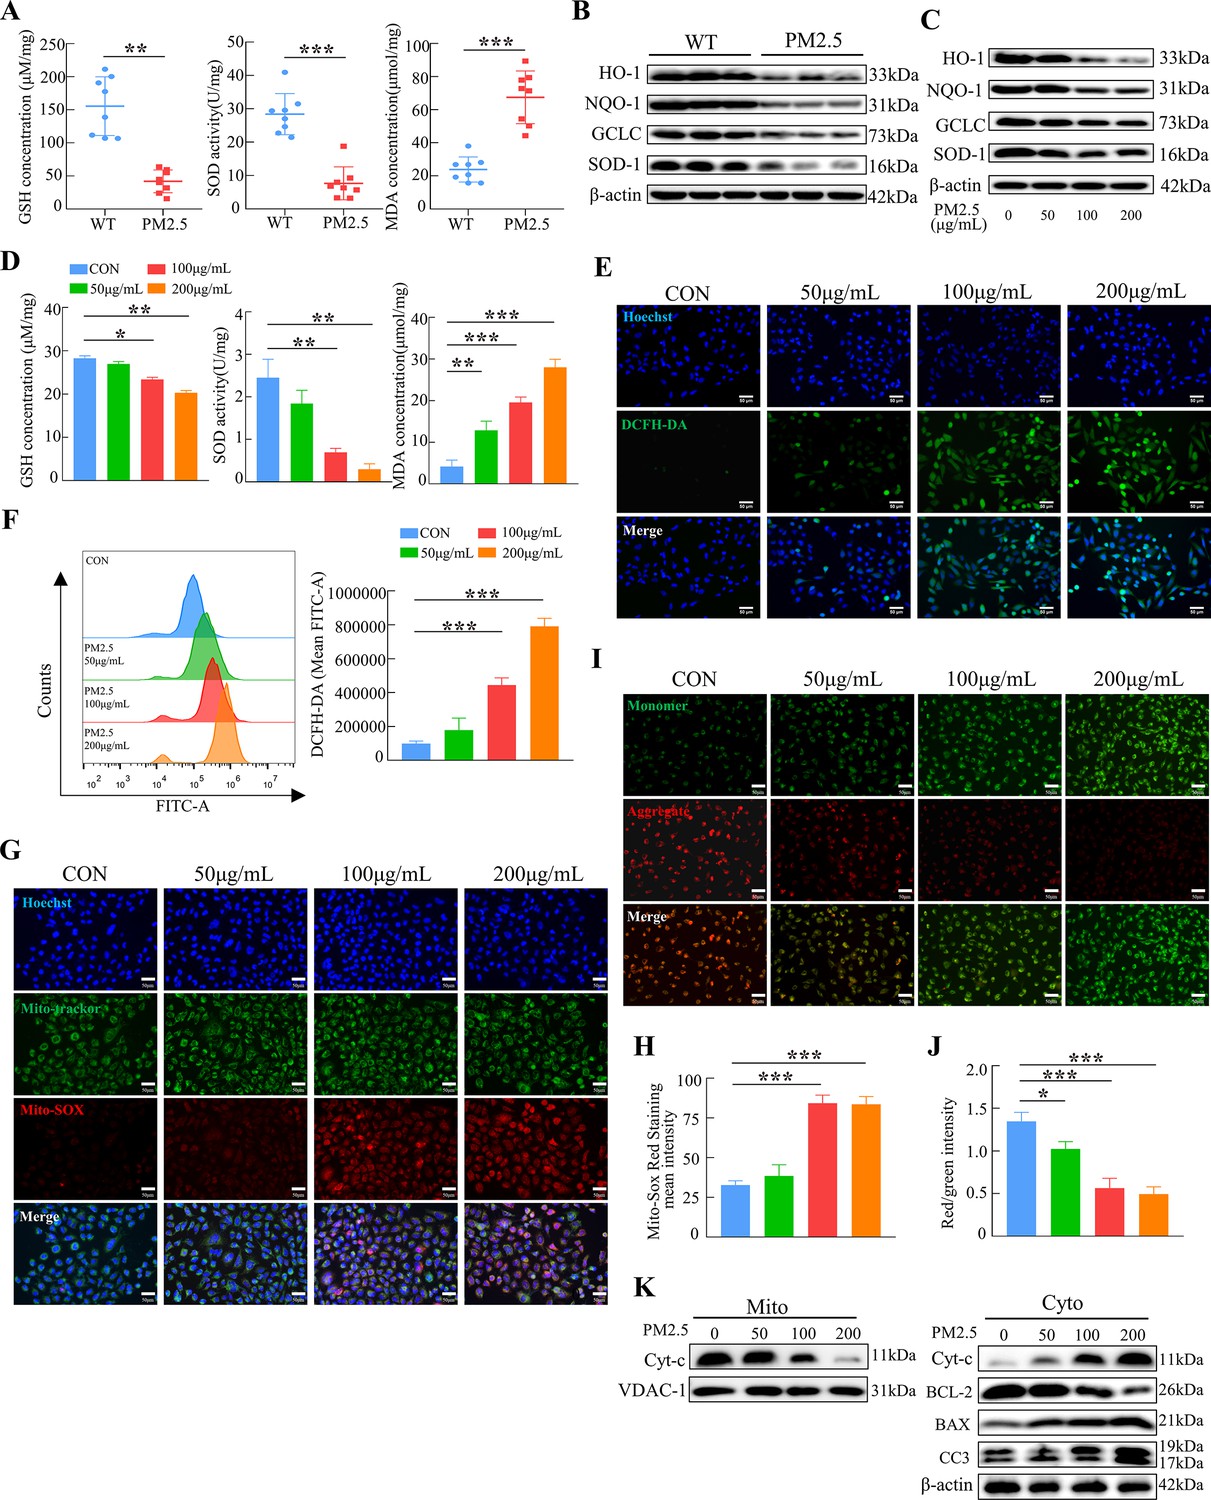
To verify whether oxidative stress was involved in the adverse effect of PM2.5, we first detected the levels of GSH, SOD, and MDA in the placenta of mice after PM2.5 exposure. As shown in Figure 5A, PM2.5 exposure resulted in a significant decrease in GSH and SOD level and a considerable increase in MDA levels in the mouse placental tissues (n=8). We further detected the expression of the antioxidant proteins heme oxygenase-1 (HO-1), NADPH quinone oxidoreductase 1 (NQO-1), glutamate-cysteine ligase (GCLC), and superoxide dismutase 1 (SOD-1) in mice placenta by western blotting. The results showed that PM2.5 exposure resulted in reduced expression of these antioxidant proteins in the placenta (n=3) (Figure 5B). These results confirmed that PM2.5 exposure caused oxidative stress in the PM2.5- exposed mice’s placenta. Additionally, the expression of the antioxidant proteins HO-1, NQO-1, GCLC, and SOD-1 was reduced after PM2.5 exposure in the placental trophoblast cell line HTR8/SVneo cells (Figure 5C). The expression of GSH, SOD, and MDA in HTR8/SVneo was consistent with the above results in the mice placental tissues (Figure 5D). The ROS levels were measured by cellular immunofluorescence staining and flow cytometry, and the results showed that there was a significant increase in the PM2.5-exposed cells (Figure 5E and F). Based on these results, it was hypothesized that PM2.5 induced oxidative stress damage by disrupting the intracellular antioxidant system, contributing to a large accumulation of intracellular ROS. As mentioned above, severe damage to intracellular mitochondrial morphology was observed by transmission electron microscopy (Figure 3A). Therefore, we detected the mitochondrial ROS levels using the Mito-SOX probe. The results revealed a considerable increase in the level of ROS in the mitochondria with increasing PM2.5 concentration (Figure 5G and H). Previous studies found that the accumulation of mitochondrial ROS led to a decrease in mitochondrial membrane potential, resulting in the impairment of mitochondrial function and causing the development of mitochondrial apoptosis in cells (Hsieh et al., 2019; Rizwan et al., 2020). The JC-1 probe was used to detect changes in the levels of the mitochondrial membrane potential. As shown in the Figure 5I and J, the mitochondrial membrane potential in the control group of HTR8/SVneo cells was high, and after the addition of PM2.5, the red fluorescence of JC-1 diminished and gradually showed green fluorescence, representing a decrease in the mitochondrial membrane potential. Consistently, we extracted and separated the mitochondrial proteins and cytoplasmic proteins to examine the expression of mitochondrial apoptosis-related proteins via western blotting. The results indicated that PM2.5 induced the translocation of cytochrome C from the mitochondria to the cytoplasm, and the expression of BCL-2 was decreased, whilst BAX and cleaved-caspase 3 expression were elevated (Figure 5K). This suggested that PM2.5 triggered the occurrence of mitochondrial apoptosis by causing oxidative stress in HTR8/SVneo cells.

PM2.5 impaired the biological functions of HTR8/SVneo cells by triggering oxidative stress.
(A) Detection of GSH, SOD, and MDA expression levels in the placenta of wild-type and PM2.5 exposed mice (n=8, one randomly selected placental sample per mouse). (B) Expression of antioxidant-related proteins HO-1, NQO-1, GCLC, and SOD-1 in the placenta of wild-type and PM2.5-exposed mice by western blotting (n=3). (C) Expression of antioxidant-related proteins HO-1, NQO-1, GCLC, and SOD-1 in HTR8/SVneo cells treated with different concentrations of PM2.5 (50 μg/mL, 100 μg/mL, and 200 μg/mL) by western blotting. (D) Detection of GSH, SOD, and MDA expression levels in HTR8/SVneo treated with different concentrations of PM2.5 (50 μg/mL, 100 μg/mL, 200 μg/mL). (E) Detection of intracellular ROS levels by DCFH-DA probe staining following treatment with different concentrations of PM2.5 (50 μg/mL, 100 μg/mL, 200 μg/mL). The nuclei were counter stained with Hoechst (blue), and ROS were stained with DCFH-DA (green). Scale bar, 50 μm. (F) Quantitative detection of intracellular ROS levels by flow cytometry after staining with DCFH-DA. The histogram indicated the mean levels of FITC fluorescence in each group. (G) Mitochondrial ROS levels in HTR8/SVneo treated with different concentrations of PM2.5 (50 μg/mL, 100 μg/mL, 200 μg/mL). Hoechst was used to counterstain the nuclei; Mito-tracker was used to stain the mitochondria; Mito-SOX was used to stain the mitochondrial ROS. Scale bar, 50 μm. (H) The histogram indicated the Mito-SOX Red Staining mean intensity in each group. (I) Mitochondrial membrane potential was assessed using JC-1 staining following treatment with different concentrations of PM2.5 (50 μg/mL, 100 μg/mL, 200 μg/mL). When the mitochondrial membrane potential was high, JC-1 aggregated in the mitochondrial matrix, forming J-aggregates, which fluoresced red; when the mitochondrial membrane potential was low, JC-1 did not aggregate in the mitochondrial matrix, thus, JC-1 was present as a monomer, which fluoresced green. Scale bar, 50 μm. (J) The histogram indicated the Red/Green intensity in each group. (K) Expression of mitochondrial apoptosis-associated proteins in the mitochondria and cytoplasm using western blotting following treatment with different concentrations of PM2.5 (50 μg/mL, 100 μg/mL, 200 μg/mL). Cytochrome C (Cyt-C) expression was detected in the mitochondria, while Cyt-C, BCL-2, BAX and Cleaved-caspase 3 (CC3) expression levels in the cytoplasm were detected. The mitochondrial marker VDAC and the cytosol marker β-actin were used to identify the purity of the mitochondria in the extracts (*, p<0.05; **, p<0.01; ***, p<0.001).
-
Figure 5—source data 1
Labelled gel images.
(Figure 5B-HO-1) The expression of HO-1 expression in the placental tissue of Wild Type (The first three columns) and PM2.5-treated mice (the last three columns) (Figure 5B-NQO-1). The expression of NQO-1 expression in the placental tissue of Wild Type (The first three columns) and PM2.5-treated mice (the last three columns) (Figure 5B-GCLC). The expression of GCLC expression in the placental tissue of Wild Type (The first three columns) and PM2.5-treated mice (the last three columns) (Figure 5B-SOD-1). The expression of SOD-1 expression in the placental tissue of Wild Type (The first three columns) and PM2.5-treated mice (the last three columns) (Figure 5B-β-actin). The expression of β-actin expression in the placental tissue of Wild Type (The first three columns) and PM2.5-treated mice (the last three columns) (Figure 5C-HO-1). The expression of HO-1 expression in the PM2.5-treated HTR8/SVneo cells (PM2.5 concentration: 0. 50 μg/mL, 100 μg/mL, 200 μg/mL) (Figure 5C-NQO-1). The expression of NQO-1 expression in the PM2.5-treated HTR8/SVneo cells (PM2.5 concentration: 0. 50 μg/mL, 100 μg/mL, 200 μg/mL) (Figure 5C-GCLC). The expression of GCLC expression in the PM2.5-treated HTR8/SVneo cells (PM2.5 concentration: 0. 50 μg/mL, 100 μg/mL, 200 μg/mL) (Figure 5C-SOD-1). The expression of SOD-1 expression in the PM2.5-treated HTR8/SVneo cells (PM2.5 concentration: 0. 50 μg/mL, 100 μg/mL, 200 μg/mL) (Figure 5C-β-actin). The expression of β-actin expression in the PM2.5-treated HTR8/SVneo cells (PM2.5 concentration: 0. 50 μg/mL, 100 μg/mL, 200 μg/mL) (Figure 5K-Mito-Cyt-c). The expression of Cyt-c expression in mitochondria after treated with different concentration of PM2.5 (0, 50 μg/mL, 100 μg/mL, 200 μg/mL) (Figure 5K-Mito-VDAC-1). The expression of VDAC-1 expression in mitochondria after treated with different concentration of PM2.5 (0, 50 μg/mL, 100 μg/mL, 200 μg/mL) (Figure 5K-Cyto-Cyt-c). The expression of Cyt-c expression in cytoplasm after treated with different concentration of PM2.5 (0, 50 μg/mL, 100 μg/mL, 200 μg/mL) (Figure 5K-Cyto-BCL-2). The expression of BCL-2 expression in cytoplasm after treated with different concentration of PM2.5 (0, 50 μg/mL, 100 μg/mL, 200 μg/mL) (Figure 5K-Cyto-BAX). The expression of BAX expression in cytoplasm after treated with different concentration of PM2.5 (0, 50 μg/mL, 100 μg/mL, 200 μg/mL) (Figure 5K-Cyto-CC3). The expression of Cleaved-Caspase 3 expression in cytoplasm after treated with different concentration of PM2.5 (0, 50 μg/mL, 100 μg/mL, 200 μg/mL) (Figure 5K-Cyto-β-actin). The expression of β-actin expression in cytoplasm after treated with different concentration of PM2.5 (0, 50 μg/mL, 100 μg/mL, 200 μg/mL).
- https://cdn.elifesciences.org/articles/85944/elife-85944-fig5-data1-v2.zip
-
Figure 5—source data 2
Raw unlabelled gel images.
(Figure 5B-HO-1) The expression of HO-1 expression in the placental tissue of Wild Type (The first three columns) and PM2.5-treated mice (the last three columns). (Figure 5B-NQO-1) The expression of NQO-1 expression in the placental tissue of Wild Type (The first three columns) and PM2.5-treated mice (the last three columns). (Figure 5B-GCLC) The expression of GCLC expression in the placental tissue of Wild Type (The first three columns) and PM2.5-treated mice (the last three columns). (Figure 5B-SOD-1) The expression of SOD-1 expression in the placental tissue of Wild Type (The first three columns) and PM2.5-treated mice (the last three columns). (Figure 5B-β-actin) The expression of β-actin expression in the placental tissue of Wild Type (The first three columns) and PM2.5-treated mice (the last three columns). (Figure 5C-HO-1) The expression of HO-1 expression in the PM2.5-treated HTR8/SVneo cells (PM2.5 concentration: 0. 50 μg/mL, 100 μg/mL, 200 μg/mL). (Figure 5C-NQO-1) The expression of NQO-1 expression in the PM2.5-treated HTR8/SVneo cells (PM2.5 concentration: 0. 50 μg/mL, 100 μg/mL, 200 μg/mL). (Figure 5C-GCLC) The expression of GCLC expression in the PM2.5-treated HTR8/SVneo cells (PM2.5 concentration: 0. 50 μg/mL, 100 μg/mL, 200 μg/mL). (Figure 5C-SOD-1) The expression of SOD-1 expression in the PM2.5-treated HTR8/SVneo cells (PM2.5 concentration: 0. 50 μg/mL, 100 μg/mL, 200 μg/mL). (Figure 5C-β-actin) The expression of β-actin expression in the PM2.5-treated HTR8/SVneo cells (PM2.5 concentration: 0. 50 μg/mL, 100 μg/mL, 200 μg/mL). (Figure 5K-Mito-Cyt-c) The expression of Cyt-c expression in mitochondria after treated with different concentration of PM2.5 (0, 50 μg/mL, 100 μg/mL, 200 μg/mL). (Figure 5K-Mito-VDAC-1) The expression of VDAC-1 expression in mitochondria after treated with different concentration of PM2.5 (0, 50 μg/mL, 100 μg/mL, 200 μg/mL). (Figure 5K-Cyto-Cyt-c) The expression of Cyt-c expression in cytoplasm after treated with different concentration of PM2.5 (0, 50 μg/mL, 100 μg/mL, 200 μg/mL). (Figure 5K-Cyto-BCL-2) The expression of BCL-2 expression in cytoplasm after treated with different concentration of PM2.5 (0, 50 μg/mL, 100 μg/mL, 200 μg/mL). (Figure 5K-Cyto-BAX) The expression of BAX expression in cytoplasm after treated with different concentration of PM2.5 (0, 50 μg/mL, 100 μg/mL, 200 μg/mL). (Figure 5K-Cyto-CC3) The expression of Cleaved-Caspase 3 expression in cytoplasm after treated with different concentration of PM2.5 (0, 50 μg/mL, 100 μg/mL, 200 μg/mL). (Figure 5K-Cyto-β-actin) The expression of β-actin expression in cytoplasm after treated with different concentration of PM2.5 (0, 50 μg/mL, 100 μg/mL, 200 μg/mL).
- https://cdn.elifesciences.org/articles/85944/elife-85944-fig5-data2-v2.zip
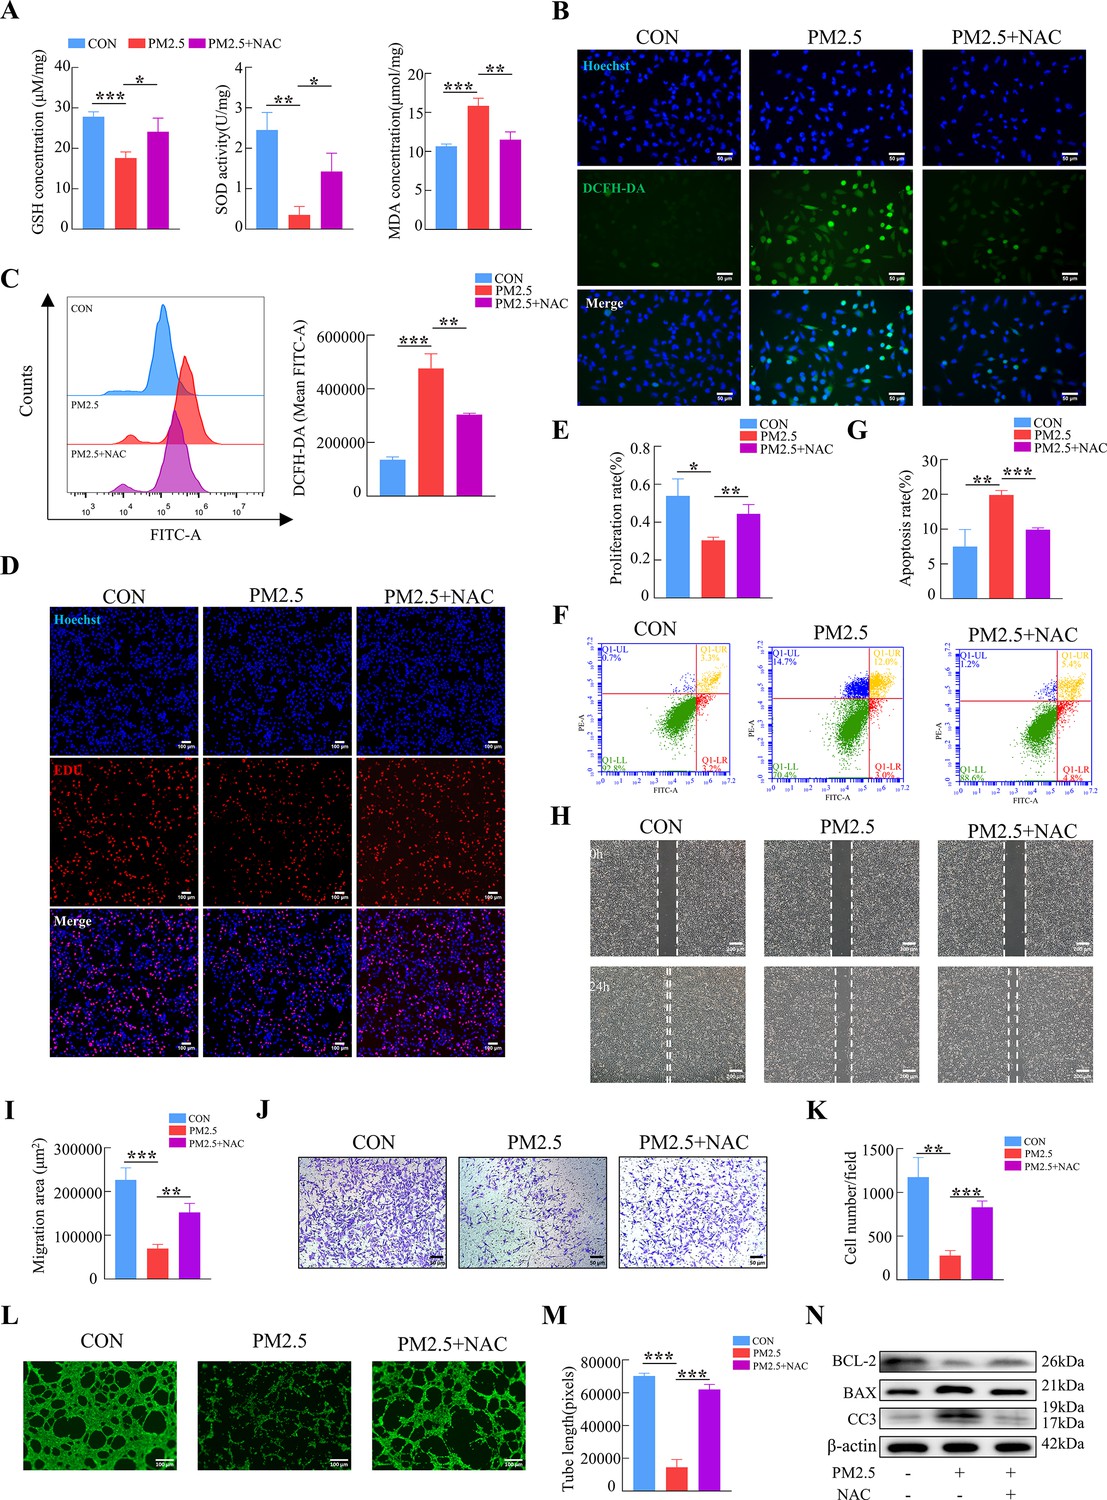
To further confirm our hypothesis, N-Acetyl-L-cysteine (NAC), a widely used oxidative stress inhibitor, was used to detect whether it can reverse the effects of PM2.5-induced impairment. The addition of NAC simultaneously increased intracellular GSH and SOD levels, and diminished MDA production (Figure 6A). Cellular immunofluorescence and flow cytometry revealed that NAC reduced the elevated ROS levels caused by PM2.5 (Figure 6B and C). NAC also resulted in the reverse of cell dysfunction on the proliferation, apoptosis, invasion and angiogenesis when compared with the PM2.5 exposed group (from Figure 6D to M), The results of western blotting indicated that the addition of NAC reversed the PM2.5-induced increase in the expression of the pro-apoptotic proteins BAX and cleaved-caspase 3 and prevented the transfer of cytochrome C from the mitochondria to the cytoplasm, whilst increasing the expression of the anti-apoptotic protein BCL-2 (Figure 6N). In summary, these results demonstrated that PM2.5 resulted in cellular functional damage by triggering oxidative stress in trophoblasts.

NAC reversed PM2.5-induced impairment of HTR8/SVneo cell function by inhibiting oxidative stress.
(A) GSH, SOD, and MDA expression levels in HTR8/SVneo cells treated with PM2.5 (100μg/mL) and NAC (5 mM). (B) Intracellular ROS levels following treatment with PM2.5 (100 μg/mL) and NAC (5 mM). The nuclei were stained blue with Hoechst, the intracellular ROS in cells were stained green with DCFH-DA. Scale bar, 50 μm. (C) Quantitative detection of intracellular ROS levels by flow cytometry after staining with DCFH-DA. The histogram indicated the mean FITC fluorescence of each group (100 μg/mL PM2.5 and 5 mM NAC). (D) Images showing the proliferation of the HTR8/SVneo cells treated with PM2.5 (100 μg/mL) and NAC (5 mM) by EDU assay. The nuclei were stained with DAPI (blue), and the proliferating cells were stained with EDU (red). Scale bar, 100 μm. (E) Quantitative analysis of the proliferation rate of HTR8/SVneo cells. (F) Detection of the percentage of apoptotic cells treated with PM2.5 (100 μg/mL) and NAC (5 mM) using flow cytometry assay. (G) The histogram analysis showed the apoptotic rate of cells in each group. (H) Representative images of the wound healing assay of HTR8/SVneo cells at the 0 and 24 hr. Scale bar, 200 μm. (I) The histogram showed the migration area (μm2) in each group. (J) Representative images of the Transwell invasion assays after 24 hr in the different groups. Scale bar, 50 μm (K) The histogram showed the cell counts/field in each group. (L) Representative images showing tube formation at different concentrations of PM2.5 after 4 hr. Scale bar, 100 μm. (M) The histogram showed the quantification of tube length of HTR8/SVneo cells. (N) The protein expression of BCL-2, BAX, Cleaved-Caspase3 by western blotting (*, p<0.05; **, p<0.01; ***, p<0.001).
-
Figure 6—source data 1
Labelled gel images.
(Figure 6N-BCL-2) The expression of BCL-2 expression in HTR8/SVneo (CON, PM2.5, PM2.5+NAC). (Figure 6N-BAX) The expression of BAX expression in HTR8/SVneo (CON, PM2.5, PM2.5+NAC). (Figure 6N-CC3) The expression of Cleaved-Caspase 3 expression in HTR8/SVneo (CON, PM2.5, PM2.5+NAC). (Figure 6N-β-actin) The expression of β-actin expression in HTR8/SVneo (CON, PM2.5, PM2.5+NAC).
- https://cdn.elifesciences.org/articles/85944/elife-85944-fig6-data1-v2.zip
-
Figure 6—source data 2
Raw unlabelled gel images.
(Figure 6N-BCL-2) The expression of BCL-2 expression in HTR8/SVneo (CON, PM2.5, PM2.5+NAC). (Figure 6N-BAX) The expression of BAX expression in HTR8/SVneo (CON, PM2.5, PM2.5+NAC). (Figure 6N-CC3) The expression of Cleaved-Caspase 3 expression in HTR8/SVneo (CON, PM2.5, PM2.5+NAC). (Figure 6N-β-actin) The expression of β-actin expression in HTR8/SVneo (CON, PM2.5, PM2.5+NAC).
- https://cdn.elifesciences.org/articles/85944/elife-85944-fig6-data2-v2.zip
PM2.5 induces mitochondrial apoptosis through oxidative stress damage in trophoblast cells via CYP1A1
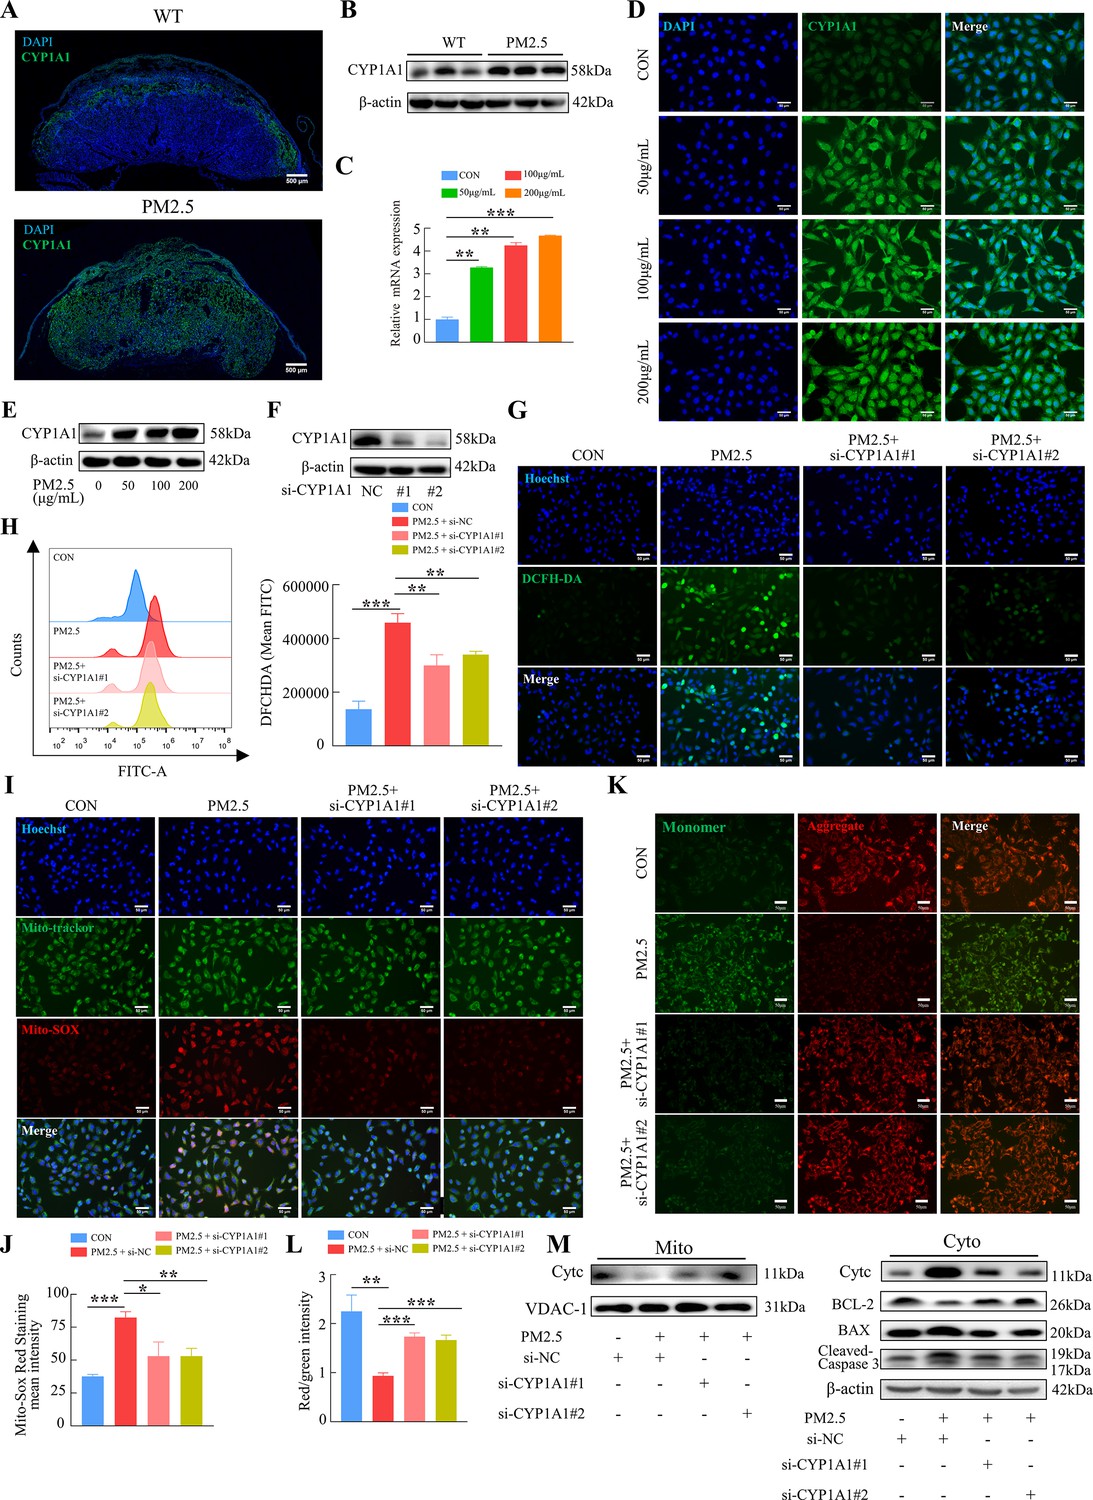
KEGG enrichment analysis showed that PM2.5 had the most significant effect on the metabolism of xenobiotics by cytochrome P450, primarily affecting CYP1A1, CYP1B1 and ALDH1A3 (Figure 4D). The proteins encoded by these three genes were detected by western blotting, and the results showed that CYP1A1 expression was most significantly elevated (Figure 7—figure supplement 1). To investigate the role of CYP1A1 in PM2.5-induced defects, we first examined the expression of CYP1A1 in mice placental tissue by immunofluorescence staining and western blotting (Figure 7A and B). The results showed that, compared to the control group, the expression of CYP1A1 was significantly increased by PM2.5 exposure. Similarly, in PM2.5-exposed HTR8/Svneo cells, the levels of CYP1A1 mRNA transcripts and protein were both elevated as revealed by qRT-PCR (Figure 7C), immunofluorescence staining (Figure 7D) and western blotting (Figure 7E), which confirmed that CYP1A1 could play an important role in PM2.5 induced trophoblast dysfunction. Next, we used two siRNAs to knock down CYP1A1 expression in HTR8/Svneo (Figure 7F) and then detected whether the effect of PM2.5 on trophoblast cells was modified. The results showed that the elevated levels of ROS caused by PM2.5 were reduced following CYP1A1 knockdown (Figure 7G and H). The elevated mitochondrial ROS levels caused by PM2.5 were also reduced after CYP1A1 knockdown as shown by the Mito-SOX staining (Figure 7I and J). Meanwhile, JC-1 staining also revealed that the knockdown of CYP1A1 reversed the decrease in mitochondrial membrane potential caused by PM2.5 (Figure 7K and L). Western blotting results showed that PM2.5 led to a decrease in BCL-2 expression, an increase in BAX expression, the translocation of cytochrome C from the mitochondria to the cytoplasm and the activation of downstream cleaved-caspase3 expression. When CYP1A1 was knocked down, these changes were significantly reversed (Figure 7M). These results confirmed that CYP1A1 was essential in oxidative stress damage and mitochondrial apoptosis in HTR8/Svneo cells caused by PM2.5.

PM2.5 caused mitochondrial apoptosis through oxidative stress damage in HTR8/SVneo cells via CYP1A1.
(A) Immunofluorescence staining of CYP1A1 in mice placental tissue sections. The nuclei were stained with DAPI (blue). The CYP1A1 expressing cells were stained with a specific antibody (green). Scale bar, 500 μm. (B) The protein expression levels of CYP1A1 in the placental tissues were detected by western blotting (n=3). (C) Relative mRNA expression levels of CYP1A1 in HTR8/SVneo cells were treated with different concentrations of PM2.5 (50 μg/mL, 100 μg/mL, 200 μg/mL). (D) Immunofluorescence images of CYP1A1 in HTR8/SVneo cells were treated with different concentrations of PM2.5 (50 μg/mL, 100 μg/mL, 200 μg/mL). The nuclei were stained with DAPI (blue), and CYP1A1 was stained with specific antibody (green). Scale bar, 50 μm. (E) The protein expression levels of CYP1A1 in HTR8/SVneo cells treated with different concentrations of PM2.5 (50 μg/mL, 100 μg/mL, 200 μg/mL). (F) The effects of CYP1A1 knockdown using two siRNAs by western blotting. (G) Quantitative detection of intracellular ROS by flow cytometry after staining with DCFH-DA. The histogram showed the mean FITC in each group. (H) Representative images of DCFH-DA staining for intracellular ROS (PM2.5: 100 μg/mL). The nuclei were stained with Hoechst (blue), and the ROS in cells were stained with DCFH-DA (green). Scale bar, 50 μm. (I) Mitochondrial ROS levels in HTR8/SVneo (PM2.5: 100 μg/mL). Hoechst was used to label the nuclei of cells in blue; Mito-tracker was used to label the mitochondrial sites; Mito-sox was used to label the mitochondrial ROS. Scale bar, 50 μm. (J) The histogram indicated the Mito-SOX Red Staining mean intensity in each group. (K) Detection of mitochondrial membrane potential by JC-1 staining (PM2.5: 100 μg/mL). Scale bar, 50 μm. (L) The histogram indicated the Red/Green intensity in each group. (M) Mitochondrial apoptosis-associated protein expression in mitochondria and cytoplasm using western blotting (PM2.5: 100 μg/mL). Cyt-C expression was detected in mitochondria, and Cyt-C, BCL-2, BAX and Cleaved-caspase 3 (CC3) expression levels in the cytoplasm were detected. The mitochondrial marker VDAC and the cytosol marker β-actin were used to identify the purity of the mitochondria in the extracts. (si-CYP1A1#1, si-CYP1A1#2: siRNAs to knockdown CYP1A1; si-NC: siRNAs Negative Control; *, p<0.05; **, p<0.01; ***, p<0.001).
-
Figure 7—source data 1
Labelled gel images.
(Figure 7B-CYP1A1) The expression of CYP1A1 expression in the placental tissue of Wild Type (The first three columns) and PM2.5-treated mice (the last three columns). (Figure 7B-β-actin) The expression of β-actin expression in the placental tissue of Wild Type (The first three columns) and PM2.5-treated mice (the last three columns). (Figure 7E-CYP1A1) The expression of CYP1A1 expression in the PM2.5-treated HTR8/SVneo cells (PM2.5 concentration: 0. 50 μg/mL, 100 μg/mL, 200 μg/mL). (Figure 7E-β-actin) The expression of β-actin expression in the PM2.5-treated HTR8/SVneo cells (PM2.5 concentration: 0. 50 μg/mL, 100 μg/mL, 200 μg/mL). (Figure 7F-CYP1A1) The expression of CYP1A1 expression in the HTR8/SVneo cells (si-NC, si-CYP1A1#1, si-CYP1A1#2). (Figure 7F-β-actin) The expression of β-actin expression in the HTR8/SVneo cells (si-NC, si-CYP1A1#1, si-CYP1A1#2). (Figure 7M-Mito-Cytc) The expression of Cytc expression in mitochondria of HTR8/SVneo (si-NC, PM2.5+si NC, PM2.5+si- CYP1A1#1, PM2.5+si- CYP1A1#2). (Figure 7M-Mito-VDAC-1) The expression of VDAC-1 expression in mitochondria of HTR8/SVneo (si-NC, PM2.5+si NC, PM2.5+si- CYP1A1#1, PM2.5+si- CYP1A1#2). (Figure 7M-Cyto-Cytc) The expression of Cytc expression in cytoplasm of HTR8/SVneo (si-NC, PM2.5+si NC, PM2.5+si- CYP1A1#1, PM2.5+si- CYP1A1#2). (Figure 7M-Cyto-BCL-2) The expression of BCL-2 expression in cytoplasm of HTR8/SVneo (si-NC, PM2.5+si NC, PM2.5+si- CYP1A1#1, PM2.5+si- CYP1A1#2). (Figure 7M-Cyto-BAX) The expression of BAX expression in cytoplasm of HTR8/SVneo (si-NC, PM2.5+si NC, PM2.5+si- CYP1A1#1, PM2.5+si- CYP1A1#2). (Figure 7M-Cyto-Cleaved-Caspase3) The expression of Cleaved-Caspase3 expression in cytoplasm of HTR8/SVneo (si-NC, PM2.5+si NC, PM2.5+si- CYP1A1#1, PM2.5+si- CYP1A1#2). (Figure 7M-Cyto-β-actin) The expression of β-actin expression in cytoplasm of HTR8/SVneo (si-NC, PM2.5+si NC, PM2.5+si- CYP1A1#1, PM2.5+si- CYP1A1#2).
- https://cdn.elifesciences.org/articles/85944/elife-85944-fig7-data1-v2.zip
-
Figure 7—source data 2
Raw unlabelled gel images.
(Figure 7B-CYP1A1) The expression of CYP1A1 expression in the placental tissue of Wild Type (The first three columns) and PM2.5-treated mice (the last three columns). (Figure 7B-β-actin) The expression of β-actin expression in the placental tissue of Wild Type (The first three columns) and PM2.5-treated mice (the last three columns). (Figure 7E-CYP1A1) The expression of CYP1A1 expression in the PM2.5-treated HTR8/SVneo cells (PM2.5 concentration: 0. 50 μg/mL, 100 μg/mL, 200 μg/mL). (Figure 7E-β-actin) The expression of β-actin expression in the PM2.5-treated HTR8/SVneo cells (PM2.5 concentration: 0. 50 μg/mL, 100 μg/mL, 200 μg/mL). (Figure 7F-CYP1A1) The expression of CYP1A1 expression in the HTR8/SVneo cells (si-NC, si-CYP1A1#1, si-CYP1A1#2). (Figure 7F-β-actin) The expression of β-actin expression in the HTR8/SVneo cells (si-NC, si-CYP1A1#1, si-CYP1A1#2). (Figure 7M-Mito-Cytc) The expression of Cytc expression in mitochondria of HTR8/SVneo (si-NC, PM2.5+si NC, PM2.5+si- CYP1A1#1, PM2.5+si- CYP1A1#2). (Figure 7M-Mito-VDAC-1) The expression of VDAC-1 expression in mitochondria of HTR8/SVneo (si-NC, PM2.5+si NC, PM2.5+si- CYP1A1#1, PM2.5+si- CYP1A1#2). (Figure 7M-Cyto-Cytc) The expression of Cytc expression in cytoplasm of HTR8/SVneo (si-NC, PM2.5+si NC, PM2.5+si- CYP1A1#1, PM2.5+si- CYP1A1#2). (Figure 7M-Cyto-BCL-2) The expression of BCL-2 expression in cytoplasm of HTR8/SVneo (si-NC, PM2.5+si NC, PM2.5+si- CYP1A1#1, PM2.5+si- CYP1A1#2). (Figure 7M-Cyto-BAX) The expression of BAX expression in cytoplasm of HTR8/SVneo (si-NC, PM2.5+si NC, PM2.5+si- CYP1A1#1, PM2.5+si- CYP1A1#2). (Figure 7M-Cyto-Cleaved-Caspase3) The expression of Cleaved-Caspase3 expression in cytoplasm of HTR8/SVneo (si-NC, PM2.5+si NC, PM2.5+si- CYP1A1#1, PM2.5+si- CYP1A1#2). (Figure 7M-Cyto-β-actin) The expression of β-actin expression in cytoplasm of HTR8/SVneo (si-NC, PM2.5+si NC, PM2.5+si- CYP1A1#1, PM2.5+si- CYP1A1#2).
- https://cdn.elifesciences.org/articles/85944/elife-85944-fig7-data2-v2.zip
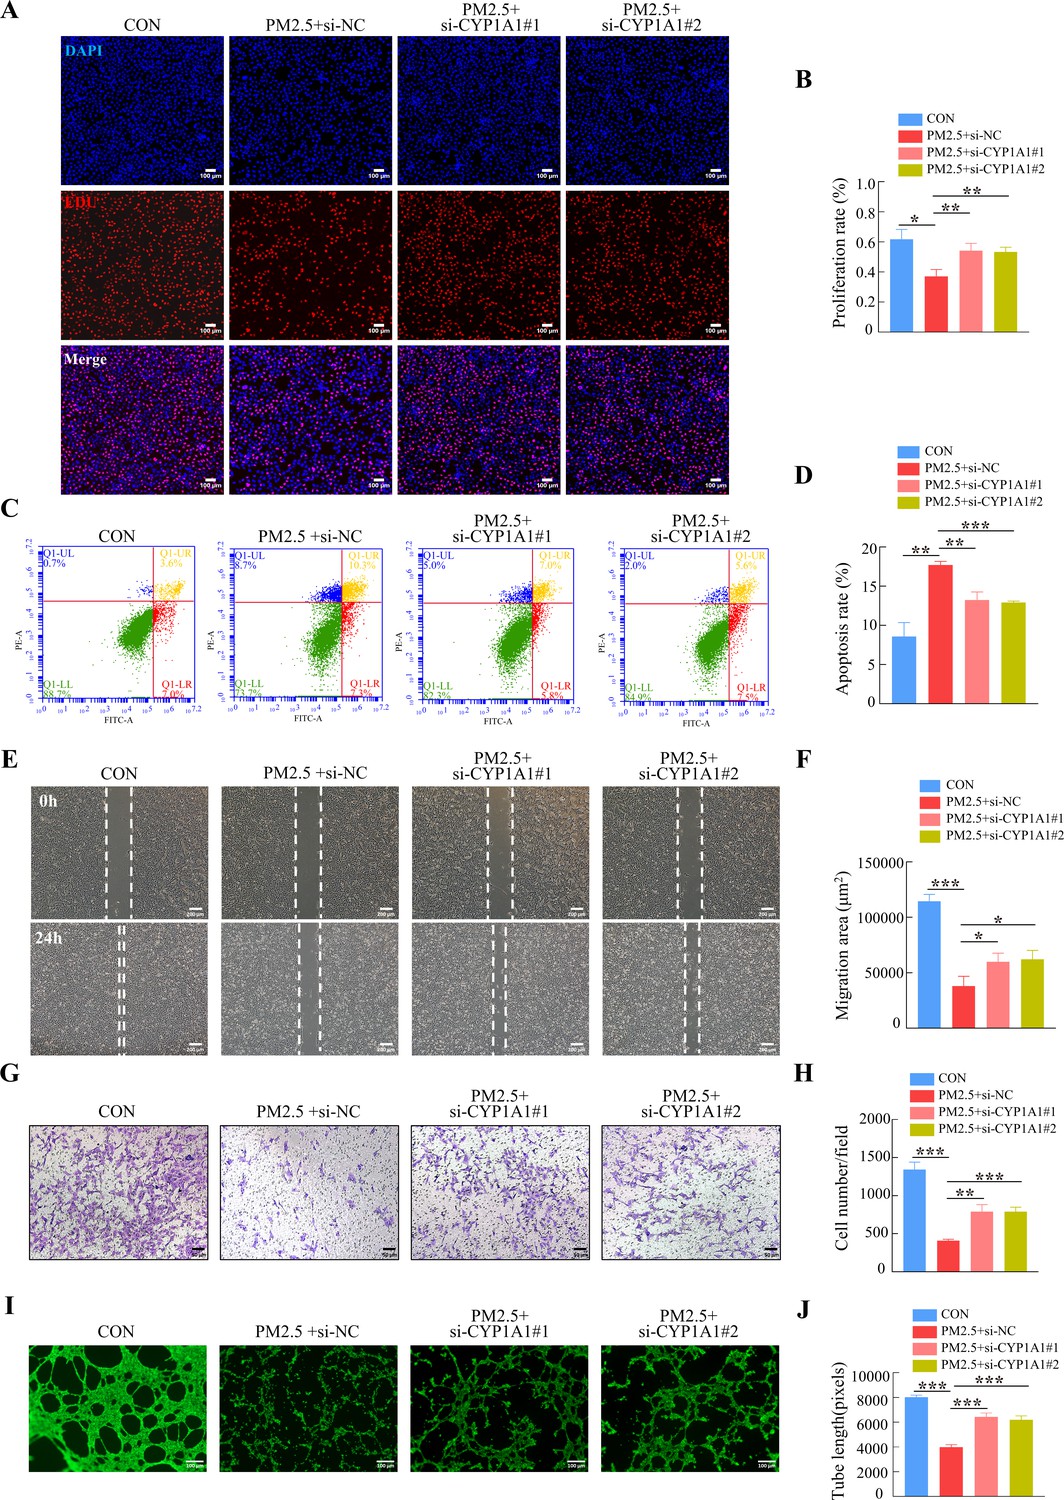
Furthermore, we tested whether the knockdown of CYP1A1 reduced the effect of PM2.5 on the biological functions of HTR8/Svneo cells. EDU, Annexin V-FITC/PI staining, wound-healing, Transwell and tube formation assays results suggested that CYP1A1 knockdown can reverse PM2.5-induced impairment of HTR8/Svneo biological functions, such as proliferation, invasion, migration, angiogenesis, and apoptosis (Figure 8). Together, these results showed that CYP1A1 played an essential role in PM2.5-induced oxidative stress damage in HTR8/Svneo cells, and knockdown of CYP1A1 expression not only reversed PM2.5-induced HTR8/Svneo oxidative stress and mitochondrial apoptosis, but also alleviated PM2.5-induced changes to cellular biological functions.

CYP1A1 knockdown reversed HTR8/SVneo cell dysfunction induced by PM2.5.
(A) Images showing the proliferation of HTR8/SVneo (PM2.5: 100 μg/mL). The nuclei were stained with DAPI in blue, the cells in the proliferation stage were stained with EDU in red. Scale bar, 100 μm. (B) The histogram analysis showed the proliferation rate of the cells in each group. (C) Detection of the percentage of apoptotic cells by flow cytometry (PM2.5: 100 μg/mL). (D) The histogram analysis indicated the apoptosis rate of the cells in each group. (E) Representative images of the wound healing assay of HTR8/SVneo cells at the 0 and 24 hr time points (PM2.5: 100 μg/mL). Scale bar, 200 μm. (F) The histogram showed the migration area (μm2) in each group. (G) Representative images of the Transwell invasion assay after 24 hr in the different groups. Scale bar, 50 μm. (H) The histogram indicated the cell counts/field in each group. (I) Representative images showing cell tube formation after 4 hr. Scale bar, 100 μm. (J) Histogram showed the quantification of the tube length formed by HTR8/SVneo cells. (*, p<0.05; **, p<0.01; ***, p<0.001).
KLF9 binds to the CYP1A1 promoter region to induce transcription
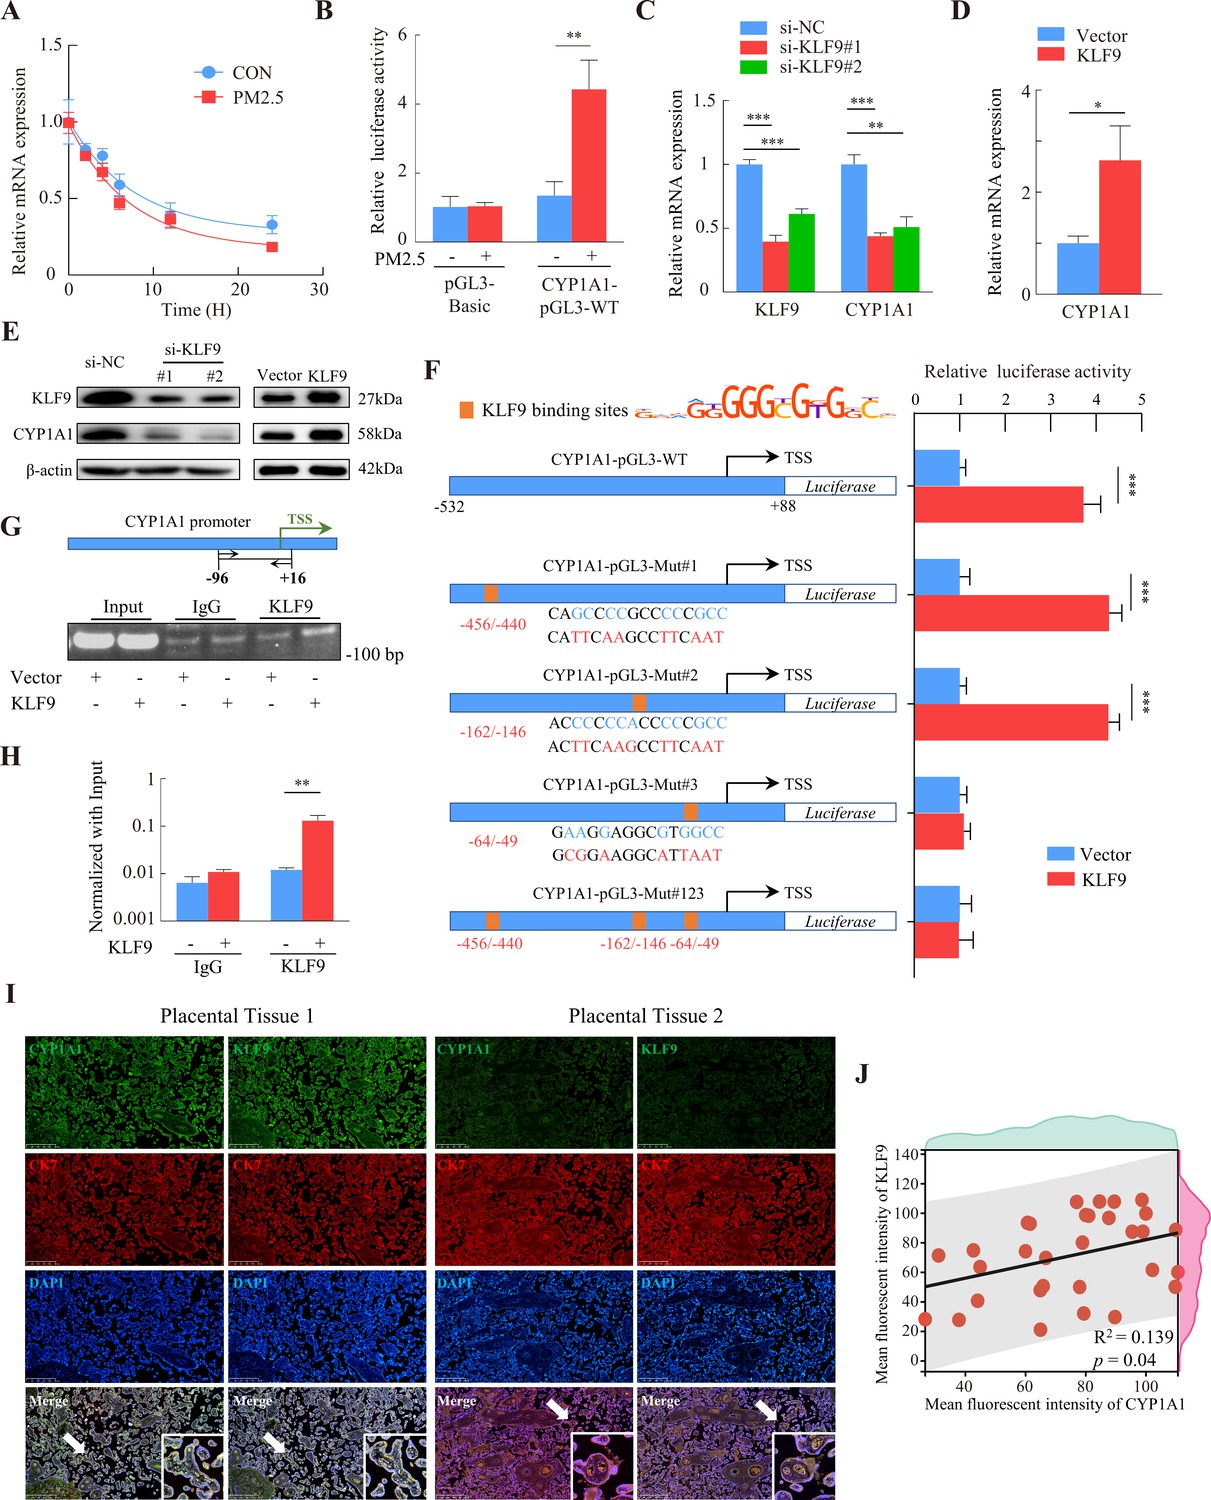
RNA-Seq showed that PM2.5 could regulate CYP1A1 expression at the transcriptional level, so we examined the stability of CYP1A1 mRNA by qRT-PCR after treatment with actinomycin D to determine whether the increase in CYP1A1 expression was related to its post-transcriptional regulation by PM2.5. The results showed that the half-lives of CYP1A1 mRNA in the PM2.5-exposed and non-exposed groups were 5.62 hr and 7.08 hr, respectively, and the difference was not significant (Figure 9A). We then assessed the transcriptional activity of the CYP1A1 promoter using a dual luciferase reporter assay and found enhanced transcriptional activity of CYP1A1 in the PM2.5 exposed cells compared with the control cells (Figure 9B). Previous studies have shown that the expression of some cytochrome P450 family genes are regulated by transcription factors (TFs) (Degrelle et al., 2022; Liu et al., 2022; Rannug, 2022; Shivaram et al., 2023). Thus, whether PM2.5 modified CYP1A1 expression via TFs in trophoblast cells was assessed. Using the JASPAR database (https://jaspar.genereg.net/), HOCOMOCO MoLoTool (https://molotool.autosome.org/), and the hTFtarget database (http://bioinfo.life.hust.edu.cn/hTFtarget#!/), we predicted dozens of TFs that could bind to the CYP1A1 promoter region (TSS, –532/+88). Interestingly, these TFs were further confined when mapped to the DEGs in the RNA-Seq data, and KLF9 emerged as the only potential TF. Next, we attempted to knock down or over-express KLF9 to determine its role in the regulation of CYP1A1 by qRT-PCR (Figure 9C and D) and western blotting (Figure 9E). Notably, the dual-luciferase assay revealed that over-expression of KLF9 increased the transcriptional activity of CYP1A1 (Figure 9F). To identify the transcriptional regulatory elements of CYP1A1 that are responsive to KLF9, the binding sites of KLF9 to the promoter region of CYP1A1 were mutated and the reporter plasmid was co-transfected with the pRL-TK into HTR8/Svneo cells that stably overexpressed KLF9. We found that mutation of either site#1 (-456 bp to –440 bp) or mutation site #2 (-162 bp to –146 bp) did not affect the promotive effect of KLF9 on the transcription of CYP1A1, but this was not the case for site #3 (-64 bp to –49 bp). Consistently, further simultaneous mutation of the three sites resulted in an abrogation of the promotive effect of KLF9 (Figure 9F). These results suggested that a response element of the CYP1A1 promoter located in the –64 bp to –49 bp region, GAAGGAGGCGTGGCC, was required for the transcription of of CYP1A1 meditated by KLF9. Subsequently, we investigated the binding of KLF9 to the CYP1A1 promoter using ChIP analysis. The chromatin was precipitated with antibodies specific for KLF9 or IgG, and PCR analysis with the primers (spanning the –96/+16 bp region of the CYP1A1 promoter) showed that KLF9 was able to bind directly to the CYP1A1 promoter (Figure 9G and H). Furthermore, we observed a positive correlation between KLF9 and CYP1A1 expression in the trophoblast layer of human placental tissue by immunohistochemical fluorescence co-staining in 30 randomly selected pregnant placental tissues in the clinic (Figure 9I and J). Taken together, these results indicated that KLF9 could bind to the CYP1A1 promoter region and drive its transcriptional activity in human trophoblast cells, highlighting an important mechanistic axis for PM2.5 regulation of CYP1A1 and its downstream effects.

KLF9 bound to a specific region of the CYP1A1 promoter to drive transcriptional activity.
(A) HTR8/SVneo cells in the PM2.5-exposed or non-exposed groups were treated with 20 μM actinomycin D, and RNA was collected at different times for qRT-PCR to detect mRNA expression, and the non-linear fitted curves showed similar half-lives of CYP1A1 mRNA. (B) HTR8/SVneo cells were cotransfected with CYP1A1-pGL3-WT and pRL-TK (internal control), and then exposed to 100 µg/mL PM2.5 for 24 hr. Dual luciferase assays were used to detect the fluorescence intensity. (C and D) Expression of CYP1A1 mRNA in KLF9 knockdown and over-expression HTR8/SVneo cells as detected by qRT-PCR. (E) Western blotting was used to detect the modulation of CYP1A1 protein expression by KLF9. (F) Different human CYP1A1 promoter-luciferase reporter gene structures together with pRL-TK were co-transfected in HTR8/SVneo cells stably over-expressing KLF9. Schematic graph on the left showed the binding sites of the CYP1A1 promoter predicted from the motif of KLF9 and mutant reporter genes constructed based on sites. The bars on the right showed the relative luciferase activity of different CYP1A1 promoters in KLF9 overexpressing cells (KLF9) compared to control cells (Vector) using dual-luciferase reporter gene assays. (G) Chromatin from KLF9 over-expression HTR8/SVneo cells was subjected to ChIP assay using KLF9 antibody or control IgG. PCR amplification with primers spanning the –96/+16 bp region of the CYP1A1 promoter was performed. A 2% agarose gel electrophoresis was performed on PCR products. (H) RT-qPCR analysis quantitatively demonstrated that KLF9 overexpression increased its binding to the endogenous CYP1A1 promoter. (I) Immunofluorescence staining showed co-staining of CYP1A1 (green) or KLF9 (green), with CK7 (red) and DAPI (blue) in human placental tissue. Scale bar, 500 μm. (J) Data shown were representative results of three repeated assays and are represented as mean ± SD. (si-KLF9#1, si-KLF9#2: siRNAs to knockdown KLF9 expression; si-NC: siRNAs Negative Control; * p<0.05, ** p<0.01, *** p<0.001).
-
Figure 9—source data 1
Labelled gel images.
(Figure 9E-KLF9) The expression of KLF9 expression in the HTR8/SVneo (si-NC, si- KLF9#1, si- KLF9#2). (Figure 9E-CYP1A1) The expression of CYP1A1 expression in the HTR8/SVneo (si-NC, si- KLF9#1, si- KLF9#2). (Figure 9E-β-actin) The expression of β-actin expression in the HTR8/SVneo (si-NC, si- KLF9#1, si- KLF9#2). (Figure 9E-Vector-KLF9-KLF9) The expression of KLF9 expression in the HTR8/SVneo (CON, KLF9 over expression). (Figure 9E-Vector-KLF9-CYP1A1) The expression of CYP1A1 expression in the HTR8/SVneo (CON, KLF9 over expression). (Figure 9E-Vector-KLF9-β-actin) The expression of β-actin expression in the HTR8/SVneo (CON, KLF9 over expression). (Figure 9G-ChIP) Chromatin from KLF9 over-expression HTR8/SVneo cells was subjected to ChIP assay using KLF9 antibody or control IgG. PCR amplification with primers spanning the –96/+16 bp region of the CYP1A1 promoter was performed. A 2% agarose gel electrophoresis was performed on PCR products.
- https://cdn.elifesciences.org/articles/85944/elife-85944-fig9-data1-v2.zip
-
Figure 9—source data 2
Raw unlabelled gel images.
(Figure 9E-KLF9) The expression of KLF9 expression in the HTR8/SVneo (si-NC, si- KLF9#1, si- KLF9#2). (Figure 9E-CYP1A1) The expression of CYP1A1 expression in the HTR8/SVneo (si-NC, si- KLF9#1, si- KLF9#2). (Figure 9E-β-actin) The expression of β-actin expression in the HTR8/SVneo (si-NC, si- KLF9#1, si- KLF9#2). (Figure 9E-Vector-KLF9-KLF9) The expression of KLF9 expression in the HTR8/SVneo (CON, KLF9 over expression). (Figure 9E-Vector-KLF9-CYP1A1) The expression of CYP1A1 expression in the HTR8/SVneo (CON, KLF9 over expression). (Figure 9E-Vector-KLF9-β-actin) The expression of β-actin expression in the HTR8/SVneo (CON, KLF9 over expression). (Figure 9G-ChIP) Chromatin from KLF9 over-expression HTR8/SVneo cells was subjected to ChIP assay using KLF9 antibody or control IgG. PCR amplification with primers spanning the –96/+16 bp region of the CYP1A1 promoter was performed. A 2% agarose gel electrophoresis was performed on PCR products.
- https://cdn.elifesciences.org/articles/85944/elife-85944-fig9-data2-v2.zip
KLF9/CYP1A1 activation and signaling are necessary for PM2.5-induced oxidative stress damage and trophoblast mitochondrial apoptosis
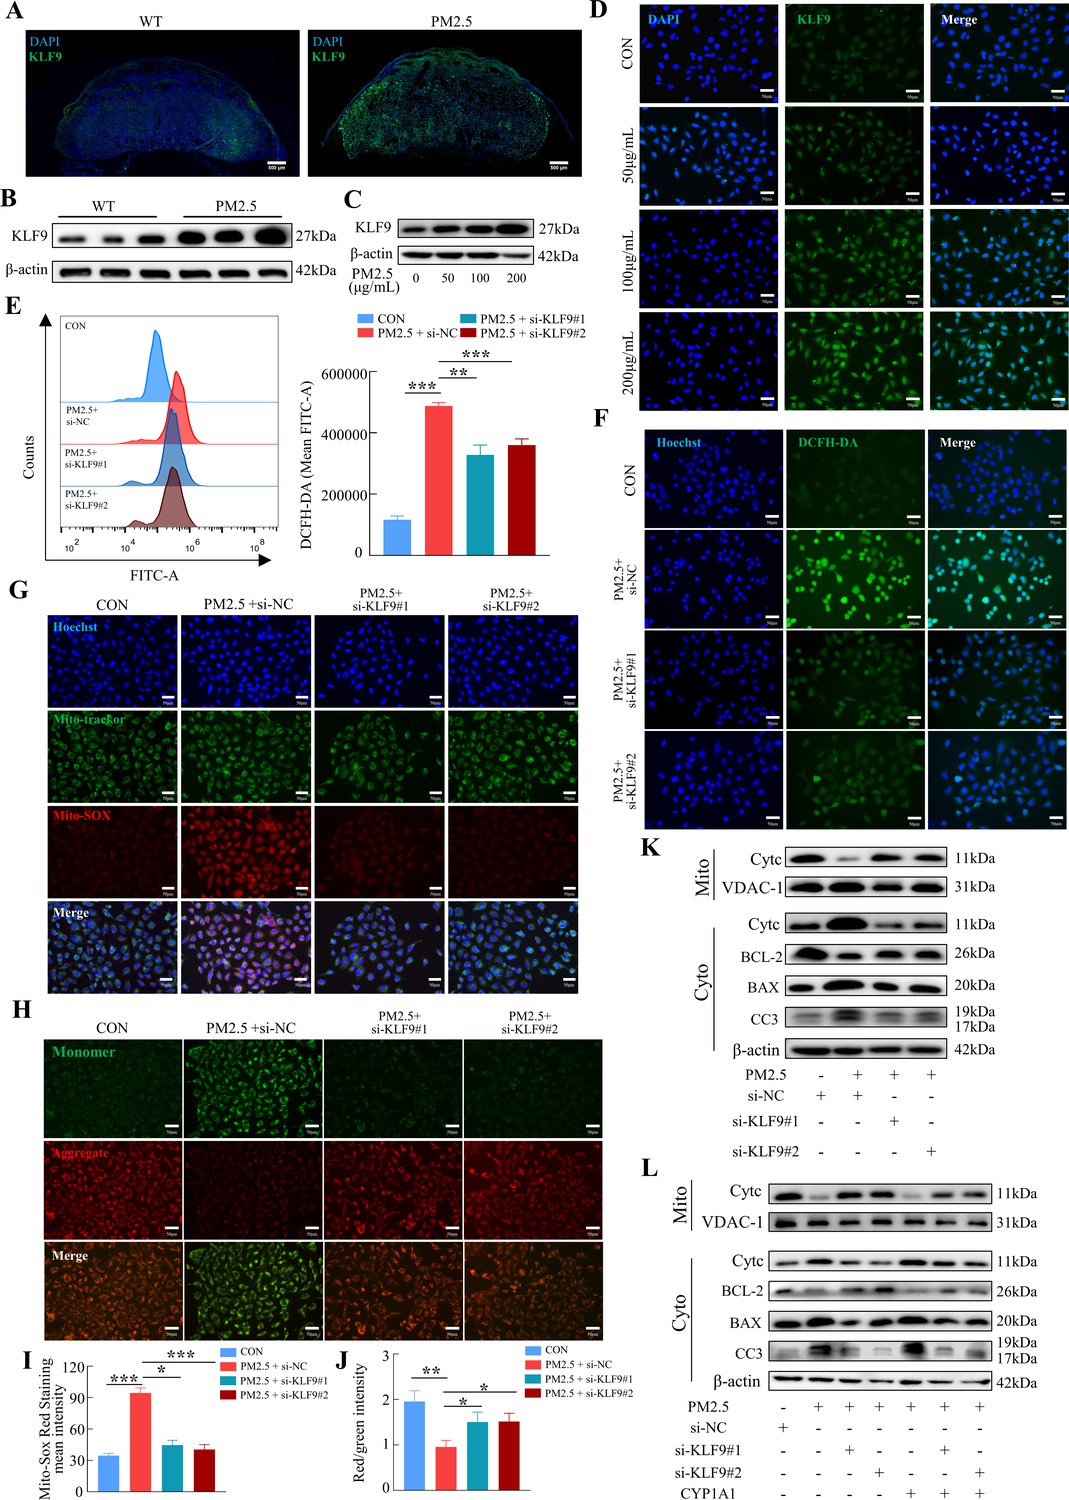
To investigate the possible role of KLF9 in PM2.5-induced trophoblast dysfunction, we first demonstrated that KLF9 expression in mouse placenta was markedly increased in response to PM2.5 stimulation, particularly in the labyrinth layer (Figure 10A and B). Mirroring the findings in mice, the expression of KLF9 in HTR8/Svneo cells was increased by PM2.5 treatment (Figure 10C). Cellular immunofluorescence showed that the increase in KLF9 expression was primarily observed in the nucleus (Figure 10D). The protein expression level of KLF9 in the nucleus was increased with the concentration of PM2.5 by western blotting (Figure 10—figure supplement 1A). Next, we knocked down the expression of KLF9 by two siRNAs in HTR8/Svneo cells. Using DCFH-DA, we found that the knockdown of KLF9 abrogated the increase in intracellular ROS levels induced by PM2.5 (Figure 10E and F). KLF9 knockdown also prevented mitochondrial ROS production (Figure 10G1), resulted in an increase in mitochondrial potential (Figure 10H and J), and blocked the translocation of cytochrome C from the mitochondria to the cytoplasm. As a result, mitochondrial apoptosis was also reduced by KLF9 knockdown as revealed by the upregulation of BCL-2 expression, downregulation of BAX and cleaved-caspase 3 expression (Figure 10K). Consistently, knockdown of KLF9 also abrogated the disruption of trophoblast function by PM2.5 (Figure 10—figure supplement 1B–I). To delineate the link between KLF9 and CYP1A1 after PM2.5 exposure, KLF9 was then knocked down in PM2.5-exposed HTR8/Svneo cultured with lentivirus-mediated ectopic expression of CYP1A1. Notably, the suppression actions by KLF9 silencing on PM2.5-induced mitochondrial apoptosis were restored by CYP1A1 overexpression, suggesting the effect of KLF9 in regulating mitochondrial apoptosis was mediated by CYP1A1 (Figure 10L). In conclusion, the results confirmed that PM2.5 caused oxidative stress damage, and mitochondrial apoptosis with impairment of cell biological functions through the KLF9/CYP1A1 signaling pathway in HTR8/Svneo.

The KLF9/CYP1A1 signaling pathway was essential in PM2.5-induced oxidative stress damage and mitochondrial apoptosis in HTR8/SVneo cells.
(A) Expression of KLF9 in mice placental tissue sections was detected by immunofluorescence staining. The nuclei were stained with DAPI in blue. KLF9 was stained with a specific antibody (green). Scale bar, 500μm. (B) Detection of KLF9 expression in mouse placental tissues by western blotting (n=3). (C) The expression of KLF9 in HTR8/SVneo at different concentrations of PM2.5 (50 μg/mL, 100 μg/mL, 200 μg/mL) were measured using western blotting. (D) Immunofluorescence images of KLF9 in HTR8/SVneo treated with different concentrations of PM2.5 (50 μg/mL, 100 μg/mL, 200 μg/mL). The nuclei were stained with DAPI (blue), and KLF9 was stained with specific antibody (green). Scale bar, 50 μm. (E) Quantitative detection of intracellular ROS by flow cytometry after staining with DCFH-DA. The histogram showed the mean FITC in each group. (F) Representative images of DCFH-DA staining for intracellular ROS (PM2.5: 100 μg/mL). The nuclei were stained with Hoechst (blue), the ROS in cells were stained with DCFH-DA (green). Scale bar, 50 μm. (G) Mitochondrial ROS levels in HTR8/SVneo (PM2.5: 100 μg/mL). Hoechst: labelling the nuclei of cells in blue; Mito-tracker: labelling the mitochondrial sites; Mito-sox: labelling the mitochondrial ROS. Scale bar, 50 μm. (H) Mitochondrial membrane potential was assessed based on JC-1 staining (PM2.5: 100 μg/mL). Scale bar, 50 μm. (I) The histogram indicated the Mito-SOX Red Staining mean intensity in each group. (J) The histogram indicated the Red/Green intensity in each group. (K) Mitochondrial apoptosis-associated protein expression levels in the mitochondria and cytoplasm were assessed using western blotting after knockdown of KLF9 (PM2.5: 100 μg/mL). Cyt-C expression was detected in mitochondria and cytoplasm, and BCL-2, BAX and Cleaved-caspase 3 (CC3) expression levels in the cytoplasm were detected. The mitochondrial marker VDAC and the cytosol marker β-actin were used to identify the purity of mitochondria in the extract. (L) Detection of mitochondrial apoptosis-associated protein expression in mitochondria and cytoplasm after KLF9 knockdown and CYP1A1 overexpression using western blotting.
-
Figure 10—source data 1
Labelled gel images.
(Figure 10B-KLF9) The expression of KLF9 expression in the placental tissue of Wild Type (The first three columns) and PM2.5-treated mice (the last three columns). (Figure 10B-β-actin) The expression of β-actin expression in the placental tissue of Wild Type (The first three columns) and PM2.5-treated mice (the last three columns). (Figure 10C-KLF9) The expression of KLF9 expression in the PM2.5-treated HTR8/SVneo cells (PM2.5 concentration: 0. 50 μg/mL, 100 μg/mL, 200 μg/mL). (Figure 10C-β-actin) The expression of β-actin expression in the PM2.5-treated HTR8/SVneo cells (PM2.5 concentration: 0. 50 μg/mL, 100 μg/mL, 200 μg/mL). (Figure 10K-Mito-Cytc) The expression of Cytc expression in mitochondria of HTR8/SVneo (si-NC, PM2.5+si NC, PM2.5+si-KLF9#1, PM2.5+si-KLF9#2). (Figure 10K-Mito-VDAC-1) The expression of VDAC-1 expression in mitochondria of HTR8/SVneo (si-NC, PM2.5+si NC, PM2.5+si-KLF9#1, PM2.5+si-KLF9#2). (Figure 10K-Cyto-Cytc) The expression of Cytc expression in cytoplasm of HTR8/SVneo (si-NC, PM2.5+si NC, PM2.5+si-KLF9#1, PM2.5+si-KLF9#2). (Figure 10K-Cyto-BCL-2) The expression of BCL-2 expression in cytoplasm of HTR8/SVneo (si-NC, PM2.5+si NC, PM2.5+si- KLF9#1, PM2.5+si- KLF9#2). (Figure 10K-Cyto-BAX) The expression of BAX expression in cytoplasm of HTR8/SVneo (si-NC, PM2.5+si NC, PM2.5+si- KLF9#1, PM2.5+si- KLF9#2). (Figure 10K-Cyto-Cleaved-Caspase3) The expression of Cleaved-Caspase3 expression in cytoplasm of HTR8/SVneo (si-NC, PM2.5+si NC, PM2.5+si- KLF9#1, PM2.5+si- KLF9#2). (Figure 10K-Cyto-β-actin) The expression of β-actin expression in cytoplasm of HTR8/SVneo (si-NC, PM2.5+si NC, PM2.5+si- KLF9#1, PM2.5+si- KLF9#2) (Figure 10L-Mito-Cytc) The expression of Cytc expression in mitochondria of HTR8/SVneo (si-NC, PM2.5+si NC, PM2.5+si-KLF9#1, PM2.5+si-KLF9#2, PM2.5+CYP1 A1 overexpression, PM2.5+si-KLF9#1+CYP1 A1 overexpression, PM2.5+si-KLF9#2+CYP1 A1 overexpression). (Figure 10L-Mito-VDAC-1) The expression of VDAC-1 expression in mitochondria of HTR8/SVneo (si-NC, PM2.5+si NC, PM2.5+si-KLF9#1, PM2.5+si-KLF9#2, PM2.5+CYP1 A1 overexpression, PM2.5+si-KLF9#1+CYP1 A1 overexpression, PM2.5+si-KLF9#2+CYP1 A1 overexpression). (Figure 10L-Cyto-Cytc) The expression of Cytc expression in cytoplasm of HTR8/SVneo (si-NC, PM2.5+si NC, PM2.5+si-KLF9#1, PM2.5+si-KLF9#2, PM2.5+CYP1 A1 overexpression, PM2.5+si-KLF9#1+CYP1 A1 overexpression, PM2.5+si-KLF9#2+CYP1 A1 overexpression). (Figure 10L-Cyto-BCL-2) The expression of BCL-2 expression in cytoplasm of HTR8/SVneo (si-NC, PM2.5+si NC, PM2.5+si-KLF9#1, PM2.5+si-KLF9#2, PM2.5+CYP1 A1 overexpression, PM2.5+si-KLF9#1+CYP1 A1 overexpression, PM2.5+si-KLF9#2+CYP1 A1 overexpression). (Figure 10L-Cyto-BAX) The expression of BAX expression in cytoplasm of HTR8/SVneo (si-NC, PM2.5+si NC, PM2.5+si-KLF9#1, PM2.5+si-KLF9#2, PM2.5+CYP1 A1 overexpression, PM2.5+si-KLF9#1+CYP1 A1 overexpression, PM2.5+si-KLF9#2+CYP1 A1 overexpression). (Figure 10L-Cyto-Cleaved-Caspase3) The expression of Cleaved-Caspase3 expression in cytoplasm of HTR8/SVneo (si-NC, PM2.5+si NC, PM2.5+si-KLF9#1, PM2.5+si-KLF9#2, PM2.5+CYP1 A1 overexpression, PM2.5+si-KLF9#1+CYP1 A1 overexpression, PM2.5+si-KLF9#2+CYP1 A1 overexpression). (Figure 10L-Cyto-β-actin) The expression of β-actin expression in cytoplasm of HTR8/SVneo (si-NC, PM2.5+si NC, PM2.5+si-KLF9#1, PM2.5+si-KLF9#2, PM2.5+CYP1 A1 overexpression, PM2.5+si-KLF9#1+CYP1 A1 overexpression, PM2.5+si-KLF9#2+CYP1 A1 overexpression).
- https://cdn.elifesciences.org/articles/85944/elife-85944-fig10-data1-v2.zip
-
Figure 10—source data 2
Raw unlabelled gel images.
(Figure 10B-KLF9) The expression of KLF9 expression in the placental tissue of Wild Type (The first three columns) and PM2.5-treated mice (the last three columns). (Figure 10B-β-actin) The expression of β-actin expression in the placental tissue of Wild Type (The first three columns) and PM2.5-treated mice (the last three columns). (Figure 10C-KLF9) The expression of KLF9 expression in the PM2.5-treated HTR8/SVneo cells (PM2.5 concentration: 0. 50μg/mL, 100μg/mL, 200μg/mL). (Figure 10C-β-actin) The expression of β-actin expression in the PM2.5-treated HTR8/SVneo cells (PM2.5 concentration: 0. 50μg/mL, 100μg/mL, 200μg/mL). (Figure 10K-Mito-Cytc) The expression of Cytc expression in mitochondria of HTR8/SVneo (si-NC, PM2.5+si-NC, PM2.5+si-KLF9#1, PM2.5+si-KLF9#2). (Figure 10K-Mito-VDAC-1) The expression of VDAC-1 expression in mitochondria of HTR8/SVneo (si-NC, PM2.5+si-NC, PM2.5+si-KLF9#1, PM2.5+si-KLF9#2). (Figure 10K-Cyto-Cytc) The expression of Cytc expression in cytoplasm of HTR8/SVneo (si-NC, PM2.5+si-NC, PM2.5+si-KLF9#1, PM2.5+si-KLF9#2). (Figure 10K-Cyto-BCL-2) The expression of BCL-2 expression in cytoplasm of HTR8/SVneo (si-NC, PM2.5+si-NC, PM2.5+si- KLF9#1, PM2.5+si- KLF9#2). (Figure 10K-Cyto-BAX) The expression of BAX expression in cytoplasm of HTR8/SVneo (si-NC, PM2.5+si-NC, PM2.5+si- KLF9#1, PM2.5+si- KLF9#2). (Figure 10K-Cyto-Cleaved-Caspase3) The expression of Cleaved-Caspase3 expression in cytoplasm of HTR8/SVneo (si-NC, PM2.5+si-NC, PM2.5+si- KLF9#1, PM2.5+si- KLF9#2). (Figure 10K-Cyto-β-actin) The expression of β-actin expression in cytoplasm of HTR8/SVneo (si-NC, PM2.5+si-NC, PM2.5+si- KLF9#1, PM2.5+si- KLF9#2) (Figure 10L-Mito-Cytc) The expression of Cytc expression in mitochondria of HTR8/SVneo (si-NC, PM2.5+si-NC, PM2.5+si-KLF9#1, PM2.5+si-KLF9#2, PM2.5+CYP1A1 overexpression, PM2.5+si-KLF9#1+ CYP1A1 overexpression, PM2.5+si-KLF9#2+ CYP1A1 overexpression). (Figure 10L-Mito-VDAC-1) The expression of VDAC-1 expression in mitochondria of HTR8/SVneo (si-NC, PM2.5+si-NC, PM2.5+si-KLF9#1, PM2.5+si-KLF9#2, PM2.5+CYP1A1 overexpression, PM2.5+si-KLF9#1+ CYP1A1 overexpression, PM2.5+si-KLF9#2+ CYP1A1 overexpression). (Figure 10L-Cyto-Cytc) The expression of Cytc expression in cytoplasm of HTR8/SVneo (si-NC, PM2.5+si-NC, PM2.5+si-KLF9#1, PM2.5+si-KLF9#2, PM2.5+CYP1A1 overexpression, PM2.5+si-KLF9#1+ CYP1A1 overexpression, PM2.5+si-KLF9#2+ CYP1A1 overexpression). (Figure 10L-Cyto-BCL-2) The expression of BCL-2 expression in cytoplasm of HTR8/SVneo (si-NC, PM2.5+si-NC, PM2.5+si-KLF9#1, PM2.5+si-KLF9#2, PM2.5+CYP1A1 overexpression, PM2.5+si-KLF9#1+ CYP1A1 overexpression, PM2.5+si-KLF9#2+ CYP1A1 overexpression). (Figure 10L-Cyto-BAX) The expression of BAX expression in cytoplasm of HTR8/SVneo (si-NC, PM2.5+si-NC, PM2.5+si-KLF9#1, PM2.5+si-KLF9#2, PM2.5+CYP1A1 overexpression, PM2.5+si-KLF9#1+ CYP1A1 overexpression, PM2.5+si-KLF9#2+ CYP1A1 overexpression). (Figure 10L-Cyto-Cleaved-Caspase3) The expression of Cleaved-Caspase3 expression in cytoplasm of HTR8/SVneo (si-NC, PM2.5+si-NC, PM2.5+si-KLF9#1, PM2.5+si-KLF9#2, PM2.5+CYP1A1 overexpression, PM2.5+si-KLF9#1+ CYP1A1 overexpression, PM2.5+si-KLF9#2+ CYP1A1 overexpression). (Figure 10L-Cyto-β-actin) The expression of β-actin expression in cytoplasm of HTR8/SVneo (si-NC, PM2.5+si-NC, PM2.5+si-KLF9#1, PM2.5+si-KLF9#2, PM2.5+CYP1A1 overexpression, PM2.5+si-KLF9#1+ CYP1A1 overexpression, PM2.5+si-KLF9#2+ CYP1A1 overexpression).
- https://cdn.elifesciences.org/articles/85944/elife-85944-fig10-data2-v2.zip
Discussion
Exposure to PM2.5 during pregnancy has been widely reported to result in an increased risk of adverse outcomes such as gestational hypertension, fetal growth restriction, preterm birth and stillbirth. Studies in Florida have shown that the closer one lives to a PM2.5 emitting plant, the greater the risk of low birth weight in the fetus (Salihu et al., 2012). A study of more than 350,000 newborns in Ohio found that exposure to PM2.5 even in late gestation resulted in stillbirths (Grippo et al., 2018). Studies conducted in Beijing and Shanghai suggested that PM2.5 exposure during pregnancy is strongly related to smaller ultrasound parameters of fetal growth. Similarly, our previous research analyzed the association between preterm birth and environmental air pollutants in Jinan, which revealed a strong correlation between preterm birth and PM2.5 (Wang et al., 2022). To investigate the impact of ambient PM2.5 on pregnancy in depth, we extracted PM2.5 from the atmosphere of Jinan and constructed a PM2.5-exposed pregnant mouse model using intratracheal perfusion in vivo. The selection of appropriate PM2.5 exposure dosage in mice was critical for our experiments. We combined the PM2.5 exposure level of pregnant women from the Jinan (Wang et al., 2022) (where we collected PM2.5 particles) with physiological indicators of mice (Vermillion et al., 2018), then multiplied by 100-fold uncertainty factor to obtain the corresponding PM2.5 exposure dosage during mice pregnancy. The 100-fold uncertainty factor ( =10 fold interspecies difference ×10 fold interindividual variation) is used to convert a no-observed-adverse-effect level (NOAEL) from an animal toxicity study to a safe value for human intake (ADI), which is the criteria for determining experimental dosages in toxicological studies involving animals. It was originally proposed, over 60 years ago, by Lehman and Fitzhugh, 1954, and still forms the basis of the uncertainty factors which are in use today. Also, the 100-uncertainty factor is considered one of the criteria for in vivo experiments in authoritative studies related to PM2.5 (Chen et al., 2022a; Zhang et al., 2018; Zhang et al., 2017). We found that PM2.5 caused different adverse pregnancy outcomes in mice, such as an increased rate of stillbirths, a reduced number of fetuses, and a reduced fetal size. Additionally, we revealed that PM2.5 caused placental oxidative stress damage and trophoblast apoptosis. In addition, we performed RNA-Seq analysis and verified that PM2.5 regulated CYP1A1-mediated oxidative stress and mitochondrial apoptosis via the transcription factor KLF9 in vitro, which resulted in structural damage and functional alterations to the placenta and contributes to a poor outcome of the pregnancy.
It is well known that the placenta is a vital organ for securing the growth and development of the fetus, and its dysfunction often results in adverse perinatal outcomes. The placenta is also the target for a multitude of environmental pollutants such as PAHs, heavy metals, microplastics, perfluoroalkyl substances, and trichloroethylene, which can accumulate in the placenta and disrupt its function, thereby affecting the survival and growth of the fetus (Vrooman et al., 2016). PM2.5 is a mixture of several environmental pollutants, and due to the small size, it can penetrate the alveoli and pass through the bloodstream to be deposited in the placenta, making the placenta an organ of interest for studying the impact of PM2.5 on pregnancy. Previous studies have identified that prenatal exposure to PM2.5 resulted in an increased odds of having a placental abruption, inflammation, and hypercoagulability with vascular thrombosis and imbalances of immune cells in the placenta (Ibrahimou et al., 2017; Liu et al., 2016). Further, we found that PM2.5-induced oxidative stress damage in mouse placenta was strongly demonstrated by a significant reduction in GSH and SOD levels, an elevation in MDA production, and decreased expression of antioxidant proteins, such as HO-1, GCLC, NQO-1, and SOD-1. The levels of apoptosis were also increased in the placental trophoblast cells, so we selected the HTR8/Svneo trophoblast cell line for PM2.5 cytotoxicity assays in vitro. HTR8/Svneo cells are perpetuated by the SV40 Tag and not only maintain many of the essential and key features of the parental cells, but are also devoid of any features of neoplastic transformation (Bilban et al., 2010; Dong et al., 2021). Therefore, HTR8/Svneo cells are a more suitable model for this study than choriocarcinoma BeWo, JEG-3, and JAR cells. In the present study, PM2.5 caused severe oxidative stress damage in HTR8/Svneo cells, as evidenced by decreased SOD and GSH levels, significantly elevated intracellular MDA and ROS levels, and decreased expression of antioxidant-related proteins. Consistently, previous studies have also reported that PM2.5 or particulate air pollution could cause trophoblast cytotoxicity, inflammation and oxidative stress (Nääv et al., 2020; Familari et al., 2019). However, its downstream signaling pathways and their potential mechanisms have not been explored in detail in previous studies. In the current study, we revealed that PM2.5 not only induced the induction of elevated intracellular ROS levels, but also significantly increased mitochondrial ROS levels. This resulted in a decrease in mitochondrial membrane potential, triggering the flow of cytochrome C from the mitochondria to the cytosol and inducing the downstream cell mitochondrial apoptosis. Our study demonstrated that exposure to PM2.5 induced oxidative stress in placental trophoblast, leading to mitochondrial apoptosis and impairment of cell biological functions.
In contrast to our results, many studies have found that PM2.5 did not trigger oxidative stress. For instance, Liu Y et al. found that PM2.5 evoked placental inflammation and hypercoagulability with vascular thrombosis but not oxidative stress in rats (Liu et al., 2016). Scientists may have reached these different conclusions because PM2.5 surfaces absorb different environmental pollutants. Studies have indicated that the morphological characteristics of PM2.5 are closely related to its components. For example, organic pollutant particles are irregularly clustered, fly ash particles from coal combustion were mostly spherical in shape, and construction particles were mostly sharp-edge (Ghadikolaei et al., 2020; Liu et al., 2009). SEM of the PM2.5 samples in this study showed that they primarily consisted of flocculent structures. Elemental composition by EDS revealed that the elements O, N, and C were prominent in the gathered PM2.5. These results, in addition to the presence of a chemical plant nearby the sampling site, strongly suggested that a large number of organic pollutants had adhered to the surface of the PM2.5 we collected. Studies have shown that the toxicological effects of PM2.5 on cells could depend on the pollutant composition of PM2.5. In particular, organic pollutants can lead towards the development of oxidative stress in cells. For example, PM2.5 containing benzo[b]fluoranthene, chrysene, and fluoranthene impair the antioxidant system of lung epithelial cells, leading to increased cellular ROS levels and reduced cellular activity Deng et al., 2013; exposure to PM2.5, which contains high concentrations of, metals, and polar organic compounds, can lead to elevated levels of 8-OHdG in the urine and elevated levels of oxidative stress Wei et al., 2009; motor vehicle exhaust in traffic congestion contributes to elevated levels of organic pollutants in PM2.5 levels, causing severe oxidative stress damage and genotoxicity to human lung cells (Oh et al., 2011). In the present study, we observed that PM2.5 exposure caused intracellular and mitochondrial oxidative stress. We speculated that this was due to the organic pollutants on the surface of PM2.5.
Mitochondria were involved in a wide range of critical cellular functions, including the oxidative phosphorylation of ATP synthesis and the metabolic degradation of sugars and lipids, and it is also damaged by a variety of environmental pollutants. PM2.5 can trigger oxidative stress damage to cells with increased levels of ROS, which in turn continues to damage mitochondrial membranes, further leading to increased release of cytochrome C from mitochondria and ultimately apoptosis. PM2.5 has been found to cause cellular mitochondrial damage in a variety of studies. For example, PM2.5 induced mitochondrial oxidative stress damage in hepatic stellate cells through the PINK1/Parking pathway, which led to cellular autophagy and liver fibrosis (Qiu et al., 2019). PM2.5 also induced an increase in ROS levels and a decrease in mitochondrial membrane potential in human bronchial epithelial cells, causing the cells to undergo mitochondrial apoptosis (Shan et al., 2022).A significant increase in PM2.5-exposed mitochondrial ROS was also found in macrophages, which inhibited M2 polarization and induced immune disorders (Zhao et al., 2016). In our study, it was apparent that the mitochondrial morphology of the cells was significantly altered, including a thickening and shortening of the cristae and a reduction in the volume. Importantly, Mito-SOX and JC-1 fluorescent probe staining revealed that PM2.5 induced an elevation in mitochondrial ROS and reduced mitochondrial membrane potential (MMP) in HTR8/SVneo cells. Moreover, mitochondrial-mediated endogenous apoptosis was also observed. Our results reinforced that PM2.5 promoted mitochondrial oxidative stress and mitochondrial apoptosis in trophoblast cells.
CYP1A1 is an important metabolic enzyme involved in the metabolism and degradation of PAHs (Ugartondo et al., 2021). It was found that CYP1A1 contributes to oxidative stress in cells. For example, CYP1A1 induction enhanced gefitinib-induced oxidative stress and apoptosis in A549 cells and was implicated with chronic obstructive pulmonary disease (Callaway et al., 2020). Furthermore, aromatic hydrocarbons in PM2.5 could increase the expression level of CYP1A1, inducing oxidative stress and inflammation in several cells, such as human bronchial epithelial cells (Gu et al., 2021), neutrophils (Vogel et al., 2016), and epithelial cells (Toydemir et al., 2021), amongst others. Activation of CYP1A1 mediates oxidative stress exacerbating the production and accumulation of toxic metabolic intermediates such as ROS and causes mitochondrial apoptosis (Zhao et al., 2020). In this study, RNA-Seq analysis and validation tests indicated that CYP1A1 in the cytochrome P450 pathway was critically involved in PM2.5-induced cellular damage. Knockdown of CYP1A1 expression not only abolished PM2.5-induced oxidative stress and mitochondrial apoptosis but also alleviated the disruption of cell biological functions via PM2.5.
Transcription factors play an important part in the modulation of the cytochrome P450 pathway. For example, AHR is an essential ligand-activated transcription factor of the cytochrome P450 pathway, controlling the expression of CYP1A1, CYP1B1, CYP1A2 and other genes in the cytochromes P450 family (Torti et al., 2021; Al-Dhfyan et al., 2017; Zhang et al., 2022; Jin et al., 2021). AHR could be activated by many environmental pollutants, including PM2.5 (Ren et al., 2020). Before the AHR is activated, it forms a complex with two heat shock protein 90 (Hsp90) molecules in the cytoplasm. Following activation, the AHR breaks free from binding and enters the nucleus, forming a dimer with the AHR nuclear translocator protein (Arnt) and binding to an enhancer to form a xenobiotic response element (XRE) involved in the regulation of cytochromes P450 family genes. In addition, multiple studies have found that intracellular CYP1A1 expression is regulated by various transcription factors, such as upstream stimulatory factor 1 (USF1), and Nuclear Factor erythroid 2-Related Factor 2 (Nrf2) (Familari et al., 2019; Kyoreva et al., 2021; Takahashi and Kamataki, 2001). In our study, actinomycin D was used to show that PM2.5 regulates CYP1A1 expression at transcriptional initiation rather than by modifying its mRNA stability. Then we used three databases, JASPAR, HOCOMOCO MoLoTool, and hTFtarget, to predict the upstream transcription factors of CYP1A1 and compared them with the RNA-Seq sequencing results. As a result, we found that KLF9 emerged as the only potential transcriptional regulator of CYP1A1.
Kruppel-like factor 9 (KLF9), also named Basic Transcription Element Binding protein 1 (BTEB1), is a transcription factor regulates development, differentiation and apoptosis by binding to GC-rich sites via three C2H2-type zinc fingers. KLF9 transcriptionally activates or represses downstream genes depending on the cellular environment and partner co-regulators. For example, KLF9 activated the gluconeogenic program in primary hepatocytes by directly binding to the PAC1A promoter (Cui et al., 2019). KLF9 also regulates p53 gene expression positively by binding to the GC box proximal to the P53 promoter in HepG2 and SK-Hep1 cells (Sun et al., 2014). Conversely, KLF9 works as a transcriptional repressor inhibiting AKT transcription in prostate cancer cells, thereby suppressing the growth of PCa cells (Shen et al., 2014). There are very few studies on the relationship between KLF9 and CYP1A1, those that have assessed this have only reported it in rat liver cells. KLF9 was characterized as a trans-repressor of CYP1A1 gene in rat liver (Imataka et al., 1992). Importantly, our study has revealed that KLF9 exerted a positive regulatory effect on CYP1A1 in humans, which is in contrast to its previously reported transcriptional repression of CYP1A1 in rat liver. Furthermore, we identified the –64 bp to –49 bp region of the CYP1A1 promoter, GAAGGAGGCGTGGCC, was the binding site of the KLF9 protein. In support of the above findings, we observed that KLF9 expression in pregnancy placental tissue was positively correlated with CYP1A1, which further supports that KLF9 regulates CYP1A1 expression in trophoblasts. Moreover, KLF9 knockdown was able to reverse the oxidative stress and mitochondrial apoptosis caused by PM2.5, as well as the impaired proliferation, migration, invasion, and tube formation of trophoblasts. Indeed, KLF9 has been consistently reported to exacerbate oxidative stress damage in cells by disrupting ROS scavenging. For example, the knockdown of KLF9 in cardiomyocytes protects them from ischemic injury (Yan et al., 2019), and a KLF9-dependent increase in ROS can result in cell death in lung tissues (Zucker et al., 2014) and induce proliferation of melanoma (Bagati et al., 2019). There are also numerous studies indicating the critical role of KLF9 in toxicological research. For example, Yue Gu et al. found that Klf9 is involved in BLM-induced pulmonary toxicity in human lung fibroblasts, Daqian Yang et al. identified that KLF9 was essential in allicin resisting against arsenic trioxide-Induced hepatotoxicity, but little is known regarding its role in the occurrence of PM2.5-induced toxicological processes. Here, our study not only identified KLF9 as a transcription factor of CYP1A1 for the first time in humans, but also revealed a novel mechanism of oxidative stress in trophoblast cells induced by PM2.5, providing a new target for future clinical treatment.
Due to the limitations of our laboratory, our current research unavoidably possesses certain deficiencies. For instance, the administration of intratracheal instillation may induce adverse effects on pregnant mice. In the future study, we will collaborate with other research institutions to employ meteorological and environmental animal exposure system that not only mitigate harm to pregnant mice but also more realistically simulate the process of inhaling PM2.5 particles in humans. We also lack the utilization of primary cells in our in vitro experiments. Furthermore, our current article lacks investigations on the regulatory effect of PM2.5 on KLF9. These limitations should be further investigated in future.
In conclusion, we collected PM2.5 from the urban atmosphere of Jinan city and found that it caused various adverse gestational outcomes in mice as well as impaired placental structure and increased placental trophoblast apoptosis. In the trophoblast cell line HTR8/SVneo, PM2.5 induced oxidative stress damage and mitochondrial apoptosis, and affected cell proliferation, invasion, migration and angiogenesis. The KLF9/CYP1A1 transcriptional axis was involved in PM2.5-induced oxidative stress and mitochondrial apoptosis. This is not only the first study to demonstrate the molecular mechanism of PM2.5-induced oxidative stress damage in trophoblast cells, but also the first time to identify that KLF9 acts as a transcriptional factor positively modulating the expression of CYP1A1 in humans.
Materials and methods
PM2.5 collection, morphological characterization, and elemental composition examination
Request a detailed protocolThe PM2.5 high volume sampling system (Staplex PM2.5 SSI, USA) was installed near the Xincheng apartment complex, Jinan City, Shandong Province, China (Figure 1A). Structurally, the area was densely populated by heavy traffic, and surrounded by chemical factories, and cement plants. From October 2020 to April 2021, PM2.5 samples were collected on fiberglass fiber filters, and the filters were exchanged each 48 h. The filters were then cut into 1 cm2 pieces, and 100 ml double distilled water was added for sonication. The suspension was purified by filtration through 8 layers gauze. And the filtrate was gathered in a 50 mL tube and lyophilized for 24 hr under vacuum. PM2.5 was stored at 4 ℃. When PM2.5 were used in subsequent experiments, they were dissolved in PBS to prepare 5 mg/mL suspensions, and mixed thoroughly under ultrasonication for 20 min. The high-resolution SEM (JEOL JSM-6700F, Tokyo, Japan) attached with EDS (APOLLO XL, USA) was used to measure the size, shape, elemental composition and surface morphology of PM2.5 particles. Based on the manufacturer’s guidelines, PM2.5 was suspended in a solution of n-hexane with the aid of ultrasonic treatment to obtain a uniformly distributed PM2.5 solution. Carbon coating was then performed and measurements were carried out using automatic mode. Analysis of the elemental composition of PM2.5 by scanning electron microscopy images of three randomly selected areas using EDS.
Intratracheal instillation of PM2.5 in mice and specimen collection
Request a detailed protocolKunming pregnant mice (6–8 weeks old, weighing 50–56 g) were used in the present study. All animal experiments were permitted by the Research Ethics Committee approval of Maternal and Child Health Care Hospital of Shandong Province. Prior to the start of the study, mice were maintained in animal chambers under standard husbandry conditions for 1 week. The mice are housed in an environment which is guaranteed to be free of pathogens and with constant temperature and humidity. The study conformed to the principles for laboratory animal research and approved by the Maternal and Child Health Care Hospital of Shandong Province (permit NO. 2021–116). All pregnant mice were divided randomly into control and PM2.5-treated group. At 8 weeks, the average tidal volume of Kunming mice was about 0.25 mL, and the frequency of per mouse’s respiratory was about 163 /min, thus, the total air intake per day was 0.25×163 × 60 mins×24 hrs=58,680 mL ≈ 0.0587 m3/day (Vermillion et al., 2018). It has been reported that the PM2.5 exposure of pregnant women in Jinan in 2020 was about 64 μg/m3 daily (Wang et al., 2022). Therefore, the total PM2.5 intake though out the whole pregnancy of mice was about 0.0587 m3/day ×64 μg/m3 × 20 days×100 (uncertainty factor)=7511 μg. The 100 fold uncertainty factor = 10 fold interspecies difference ×10 fold interindividual variation (Dorne and Renwick, 2005; Zhang et al., 2017). We weighed 7511 μg PM2.5 particles and dissolved it in 60 μL PBS buffer to prepare a PM2.5 suspension, which was subsequently divided into three equal portions. Pregnant mice were anaesthetized by intraperitoneal injection of 0.5% pentobarbital sodium (50 mg/kg) on 1.5 d, 7.5 d, and 12.5 d of pregnancy (corresponding to first, second and third trimester of human), followed by intratracheal instillation of 20 μL PM2.5 suspension, and the control group was intratracheally instilled with the same volume of PBS (n=8 for per group). The mice were euthanized by inhalation of 100% isoflurane on pregnancy 15.5 d and the placenta and pups were extracted (Figure 2A). After weighing and counting the weight and number of mouse placentas and fetal mice, each mouse placenta was cut from the middle and divided into two parts, one was stored in 4% paraformaldehyde, and the other was frozen in liquid nitrogen and stored at –80 °C.
Human placenta samples collection
Request a detailed protocolThe clinical specimens were collected from January 2020 to December 2021 at The Maternal and Child Healthcare Hospital of Shandong Province (Supplementary file 1). The study protocol complied with the ethical norms for the research of clinical specimens. The study protocol was approved by the Ethics Committee of Maternal and Child Healthcare Hospital of Shandong Province (permit NO. 2020–115).All pregnant women participating in the study signed an informed consent document. Placental samples were selected from 31 healthy pregnant women aged 22–33 years old. Immediately after clinical collection, the placental samples were obtained from the maternal side avoiding hemorrhaged, infarcted, or calcified tissues. The collected tissues were rinsed with cold PBS, then fixed with 4% paraformaldehyde, and finally paraffin-embedded and sectioned.
Immunohistochemical staining of placental tissue
Request a detailed protocolThe placental tissue slices were dehydrated in a gradient of xylene and ethanol, and Hematoxylin eosin (HE) staining (Beyotime Institute of Biotechnology, China) was performed to detect histopathological changes, according to the manufacturer’s instructions. The slices were dewaxed with xylene and hydrated using an ethanol gradient before being permeabilized with 0.5% Triton X-100.The slices were then blocked in 10% goat serum, and incubated with one of the primary antibodies listed in Supplementary file 4 (1:100) overnight at 4 ℃. The slices were incubated with secondary antibodies for 60 min at room temperature in the following day. Finally, the slices were washed with PBS and stained with DAPI (Beyotime Institute of Biotechnology, China). Representative images were captured using an upright fluorescence microscope (Olympus Corporation, Japan).
Cell culture and PM2.5 treatment
Request a detailed protocolThe human trophoblast cell line HTR8/SVneo, originating from human placental trophoblast cells, was purchased from The American Type Culture Collection (CRL-3271, ATCC, USA). The HTR8/SVneo cells we used were identified by STR and tested negative for mycoplasma contamination. HTR8/SVneo was cultured in RPMI-1640 medium (Shanghai BasalMedia Technologies Co., Ltd, China) supplemented with 10% fetal bovine serum (Invitrogen; Thermo Fisher Scientific, Inc, USA), 1% penicillin and streptomycin (Beyotime Institute of Biotechnology, China), and 1% 100 mM sodium pyruvate (Beyotime Institute of Biotechnology, China). Subsequently, the cells were seeded in 6-well plates (Guangzhou Jet Biofiltration Co.,Ltd, China) with 3×10⁵ cells/well, and different concentrations of PM2.5 (50 μg/mL, 100 μg/mL, 200 μg/mL) were added to the culture medium for 24 hr to construct a PM2.5 exposure cell model. N-acetyl-l-cysteine (NAC) (A7250, MillporeSigma, USA) was added to detect the rescue effect on oxidative stress caused by PM2.5 in HTR/SVneo cells.
Cell counting Kit-8 (CCK8) assay
Request a detailed protocolAfter cells were cultured with PM2.5 for 24 hr, 10 μL/well CCK-8 solution (E-CK-A362, Elabscience Biotechnology Co.,Ltd, China) was added and incubated for 2 h. Then, the absorbance was measured at 450 nm using a microplate reader (Norgen Biotek Corp., Canada).
5-Ethynyl-2'-deoxyuridine (EDU) assay
Request a detailed protocolEDU assays were used to assess cell proliferation visually based on fluorescent staining. Cells were incubated with 1×Edu working solution for 2 hr at 37 °C (C0075, Beyotime Institute of Biotechnology, China); then 4% paraformaldehyde was added for 15 min by 0.3% Triton, both at room temperature. Subsequently, 0.5 mL Click reaction solution was added for 20 min. Finally, DAPI was added to stain the nuclei. After incubation in the dark for 15 min, the 96-well plate was imaged using HCA (high content analysis) to quantitatively assess proliferation.
Apoptosis assay
Request a detailed protocolAccording to the manufacturer’s instructions (559763, BD Biosciences, Inc, USA),after suspending cells in 100 μL 1×binding buffer, Annexin V-FITC and PI were used to stain cells at room temperature in the dark for 15 min. Finally, 300 μL of 1×binding buffer was added and the cells were analyzed using the FACSCalibur flow cytometer (BD Bio-sciences, USA) for detection.
Wound-healing assay
Request a detailed protocolAfter treatment under the different conditions, the cells were seeded (7×10⁴ cells/100 µL) into a 4-Well Culture-Insert (Ibidi GmbH, Germany). The culture inserts were gently removed after 12 hr. Afterwards, medium containing different concentrations of PM2.5 and no FBS was added. Representative images of cell migration were obtained by a microscope (4×objective) at 0 and 24 hr and the wound healing area was calculated by ImageJ (National Institutes of Health, Bethesda, USA) software.
Invasion assay
Request a detailed protocolFor invasion assays, a Transwell insert (8 μm pores, Corning, Inc, USA) was placed in 24-well plates. 60 µL (1 mg/mL). Matrigel matrix (356234, Becton, Dickinson and Company, USA) was added to the upper chamber plate After the matrigel was solidified, 1×10⁵ cells were suspended in100μL medium without serum and seeded in the upper chamber. Then600 μL supplemented media was added to the bottom chamber. The cells and matrigel were removed from the chamber with a cotton swab after 12 hr cell culture at 37 ℃, and each chamber were fixed with 4% paraformaldehyde and stained with 1% crystal viole. After washing, the representative images were captured by microscope, and counted the cells in five randomly selected fields of view.
Tube formation assay
Request a detailed protocolA total of 3×10⁴ cells were seeded into96-well plates which is coated with Matrigel. After 4 hr of incubation, 5 μM Calcein Acetoxymethyl Ester (C2012, Beyotime Institute of Biotechnology, China) was added to the plate and incubated for 15 min at 37 ℃. Tube formation was observed by fluorescence microscope and the tube length was calculated by Image J.
Intracellular reactive oxygen species (ROS) assay
Request a detailed protocolUsing 2’, 7’-dichloro-dihydro-fluorescein diacetate (DCFH-DA) probe (C2938, Invitrogen; Thermo Fisher Scientific, Inc, USA) to detect intracellular ROS levels. The cells were seeded in a six-well plate (3×10⁵ cells/well). After treatment of cells as described above, 5 mM DCFH-DA was added for 30 min at 37 ℃. The nuclei were counterstained with Hoechest (33258, Beyotime Institute of Biotechnology, China) at 37 ℃ for 15 min. Finally, representative images were captured using an upright fluorescence microscope (n=3 per group). Meanwhile, ROS levels were could also be detected by flow cytometry.
Mitochondrial superoxide (MitoSOX) assay
Request a detailed protocolMitochondrial superoxide (MitoSOX) assays were conducted to detect the mitochondrial ROS levels. The cells were treated as required and subsequently seeded in 96-well plates with 8×10³ cells/well. After incubation for 12 hr at 37 ℃, the cells were incubated in HBSS supplemented with 5 μM MitoSOX regent (M36008, Invitrogen; Thermo Fisher Scientific, Inc, USA) and 5 μM Mito-Tracker green regent (M7514, Invitrogen; Thermo Fisher Scientific, Inc, USA) for 30 min at 37 ℃. Mito-Tracker green regent is often used as an intracellular mitochondria-specific fluorescent probe. Next, we removed the MitoSOX regent and stained the nuclei with Hoechst for 15 min at 37 ℃. Finally, a fluorescence microscope was used to observe the fluorescence intensity of MitoSOX and image of the cells.
Mitochondrial membrane potential (MMP) assay
Request a detailed protocolJC-1 (5,5′,6,6′-Tetrachloro-1,1′,3,3′-tetraethyl-imidacarbocyanine iodide) probe (C2005, Beyotime Institute of Biotechnology, China) was used to detect mitochondrial membrane potential (MMP). The cells were seeded in a 96-well or 24-well plate. Cells were incubated in RPMI-1640 medium with 10 μM JC-1 probe for 15 min at 37 °C and then fluorescence intensity was observed by fluorescence microscopy.
Lentiviral package and transduction
Request a detailed protocolLentiviruses were produced by transfecting HEK293T cells with two helper plasmids (psPAX2 and pMD2.G) and the pLVX-Puro vectors expressing KLF9 or CYP1A1 (performed by Tsingke Biotechnology Co., Ltd, China) (Shuen et al., 2015). The virus-containing medium was collected 48 hr and 72 hr after transfection, respectively, and filtered through a 0.45 μm membrane and mixed overnight at 4 °C with 5×PEG8000. After centrifugation at 5000 x g for 20 min, the supernatant was carefully removed, and the precipitated virus was resuspended in in pre-chilled PBS. Next, HTR8/SVneo cells were incubated in ix-well plates with 2 mL medium containing viral particles in the presence of 5 μg/mL polybrene. These cells were further cultured after 1 week with the addition of puromycin (starting from 0.5 μg/mL and increasing sequentially), and the HTR8/SVneo cell line with stable ectopic expression of KLF9 or CYP1A1 was screened.
siRNAs against KLF9, and CYP1A1 were performed by Tsingke Biotechnology Co., Ltd., China. Detailed information about siRNA was listed in Supplementary file 2. For transient transfection, 70%–80% confluent cells were transfected with indicated siRNAs using Lipofectamine RNAi MAX (Thermo Fisher Scientific, 13778150) for 48 hr according to the manufacturer’s instructions.
Dual-luciferase reporter assay
Request a detailed protocolDual luciferase gene reporter analysis was performed using a plasmid in which the human CYP1A1 promoter (TSS, –532 to +88) or its mutant sequence was inserted between the KpnI and XhoI restriction sites of the pGL3 basic expression vector (Figure 9F). Cells were transfected using Lipofectamine 3000 (L3000150, Thermo Fisher Scientific, Inc USA) according to the manufacturer’s instructions. To correct for transfection efficiency, cells were co-transfected with the pRL-TK vector encoding Renilla luciferase and CYP1A1-pGL3-WT or the respective mutant plasmid. After 48 hr, firefly and Renilla luciferase activities in cell lysates were measured on a microplate luminometer using a dual luciferase reporter assay kit (E1910, Promega Corporation, USA) according to the manufacturer’s protocol.
High-throughput sequencing and bioinformatics analysis
Request a detailed protocolTwo groups of HTR8/SVneo cells were cultured in six-well plates exposed to PM2.5-free RPMI-1640 or PM2.5 100 µg/mL for 24 hr. To ensure the accuracy of data interpretation and analysis, three biological replicates were established for the control and treated cells. Total RNA was isolated and purified using TRIzol reagent (15596018, Invitrogen; Thermo Fisher Scientific, Inc, USA) according to the manufacturer’s instructions. The sequencing was completed by Beijing Genomics Institute (BGI). The raw sequencing data was subjected to filtration using SOAPnuke in order to obtain clean reads. The clean reads were mapped to the reference genome using HISAT, and aligned to the assembled unique gene set using Bowtie2. Subsequently, the data analysis and mapping were performed utilizing the sequencing company’s proprietary system (https://biosys.bgi.com). The gene expression was quantified utilizing the RNA-Seq by Expectation-Maximization (RSEM) algorithm, and differentially expressed genes (DEGs) were identified by the R-Bioconductor package DESeq2 with pre-set Q value﹤0.05 and |log2[Fold Change]|≥1. KEGG enrichment analysis of annotated DEGs was performed using phyper based on Hypergeometric test, and the significance values of pathways were strictly threshold corrected by Q values (Q values≤0.05). Gene Set Enrichment Analysis (GSEA) was performed on control and treatment groups based on KEGG database data. All parameters were kept at default settings, except for the maximum size of the filtering threshold which was adjusted to 5000. Gene features with FDR Q values≤0.25 were deemed statistically significant. The RNA sequencing data were deposited into the Gene Expression Omnibus (GEO) database (accession number: GSE237795).
mRNA degradation assay
Request a detailed protocolActinomycin D (GC16866,Glpbio, USA) was used to detect mRNA degradation. HTR8/SVneo cells pre-exposed or not exposed to PM2.5 (100 µg/mL) were treated with 20 μM actinomycin D (RNA synthesis inhibitor) for 0, 3, 6, 9, 18, or 24 hr, respectively, and CYP1A1 mRNA levels were measured by qRT-PCR. The half-life of mRNA was calculated by non-linearly fitting the relative expression of the time gradient by GraphPad Prism Version 8.0 (GraphPad Software, Inc).
Chromatin immunoprecipitation (ChIP)
Request a detailed protocolChIP assays were performed on HTR8/SVneo cells stably overexpressing KLF9 using a ChIP assay kit (P2078, Beyotime Institute of Biotechnology, China) according to the manufacturer’s instructions. HTR8/SVneo cells (2×10⁶ cells) were cross-linked in 10 cm dishes, then the nuclear lysates were sonicated to shear DNA to approximately 200–300 bp fragments, followed by immunoprecipitation overnight at 4 °C using the anti-IgG or anti-KLF9 antibodies listed in Supplementary file 4. The immunoprecipitated DNA was purified using a DNA purification kit (DP214, Tiangen Biotech Co.,Ltd, China) and then analyzed by PCR using the primers specified in Supplementary file 3.
Tunel staining
Request a detailed protocolTUNEL staining (E-CK-A320, Elabscience Biotechnology Co.,Ltd, China) was used to detect cell and tissue apoptosis. TPlacental tissue slices were dewaxed with xylene and hydrated using an ethanol gradient. According to the manufacturer’s instructions, the proteinase K working solution and DNase I working solution were dropped onto the slices. After the addition of the TDT reaction solution, the cells were allowed to react at 37 °C for 60 min in the dark, and DAPI was added to stain the cell nuclei. Finally, staining was observed using a fluorescence microscope and imaged.
Analysis of GSH, MDAcontent and SOD activity
Request a detailed protocolGlutathione Assay Kit (MAK440, MilliporeSigma, USA), Mn-SOD Assay Kit with WST-8 (S0103, Beyotime Institute of Biotechnology, China), and MDA Assay Kit (S0131S, Beyotime Institute of Biotechnology, China) were used to analyze the glutathione (GSH), superoxide dismutase (SOD), and malondialdehyde (MDA) activity in cells, according to the manufacturer’s protocol.
Western blot assay
Request a detailed protocolWestern blotting was applied to detect the protein expression levels in cells or tissues, as described previously (Li et al., 2022). The antibodies used were listed in Supplementary file 4.
Statistical analyses
Request a detailed protocolThe data were analyzed by GraphPad Prism version 8.0 (GraphPad Software, Inc, USA) and presented as the mean ± SEM. All experiments were repeated at least times. The differences between groups were compared by an unpaired two-tailed Student’s t-test or an ANOVA. Correlation analysis was performed using Pearson’s correlation analysis. Differences with a p value less than 0.05 were considered to indicate a statistically significant difference.
Appendix 1
Reagent type (species) or resource | Designation | Source or reference | Identifiers | Additional information |
---|---|---|---|---|
Gene (Homo sapiens) | CYP1A1 | GenBank | HGNC:HGNC:2595 | |
Gene (Homo sapiens) | KLF9 | GenBank | HGNC:HGNC:1123 | |
Antibody | anti-CYP1A1 (Rabbit polyclonal) | Proteintech | Cat#13241–1-AP | WB (1:1000) IHC (1:500) |
Antibody | anti-KLF9 (Rabbit polyclonal) | Abcam | Cat#ab227920 | WB (1:1000) IHC (1:500) ChIP (1:1000) |
Antibody | anti-HO-1 (Rabbit polyclonal) | Cohesion Biosciences | Cat#CQA2561 | WB (1:1000) |
Antibody | anti-NQO-1 (Rabbit polyclonal) | Cohesion Biosciences | Cat#CPA1342 | WB (1:1000) |
Antibody | anti-GCLC (Rabbit polyclonal) | Cohesion Biosciences | Cat#CPA2092 | WB (1:1000) |
Antibody | anti-SOD-1 (Rabbit polyclonal) | Cohesion Biosciences | Cat#CPA1476 | WB (1:1000) |
Antibody | anti-CK-7 (Rabbit monoclonal) | Abcam | Cat#ab68459 | IHC (1:500) |
Antibody | anti-β-actin (Mouse monoclonal) | Proteintech | Cat#66009 | WB (1:1000) |
Antibody | anti-Lamin B | Proteintech | Cat#12987–1-AP | WB (1:1000) |
Cell line (Homo sapiens) | HTR8-SVneo (Homo sapiens) | ATCC | NO.CRL-3271 | |
Sequence-based reagent | siCYP1A1#1_F | This paper | siRNA sequence | GGUAUGUGGUGGUAUCAGUTT |
Sequence-based reagent | siCYP1A1#1_R | This paper | siRNA sequence | ACUGAUACCACCACAUACCTT |
Sequence-based reagent | siCYP1A1#2_F | This paper | siRNA sequence | CCUUCAAGGACCUGAAUGATT |
Sequence-based reagent | siCYP1A1#2_R | This paper | siRNA sequence | UCAUUCAGGUCCUUGAAGGTT |
Sequence-based reagent | siKLF9#1_F | This paper | siRNA sequence | GCCCAUUACAGAGUGCAUATT |
Sequence-based reagent | siKLF9#1_R | This paper | siRNA sequence | UAUGCACUCUGUAAUGGGCTT |
Sequence-based reagent | siKLF9#2_F | This paper | siRNA sequence | GGAGUGACCACCUCACAAATT |
Sequence-based reagent | siKLF9#2_R | This paper | siRNA sequence | UUUGUGAGGUGGUCACUCCTT |
Sequence-based reagent | CYP1A1_F | This paper | PCR primers | TGGCATCCTCTACAGACTCCTG |
Sequence-based reagent | CYP1A1_R | This paper | PCR primers | CTTCAGGTTGCGTGCCATCTCA |
Sequence-based reagent | KLF9_F | This paper | PCR primers | CTACAGTGGCTGTGGGAAAGTC |
Sequence-based reagent | KLF9_R | This paper | PCR primers | CTCGTCTGAGCGGGAGAACTTT |
Sequence-based reagent | CYP1A1-promoter_F | This paper | PCR primers | CTGCTTCTCCCTCCATCT |
Sequence-based reagent | CYP1A1-promoter _R | This paper | PCR primers | GGAACTGTCACCTTCAGG |
Commercial assay or kit | GSH | MilliporeSigma | MAK440 | |
Commercial assay or kit | SOD | Beyotime Institute of Biotechnology, China | S0103 | |
Commercial assay or kit | MDA | Beyotime Institute of Biotechnology, China | S0131S | |
Commercial assay or kit | EDU | Beyotime Institute of Biotechnology, China | C0075 | |
Commercial assay or kit | Apoptosis kit | BD Biosciences | 559763 | |
Commercial assay or kit | TUNEL staining | Elabscience Biotechnology | E-CK-A320 | |
Commercial assay or kit | ChIP assay kit | Beyotime Institute of Biotechnology | P2078 | |
Commercial assay or kit | Dual luciferase reporter assay kit | Promega Corporation | E1910 | |
Recombinant DNA reagent | pLVX-Puro (plasmid) | purchased from Tsingke biotechnology | plasmid sequences were verified by Tsingke biotechnology | |
Recombinant DNA reagent | pLVX-CYP1A1- 3×FLAG (plasmid) | purchased from Tsingke biotechnology | plasmid sequences were verified by Tsingke biotechnology | |
Recombinant DNA reagent | pLVX-KLF9- 6×His (plasmid) | purchased from Tsingke biotechnology | plasmid sequences were verified by Tsingke biotechnology | |
Chemical compound, drug | NAC | MillporeSigma | A7250 | |
Chemical compound, drug | JC-1 | Beyotime Institute of Biotechnology | C2005 | |
Chemical compound, drug | Actinomycin D | Beyotime Institute of Biotechnology | GC16866 | |
Software, algorithm | Image J | National Institutes of Health | V 1.8.0 | |
Software, algorithm | GraphPad | GraphPad Software | V 8.0 |
Data availability
The RNA sequencing data were deposited into the Gene Expression Omnibus (GEO) database (accession number: GSE237795).
-
NCBI Gene Expression OmnibusID GSE237795. PM2.5 leads to adverse pregnancy outcomes by inducing trophoblast oxidative stress and mitochondrial apoptosis via KLF9/CYP1A1 transcriptional axis.
References
-
Interaction of NK Cells, Trophoblast, and Endothelial Cells during AngiogenesisBulletin of Experimental Biology and Medicine 167:169–176.https://doi.org/10.1007/s10517-019-04484-2
-
PM2.5 promotes NSCLC carcinogenesis through translationally and transcriptionally activating DLAT-mediated glycolysis reprogramingJournal of Experimental & Clinical Cancer Research 41:229.https://doi.org/10.1186/s13046-022-02437-8
-
A novel approach to predict the comprehensive EROD potency: Mechanism-based curve fitting of CYP1A1 activity by PAHsThe Science of the Total Environment 843:157052.https://doi.org/10.1016/j.scitotenv.2022.157052
-
Ambient PM2.5 caused depressive-like responses through Nrf2/NLRP3 signaling pathway modulating inflammationJournal of Hazardous Materials 369:180–190.https://doi.org/10.1016/j.jhazmat.2019.02.026
-
Dexamethasone-induced Krüppel-like factor 9 expression promotes hepatic gluconeogenesis and hyperglycemiaThe Journal of Clinical Investigation 129:2266–2278.https://doi.org/10.1172/JCI66062
-
PM2.5-induced oxidative stress triggers autophagy in human lung epithelial A549 cellsToxicology in Vitro 27:1762–1770.https://doi.org/10.1016/j.tiv.2013.05.004
-
Mechanism of PM2.5-induced human bronchial epithelial cell toxicity in central ChinaJournal of Hazardous Materials 396:122747.https://doi.org/10.1016/j.jhazmat.2020.122747
-
Air pollution exposure during pregnancy and spontaneous abortion and stillbirthReviews on Environmental Health 33:247–264.https://doi.org/10.1515/reveh-2017-0033
-
Effect of EGCG on bronchial epithelial cell premalignant lesions induced by cigarette smoke and on its CYP1A1 expressionInternational Journal of Molecular Medicine 48:220.https://doi.org/10.3892/ijmm.2021.5053
-
PM2.5 induces pulmonary microvascular injury in COPD via METTL16-mediated m6A modificationEnvironmental Pollution 303:119115.https://doi.org/10.1016/j.envpol.2022.119115
-
Long-term exposures to air pollution and the risk of atrial fibrillation in the women’s health initiative cohortEnvironmental Health Perspectives 129:97007.https://doi.org/10.1289/EHP7683
-
Mitochondrial protection by simvastatin against angiotensin II-mediated heart failureBritish Journal of Pharmacology 176:3791–3804.https://doi.org/10.1111/bph.14781
-
Ambient PM2.5 Aluminum and Elemental Carbon and Placental Abruption MorbidityJournal of Occupational and Environmental Medicine 59:148–153.https://doi.org/10.1097/JOM.0000000000000927
-
Human placenta as a “dual” biomarker for monitoring fetal and maternal environment with special reference to potentially toxic trace elements. Part 3: toxic trace elements in placenta and placenta as a biomarker for these elementsThe Science of the Total Environment 280:221–238.https://doi.org/10.1016/s0048-9697(01)00827-0
-
Proteomics and metabolic phenotyping define principal roles for the aryl hydrocarbon receptor in mouse liverActa Pharmaceutica Sinica. B 11:3806–3819.https://doi.org/10.1016/j.apsb.2021.10.014
-
Influence and prediction of PM2.5 through multiple environmental variables in ChinaThe Science of the Total Environment 849:157910.https://doi.org/10.1016/j.scitotenv.2022.157910
-
Direct, continuous monitoring of air pollution by transgenic sensor mice responsive to halogenated and polycyclic aromatic hydrocarbonsEnvironmental Health Perspectives 116:349–354.https://doi.org/10.1289/ehp.10722
-
CYP1A1 Enzymatic Activity Influences Skin Inflammation Via Regulation of the AHR PathwayThe Journal of Investigative Dermatology 141:1553–1563.https://doi.org/10.1016/j.jid.2020.11.024
-
Ambient air pollution and adverse birth outcomes: Differences by maternal comorbiditiesEnvironmental Research 148:457–466.https://doi.org/10.1016/j.envres.2016.04.026
-
Exposure to PM2.5 during Pregnancy and Fetal Growth in Eastern Massachusetts, USAEnvironmental Health Perspectives 130:130.https://doi.org/10.1289/EHP9824
-
Suppression of FPR2 expression inhibits inflammation in preeclampsia by improving the biological functions of trophoblast via NF-κB pathwayJournal of Assisted Reproduction and Genetics 39:239–250.https://doi.org/10.1007/s10815-022-02395-2
-
SEM/EDS and XRD characterization of raw and washed MSWI fly ash sintered at different temperaturesJournal of Hazardous Materials 162:161–173.https://doi.org/10.1016/j.jhazmat.2008.05.029
-
Effect of Fine Particulate Matter (PM2.5) on Rat Placenta Pathology and Perinatal OutcomesMedical Science Monitor 22:3274–3280.https://doi.org/10.12659/MSM.897808
-
The role of cytochrome P450-mediated detoxification in insect adaptation to xenobioticsCurrent Opinion in Insect Science 43:103–107.https://doi.org/10.1016/j.cois.2020.11.004
-
Pyrethroid insecticide lambda-cyhalothrin induces hepatic cytochrome P450 enzymes, oxidative stress and apoptosis in ratsThe Science of the Total Environment 631–632:1371–1382.https://doi.org/10.1016/j.scitotenv.2018.03.030
-
Maternal exposure to fine particulate matter over the first trimester and umbilical cord insertion abnormalitiesInternational Journal of Epidemiology 51:191–201.https://doi.org/10.1093/ije/dyab192
-
Placental circadian pathway methylation and in utero exposure to fine particle air pollutionEnvironment International 114:231–241.https://doi.org/10.1016/j.envint.2018.02.034
-
PM2.5 induces liver fibrosis via triggering ROS-mediated mitophagyEcotoxicology and Environmental Safety 167:178–187.https://doi.org/10.1016/j.ecoenv.2018.08.050
-
Which are the Keystones in the Dynamic AHR-CYP1A1 Signaling Network?The Journal of Investigative Dermatology 142:1758–1760.https://doi.org/10.1016/j.jid.2021.10.022
-
AHR-mediated ROS production contributes to the cardiac developmental toxicity of PM2.5 in zebrafish embryosThe Science of the Total Environment 719:135097.https://doi.org/10.1016/j.scitotenv.2019.135097
-
Particulate pollutants and racial/ethnic disparity in feto-infant morbidity outcomesMaternal and Child Health Journal 16:1679–1687.https://doi.org/10.1007/s10995-011-0868-8
-
Salidroside prevents PM2.5-induced BEAS-2B cell apoptosis via SIRT1-dependent regulation of ROS and mitochondrial functionEcotoxicology and Environmental Safety 231:113170.https://doi.org/10.1016/j.ecoenv.2022.113170
-
The aryl hydrocarbon receptor as a modulator of anti-viral immunityFrontiers in Immunology 12:624293.https://doi.org/10.3389/fimmu.2021.624293
-
Functional Analyses of Four CYP1A1 Missense Mutations Present in Patients with Atypical Femoral FracturesInternational Journal of Molecular Sciences 22:7395.https://doi.org/10.3390/ijms22147395
-
Pregnancy preserves pulmonary function following influenza virus infection in C57BL/6 miceAmerican Journal of Physiology. Lung Cellular and Molecular Physiology 315:L517–L525.https://doi.org/10.1152/ajplung.00066.2018
-
Transgenic Overexpression of Aryl Hydrocarbon Receptor Repressor (AhRR) and AhR-Mediated Induction of CYP1A1, Cytokines, and Acute ToxicityEnvironmental Health Perspectives 124:1071–1083.https://doi.org/10.1289/ehp.1510194
-
Cardiotoxicity and Mechanism of Particulate Matter 2.5 (PM2.5) Exposure in Offspring Rats During PregnancyMedical Science Monitor 23:3890–3896.https://doi.org/10.12659/MSM.903006
-
PM2.5 constituents and oxidative DNA damage in humansEnvironmental Science & Technology 43:4757–4762.https://doi.org/10.1021/es803337c
-
Rapid improvement of PM2.5 pollution and associated health benefits in China during 2013–2017Science China Earth Sciences 62:1847–1856.https://doi.org/10.1007/s11430-018-9348-2
-
Ambient fine particulate matter (PM2.5) induces oxidative stress and pro-inflammatory response via up-regulating the expression of CYP1A1/1B1 in human bronchial epithelial cells in vitroMutation Research. Genetic Toxicology and Environmental Mutagenesis 839:40–48.https://doi.org/10.1016/j.mrgentox.2018.12.005
-
1 H NMR-based metabolomics study on repeat dose toxicity of fine particulate matter in rats after intratracheal instillationScience of The Total Environment 589:212–221.https://doi.org/10.1016/j.scitotenv.2017.02.149
-
PM2.5 induces male reproductive toxicity via mitochondrial dysfunction, DNA damage and RIPK1 mediated apoptotic signaling pathwayScience of The Total Environment 634:1435–1444.https://doi.org/10.1016/j.scitotenv.2018.03.383
-
Promotion of Bladder Cancer Cell Metastasis by 2-Mercaptobenzothiazole via Its Activation of Aryl Hydrocarbon Receptor Transcription: Molecular Dynamics Simulations, Cell-Based Assays, and Machine Learning-Driven PredictionEnvironmental Science & Technology 56:13254–13263.https://doi.org/10.1021/acs.est.2c05178
-
Evaluating the toxicity of silver nanoparticles by detecting phosphorylation of histone H3 in combination with flow cytometry side-scattered lightEnvironmental Science & Technology 49:5003–5012.https://doi.org/10.1021/acs.est.5b00542
-
Direct effects of airborne PM2.5 exposure on macrophage polarizationsBiochimica et Biophysica Acta 1860:2835–2843.https://doi.org/10.1016/j.bbagen.2016.03.033
-
Nrf2 amplifies oxidative stress via induction of Klf9Molecular Cell 53:916–928.https://doi.org/10.1016/j.molcel.2014.01.033
Decision letter
-
Marisa NicolásReviewing Editor; Laboratório Nacional de Computação Científica, Brazil
-
Diane M HarperSenior Editor; University of Michigan, United States
In the interests of transparency, eLife publishes the most substantive revision requests and the accompanying author responses.
Decision letter after peer review:
Thank you for submitting your article "PM2.5 leads to adverse pregnancy outcomes by inducing trophoblast oxidative stress and mitochondrial apoptosis via KLF9/CYP1A1 transcriptional axis" for consideration by eLife. Your article has been reviewed by 3 peer reviewers, one of whom is a member of our Board of Reviewing Editors, and the evaluation has been overseen by Diane Harper as the Senior Editor.
The reviewers have discussed their reviews with one another, and the Reviewing Editor has drafted this to help you prepare a revised submission.
Essential revisions:
1) One concern from this study is regarding the experimental design, particularly the dosage of PM2.5 used in this paper, as well as the timing and frequency of administration of this compound. The authors should perform further experiments at a lower dose or administration frequency to represent a more physiologically relevant scenario.
2) The metformin data lack rigour, and the authors would remove them and use these data to focus on a new study.
3) There are several concerns regarding the figures accompanying the results, including some that are not self-explanatory.
Reviewer #1 (Recommendations for the authors):
Air pollutant such as particulate matter PM2.5 is considered one of the most severe toxic associated with various adverse pregnancy outcomes. Most present research on PM2.5 in adverse effects on human pregnancy is focused on the epidemiological aspects, remaining partially unraveling the underlying molecular mechanisms. In this research, Zhang Wang and colleagues used PM2.5 collected from the urban region of Jinan, China, to establish pollutant exposure experiments by in vivo animal models and in vitro trophoblast cells. All experiments were evaluated by several in vitro techniques, including RNAseq analysis and in silico exploration of differentially expressed genes to infer the effect of PM2.5 on the mice pregnancy and human trophoblast cells.
One caution of these studies is the dosage calculations for the in vivo and in vitro experimental design to evaluate the effect of PM 2.5. In the mice model, they administered doses of daily PM2.5 inhalation several times higher than a pregnant woman in Jinan might experience. On the other hand, an equivalent high dosage was applied to trophoblasts to extract total RNA and perform the RNAseq. However, the in silico data analysis only detected 32 differentially expressed genes using a Log2FC of no more than 1, denoting the subtle effect between the control and the treatments.
Despite this, through in vivo experiments, the authors show that the administration of PM2.5 by intratracheal route leads to significant changes in the pregnancy of mice, significantly increased fetal mortality, decreased fetal weight and number, and damaged placental structure. The in vitro experiments showed increased apoptosis in trophoblastic line HTR8/SVneo cells.
Through RNAseq experiments, the authors were able to infer two genes, KLF9 and CYP1A1, from the set of genes differentially expressed between trophoblast cells treated with 100 ug of PM2.5 compared to untreated controls. In addition, the authors demonstrated by in vitro ChIP assay the binding of KLF9 to the CYP1A1 promoter, proving that KLF9 is a positive modulator of CYP1A1 expression triggered by PM2.5. Consequently, the authors suggested activating this KLF9/CYP1A1 pathway promotes the empirically observed effects of oxidative stress and cell death in trophoblasts and the placenta of pregnant mice. But this study has not explored the mechanisms by which PM2.5 activates KLF9.
By additional experiments at the end of this work, the authors found that a single empirically deduced dose of metformin can reverse the toxic effects of PM2.5 on trophoblast cells of the HTR8/SVneo lineage. They observed that cells treated with metformin resulted in reduced expression of KLF9 and CYP1A1 compared to PM2.5-exposed cells. However, this experiment shows limitations, such as the single dose of the inhibitory drug used and a bias in the genetic mechanisms by focusing only on the two genes, KLF9 and CP1A1.
This study used PM2.5 collected from the urban region of Jinan, China, to establish pollutant exposure experiments by in vivo animal models and trophoblast cells. This relevant study applies several in vitro and in silico techniques from these models. The authors identify that PM2.5 activates the KLF9/CYP1A1 signaling pathway causing oxidative stress damage with mitochondrial apoptosis, which can be correlated to poor pregnancy outcomes observed in mice.
I have the following comments:
1. The in vivo experimental designs of PM 2.5 dosage calculations are not unreliable to me. Because the in vitro and in vivo experiments were administered doses of daily PM2.5 inhalation huge times higher (2.503 ug) than a pregnant woman in Jinan might experience (3.6 ug). The inferences from this experimental design so different from the natural investigation in humans should be better explained. Also, it should be justified in comparison with some experiments with the proper doses experienced by pregnant women in Jinan.
On the other hand, the dosage applied to trophoblasts for the extraction of total RNA and consequent RNAseq only detected 32 differentially expressed genes by using a Log2FC of 1, denoting the subtle effect between the control and the treatments. Under natural exposure conditions of daily PM2.5 (3.6 ug) instead of the current in vitro design (100 ug), it would be interesting to explore the gene expression results. Authors should discuss all these experimental limitations more rigorously.
2. Regarding the English written in the manuscript, I found several misspelled words, such as typo errors. Also, the authors need to check a few wrong or missing prepositions, punctuation, and the agreement between subject and verb in some sentences. Furthermore, please check words in the original language?
3. In the manuscript, beginning with the abstract, it would be essential to change the meaning of the inferences obtained from the analysis of the RNAseq experiments. Since this type of in vitro experiment is only exploratory, it then raises hypotheses that must be confirmed a posteriori through other in vivo experiments. In the abstract the current text reads: "we comprehensively analyzed the transcriptional landscape of HTR8/SVneo cells exposed to PM2.5 through RNA-Seq and confirmed that PM2.5 triggered oxidative stress and mitochondrial apoptosis to damage HTR8/SVneo cell biological functions through CYP1A1." The meaning could be changed by using this statement "we comprehensively analyzed the transcriptional landscape of HTR8/SVneo cells exposed to PM2.5 through RNA-Seq and observed that PM2.5 triggered overexpression of pathways involved in oxidative stress and mitochondrial apoptosis to damage HTR8/SVneo cell biological functions through CYP1A1." Or "we comprehensively analyzed the transcriptional landscape of HTR8/SVneo cells exposed to PM2.5 through RNA-Seq and confirmed by validation tests that PM2.5 triggered oxidative stress and mitochondrial apoptosis to damage HTR8/SVneo cell biological functions through CYP1A1."
4. The methodology for the bioinformatics analysis of the RNA-seq experiments needs to be better described. The authors should better detail the data pre-processing steps (to get quality control), including the software and the parameters applied until achieved at Differentially Expressed Genes (DEGs), such as read alignments, counts, normalization, and DEGs.
Although the analyses of the KEGG pathway enrichment analysis of differentially expressed genes and Gene Set Enrichment Analysis (GSEA) were carried out in a particular company, it is also desirable that the details of the analyses are described in the methodology with their respective parameters.
5. Some bioinformatics analyses deserve to be better explained. This is because this manuscript reports an interdisciplinary work, and it is expected that non-experts in bioinformatics can understand the findings and correlations between the different results. For example, explain in more detail the analyses and how to interpret each result shown in figure 4, from A to H, particularly curves and cutoff values.
6. Figures:
6.1. I feel that the figures presented accompanying the results are not self-explanatory. There are too many tags that the non-expert reader cannot understand because they have not dominated the meaning. To cite just one example here: Figure 9D: si-NC – si-KLF9#1 – si-KLF9#2. The authors need to put the meaning of the figures' tags in the respective captions. Remembering again that this is an interdisciplinary paper.
6.2. There is a critical error in Figure 4E, where the authors show the Z-score scale in the heat map. While in the manuscript text they describe that 24 genes were up-regulated and eight genes down-regulated in the PM 2.5 samples, in Figure 4E, we see the opposite. In Figure 4E, we see 24 genes in red that represent an expression level lower than the mean, whereas eight green genes that represent an expression level above the mean related to PM 2.5 samples compared to control samples. Please check this figure and identify and correct this critical error.
6.3. Figure 9G is very confusing to me. This figure contains a left and right panel that the reader must interpret as correlating. The left panel shows the CYP1A1 promoter region with several deletions that either resulted in failure of binding by FT KLF9 or not. Therefore, in the right panel, the reader would expect to see which mutations prevent FT KLF9-mediated CY1A1 expression. However, in Figure 9G on the right panel, the authors showed the expression of KLF9 or control. So, in this scenario, the picture gets confused. I suggest that the authors correct this figure to clarify this experiment's results.
Also, in the explanation of this figure 9, there is a mistake in the sense of writing, e.g., "These results suggested that a response element of the CYP1A1 promoter located in the -64 bp to -49 bp region, GAAGGAGGCGTGGCC, was required for the transcription of KLF9." A change to the following is recommended: "…, was required for the transcription of CYP1A1 meditated by KLF9."
6.4. Figures 9 H and I do not show what the authors claim in the text: "The chromatin was precipitated with specific antibodies for KLF9 or IgG, and PCR analysis with the indicated primers showed that KLF9 was able to bind directly to the CYP1A1 promoter (Figure 9H and I)."
The authors need to show the figure that corresponds with this statement. It would be interesting to perform the ChIP analysis experiment using wild-type and mutant constructs of the CY1A1 promoter, confirming the results of the region of this promoter that effectively binds KLF9.
7. Discussion: related to this sentence "To our knowledge, this study is the first to report that PM2.5 caused mitochondrial apoptosis via inducing oxidative stress, which in-turn impaired a series of biological functions such as invasion, migration, and angiogenesis in placental trophoblasts." Actually, this one paper Front. Endocrinol., 12 March 2020 Sec. Translational Endocrinology Volume 11 – 2020 https://doi.org/10.3389/fendo.2020.00075. Please double check, since they also described oxidative damage in trophoblasts and correct corresponding.
8. Inferences report to metformin:
Inferences about the application of the drug metformin were raised from experiments testing a single dose at a high level (20 mM). The authors only concentrated on the target genes highlighted in this work (CYP1A1 and KLF9).
I suggest that metformin evaluation should be better explored in another paper. In this scenario, the results are not very robust and complicate the focus of this paper, which turned out to be very large. Metformin could be explored by tests using more treatments and even performing new RNAseq experiments on trophoblast cells exposed to the drug at different doses.
Reviewer #2 (Recommendations for the authors):
Epidemiological studies have linked an increase in air pollutants, including fine particulate matter (PM2.5) to adverse pregnancy and postnatal outcomes. However, the molecular details of this are unclear, partially because there is no established mouse model in which to investigate the effects of PM2.5 on mammalian pregnancy. Li and Li et al. begin this study with the collection and characterization of PM2.5 from a high-volume sampling system set up in Jinan City, China. Upon collection of this material, the authors began their study using scanning electron microscopy and elemental analysis to define the properties of PM2.5. The authors use this material to establish a mouse model and cellular system to test the molecular effects of PM2.5 on pregnancy, postnatal mouse health, and trophoblast cells. One caveat of these studies is the dosage of PM2.5 given to the mice; the authors calculate dosages based on their estimation of PM2.5 exposure of pregnant women in Jinan in 2020, but include a 100-fold "uncertainty factor," which substantially increases the amount of PM2.5 given to the mice in their model system. This, along with the multiple timepoints at which PM2.5 is administered, suggests that the authors may be dosing mice with up to 400 times higher levels of PM2.5 than humans experience, on average, based on their own calculations. It is unclear if more physiologically relevant doses of PM2.5 (less the uncertainty factor) would have such stark effects on pregnancy outcomes as are shown in this study.
Nonetheless, the authors show that administration of PM2.5 through intratracheal inhalation leads to increased fetal mortality, decreased fetal weight and number, damaged placental structure, and increased trophoblast apoptosis in mice and in isolated trophoblast cells. To investigate the molecular mechanisms underlying these phenotypes, the authors performed RNAseq on PM2.5-treated trophoblasts and identify two genes, CYP1A1 and KLF9, that are transcriptionally upregulated upon PM2.5 exposure. The authors find that genetic ablation of CYP1A1 diminishes oxidative stress and intrinsic cell death in PM2.5-treated cells, suggesting upregulation of this cytochrome P450 family member at least partially drives toxicity in this model. The authors then link KLF9, a transcription factor also upregulated in PM2.5-treated trophoblasts, to CYP1A1 expression, mapping the KLF9 responsive element in the CYP1A1 promoter. These data suggest that PM2.5 exposure induces KLF9-mediated transcription of CYP1A1 to promote oxidative stress and cell death in trophoblasts and in the placenta of pregnant mice. In a final set of experiments, the authors find that a relatively high dose of 20 mM metformin can ameliorate some toxic effects of PM2.5 in trophoblast cells, and that this correlates with a decrease in PM2.5-induced CYP1A1 and KLF9 expression.
Collectively, the data presented by the authors convincingly demonstrate that: 1. The chosen dose of PM2.5 administered to mice causes significant increases in fetal mortality and morbidity; 2. Treatment of trophoblasts with PM2.5 causes oxidative stress, increases in apoptosis, and results in the transcriptional upregulation of CYP1A1 and KLF9; 3. KLF9 binds to the CYP1A1 promoter, driving its expression upon PM2.5 exposure, and that 4. CYP1A1 upregulation is necessary for PM2.5-induced oxidative stress. The authors also claim that "metformin could eliminate the toxicity induced by PM2.5 via the KLF9/CYP1A1 transcriptional regulatory axis" in their model trophoblast cell line, although this link is correlative as presented within the current study. While the data strongly implicate KLF9 and CYP1A1 to PM2.5-mediated toxicity, the mechanisms by which KLF9 senses PM2.5 were not established in this study, nor were the effects of KLF9 on gene products other than CYP1A1, which may also contribute to the phenotypes seen within this mouse model. Finally, though the reasoning for testing metformin in this disease model is not fully clear, there does seem to be therapeutic benefit at high doses of metformin to ameliorate phenotypes associated with PM2.5-mediated toxicity.
This is an important study on the effects of PM2.5 on pregnancy outcomes in mice. Overall, the authors use multiple independent systems to test the effects of PM2.5 in both mice and in trophoblast cells, adding rigor to the approach. The authors put forth a number of claims in the abstract, most of which are well justified:
1. "…PM2.5 induced adverse gestational outcomes such as increased fetal mortality rates, decreased fetal number and weight, damaged placental structure, and increased apoptosis of trophoblasts."
2. "…PM2.5 induced dysfunction of the trophoblast cell line HTR8/SVneo, including its proliferation, apoptosis, invasion, migration, and angiogenesis."
3. "…PM2.5 triggered oxidative stress and mitochondrial apoptosis to damage HTR8/SVneo cell biological functions through CYP1A1."
4. "…PM2.5 stimulated KLF9, a transcription factor identified as binding to CYP1A1 promoter region."
5. "…metformin could eliminate the toxicity induced by PM2.5 via the KLF9/CYP1A1 transcriptional regulatory axis in HTR8/SVneo."
The first four of these claims are well justified. The data presented may support the last claim on metformin treatment, but the data supporting this are correlative (see revision suggestions below). While the data collected support the hypothesis that PM2.5 leads to oxidative stress via the upregulation of KLF9 and CYP1A1, I have four main concerns that the authors could address to strengthen this work, which I outline below.
1. I am concerned with the dosages of particulate matter administered to the mice and cell models, and that these exceed physiologically relevant doses based on the calculations the authors provide in the methods section. The authors calculate a single dose of administration based on the average daily PM2.5 inhalation rate, and multiply it by 20 to reflect the full-term pregnancy in a mouse. However, the authors then use a 100-fold 'uncertainty factor' and administer this dose four times, despite the fact that the full pregnancy duration had already been factored into their calculations. Thus, one dose is ~100x the full exposure of PM2.5, but the authors administering this four times increases the potential exposure to ~400x what a pregnant woman in Jinan may experience. It is not hard to imagine that an excess dose may cause more severe pathologies than what women actually experience through PM2.5 inhalation. The authors should explain and justify why they used such high doses based on their own calculations and should repeat some key experiments with lower doses of PM2.5 to reflect physiologically relevant exposures.
2. The metformin data at the end of the manuscript are unnecessary, and I believe they should be removed from the manuscript. While the authors demonstrate that a single high dose (20 mM) metformin can alleviate select phenotypes induced by PM2.5, these data are not rigorous enough to justify the use of metformin to alleviate PM2.5 toxicity in mice. Collection of such data would be beyond the scope of this manuscript, as it is already 11 figures worth of data. Furthermore, the authors suggest that metformin acts through the CYP1A1/KLF9 signaling axis, but they only show correlative data that these two proteins change at one dose of metformin administered for one timepoint. While these two key PM2.5 targets do change in response to metformin, significantly more data would need to be collected to demonstrate that these targets are required for this response. Finally, the justification for looking at metformin is obscure, and it is unclear why the authors chose this compound other than their statement that metformin is a 'miracle' drug. Collectively, the lack of rationale, effects only at a single high dose, and correlative nature of involvement with the KLF9/CYP1A1 pathway leave this line of investigation with insufficient rigor. As a substantial amount of work would be required to alleviate this, it would be advisable for the authors to remove this portion of the manuscript so as to be able to more fully characterize these phenotypes in a future study.
3. Some data would be more powerful if shown in a more quantitative manner. This includes the MitoSOX microscopy (Figures 5G, 7I, 10G) and the JC-1 microscopy (Figures 5H, 7J, 10F). There are also portions of the manuscript in which the authors claim "significant" changes in their data, but these experiments are not accompanied by statistical analysis (Figure 7B… "The results showed that, compared to the control group, the expression of CYP1A1 was significantly increased by PM2.5 exposure.") The authors should change the verbiage (e.g., 'substantially') or perform the relevant statistical analysis (which would be preferred).
4. The paper is too long, particularly in the discussion and conclusions (8 pages). The manuscript would be better if it were shortened.
Reviewer #3 (Recommendations for the authors):
This article investigated the PM2.5-induced toxicity on pregnancy outcomes and trophoblasts and revealed a novel mechanism by which PM2.5 caused trophoblast mitochondrial damage through KLF9/CYP1A1 transcriptional axis. Furthermore, this was the first time to identify KLF9 acted as the transcription factor positively modulating CYP1A1 in humans. This article also suggested a potential therapeutic effect of metformin. Overall, the work is logical and well supported by the data organized, and sufficiently innovative.
I have a few suggestions to improve the manuscript, please see below.
1. The authors constructed a PM2.5-exposed pregnant mice model by intratracheal instillation. The concentrations setting of PM2.5 were described in detail, but the selection of PM2.5 treatment time points (1.5 d, 7.5 d, and 12.5 d of pregnancy) was not explained. The authors need to describe the reason why these time points were chosen. In addition, the intratracheal instillation did not simulate PM2.5 environmental exposure properly, could the authors construct the animal model of PM2.5 exposure using a meteorological and environmental animal exposure system? (Ran Z, An Y, Zhou J, Yang J, Zhang Y, Yang J, et al. Subchronic exposure to concentrated ambient PM2.5 perturbs gut and lung microbiota as well as metabolic profiles in mice. Environ Pollut 2021, 272: 115987)
2. In result 3.9, the authors concluded that metformin reversed oxidative stress damage caused by PM2.5 through the KLF9/CYP1A1 transcriptional axis, but there were no results on the impact of metformin on the transcriptional level of CYP1A1. The authors should provide additional experiments to illustrate this issue and also add pertinent content to the discussion.
3. As the authors described in the paper, trophoblast biological functions such as invasion, migration, and tube formation were essential for placental development. The authors did not conduct relevant studies exploring the toxic effects of metformin in protecting trophoblast cells from PM2.5. The authors should perform further experiments to optimize the effects of metformin.
4. KLF9 is the focus of this manuscript to explore the toxic effects of PM2.5, but there are not many studies describing the role of KLF9 in toxicology in the Discussion section. For example, YUE GU et al. found that Klf9 is involved in BLM-induced pulmonary toxicity in human lung fibroblasts (Gu Y, Wu YB, Wang LH, Yin JN. Involvement of Kruppel-like factor 9 in bleomycin-induced pulmonary toxicity. Mol Med Rep 2015, 12(4): 5262-5266.) and Daqian Yang et al. identified that KLF9 was essential in allicin resisting against arsenic trioxide-Induced hepatotoxicity (Yang D, Lv Z, Zhang H, Liu B, Jiang H, Tan X, et al. Activation of the Nrf2 Signaling Pathway Involving KLF9 Plays a Critical Role in Allicin Resisting Against Arsenic Trioxide-Induced Hepatotoxicity in Rats. Biol Trace Elem Res 2017, 176(1): 192-200). Previously published evidence of KLF9-dependent toxicological responses needs to be cited more clearly in the manuscript.
5. Is it possible to evaluate the role of KLF9 in placental toxicity caused by PM2.5 using knockout mice models?
6. The authors used only trophoblast cell line HTR8/SVneo for in vitro experiments. Could it be possible to add trophoblast primary cells or other primary cells such as HUVEC? The authors should mention this and refer to this point in the manuscript.
7. In result 3.8, the authors described "Cellular immunofluorescence showed that the increase in KLF9 expression was primarily observed in the nucleus (Figure 10D)". The authors assumed that KLF9 functioned as a transcription factor through nuclear translocation. To better corroborate this conclusion, I suggest that the authors should extract nuclear protein and detect the expression of KLF9 quantitatively.
8. AHR has been recognized as a receptor of environmental pollutants and a mediator of chemical toxicity including PM2.5. Meanwhile, AHR is an essential ligand-activated transcription factor of CYP1A1, which is also mentioned in the discussion of the manuscript. I am interested in the expression of AHR in trophoblast cells under PM2.5 exposure, does PM2.5 also increase AHR expression? Is it possible for the authors to conduct research on the role of PM2.5 on AHR?
[Editors’ note: further revisions were suggested prior to acceptance, as described below.]
Thank you for resubmitting your work entitled "PM2.5 leads to adverse pregnancy outcomes by inducing trophoblast oxidative stress and mitochondrial apoptosis via KLF9/CYP1A1 transcriptional axis" for further consideration by eLife. Your revised article has been evaluated by Diane Harper (Senior Editor) and a Reviewing Editor.
The manuscript has been improved, but there are some remaining issues that need to be addressed, as outlined below:
To ensure transparency and reproducibility, we kindly request the supplemental material containing the complete dataset of the RNA-Seq analysis, including the total of 17,795 genes identified and the corresponding statistical parameters.
Reviewer #1 (Recommendations for the authors):
This study used PM2.5 collected from the urban region of Jinan, China, to establish pollutant exposure experiments by in vivo animal models and trophoblast cells. This relevant study applies several in vitro and in silico techniques from these models. The authors identify that PM2.5 activates the KLF9/CYP1A1 signaling pathway causing oxidative stress damage with mitochondrial apoptosis, which can be correlated to poor pregnancy outcomes observed in mice.
In general, the authors have adequately addressed the primary issues I raised in this revised version.
However, the importance of the authors providing a supplementary Table containing the complete dataset of the RNA-Seq analysis is necessary. In the current scientific landscape, transparency and reproducibility of experiments are vital principles that promote the advancement of knowledge and enable the scientific community to build upon previous findings.
By providing the entire dataset, including the total of 17,795 genes identified in the sequencing, along with the corresponding statistical parameters of the differential expression analysis (DEG) such as P-value, FDR, and Log2FC, you will contribute significantly to the transparency and reproducibility of your study. This will enable other researchers to validate and replicate your findings, facilitating scientific progress.
https://doi.org/10.7554/eLife.85944.sa1Author response
Essential revisions:
1) One concern from this study is regarding the experimental design, particularly the dosage of PM2.5 used in this paper, as well as the timing and frequency of administration of this compound. The authors should perform further experiments at a lower dose or administration frequency to represent a more physiologically relevant scenario.
Thank you very much for your advice on our in vivo experiments. We apologize for the simplicity of the writing in our previous manuscript, which did not clearly explain the dosage, timing and frequency in our experimental design. Please allow me to provide detailed explanation of each aspect as follows.
Firstly, regarding the dosage of PM2.5. We collected the PM2.5 particles from Jinan, China, so we combined PM2.5 exposure level of pregnant women in Jinan with the physiological indicators of mice, multiplied by 100-fold uncertainty factor to set the dosage in our in vivo experiments. To make it easier to understand, we have revised the PM2.5 dosage calculation process in detail in the method section:
“At 8 weeks, the average tidal volume of Kunming mice was about 0.25 mL, and the frequency of per mouse’s respiratory was about 163/min, thus, the total air intake per day was 0.25 x 163 x 60 mins x 24 hrs = 58680 mL ≈ 0.0587 m3/day[41]. It has been reported that the PM2.5 exposure of pregnant women in Jinan in 2020 was about 64 μg/m3 daily [40]. Therefore, the total PM2.5 intake though out the whole pregnancy of mice was about 0.0587 m3/day × 64 μg/m3 × 20 days × 100 (uncertainty factor) = 7511 μg. The 100 fold uncertainty factor = 10-fold interspecies difference ×10-fold interindividual variation [95] [60]. We weighed 7511 μg PM2.5 particles and dissolved it in 60 μL PBS buffer to prepare a PM2.5 suspension, which was subsequently divided into three equal portions. Pregnant mice were anaesthetized by intraperitoneal injection of 0.5% pentobarbital sodium (50 mg/kg) on 1.5 d, 7.5 d, and 12.5 d of pregnancy (corresponding to first, second and third trimester of human), followed by intratracheal instillation of 20 μL PM2.5 suspension, and the control group was intratracheally instilled with the same volume of PBS (n = 8 for per group).” (P24 L563-572).
The calculation of our PM2.5 dosage is as same as many authoritative studies related PM2.5, such as Chen Q et al. J Exp Clin Cancer Res 2022; Li Y et al. Ecotoxicol Environ Saf, 2021; Li J et al. Sci Total Environ, 2020; Zhang J et al. Sci Total Environ 2018; Zhang Y et al. Sci Total Environ 2017. In these studies, the dosage of PM2.5 in the in vivo experiments was also determined by combining the ambient PM2.5 level with the physiological indicators of mice, multiplying by 100 fold uncertainty factor. The only difference of the dosage between these study and our manuscript is the ambient PM2.5 exposure level. They employed ambient PM2.5 levels recommended by WHO, and we employed ambient PM2.5 level of pregnant women in Jinan area (where we collected PM2.5 particules).
The editor and reviewers concluded the dosage in our in vivo experiments was higher than a pregnant woman in Jinan that was mainly because our multiplication of the 100-fold uncertainty factor. The 100-fold uncertainty factor was derived from the integration of toxicokinetics and toxicodynamics, resulting in a multiplication of 10-fold interspecies difference with 10-fold interindividual variation. It was initially proposed by Lehman and Fitzhugh (Lehman, A.J et al. Association of the Food Drug Officials Quartely Bulletin 1954) over 60 years ago to convert a no-observed-adverse-effect level (NOAEL) from an animal toxicity study to a safe value for human intake (ADI). Scientists later applied the 100-fold uncertainty factor extensively to the selection of toxic dosage for animal experiments in toxicological studies, such as. Lautz L.S et al. Toxicol Lett, 2021; Arnot J.A. et al. J Expo Sci Environ Epidemiol, 2022; Tome D. et al. Curr Opin Clin Nutr Metab Care, 2020; Cooper A.B. et al. Regul Toxicol Pharmacol, 2019. Meanwhile, the Unite States Environmental Protection Agency (EPA) also identified the 100-fold uncertainty factor as the criteria for animal study in conducting a human health risk assessment (https://www.epa.gov/risk/conducting-human-health-risk-assessment). In authoritative studies related to PM2.5, the 100-fold uncertainty factor is also considered as one of the criteria for in vivo experiments (Chen Q et al. J Exp Clin Cancer Res 2022; Li Y. et al. Ecotoxicol Environ Saf, 2021; Li J. et al. Sci Total Environ, 2020; Zhang J et al. Sci Total Environ 2018; Zhang Y et al. Sci Total Environ 2017.). Therefore, the dosage of our PM2.5 in vivo experiment was not high but relatively reasonable as it covered the interspecies difference and interindividual variation using a scientific methodology. We have also added the content about 100-fold uncertainty factor to the Discussion section:
“The selection of appropriate PM2.5 exposure dosage in mice was critical for our experiments. We combined the PM2.5 exposure level of pregnant women from the Jinan [40] (where we collected PM2.5 particles) with physiological indicators of mice [41], then multiplied by 100-fold uncertainty factor to obtain the corresponding PM2.5 exposure dosage during mice pregnancy. The 100-fold uncertainty factor ( = 10-fold interspecies difference × 10-fold interindividual variation) is used to convert a no-observed-adverse-effect level (NOAEL) from an animal toxicity study to a safe value for human intake (ADI), which is the criteria for determining experimental dosages in toxicological studies involving animals. It was originally proposed, over 60 years ago, by Lehman and Fitzhugh[57], and still forms the basis of the uncertainty factors which are in use today. Also, the 100-uncertainty factor is considered one of the criteria for in vivo experiments in authoritative studies related to PM2.5 [58-60].” (P16 L383-392).
In conclusion, we think that the dosage of PM2.5 in our in vivo experiments was selected appropriately.
Secondly, regarding the time and frequency of PM2.5. Compared to the human gestation period of 280 days, the mouse gestation period is only 20 days. By aligning the developmental stages of mouse and human embryos, the 1.5th, 7.5th, and 12.5th mouse gestational days which we selected to apply intratracheal instillation were designated approximately as the first, second, and third trimesters of human pregnancy (Amack JD et al. Cell Commun Signal 2021; Bunnell TM et al. Cytoskeleton (Hoboken) 2010; Xu C. et al. Environ Health Perspect 2022). This is to comprehensively investigate its impact throughout the gestation period. Due to the fragile condition of pregnant rats, we divided the PM2.5 dosage of the entire gestation period into three equal portions and conducted the three intratracheal instillations in order to minimize potential harm caused by the procedure. In many toxicological studies on embryonic development, same or similar time points were also chosen for in vivo experiments (Li R. et al. Chemosphere, 2018; Tata B Nat Med 2018; Koren O et al. Cell 2012). For a better understanding of the time points, I have rewritten "Pregnant mice were anaesthetized by intraperitoneal injection of 0.5% pentobarbital sodium (50 mg/kg) on 1.5 d, 7.5 d, and 12.5 d of pregnancy (corresponding to first, second and third trimester of human), followed by intratracheal instillation of 20 μL PM2.5 suspension" in method section (P24 L569-571).
Reference:
Amack JD. Cellular dynamics of EMT: lessons from live in vivo imaging of embryonic development. Cell Commun Signal 2021, 19(1): 79;
Arnot JA, Toose L, Armitage JM, Sangion A, Looky A, Brown TN, et al. Developing an internal threshold of toxicological concern (iTTC). J Expo Sci Environ Epidemiol 2022, 32(6): 877-884.
Bunnell TM, Ervasti JM. Delayed embryonic development and impaired cell growth and survival in Actg1 null mice. Cytoskeleton (Hoboken) 2010, 67(9): 564-572.
Chen Q, Wang Y, Yang L, Sun L, Wen Y, Huang Y, et al. PM2.5 promotes NSCLC carcinogenesis through translationally and transcriptionally activating DLAT-mediated glycolysis reprograming. J Exp Clin Cancer Res 2022, 41(1): 229;
Cooper AB, Aggarwal M, Bartels MJ, Morriss A, Terry C, Lord GA, et al. PBTK model for assessment of operator exposure to haloxyfop using human biomonitoring and toxicokinetic data. Regul Toxicol Pharmacol 2019, 102: 1-12;
Koren O, Goodrich JK, Cullender TC, Spor A, Laitinen K, Backhed HK, et al. Host remodeling of the gut microbiome and metabolic changes during pregnancy. Cell 2012, 150(3): 470-480.
Lautz LS, Jeddi MZ, Girolami F, Nebbia C, Dorne J. Metabolism and pharmacokinetics of pharmaceuticals in cats (Felix sylvestris catus) and implications for the risk assessment of feed additives and contaminants. Toxicol Lett 2021, 338: 114-127.
Lehman A.J., O.G. Fitzhugh, 100-fold margin of safety, Association of the Food Drug Officials Quartely Bulletin (1954).
Li Y, Batibawa JW, Du Z, Liang S, Duan J, Sun Z. Acute exposure to PM(2.5) triggers lung inflammatory response and apoptosis in rat. Ecotoxicol Environ Saf 2021, 222: 112526.
Li J, Hu Y, Liu L, Wang Q, Zeng J, Chen C. PM2.5 exposure perturbs lung microbiome and its metabolic profile in mice. Sci Total Environ 2020, 721: 137432.
Li R, Wang X, Wang B, Li J, Song Y, Luo B, et al. Gestational 1-nitropyrene exposure causes fetal growth restriction through disturbing placental vascularity and proliferation. Chemosphere 2018, 213: 252-258.
Tata B, Mimouni NEH, Barbotin AL, Malone SA, Loyens A, Pigny P, et al. Elevated prenatal anti-Mullerian hormone reprograms the fetus and induces polycystic ovary syndrome in adulthood. Nat Med 2018, 24(6): 834-846.
Tome D. Admissible daily intake for glutamate. Curr Opin Clin Nutr Metab Care 2020, 23(2): 133-137.
Xu C, Ma H, Gao F, Zhang C, Hu W, Jia Y, et al. Screening of Organophosphate Flame Retardants with Placentation-Disrupting Effects in Human Trophoblast Organoid Model and Characterization of Adverse Pregnancy Outcomes in Mice. Environ Health Perspect 2022, 130(5): 57002;
Zhang J, Liu J, Ren L, Wei J, Duan J, Zhang L, et al. PM(2.5) induces male reproductive toxicity via mitochondrial dysfunction, DNA damage and RIPK1 mediated apoptotic signaling pathway. Sci Total Environ 2018, 634: 1435-1444;
Zhang Y, Hu H, Shi Y, Yang X, Cao L, Wu J, et al. (1)H NMR-based metabolomics study on repeat dose toxicity of fine particulate matter in rats after intratracheal instillation. Sci Total Environ 2017, 589: 212-221;
2) The metformin data lack rigour, and the authors would remove them and use these data to focus on a new study.
Many Thanks for your advice. In our study, we have observed a robust correlation between PM2.5 and adverse pregnancy outcomes; however, there is currently no clinical intervention or prophylactic medication available to alleviate this association. To mitigate the incidence of unfavorable pregnancy outcomes caused by atmospheric pollution, we performed some research of metformin. However, our investigation of metformin was insufficient because of time limit. We only utilized a single concentration of metformin and solely examined its mechanistic effects on KLF9 and CYP1A1. Therefore, we decided to delete the content of metformin from the manuscript according to the reviewers’ suggestion. We will investigate the mechanism of metformin in the treatment of functional impairment of trophoblasts caused by PM2.5 through cell function experiments combined with new RNA sequencing in the future study.
3) There are several concerns regarding the figures accompanying the results, including some that are not self-explanatory.
Many thanks for your helpful suggestion. We have implemented revisions item-by-item in response to the suggestions provided by reviewers.
Reviewer #1 (Recommendations for the authors):
Air pollutant such as particulate matter PM2.5 is considered one of the most severe toxic associated with various adverse pregnancy outcomes. Most present research on PM2.5 in adverse effects on human pregnancy is focused on the epidemiological aspects, remaining partially unraveling the underlying molecular mechanisms. In this research, Zhang Wang and colleagues used PM2.5 collected from the urban region of Jinan, China, to establish pollutant exposure experiments by in vivo animal models and in vitro trophoblast cells. All experiments were evaluated by several in vitro techniques, including RNAseq analysis and in silico exploration of differentially expressed genes to infer the effect of PM2.5 on the mice pregnancy and human trophoblast cells.
One caution of these studies is the dosage calculations for the in vivo and in vitro experimental design to evaluate the effect of PM 2.5. In the mice model, they administered doses of daily PM2.5 inhalation several times higher than a pregnant woman in Jinan might experience. On the other hand, an equivalent high dosage was applied to trophoblasts to extract total RNA and perform the RNAseq. However, the in silico data analysis only detected 32 differentially expressed genes using a Log2FC of no more than 1, denoting the subtle effect between the control and the treatments.
Thank you very much for your suggestion. We apologize for your confusion about our in vivo and in vitro dosages and RNA-Seq results due to the simplicity of our previous manuscript. I will explain in detail about the dosages and RNA-Seq results as follows.
Firstly, about the dosage in in vivo experiments. We collect the PM2.5 particles from Jinan, China, so we combined PM2.5 exposure of pregnant women in Jinan with the physiological indicators of mice, multiplied by 100-fold uncertainty factor to set the dosage in our in vivo experiments. The previous version was too simple for the reader to understand, so we have revised the PM2.5 dosage calculation process in detail in the method section:
“At 8 weeks, the average tidal volume of Kunming mice was about 0.25 mL, and the frequency of per mouse’s respiratory was about 163/min, thus, the total air intake per day was 0.25 x 163 x 60 mins x 24 hrs = 58680 mL ≈ 0.0587 m3/day[41]. It has been reported that the PM2.5 exposure of pregnant women in Jinan in 2020 was about 64 μg/m3 daily [40]. Therefore, the total PM2.5 intake though out the whole pregnancy of mice was about 0.0587 m3/day × 64 μg/m3 × 20 days × 100 (uncertainty factor) = 7511 μg. The 100 fold uncertainty factor = 10-fold interspecies difference ×10-fold interindividual variation [95] [60]. We weighed 7511 μg PM2.5 particles and dissolved it in 60 μL PBS buffer to prepare a PM2.5 suspension, which was subsequently divided into three equal portions. Pregnant mice were anaesthetized by intraperitoneal injection of 0.5% pentobarbital sodium (50 mg/kg) on 1.5 d, 7.5 d, and 12.5 d of pregnancy (corresponding to first, second and third trimester of human), followed by intratracheal instillation of 20 μL PM2.5 suspension, and the control group was intratracheally instilled with the same volume of PBS (n = 8 for per group).” (P24 L563-572).
The calculation of our PM2.5 dosage is as same as the calculation in many authoritative studies related PM2.5, such as Chen Q et al. J Exp Clin Cancer Res 2022; Li Y et al. Ecotoxicol Environ Saf, 2021; Li J et al. Sci Total Environ, 2020; Zhang J et al. Sci Total Environ 2018; Zhang Y et al. Sci Total Environ 2017. In these studies, the dosage of PM2.5 in the in vivo experiments was also determined by combining the ambient PM2.5 level with the physiological indicators of mice, multiplying by 100 times the uncertainty factor. The only difference of the dosage between these study and our manuscript is the ambient PM2.5 exposure level. They employed ambient PM2.5 level recommended by WHO, while we employed ambient PM2.5 levels of pregnant women in Jinan area ( where we collected PM2.5 particules). The reviewer considered the doses of daily PM2.5 inhalation of mice in our in vivo experiments were several times higher than a pregnant woman in Jinan mainly because our multiplication of the 100-fold uncertainty factor. The 100-fold uncertainty factor is one of the criteria commonly used in animal experiments in toxicological studies. It was derived from the integration of toxicokinetics and toxicodynamics, resulting in a multiplication of 10-fold interspecies difference with 10-fold interindividual variation. The 100-fold uncertainty factor was initially proposed by Lehman and Fitzhugh (Lehman, A.J et al. Association of the Food Drug Officials Quartely Bulletin 1954) over 60 years ago to convert a no-observed-adverse-effect level (NOAEL) from an animal toxicity study to a safe value for human intake (ADI). Scientists later applied the 100-fold uncertainty factor extensively to the selection of toxic dosage for animal experiments in toxicological studies, such as Lautz L.S et al. Toxicol Lett, 2021; Arnot J.A. et al. J Expo Sci Environ Epidemiol, 2022; Tome D et al. Curr Opin Clin Nutr Metab Care, 2020; Cooper A.B et al. Regul Toxicol Pharmacol, 2019. Meanwhile, the Unite States Environmental Protection Agency (EPA) also identified the 100-fold uncertainty factor as the criteria for animal study in conducting a human health risk assessment (https://www.epa.gov/risk/conducting-human-health-risk-assessment). In authoritative studies related to PM2.5 in vivo experiments, the 100-fold uncertainty factor is also considered as one of the criteria for in vivo experiments (Chen Q et al. J Exp Clin Cancer Res 2022; Li Y et al. Ecotoxicol Environ Saf, 2021; Li J et al. Sci Total Environ, 2020; Zhang J et al. Sci Total Environ 2018; Zhang Y et al. Sci Total Environ 2017.). Therefore, the dosage of our PM2.5 in vivo experiment was not high but relatively reasonable as it covered the interspecies difference and interindividual variation using a scientific methodology. We have also added the content about 100-fold uncertainty factor to the Discussion section:
“The selection of appropriate PM2.5 exposure dosage in mice was critical for our experiments. We combined the PM2.5 exposure level of pregnant women from the Jinan [40] (where we collected PM2.5 particles) with physiological indicators of mice [41], then multiplied by 100-fold uncertainty factor to obtain the corresponding PM2.5 exposure dosage during mice pregnancy. The 100-fold uncertainty factor ( = 10-fold interspecies difference × 10-fold interindividual variation) is used to convert a no-observed-adverse-effect level (NOAEL) from an animal toxicity study to a safe value for human intake (ADI), which is the criteria for determining experimental dosages in toxicological studies involving animals. It was originally proposed, over 60 years ago, by Lehman and Fitzhugh[57], and still forms the basis of the uncertainty factors which are in use today. Also, the 100-uncertainty factor is considered one of the criteria for in vivo experiments in authoritative studies related to PM2.5 [58-60]” (P16 L383-392).
In conclusion, we think that the dosage of PM2.5 in our in vivo experiments was selected appropriately.
Secondly, the PM2.5 dosage in our in vitro experiments has been also meticulously considered. The objective of our in vitro experiments was to investigate the impact of PM2.5 on human placental trophoblast cells. During the normal human physiological activity, PM2.5 particles inhaled are deposited within the lungs and subsequently transported to the placenta via circulation of blood. Although we are able to measure the concentration of PM2.5 in the air and estimate the dosage of PM2.5 that reaches the lungs, the PM2.5 particles are continuously accumulating in the lungs and there were no definitive studies to determine the precise dosage of PM2.5 that accumulated in the lungs or the dosage of PM2.5 that entered different organs via the bloodstream. The current in vitro studies of PM2.5 were mainly designed on a series of concentration gradients based on empirical or previous literature to investigate the toxic effects of PM2.5 on cell function (Wang Y et al., J Dermatol Sci 2021; Shan H et al. Ecotoxicol Environ Saf 2022; Wang Y et al. Sci Total Environ 2020). Therefore, we refered to previous authoritative literature and combined experiments on cell biological functions (e.g. PM2.5 on cell proliferation, apoptosis, invasion, migration, tube formation, etc.) to explore the effects of PM2.5 on trophoblast cells. In our study, we set three concentration gradients of 50 μg/mL, 100 μg/mL, 200 μg/mL (which was described in the Results section (P8 L187-189)) based on previous studies (Duan S et al. J Hazard Mater 2020; Guo X et al. Environ Pollut 2022, Qiu YN et al. Ecotoxicol Environ Saf 2019; Hu T et al. Environ Toxicol 2021; Zhao C et al. Sci Total Environ 2020). According to the results on the trophoblastic biological functions at these concentrations, we found that the trophoblastic biological function was impaired in a concentration-dependent manner. At a concentration of 50μg/mL, cell functions were slightly impaired, while at concentrations up to 200 μg/mL, all cell functions were severely impaired. According to the results of the CCK8 assays, the median lethal dose (LD50) of PM2.5 treatment for 24 h on trophoblast cells in our study was determined to be 105.2 µg/mL (as follows). LD50 represents the dose at which a substance is lethal for 50% of tested subjects. Toxicological studies typically employed concentrations in close proximity to the LD50 when investigating cellular functions or molecular mechanisms (Han C et al. Ecotoxicol Environ Saf 2023; Duan S et al. J Nanobiotechnology 2021; Akbar MU et al. ACS Omega 2022). Therefore, we chose concentration of 100 µg/mL for RNA-Seq sequencing and subsequent exploration of the molecular mechanism. In conclusion, the selection of PM2.5 dosage for our in vitro experiments is also scientific and evidence-based.
Thirdly, about RNA-Seq results. In our in vitro experiments, we chose 100 μg/mL for our RNA-Seq experiment and the exploration of the molecular mechanism according to the LD50 value. In our RNA-Seq results, 32 differentially expressed genes were filtered out according to the pre-defined conditions of absolute value of log 2 (Fold Change) ≥1 and p-value <0.05 ( not Log2FC of no more than 1 as mentioned by reviewer). Although the number of differential genes shown by our RNA-Seq was not large, this result did not suggest that the effect of PM2.5 on trophoblast cells is minimal, as our previous biological function experiments had definitely demonstrated that PM2.5 altered the biological functions of cell proliferation, apoptosis, invasion, migration, and tube formation. We have also observed that the number of differentially expressed genes identified through RNA-Seq in numerous authoritative publications is not large. For example, in the article of “Phan BN et al., Nat Neurosci 2020”, there were 36 DEGs in P1 group; in the article of “Dai X et al., Front Med (Lausanne) 2022”, there were 43 DEGs; in the article of “Gu J et al.,. Biomed Res Int 2017”, 49 DEGs were identified; in the article of “Duan S et al., J Hazard Mater 2021”, 75 DEGs were identified. Although only a limited number of differential genes have been identified through RNA-Seq in these studies, their functional significance cannot be overstated. In line with our research, the number of differential genes sequenced by our RNA-Seq was limited, but we detected a crucial role for KLF9 and CYP1A1 in the oxidative stress-induced damage to trophoblasts triggered by PM2.5. Meanwhile, the RNA-Seq sequencing results revealed the altered transcript levels of genes, and we speculate that PM2.5 has the potential to affect the protein expression of genes even more due to the Western Blot results in our manuscript showed that PM2.5 significantly altered the protein expression level of KLF9, CYP1A1, cytochrome C, BCL-2, BAX, et al. Therefore, in our future study, we will perform proteomics sequencing analysis to further reveal the mechanisms by which PM2.5 affects trophoblastic biological function.
Reference:
Chen Q, Wang Y, Yang L, Sun L, Wen Y, Huang Y, et al. PM2.5 promotes NSCLC carcinogenesis through translationally and transcriptionally activating DLAT-mediated glycolysis reprograming. J Exp Clin Cancer Res 2022, 41(1): 229;
Cooper AB, Aggarwal M, Bartels MJ, Morriss A, Terry C, Lord GA, et al. PBTK model for assessment of operator exposure to haloxyfop using human biomonitoring and toxicokinetic data. Regul Toxicol Pharmacol 2019, 102: 1-12;
Dai X, Yang Z, Zhang W, Liu S, Zhao Q, Liu T, et al. Identification of diagnostic gene biomarkers related to immune infiltration in patients with idiopathic pulmonary fibrosis based on bioinformatics strategies. Front Med (Lausanne) 2022, 9: 959010.
Duan S, Zhang M, Sun Y, Fang Z, Wang H, Li S, et al. Mechanism of PM(2.5)-induced human bronchial epithelial cell toxicity in central China. J Hazard Mater 2020, 396: 122747.
Duan S, Zhang M, Li J, Tian J, Yin H, Wang X, et al. Uterine metabolic disorder induced by silica nanoparticles: biodistribution and bioactivity revealed by labeling with FITC. J Nanobiotechnology 2021, 19(1): 62.
Gu J, Li T, Zhao L, Liang X, Fu X, Wang J, et al. Identification of Significant Pathways Induced by PAX5 Haploinsufficiency Based on Protein-Protein Interaction Networks and Cluster Analysis in Raji Cell Line. Biomed Res Int 2017, 2017: 5326370.
Guo X, Lin Y, Lin Y, Zhong Y, Yu H, Huang Y, et al. PM2.5 induces pulmonary microvascular injury in COPD via METTL16-mediated m6A modification. Environ Pollut 2022, 303: 119115.
Han C, Pei H, Sheng Y, Wang J, Zhou X, Li W, et al. Toxicological mechanism of triptolide-induced liver injury: Caspase3-GSDME-mediated pyroptosis of Kupffer cell. Ecotoxicol Environ Saf 2023, 258: 114963.
Koren O, Goodrich JK, Cullender TC, Spor A, Laitinen K, Backhed HK, et al. Host remodeling of the gut microbiome and metabolic changes during pregnancy. Cell 2012, 150(3): 470-480.
Lautz LS, Jeddi MZ, Girolami F, Nebbia C, Dorne J. Metabolism and pharmacokinetics of pharmaceuticals in cats (Felix sylvestris catus) and implications for the risk assessment of feed additives and contaminants. Toxicol Lett 2021, 338: 114-127.
Lehman A.J., O.G. Fitzhugh, 100-fold margin of safety, Association of the Food Drug Officials Quartely Bulletin (1954).
Li Y, Batibawa JW, Du Z, Liang S, Duan J, Sun Z. Acute exposure to PM(2.5) triggers lung inflammatory response and apoptosis in rat. Ecotoxicol Environ Saf 2021, 222: 112526.
Li J, Hu Y, Liu L, Wang Q, Zeng J, Chen C. PM2.5 exposure perturbs lung microbiome and its metabolic profile in mice. Sci Total Environ 2020, 721: 137432.
Phan BN, Bohlen JF, Davis BA, Ye Z, Chen HY, Mayfield B, et al. A myelin-related transcriptomic profile is shared by Pitt-Hopkins syndrome models and human autism spectrum disorder. Nat Neurosci 2020, 23(3): 375-385.
Shan H, Li X, Ouyang C, Ke H, Yu X, Tan J, et al. Salidroside prevents PM2.5-induced BEAS-2B cell apoptosis via SIRT1-dependent regulation of ROS and mitochondrial function. Ecotoxicol Environ Saf 2022, 231: 113170.
Tome D. Admissible daily intake for glutamate. Curr Opin Clin Nutr Metab Care 2020, 23(2): 133-137.
Wang Y, Tang N, Mao M, Zhou Y, Wu Y, Li J, et al. Fine particulate matter (PM2.5) promotes IgE-mediated mast cell activation through ROS/Gadd45b/JNK axis. J Dermatol Sci 2021, 102(1): 47-57;
Wang Y, Tang M. PM2.5 induces autophagy and apoptosis through endoplasmic reticulum stress in human endothelial cells. Sci Total Environ 2020, 710: 136397.
Zhang J, Liu J, Ren L, Wei J, Duan J, Zhang L, et al. PM(2.5) induces male reproductive toxicity via mitochondrial dysfunction, DNA damage and RIPK1 mediated apoptotic signaling pathway. Sci Total Environ 2018, 634: 1435-1444;
Zhang Y, Hu H, Shi Y, Yang X, Cao L, Wu J, et al. (1)H NMR-based metabolomics study on repeat dose toxicity of fine particulate matter in rats after intratracheal instillation. Sci Total Environ 2017, 589: 212-221;
Despite this, through in vivo experiments, the authors show that the administration of PM2.5 by intratracheal route leads to significant changes in the pregnancy of mice, significantly increased fetal mortality, decreased fetal weight and number, and damaged placental structure. The in vitro experiments showed increased apoptosis in trophoblastic line HTR8/SVneo cells.
Through RNAseq experiments, the authors were able to infer two genes, KLF9 and CYP1A1, from the set of genes differentially expressed between trophoblast cells treated with 100 ug of PM2.5 compared to untreated controls. In addition, the authors demonstrated by in vitro ChIP assay the binding of KLF9 to the CYP1A1 promoter, proving that KLF9 is a positive modulator of CYP1A1 expression triggered by PM2.5. Consequently, the authors suggested activating this KLF9/CYP1A1 pathway promotes the empirically observed effects of oxidative stress and cell death in trophoblasts and the placenta of pregnant mice. But this study has not explored the mechanisms by which PM2.5 activates KLF9.
Thank you very much for your suggestion in our manuscript. In our study, we employed RNA-Seq and validation assays to identify CYP1A1 as a crucial gene involved in PM2.5-induced oxidative stress in trophoblast cells. Subsequently, bioinformatic predictions were utilized to determine its transcription factor KLF9, which was then confirmed through Chip and Dual-luciferase assays to regulate the transcriptional activity of CYP1A1. As the reviewer suggested, the research on the regulation of KLF9 by PM2.5 was missing. On one hand, exploring PM2.5 regulation of KLF9 would take a lot of time, and on the other hand, adding PM2.5 regulation of KLF9 to the current article might complicate our research focus. We will explore the regulation of PM2.5 on KLF9 and whether KLF9 can affect trophoblastic biological function through other signaling pathways in the future work. We have added this limitation in the Discussion section:
“Furthermore, our current article lacks investigations on the regulatory effect of PM2.5 on KLF9. These limitations should be further investigated in future.” (P22 L525-527).
Thank you again for your suggestions.
By additional experiments at the end of this work, the authors found that a single empirically deduced dose of metformin can reverse the toxic effects of PM2.5 on trophoblast cells of the HTR8/SVneo lineage. They observed that cells treated with metformin resulted in reduced expression of KLF9 and CYP1A1 compared to PM2.5-exposed cells. However, this experiment shows limitations, such as the single dose of the inhibitory drug used and a bias in the genetic mechanisms by focusing only on the two genes, KLF9 and CP1A1.
Many thanks for your advice. In our study, in order to resolve the clinical issue of how to prevent PM2.5-induced damage in pregnancy, we identified metformin by communicating with clinicians. Our experimental results confirmed that metformin indeed reduced oxidative stress damage and apoptosis in trophoblast cells caused by PM2.5. We then combined with the KLF9/CYP1A1, a signalling pathway that we had demonstrated that was involved in PM2.5-induced oxidative stress damage in trophoblast cells, to preliminarily validate the mechanism of metformin. However, our investigation of metformin was insufficient because of time limit. We only utilized a single concentration of metformin and solely examined its mechanistic effects on KLF9 and CYP1A1. Therefore, as suggested by other reviewers and editors, we decided to delete the content of metformin from the manuscript. Considering metformin could be a promising avenue for the clinical management of adverse pregnancy outcomes associated with PM2.5 exposure. So, we will explore the effects of different concentrations of metformin and investigate the mechanism of metformin through cell function experiments combined with new RNA sequencing in the future work.
This study used PM2.5 collected from the urban region of Jinan, China, to establish pollutant exposure experiments by in vivo animal models and trophoblast cells. This relevant study applies several in vitro and in silico techniques from these models. The authors identify that PM2.5 activates the KLF9/CYP1A1 signaling pathway causing oxidative stress damage with mitochondrial apoptosis, which can be correlated to poor pregnancy outcomes observed in mice.
I have the following comments:
1. The in vivo experimental designs of PM 2.5 dosage calculations are not unreliable to me. Because the in vitro and in vivo experiments were administered doses of daily PM2.5 inhalation huge times higher (2.503 ug) than a pregnant woman in Jinan might experience (3.6 ug). The inferences from this experimental design so different from the natural investigation in humans should be better explained. Also, it should be justified in comparison with some experiments with the proper doses experienced by pregnant women in Jinan.
On the other hand, the dosage applied to trophoblasts for the extraction of total RNA and consequent RNAseq only detected 32 differentially expressed genes by using a Log2FC of 1, denoting the subtle effect between the control and the treatments. Under natural exposure conditions of daily PM2.5 (3.6 ug) instead of the current in vitro design (100 ug), it would be interesting to explore the gene expression results. Authors should discuss all these experimental limitations more rigorously.
Thanks a lot for your comments on our study. We apologize for your confusion about our results due to the simplicity of our writing in the previous manuscript. Please kindly allow me to provide a detailed explanation of the dosage used in both in vivo and in vitro experiments, as well as the RNA-Seq sequencing results.
Firstly, about the dosage in in vivo experiments. We collected the PM2.5 particles from Jinan, China, so we combined PM2.5 exposure of pregnant women in Jinan with the physiological indicators of mice, multiplied by 100-fold uncertainty factor to set the dosage in our in vivo experiments. The previous version was too simple for the readers to understand, so we have revised the PM2.5 dosage calculation process in detail in the method section:
“At 8 weeks, the average tidal volume of Kunming mice was about 0.25 mL, and the frequency of per mouse’s respiratory was about 163/min, thus, the total air intake per day was 0.25 x 163 x 60 mins x 24 hrs = 58680 mL ≈ 0.0587 m3/day[41]. It has been reported that the PM2.5 exposure of pregnant women in Jinan in 2020 was about 64 μg/m3 daily [40]. Therefore, the total PM2.5 intake though out the whole pregnancy of mice was about 0.0587 m3/day × 64 μg/m3 × 20 days × 100 (uncertainty factor) = 7511 μg. The 100 fold uncertainty factor = 10-fold interspecies difference ×10-fold interindividual variation [95] [60]. We weighed 7511 μg PM2.5 particles and dissolved it in 60 μL PBS buffer to prepare a PM2.5 suspension, which was subsequently divided into three equal portions. Pregnant mice were anaesthetized by intraperitoneal injection of 0.5% pentobarbital sodium (50 mg/kg) on 1.5 d, 7.5 d, and 12.5 d of pregnancy (corresponding to first, second and third trimester of human), followed by intratracheal instillation of 20 μL PM2.5 suspension, and the control group was intratracheally instilled with the same volume of PBS (n = 8 for per group).” (P24 L563-572).
The calculation of our PM2.5 dosage is as same as the calculation in many authoritative studies related PM2.5, such as Chen Q et al. J Exp Clin Cancer Res 2022; Li Y et al. Ecotoxicol Environ Saf, 2021; Li J et al. Sci Total Environ, 2020; Zhang J et al. Sci Total Environ 2018; Zhang Y et al. Sci Total Environ 2017. In these studies, the dosage of PM2.5 in the in vivo experiments was also determined by combining the ambient PM2.5 level with the physiological indicators of mice, multiplying by 100 times the uncertainty factor. The only difference of the dosage between these study and our manuscript is the ambient PM2.5 exposure level. They employed ambient PM2.5 level recommended by WHO, while we employed ambient PM2.5 levels of pregnant women in Jinan area ( where we collected PM2.5 particules).
The reviewer considered the doses of daily PM2.5 inhalation of mice in our in vivo experiments were higher than a pregnant woman in Jinan that was mainly because our multiplication of the 100-fold uncertainty factor. The 100-fold uncertainty factor is one of the criteria commonly used in animal experiments in toxicological studies. It was derived from the integration of toxicokinetics and toxicodynamics, resulting in a multiplication of 10-fold interspecies difference with 10-fold interindividual variation. The 100-fold uncertainty factor was initially proposed by Lehman and Fitzhugh (Lehman, A.J et al. Association of the Food Drug Officials Quartely Bulletin 1954) over 60 years ago to convert a no-observed-adverse-effect level (NOAEL) from an animal toxicity study to a safe value for human intake (ADI). Scientists later applied the 100-fold uncertainty factor extensively to the selection of toxic dosage for animal experiments in toxicological studies, such as Lautz L.S et al. Toxicol Lett, 2021; Arnot J.A. et al. J Expo Sci Environ Epidemiol, 2022; Tome D et al. Curr Opin Clin Nutr Metab Care, 2020; Cooper A.B et al. Regul Toxicol Pharmacol, 2019. Meanwhile, the Unite States Environmental Protection Agency (EPA) also identified the 100-fold uncertainty factor as the criteria for animal study in conducting a human health risk assessment (https://www.epa.gov/risk/conducting-human-health-risk-assessment). In authoritative studies related to PM2.5 in vivo experiments, the 100-fold uncertainty factor is also considered as one of the criteria for in vivo experiments (Chen Q et al. J Exp Clin Cancer Res 2022; Li Y et al. Ecotoxicol Environ Saf, 2021; Li J et al. Sci Total Environ, 2020; Zhang J et al. Sci Total Environ 2018; Zhang Y et al. Sci Total Environ 2017.). Therefore, although the dosage in our in vivo experiment may appear higher than the PM2.5 dosage absorbed by normal pregnant women, it was determined through a scientific methodology that taked into consideration interspecies difference and interindividual variation. We have also added this component to the Discussion section:
“The selection of appropriate PM2.5 exposure dosage in mice was critical for our experiments. We combined the PM2.5 exposure level of pregnant women from the Jinan [40] (where we collected PM2.5 particles) with physiological indicators of mice [41], then multiplied by 100-fold uncertainty factor to obtain the corresponding PM2.5 exposure dosage during mice pregnancy. The 100-fold uncertainty factor ( = 10-fold interspecies difference × 10-fold interindividual variation) is used to convert a no-observed-adverse-effect level (NOAEL) from an animal toxicity study to a safe value for human intake (ADI), which is the criteria for determining experimental dosages in toxicological studies involving animals. It was originally proposed, over 60 years ago, by Lehman and Fitzhugh[57], and still forms the basis of the uncertainty factors which are in use today. Also, the 100-uncertainty factor is considered one of the criteria for in vivo experiments in authoritative studies related to PM2.5 [58-60]” (P16 L383-392).
Secondly, about the dosage of PM2.5 in our in vitro experiments. The objective of our in vitro experiments was to investigate the impact of PM2.5 on human placental trophoblast cells. During the normal human physiological activity, PM2.5 particles inhaled are deposited within the lungs and subsequently transported to the placenta via circulation of blood. Although we are able to measure the concentration of PM2.5 in the air and estimate the dosage of PM2.5 that reaches the lungs, the PM2.5 particles are continuously accumulating in the lungs and there were no definitive studies to determine the precise dosage of PM2.5 that accumulated in the lungs or the dosage of PM2.5 that entered different organs via the bloodstream. The current in vitro studies of PM2.5 were mainly designed on a series of concentration gradients based on empirical or previous literature to investigate the toxic effects of PM2.5 on cell function (Wang Y et al., J Dermatol Sci 2021; Shan H et al. Ecotoxicol Environ Saf 2022; Wang Y et al. Sci Total Environ 2020).Therefore, we refered to previous authoritative literature and combined experiments on cell biological functions (e.g. PM2.5 on cell proliferation, apoptosis, invasion, migration, tube formation, etc.) to explore the effects of PM2.5 on trophoblast cells. In our study, we set three concentration gradients of 50 μg/mL, 100 μg/mL, 200 μg/mL based on previous studies (Duan S et al. J Hazard Mater 2020; Guo X et al. Environ Pollut 2022, Qiu YN et al. Ecotoxicol Environ Saf 2019; Hu T et al. Environ Toxicol 2021; Zhao C et al. Sci Total Environ 2020), which was described in the Results section (P8 L187-189). According to the results on the trophoblastic biological functions at these concentrations, we found that the trophoblastic biological function was impaired in a concentration-dependent manner. At a concentration of 50μg/mL, cell functions were slightly impaired, while at concentrations up to 200 μg/mL, all cell functions were severely impaired. According to the results of the CCK8 assays, the median lethal dose (LD50) of PM2.5 treatment for 24 h on trophoblast cells in our study was determined to be 105.2 µg/mL (as follows). LD50 represents the dose at which a substance is lethal for 50% of tested subjects. Toxicological studies typically employed concentrations in close proximity to the LD50 when investigating cellular functions or molecular mechanisms (Han C et al. Ecotoxicol Environ Saf 2023; Duan S et al. J Nanobiotechnology 2021; Akbar MU et al. ACS Omega 2022). Therefore, we chose concentration of 100 µg/mL for RNA-Seq sequencing and subsequent exploration of the molecular mechanism. In conclusion, the selection of PM2.5 dosage for our in vitro experiments is also scientific and evidence-based.
Thirdly, about RNA-Seq results. In our in vitro experiments, we chose 100 μg/mL for our RNA-Seq experiment and the exploration of the molecular mechanism according to the LD50 value. In our RNA-Seq results, 32 differentially expressed genes were filtered out according to the pre-defined conditions of absolute value of log 2 (Fold Change)≥1 and p-value <0.05. Although the number of differential genes shown by our RNA-Seq was not large, this result did not suggest that the effect of PM2.5 on trophoblast cells is minimal, as our previous biological function experiments had definitely demonstrated that PM2.5 altered the biological functions of cell proliferation, apoptosis, invasion, migration, and tube formation. We have also observed that the number of differentially expressed genes identified through RNA-Seq in numerous authoritative publications is not large. For example, in the article of “Phan BN et al., Nat Neurosci 2020”, there were 36 DEGs in P1 group; in the article of “Dai X et al., Front Med (Lausanne) 2022”, there were 43 DEGs; in the article of “Gu J et al.,. Biomed Res Int 2017”, 49 DEGs were identified; in the article of “Duan S et al., J Hazard Mater 2020”, there were 75 DEGs were identified. Although only a limited number of differential genes have been identified through RNA-Seq in the literature, their functional significance cannot be overstated. In line with our research, the number of differential genes sequenced by our RNA-SEq was limited, but we detected a crucial role for KLF9 and CYP1A1 in the oxidative stress-induced damage to trophoblasts triggered by PM2.5. The RNA-Seq sequencing results revealed the altered transcript levels of genes, and we speculate that PM2.5 has the potential to affect the protein expression of genes even more due to the Western Blot results in our manuscript showed that PM2.5 significantly altered the protein expression level of KLF9, CYP1A1, cytochrome C, BCL-2, BAX, et al. Therefore, in our future study, we will perform proteomics sequencing analysis to further reveal the mechanisms by which PM2.5 affects trophoblastic biological function.
Reference:
Akbar MU, Badar M, Zaheer M. Programmable Drug Release from a Dual-Stimuli Responsive Magnetic Metal-Organic Framework. ACS Omega 2022, 7(36): 32588-32598.
Arnot JA, Toose L, Armitage JM, Sangion A, Looky A, Brown TN, et al. Developing an internal threshold of toxicological concern (iTTC). J Expo Sci Environ Epidemiol 2022, 32(6): 877-884.
Chen Q, Wang Y, Yang L, Sun L, Wen Y, Huang Y, et al. PM2.5 promotes NSCLC carcinogenesis through translationally and transcriptionally activating DLAT-mediated glycolysis reprograming. J Exp Clin Cancer Res 2022, 41(1): 229;
Cooper AB, Aggarwal M, Bartels MJ, Morriss A, Terry C, Lord GA, et al. PBTK model for assessment of operator exposure to haloxyfop using human biomonitoring and toxicokinetic data. Regul Toxicol Pharmacol 2019, 102: 1-12;
Dai X, Yang Z, Zhang W, Liu S, Zhao Q, Liu T, et al. Identification of diagnostic gene biomarkers related to immune infiltration in patients with idiopathic pulmonary fibrosis based on bioinformatics strategies. Front Med (Lausanne) 2022, 9: 959010.
Duan S, Zhang M, Sun Y, Fang Z, Wang H, Li S, et al. Mechanism of PM(2.5)-induced human bronchial epithelial cell toxicity in central China. J Hazard Mater 2020, 396: 122747.
Duan S, Zhang M, Li J, Tian J, Yin H, Wang X, et al. Uterine metabolic disorder induced by silica nanoparticles: biodistribution and bioactivity revealed by labeling with FITC. J Nanobiotechnology 2021, 19(1): 62.
Gu J, Li T, Zhao L, Liang X, Fu X, Wang J, et al. Identification of Significant Pathways Induced by PAX5 Haploinsufficiency Based on Protein-Protein Interaction Networks and Cluster Analysis in Raji Cell Line. Biomed Res Int 2017, 2017: 5326370.
Guo X, Lin Y, Lin Y, Zhong Y, Yu H, Huang Y, et al. PM2.5 induces pulmonary microvascular injury in COPD via METTL16-mediated m6A modification. Environ Pollut 2022, 303: 119115.
Han C, Pei H, Sheng Y, Wang J, Zhou X, Li W, et al. Toxicological mechanism of triptolide-induced liver injury: Caspase3-GSDME-mediated pyroptosis of Kupffer cell. Ecotoxicol Environ Saf 2023, 258: 114963.
Hu T, Zhu P, Liu Y, Zhu H, Geng J, Wang B, et al. PM2.5 induces endothelial dysfunction via activating NLRP3 inflammasome. Environ Toxicol 2021, 36(9): 1886-1893.
Koren O, Goodrich JK, Cullender TC, Spor A, Laitinen K, Backhed HK, et al. Host remodeling of the gut microbiome and metabolic changes during pregnancy. Cell 2012, 150(3): 470-480.
Lautz LS, Jeddi MZ, Girolami F, Nebbia C, Dorne J. Metabolism and pharmacokinetics of pharmaceuticals in cats (Felix sylvestris catus) and implications for the risk assessment of feed additives and contaminants. Toxicol Lett 2021, 338: 114-127.
Lehman A.J., O.G. Fitzhugh, 100-fold margin of safety, Association of the Food Drug Officials Quartely Bulletin (1954).
Li Y, Batibawa JW, Du Z, Liang S, Duan J, Sun Z. Acute exposure to PM(2.5) triggers lung inflammatory response and apoptosis in rat. Ecotoxicol Environ Saf 2021, 222: 112526.
Li J, Hu Y, Liu L, Wang Q, Zeng J, Chen C. PM2.5 exposure perturbs lung microbiome and its metabolic profile in mice. Sci Total Environ 2020, 721: 137432.
Phan BN, Bohlen JF, Davis BA, Ye Z, Chen HY, Mayfield B, et al. A myelin-related transcriptomic profile is shared by Pitt-Hopkins syndrome models and human autism spectrum disorder. Nat Neurosci 2020, 23(3): 375-385.
Qiu YN, Wang GH, Zhou F, Hao JJ, Tian L, Guan LF, et al. PM2.5 induces liver fibrosis via triggering ROS-mediated mitophagy. Ecotoxicol Environ Saf 2019, 167: 178-187.
Shan H, Li X, Ouyang C, Ke H, Yu X, Tan J, et al. Salidroside prevents PM2.5-induced BEAS-2B cell apoptosis via SIRT1-dependent regulation of ROS and mitochondrial function. Ecotoxicol Environ Saf 2022, 231: 113170.
Tome D. Admissible daily intake for glutamate. Curr Opin Clin Nutr Metab Care 2020, 23(2): 133-137.
Wang Y, Tang M. PM2.5 induces autophagy and apoptosis through endoplasmic reticulum stress in human endothelial cells. Sci Total Environ 2020, 710: 136397.
Wang Y, Tang N, Mao M, Zhou Y, Wu Y, Li J, et al. Fine particulate matter (PM2.5) promotes IgE-mediated mast cell activation through ROS/Gadd45b/JNK axis. J Dermatol Sci 2021, 102(1): 47-57.
Zhang J, Liu J, Ren L, Wei J, Duan J, Zhang L, et al. PM(2.5) induces male reproductive toxicity via mitochondrial dysfunction, DNA damage and RIPK1 mediated apoptotic signaling pathway. Sci Total Environ 2018, 634: 1435-1444;
Zhang Y, Hu H, Shi Y, Yang X, Cao L, Wu J, et al. (1)H NMR-based metabolomics study on repeat dose toxicity of fine particulate matter in rats after intratracheal instillation. Sci Total Environ 2017, 589: 212-221;
Zhao C, Wang Y, Su Z, Pu W, Niu M, Song S, et al. Respiratory exposure to PM2.5 soluble extract disrupts mucosal barrier function and promotes the development of experimental asthma. Sci Total Environ 2020, 730: 139145.
2. Regarding the English written in the manuscript, I found several misspelled words, such as typo errors. Also, the authors need to check a few wrong or missing prepositions, punctuation, and the agreement between subject and verb in some sentences. Furthermore, please check words in the original language.
Thank you for your valuable guidance on the writing of my manuscript. After conducting a meticulous sentence-by-sentence review, I have rectified any erroneous writing in the original manuscript and made necessary amendments.
3. In the manuscript, beginning with the abstract, it would be essential to change the meaning of the inferences obtained from the analysis of the RNAseq experiments. Since this type of in vitro experiment is only exploratory, it then raises hypotheses that must be confirmed a posteriori through other in vivo experiments. In the abstract the current text reads: "we comprehensively analyzed the transcriptional landscape of HTR8/SVneo cells exposed to PM2.5 through RNA-Seq and confirmed that PM2.5 triggered oxidative stress and mitochondrial apoptosis to damage HTR8/SVneo cell biological functions through CYP1A1." The meaning could be changed by using this statement "we comprehensively analyzed the transcriptional landscape of HTR8/SVneo cells exposed to PM2.5 through RNA-Seq and observed that PM2.5 triggered overexpression of pathways involved in oxidative stress and mitochondrial apoptosis to damage HTR8/SVneo cell biological functions through CYP1A1." Or "we comprehensively analyzed the transcriptional landscape of HTR8/SVneo cells exposed to PM2.5 through RNA-Seq and confirmed by validation tests that PM2.5 triggered oxidative stress and mitochondrial apoptosis to damage HTR8/SVneo cell biological functions through CYP1A1."
Thank you for your valuable suggestion on my summary, which I wholeheartedly agree with. I have changed the abstract with:
“we comprehensively analyzed the transcriptional landscape of HTR8/SVneo cells exposed to PM2.5 through RNA-Seq and observed that PM2.5 triggered overexpression of pathways involved in oxidative stress and mitochondrial apoptosis to damage HTR8/SVneo cell biological functions through CYP1A1.” (P3 L57-59).
Your revision has enhanced the rigor and scientificity of our article, greatly assisting us in its development. We sincerely appreciate for your valuable suggestions.
4. The methodology for the bioinformatics analysis of the RNA-seq experiments needs to be better described. The authors should better detail the data pre-processing steps (to get quality control), including the software and the parameters applied until achieved at Differentially Expressed Genes (DEGs), such as read alignments, counts, normalization, and DEGs.
Although the analyses of the KEGG pathway enrichment analysis of differentially expressed genes and Gene Set Enrichment Analysis (GSEA) were carried out in a particular company, it is also desirable that the details of the analyses are described in the methodology with their respective parameters.
Thank you for your valuable suggestion on our manuscript. We concur with the reviewer's recommendation and have revised the methodological section of our RNA-seq bioinformatics analysis accordingly. The modifications are outlined below:
“The raw sequencing data was subjected to filtration using SOAPnuke in order to obtain clean reads. The clean reads were mapped to the reference genome using HISAT, and aligned to the assembled unique gene set using Bowtie2. Subsequently, the data analysis and mapping were performed utilizing the sequencing company's proprietary system (https://biosys.bgi.com). The gene expression was quantified utilizing the RNA-Seq by Expectation-Maximization (RSEM) algorithm, and differentially expressed genes (DEGs) were identified by the R-Bioconductor package DESeq2 with pre-set Q value﹤0.05 and |log2[Fold Change]|≥1. KEGG enrichment analysis of annotated DEGs was performed using phyper based on Hypergeometric test, and the significance values of pathways were strictly threshold corrected by Q values (Q values≤0.05). Gene Set Enrichment Analysis (GSEA) was performed on control and treatment groups based on KEGG database data. All parameters were kept at default settings, except for the maximum size of the filtering threshold which was adjusted to 5000. Gene features with FDR Q values≤0.25 were deemed statistically significant.” (P30 L697-708).
5. Some bioinformatics analyses deserve to be better explained. This is because this manuscript reports an interdisciplinary work, and it is expected that non-experts in bioinformatics can understand the findings and correlations between the different results. For example, explain in more detail the analyses and how to interpret each result shown in figure 4, from A to H, particularly curves and cutoff values.
Many thanks for your suggestion. As recommended by the reviewer, our description of biogenic analysis is overly simplistic. Therefore, in order to provide readers with a more comprehensive understanding of our research, we have revised our results and figure legends sections. The following was modified in the results:
“in addition, 3D principal component analysis showed that the clusters of samples with high similarity were consistent with the actual exposure grouping, suggesting that PM2.5 significantly changed the gene expression of the HTR8 cells. By applying the cut-off criteria of Q value﹤0.05 and |log2[Fold Change]|≥1, we identified 32 coding genes that exhibited differential expression between the control and PM2.5 treatment groups, comprising 24 up-regulated genes and 8 down-regulated genes. These findings were visually represented through volcano plots and heat maps. The KEGG pathway enrichment analysis was performed to predict the potential regulatory mechanisms of PM2.5-induced trophoblast damage. Our findings were further supported by GSEA, which revealed significant upregulation of four enriched pathways – Cytochrome P450 pathway, chemical carcinogenesis pathway, ovarian steroidogenesis pathway and steroid biosynthesis pathway – in the PM2.5-exposed group. The results from both analyses suggest that cytochrome P450 is the most significantly enriched pathway”. (P10 L222-234) We also append the following caption to the legend of Figure 4: “The zero-cross line indicates the point in which the difference between expression in the PM2.5-treated and control groups is zero. NES, normalized enrichment score; FDR, false discovery rate.” (P44 L1190)
6. Figures:
6.1. I feel that the figures presented accompanying the results are not self-explanatory. There are too many tags that the non-expert reader cannot understand because they have not dominated the meaning. To cite just one example here: Figure 9D: si-NC – si-KLF9#1 – si-KLF9#2. The authors need to put the meaning of the figures' tags in the respective captions. Remembering again that this is an interdisciplinary paper.
Many thanks for your suggestion. I have provided a more detailed description in the figure legends to enhance the reader's comprehension of my manuscript. Such as: “FSC-A: Forward Scatter-Area; SSC-A: Side Scatter-Area” in P44 L1170; “The zero-cross line indicates the point in which the difference between expression in the PM2.5-treated and control groups is zero. NES, normalized enrichment score; FDR, false discovery rate.” in P45 L1192; “si-CYP1A1#1, si-CYP1A1#2: siRNAs to knockdown CYP1A1; si-NC: siRNA Negative Control” in P48 L1264; “si-KLF9#1, si-KLF9#2: siRNA to knockdown KLF9 expression; si-NC: siRNA Negative Control” in P49 L1299; “(I) The histogram indicated the Mito-SOX Red Staining mean intensity in each group. (J) The histogram indicated the Red/Green intensity in each group” in P46 L1214.
6.2. There is a critical error in Figure 4E, where the authors show the Z-score scale in the heat map. While in the manuscript text they describe that 24 genes were up-regulated and eight genes down-regulated in the PM 2.5 samples, in Figure 4E, we see the opposite. In Figure 4E, we see 24 genes in red that represent an expression level lower than the mean, whereas eight green genes that represent an expression level above the mean related to PM 2.5 samples compared to control samples. Please check this figure and identify and correct this critical error.
We are very grateful to the reviewer for helping us find this major mistake. The Row Z-Score legend was mistakenly labelled during the drawing process, resulting in this issue. We have rectified it in the Figure 4B. (As we have removed 4A, 4B, 4C to Supplement 1A, 1B, 1C as advised by the other reviewer, the previous Figure 4E has become the current Figure 4B.)
6.3. Figure 9G is very confusing to me. This figure contains a left and right panel that the reader must interpret as correlating. The left panel shows the CYP1A1 promoter region with several deletions that either resulted in failure of binding by FT KLF9 or not. Therefore, in the right panel, the reader would expect to see which mutations prevent FT KLF9-mediated CY1A1 expression. However, in Figure 9G on the right panel, the authors showed the expression of KLF9 or control. So, in this scenario, the picture gets confused. I suggest that the authors correct this figure to clarify this experiment's results.
Also, in the explanation of this figure 9, there is a mistake in the sense of writing, e.g., "These results suggested that a response element of the CYP1A1 promoter located in the -64 bp to -49 bp region, GAAGGAGGCGTGGCC, was required for the transcription of KLF9." A change to the following is recommended: "…, was required for the transcription of CYP1A1 meditated by KLF9."
Many thanks for your suggestion. We apologize for any confusion caused by the image in regards to the reviewer's comprehension. The left schematic illustrates the predicted binding sites of the CYP1A1 promoter through the KLF9 motif and the construction of mutant reporter gene plasmids based on site-specific design. The mutated human CYP1A1 promoter-luciferase reporter gene plasmids were co-transfected with pRL-TK into HTR8/SVneo cells stably expressing Vector and KLF9 for further analysis. The right bar showed the relative luciferase activity of different CYP1A1 promoters in KLF9 overexpressing cells (KLF9) compared to control cells (Vector) using dual-luciferase reporter gene assays. This was illustrated in the legend of the previous manuscript. We have rewritten the legend of this figure to facilitate the understanding of this result by reviewers and readers:
“The bars on the right showed the relative luciferase activity of different CYP1A1 promoters in KLF9 overexpressing cells (KLF9) compared to control cells (Vector) using dual-luciferase reporter gene assays.” (P49 L1290).
Also, we have changed the color of the legend "KLF9 binding sites" on the left side of Figure 9G to orange and the coordinates of the bar on the right side to "Relative luciferase activity". Moreover, we have corrected it in result section as follows:
“These results suggested that a response element of the CYP1A1 promoter located in the -64 bp to -49 bp region, GAAGGAGGCGTGGCC, was required for the transcription of CYP1A1 meditated by KLF9.”
(P15 L340). As we have deleted Figure 9C as advised by the other reviewer, the previous Figure 9G has become the current Figure 9F.
6.4. Figures 9 H and I do not show what the authors claim in the text: "The chromatin was precipitated with specific antibodies for KLF9 or IgG, and PCR analysis with the indicated primers showed that KLF9 was able to bind directly to the CYP1A1 promoter (Figure 9H and I)."
The authors need to show the figure that corresponds with this statement. It would be interesting to perform the ChIP analysis experiment using wild-type and mutant constructs of the CY1A1 promoter, confirming the results of the region of this promoter that effectively binds KLF9.
Many thanks for your advice. We apologize for your confusion about our results due to the simplicity of the previous manuscript. In the previous Figure 9H and I, we employed ChIP to investigate the binding of KLF9 to the CYP1A1 promoter. The chromatin was precipitated with antibodies specific for KLF9 or IgG, and PCR was conducted with CYP1A1 promoter primers (spanning the -96/+16 bp region of the CYP1A1 promoter). The result of agarose gel electrophoresis and RT-qPCR analysis confirmed that KLF9 was able to bind directly to the CYP1A1 promoter. To make it easier to understand, we revised the result:
“The chromatin was precipitated with antibodies specific for KLF9 or IgG, and PCR analysis with the primers (spanning the -96/+16 bp region of the CYP1A1 promoter) showed that KLF9 was able to bind directly to the CYP1A1 promoter (Figure 9G and H).”
(P15 L342-344).
Meanwhile, we inserted the following description of the picture in the legend:
“(G) Chromatin from KLF9 over-expression HTR8/SVneo cells was subjected to ChIP assay using KLF9 antibody or control IgG. PCR amplification with primers spanning the -96/+16 bp region of the CYP1A1 promoter was performed. A 2% agarose gel electrophoresis was performed on PCR products. (H) RT-qPCR analysis quantitatively demonstrated that KLF9 overexpression increased its binding to the endogenous CYP1A1 promoter” (P49 L1291-1295).
As we have deleted Figure 9C as advised by the other reviewer, the previous Figure 9H and I have become the current Figure 9G and H.
In our study, in order to demonstrate that KLF9 can bind directly to CYP1A1 promoter, we first identified the region by which KLF9 can promote transcription of CYP1A1 by dual-luciferase assays, then designed primers based on this region and verified by ChIP-qPCR that KLF9 can bind directly to this region. The method we used to demonstrate that KLF9 binds directly to the CYP1A1 promoter region is as same as many authoritative papers (Wang L et al. Cancer Lett. 2020; Lin CC et al. Theranostics 2020). The plasmids that reviewer mentioned that we constructed containing mutated CYP1A1 promoter regions were specifically for luciferase expression. So, we may not able to perform the ChIP analysis experiment using wild-type and mutant constructs of the CY1A1 promoter currently. In the future work, we will use mutant constructs of the CY1A1 promoter to confirming the region of this promoter that effectively binds KLF9 as suggested by the reviewer. Thank you again for your very useful advice.
Reference:
Wang L, Zhang Z, Yu X, Li Q, Wang Q, Chang A, et al. SOX9/miR-203a axis drives PI3K/AKT signaling to promote esophageal cancer progression. Cancer Lett 2020, 468: 14-26.
Lin CC, Kuo IY, Wu LT, Kuan WH, Liao SY, Jen J, et al. Dysregulated Kras/YY1/ZNF322A/Shh transcriptional axis enhances neo-angiogenesis to promote lung cancer progression. Theranostics 2020, 10(22): 10001-10015.
7. Discussion: related to this sentence "To our knowledge, this study is the first to report that PM2.5 caused mitochondrial apoptosis via inducing oxidative stress, which in-turn impaired a series of biological functions such as invasion, migration, and angiogenesis in placental trophoblasts.", Actually, this one paper Front. Endocrinol., 12 March 2020 Sec. Translational Endocrinology Volume 11 – 2020 https://doi.org/10.3389/fendo.2020.00075. Please double check, since they also described oxidative damage in trophoblasts and correct corresponding.
Many thanks for your advice. The purpose of our previous manuscript was to demonstrate that we were the first time to identify that PM2.5 altered cell biological function in trophoblast cells through oxidative stress induced mitochondrial apoptosis. In the paper “Endocrinol., 12 March 2020 Sec. Translational Endocrinology Volume 11 – 2020 | https://doi.org/10.3389/fendo.2020.00075.”, the authors discovered that PM2.5 induced oxidative stress, mitochondrial damage and inflammation in trophoblasts. However, the study did not explore whether oxidative stress was responsible for causing mitochondrial damage and inflammation.
Our previous description failed to effectively convey our perspective, thus we have revised.
"Our study demonstrated that exposure to PM2.5 induced oxidative stress in placental trophoblast, leading to mitochondrial apoptosis and impairment of cell biological functions."(P18 L426-428)
8. Inferences report to metformin:
Inferences about the application of the drug metformin were raised from experiments testing a single dose at a high level (20 mM). The authors only concentrated on the target genes highlighted in this work (CYP1A1 and KLF9).
I suggest that metformin evaluation should be better explored in another paper. In this scenario, the results are not very robust and complicate the focus of this paper, which turned out to be very large. Metformin could be explored by tests using more treatments and even performing new RNAseq experiments on trophoblast cells exposed to the drug at different doses.
Thanks a lot for your advice. In our study, we have observed a robust correlation between PM2.5 and adverse pregnancy outcomes; however, there is currently no clinical intervention or prophylactic medication available to alleviate this association. To mitigate the incidence of unfavorable pregnancy outcomes caused by atmospheric pollution, we identified metformin by communicating with clinicians. We then combined with the KLF9/CYP1A1, a signalling pathway that we had demonstrated that was involved in PM2.5-induced oxidative stress damage in trophoblast cells, to preliminarily validate the mechanism of metformin. However, our investigation of metformin was insufficient because of time limit. We only utilized a single concentration of metformin and solely examined its mechanistic effects on KLF9 and CYP1A1. Therefore, as suggested by the reviewer and editor, we have removed the metformin-related content. Considering metformin could be a promising avenue for the clinical management of adverse pregnancy outcomes associated with PM2.5 exposure. Therefore, in future studies, we will enhance the concentration gradient of metformin and conduct a more thorough exploration into its role in safeguarding against adverse pregnancies caused by PM2.5 through new RNA-Seq or proteomic sequencing analysis.
Reviewer #2 (Recommendations for the authors):
Epidemiological studies have linked an increase in air pollutants, including fine particulate matter (PM2.5) to adverse pregnancy and postnatal outcomes. However, the molecular details of this are unclear, partially because there is no established mouse model in which to investigate the effects of PM2.5 on mammalian pregnancy. Li and Li et al. begin this study with the collection and characterization of PM2.5 from a high-volume sampling system set up in Jinan City, China. Upon collection of this material, the authors began their study using scanning electron microscopy and elemental analysis to define the properties of PM2.5. The authors use this material to establish a mouse model and cellular system to test the molecular effects of PM2.5 on pregnancy, postnatal mouse health, and trophoblast cells. One caveat of these studies is the dosage of PM2.5 given to the mice; the authors calculate dosages based on their estimation of PM2.5 exposure of pregnant women in Jinan in 2020, but include a 100-fold "uncertainty factor," which substantially increases the amount of PM2.5 given to the mice in their model system. This, along with the multiple timepoints at which PM2.5 is administered, suggests that the authors may be dosing mice with up to 400 times higher levels of PM2.5 than humans experience, on average, based on their own calculations. It is unclear if more physiologically relevant doses of PM2.5 (less the uncertainty factor) would have such stark effects on pregnancy outcomes as are shown in this study.
Thank you very much for your suggestion on our manuscript. We apologize for your confusion about our PM2.5 dosage given to the mice due to the over simplicity of our writing in the previous manuscript. Please kindly allow me to provide a detailed explanation of the dosage used in in vivo experiments.
In the in vivo experiments, we determined the PM2.5 exposure dosage for the whole gestation period by combining the PM2.5 exposure of pregnant women in Jinan and the physiological indicators of mice, multiplied by 100-fold uncertainty factor. The 100-fold uncertainty factor is one of the guidelines for the design of dosage for animal experiments in toxicological studies. It was derived from the integration of toxicokinetics and toxicodynamics, resulting in a multiplication of 10-fold interspecies difference with 10-fold interindividual variation. It was initially proposed by Lehman and Fitzhugh (Lehman A.J. et al. Association of the Food Drug Officials Quartely Bulletin 1954) over 60 years ago to convert a no-observed-adverse-effect level (NOAEL) from an animal toxicity study to a safe value for human intake (ADI). Scientists later applied the 100-fold uncertainty factor extensively to the selection of toxic dosage for animal experiments in toxicological studies, such as Lautz LS et al. Toxicol Lett, 2021; Arnot JA et al. J Expo Sci Environ Epidemiol, 2022; Tome D et al. Curr Opin Clin Nutr Metab Care, 2020; Cooper A.B. et al. Regul Toxicol Pharmacol, 2019. Meanwhile, the Unite States Environmental Protection Agency (EPA) also identified the 100-fold uncertainty factor as the criteria for animal study in conducting a human health risk assessment (https://www.epa.gov/risk/conducting-human-health-risk-assessment). In authoritative studies related to PM2.5, the 100-fold uncertainty factor is also considered as one of the criteria for in vivo experiments (Chen Q et al. J Exp Clin Cancer Res 2022; Li Y. et al. Ecotoxicol Environ Saf, 2021; Li J. et al. Sci Total Environ, 2020; Zhang J et al. Sci Total Environ 2018; Zhang Y et al. Sci Total Environ 2017.). In these PM2.5 related studies, the dosage of PM2.5 in the in vivo experiments was determined by combining the ambient PM2.5 level with the physiological indicators of mice, multiplying by 100 times the uncertainty factor, which aligned with our calculations. The only difference of the dosage between these study and our manuscript is the ambient PM2.5 exposure level. They employed ambient PM2.5 level recommended by WHO, while we employed ambient PM2.5 levels of pregnant women in Jinan area ( where we collected PM2.5 particules).
Additionally, the PM2.5 dosage we calculated was the total exposure of pregnant mice to PM2.5 throughout their entire pregnancy. In order to mitigate the impact of intratracheally instilled PM2.5 on pregnant rats, we partitioned the calculated dose of PM2.5 into three equal portions (rather than multiplying it by 4 times which reviewer mentioned) and administered them via intratracheal instillation on 1.5d, 7.5d, and 12.5d of pregnancy separately (the three points of time also corresponded to the First trimester, second trimester, and third trimester of human pregnancy respectively) (Theiler, K et al., Springer. Berlin 1972; Amack JD. et al. Cell Commun Signal 2021; Bunnell TM,et al. Cytoskeleton (Hoboken) 2010). Therefore, although the dosage in our in vivo experiment may appear higher than the PM2.5 dosage absorbed by normal pregnant women, it was determined through a scientific methodology that taked into consideration interspecies difference and interindividual variation. In order for reviewers and readers to better understand the reasons for our choice of PM2.5 dose in the in vivo experiment, we have revised the method section:
“At 8 weeks, the average tidal volume of Kunming mice was about 0.25 mL, and the frequency of per mouse’s respiratory was about 163/min, thus, the total air intake per day was 0.25 x 163 x 60 mins x 24 hrs = 58680 mL ≈ 0.0587 m3/day[41]. It has been reported that the PM2.5 exposure of pregnant women in Jinan in 2020 was about 64 μg/m3 daily [40]. Therefore, the total PM2.5 intake though out the whole pregnancy of mice was about 0.0587 m3/day × 64 μg/m3 × 20 days × 100 (uncertainty factor) = 7511 μg. The 100 fold uncertainty factor = 10-fold interspecies difference ×10-fold interindividual variation [95] [60]. We weighed 7511 μg PM2.5 particles and dissolved it in 60 μL PBS buffer to prepare a PM2.5 suspension, which was subsequently divided into three equal portions. Pregnant mice were anaesthetized by intraperitoneal injection of 0.5% pentobarbital sodium (50 mg/kg) on 1.5 d, 7.5 d, and 12.5 d of pregnancy (corresponding to first, second and third trimester of human), followed by intratracheal instillation of 20 μL PM2.5 suspension, and the control group was intratracheally instilled with the same volume of PBS (n = 8 for per group).” (P24 L563-572).
We have also added the text about 100 uncertainty factor to the Discussion section:
“The selection of appropriate PM2.5 exposure dosage in mice was critical for our experiments. We combined the PM2.5 exposure level of pregnant women from the Jinan [40] (where we collected PM2.5 particles) with physiological indicators of mice [41], then multiplied by 100-fold uncertainty factor to obtain the corresponding PM2.5 exposure dosage during mice pregnancy. The 100-fold uncertainty factor ( = 10-fold interspecies difference × 10-fold interindividual variation) is used to convert a no-observed-adverse-effect level (NOAEL) from an animal toxicity study to a safe value for human intake (ADI), which is the criteria for determining experimental dosages in toxicological studies involving animals. It was originally proposed, over 60 years ago, by Lehman and Fitzhugh[57], and still forms the basis of the uncertainty factors which are in use today. Also, the 100-uncertainty factor is considered one of the criteria for in vivo experiments in authoritative studies related to PM2.5 [58-60].” (P16 L383-392)
Reference:
Amack JD. Cellular dynamics of EMT: lessons from live in vivo imaging of embryonic development. Cell Commun Signal 2021, 19(1): 79;
Bunnell TM, Ervasti JM. Delayed embryonic development and impaired cell growth and survival in Actg1 null mice. Cytoskeleton (Hoboken) 2010, 67(9): 564-572.
Chen Q, Wang Y, Yang L, Sun L, Wen Y, Huang Y, et al. PM2.5 promotes NSCLC carcinogenesis through translationally and transcriptionally activating DLAT-mediated glycolysis reprograming. J Exp Clin Cancer Res 2022, 41(1): 229;
Cooper AB, Aggarwal M, Bartels MJ, Morriss A, Terry C, Lord GA, et al. PBTK model for assessment of operator exposure to haloxyfop using human biomonitoring and toxicokinetic data. Regul Toxicol Pharmacol 2019, 102: 1-12.
Lautz LS, Jeddi MZ, Girolami F, Nebbia C, Dorne J. Metabolism and pharmacokinetics of pharmaceuticals in cats (Felix sylvestris catus) and implications for the risk assessment of feed additives and contaminants. Toxicol Lett 2021, 338: 114-127.
Lehman A.J., O.G. Fitzhugh, 100-fold margin of safety, Association of the Food Drug Officials Quartely Bulletin (1954).
Li Y, Batibawa JW, Du Z, Liang S, Duan J, Sun Z. Acute exposure to PM(2.5) triggers lung inflammatory response and apoptosis in rat. Ecotoxicol Environ Saf 2021, 222: 112526.
Li J, Hu Y, Liu L, Wang Q, Zeng J, Chen C. PM2.5 exposure perturbs lung microbiome and its metabolic profile in mice. Sci Total Environ 2020, 721: 137432.
Theiler K, JQRoB. The house mouse : development and normal stages from fertilization to 4 weeks of age. 1972, 17(3): 133-145
Tome D. Admissible daily intake for glutamate. Curr Opin Clin Nutr Metab Care 2020, 23(2): 133-137.
Zhang J, Liu J, Ren L, Wei J, Duan J, Zhang L, et al. PM(2.5) induces male reproductive toxicity via mitochondrial dysfunction, DNA damage and RIPK1 mediated apoptotic signaling pathway. Sci Total Environ 2018, 634: 1435-1444;
Zhang Y, Hu H, Shi Y, Yang X, Cao L, Wu J, et al. (1)H NMR-based metabolomics study on repeat dose toxicity of fine particulate matter in rats after intratracheal instillation. Sci Total Environ 2017, 589: 212-221;
Nonetheless, the authors show that administration of PM2.5 through intratracheal inhalation leads to increased fetal mortality, decreased fetal weight and number, damaged placental structure, and increased trophoblast apoptosis in mice and in isolated trophoblast cells. To investigate the molecular mechanisms underlying these phenotypes, the authors performed RNAseq on PM2.5-treated trophoblasts and identify two genes, CYP1A1 and KLF9, that are transcriptionally upregulated upon PM2.5 exposure. The authors find that genetic ablation of CYP1A1 diminishes oxidative stress and intrinsic cell death in PM2.5-treated cells, suggesting upregulation of this cytochrome P450 family member at least partially drives toxicity in this model. The authors then link KLF9, a transcription factor also upregulated in PM2.5-treated trophoblasts, to CYP1A1 expression, mapping the KLF9 responsive element in the CYP1A1 promoter. These data suggest that PM2.5 exposure induces KLF9-mediated transcription of CYP1A1 to promote oxidative stress and cell death in trophoblasts and in the placenta of pregnant mice. In a final set of experiments, the authors find that a relatively high dose of 20 mM metformin can ameliorate some toxic effects of PM2.5 in trophoblast cells, and that this correlates with a decrease in PM2.5-induced CYP1A1 and KLF9 expression.
Collectively, the data presented by the authors convincingly demonstrate that: 1. The chosen dose of PM2.5 administered to mice causes significant increases in fetal mortality and morbidity; 2. Treatment of trophoblasts with PM2.5 causes oxidative stress, increases in apoptosis, and results in the transcriptional upregulation of CYP1A1 and KLF9; 3. KLF9 binds to the CYP1A1 promoter, driving its expression upon PM2.5 exposure, and that 4. CYP1A1 upregulation is necessary for PM2.5-induced oxidative stress. The authors also claim that "metformin could eliminate the toxicity induced by PM2.5 via the KLF9/CYP1A1 transcriptional regulatory axis" in their model trophoblast cell line, although this link is correlative as presented within the current study. While the data strongly implicate KLF9 and CYP1A1 to PM2.5-mediated toxicity, the mechanisms by which KLF9 senses PM2.5 were not established in this study, nor were the effects of KLF9 on gene products other than CYP1A1, which may also contribute to the phenotypes seen within this mouse model. Finally, though the reasoning for testing metformin in this disease model is not fully clear, there does seem to be therapeutic benefit at high doses of metformin to ameliorate phenotypes associated with PM2.5-mediated toxicity.
Many thanks for your comments on our manuscript. In our study, we employed a combination of RNA-Seq and validation assays to identify CYP1A1 as a crucial gene involved in PM2.5-induced oxidative stress in trophoblast cells. Subsequently, bioinformatic predictions were utilized to determine its transcription factor KLF9, which was then confirmed through Chip and Dual-luciferase assays to regulate the transcriptional activity of CYP1A1. As the reviewer suggested, we lacked research on the regulation of KLF9 by PM2.5 and whether its impact on genes beyond CYP1A1, which are the work we are currently engaged in. On one hand, our work exploring issues would take a lot of time, and on the other hand, I think adding PM2.5 regulation of KLF9 to the current article might complicate our research focus, so we will explore how PM2.5 regulates KLF9 and whether KLF9 affects trophoblastic biological function through other signaling pathways in future study. Meanwhile, I have incorporated the limitations of the current KLF9 study into the Discussion section:
“Furthermore, our current article lacks investigations on the regulatory of PM2.5 on KLF9. These limitations should be further investigated in future”. (P22 L525-527)
I would like to express my gratitude for your valuable advice once again.
This is an important study on the effects of PM2.5 on pregnancy outcomes in mice. Overall, the authors use multiple independent systems to test the effects of PM2.5 in both mice and in trophoblast cells, adding rigor to the approach. The authors put forth a number of claims in the abstract, most of which are well justified:
1. "…PM2.5 induced adverse gestational outcomes such as increased fetal mortality rates, decreased fetal number and weight, damaged placental structure, and increased apoptosis of trophoblasts."
2. "…PM2.5 induced dysfunction of the trophoblast cell line HTR8/SVneo, including its proliferation, apoptosis, invasion, migration, and angiogenesis."
3. "…PM2.5 triggered oxidative stress and mitochondrial apoptosis to damage HTR8/SVneo cell biological functions through CYP1A1."
4. "…PM2.5 stimulated KLF9, a transcription factor identified as binding to CYP1A1 promoter region."
5. "…metformin could eliminate the toxicity induced by PM2.5 via the KLF9/CYP1A1 transcriptional regulatory axis in HTR8/SVneo."
The first four of these claims are well justified. The data presented may support the last claim on metformin treatment, but the data supporting this are correlative (see revision suggestions below). While the data collected support the hypothesis that PM2.5 leads to oxidative stress via the upregulation of KLF9 and CYP1A1, I have four main concerns that the authors could address to strengthen this work, which I outline below.
1. I am concerned with the dosages of particulate matter administered to the mice and cell models, and that these exceed physiologically relevant doses based on the calculations the authors provide in the methods section. The authors calculate a single dose of administration based on the average daily PM2.5 inhalation rate, and multiply it by 20 to reflect the full-term pregnancy in a mouse. However, the authors then use a 100-fold 'uncertainty factor' and administer this dose four times, despite the fact that the full pregnancy duration had already been factored into their calculations. Thus, one dose is ~100x the full exposure of PM2.5, but the authors administering this four times increases the potential exposure to ~400x what a pregnant woman in Jinan may experience. It is not hard to imagine that an excess dose may cause more severe pathologies than what women actually experience through PM2.5 inhalation. The authors should explain and justify why they used such high doses based on their own calculations and should repeat some key experiments with lower doses of PM2.5 to reflect physiologically relevant exposures.
Thank you very much for your suggestion on our manuscript. We apologize for your confusion about our results due to the over simplicity of our writing in the previous manuscript. Please kindly allow me to provide a detailed explanation of the dosage used in in vivo experiments.
In the in vivo experiments, we determined the PM2.5 exposure dosage for the whole gestation period by combining the PM2.5 exposure of pregnant women in Jinan and the physiological indicators of mice, multiplied by 100-fold uncertainty factor. 100-fold uncertainty factor was derived from the integration of toxicokinetics and toxicodynamics, resulting in a multiplication of 10-fold interspecies difference with 10-fold interindividual variation. It was initially proposed by Lehman and Fitzhugh (Lehman A.J. et al. Association of the Food Drug Officials Quartely Bulletin 1954) over 60 years ago to convert a no-observed-adverse-effect level (NOAEL) from an animal toxicity study to a safe value for human intake (ADI). Scientists later applied the 100-fold uncertainty factor extensively to the selection of toxic dosage for animal experiments in toxicological studies, such as Lautz LS et al. Toxicol Lett, 2021; Arnot JA et al. J Expo Sci Environ Epidemiol, 2022; Tome D et al. Curr Opin Clin Nutr Metab Care, 2020; Cooper A.B. et al. Regul Toxicol Pharmacol, 2019. Meanwhile, the Unite States Environmental Protection Agency (EPA) also identified the 100-fold uncertainty factor as the criteria for animal study in conducting a human health risk assessment (https://www.epa.gov/risk/conducting-human-health-risk-assessment). In authoritative studies related to PM2.5, the 100-fold uncertainty factor is also considered as one of the criteria for in vivo experiments (Chen Q et al. J Exp Clin Cancer Res 2022; Li Y. et al. Ecotoxicol Environ Saf, 2021; Li J. et al. Sci Total Environ, 2020; Zhang J et al. Sci Total Environ 2018; Zhang Y et al. Sci Total Environ 2017.). In these PM2.5 related studies, the dosage of PM2.5 in the in vivo experiments was determined by combining the ambient PM2.5 level with the physiological indicators of mice, multiplying by 100 times the uncertainty factor, which aligned with our calculations. The only difference of the dosage between these study and our manuscript is the ambient PM2.5 exposure level. They employed ambient PM2.5 level recommended by WHO, and we employed ambient PM2.5 levels of pregnant women in Jinan area ( where we collected PM2.5 particules).
Additionally, the PM2.5 dosage we calculated was the total exposure of pregnant mice to PM2.5 throughout their entire pregnancy. In order to mitigate the impact of intratracheally instilled PM2.5 on pregnant rats, we partitioned the calculated dose of PM2.5 into three equal portions (rather than multiplying it by 4 times which reviewer mentioned) and administered them via intratracheal instillation on 1.5d, 7.5d, and 12.5d of pregnancy separately (the three points of time also corresponded to the First trimester, second trimester, and third trimester of human pregnancy respectively) (Theiler, K et al., Springer. Berlin 1972; Amack JD. et al. Cell Commun Signal 2021; Bunnell TM,et al. Cytoskeleton (Hoboken) 2010). Therefore, although the dosage in our in vivo experiment may appear higher than the PM2.5 dosage absorbed by normal pregnant women, it was determined through a scientific methodology that taked into consideration interspecies difference and interindividual variation. In order for reviewers and readers to better understand the reasons for our choice of PM2.5 dose in the in vivo experiment, we have revised the method section:
“At 8 weeks, the average tidal volume of Kunming mice was about 0.25 mL, and the frequency of per mouse’s respiratory was about 163/min, thus, the total air intake per day was 0.25 x 163 x 60 mins x 24 hrs = 58680 mL ≈ 0.0587 m3/day[41]. It has been reported that the PM2.5 exposure of pregnant women in Jinan in 2020 was about 64 μg/m3 daily [40]. Therefore, the total PM2.5 intake though out the whole pregnancy of mice was about 0.0587 m3/day × 64 μg/m3 × 20 days × 100 (uncertainty factor) = 7511 μg. The 100 fold uncertainty factor = 10-fold interspecies difference ×10-fold interindividual variation [95] [60]. We weighed 7511 μg PM2.5 particles and dissolved it in 60 μL PBS buffer to prepare a PM2.5 suspension, which was subsequently divided into three equal portions. Pregnant mice were anaesthetized by intraperitoneal injection of 0.5% pentobarbital sodium (50 mg/kg) on 1.5 d, 7.5 d, and 12.5 d of pregnancy (corresponding to first, second and third trimester of human), followed by intratracheal instillation of 20 μL PM2.5 suspension, and the control group was intratracheally instilled with the same volume of PBS (n = 8 for per group).” (P24 L563-572).
We have also added the text about 100 uncertainty factor to the Discussion section:
“The selection of appropriate PM2.5 exposure dosage in mice was critical for our experiments. We combined the PM2.5 exposure level of pregnant women from the Jinan [40] (where we collected PM2.5 particles) with physiological indicators of mice [41], then multiplied by 100-fold uncertainty factor to obtain the corresponding PM2.5 exposure dosage during mice pregnancy. The 100-fold uncertainty factor ( = 10-fold interspecies difference × 10-fold interindividual variation) is used to convert a no-observed-adverse-effect level (NOAEL) from an animal toxicity study to a safe value for human intake (ADI), which is the criteria for determining experimental dosages in toxicological studies involving animals. It was originally proposed, over 60 years ago, by Lehman and Fitzhugh[57], and still forms the basis of the uncertainty factors which are in use today. Also, the 100-uncertainty factor is considered one of the criteria for in vivo experiments in authoritative studies related to PM2.5 [58-60].” (P16 L383-392)
Reference:
Amack JD. Cellular dynamics of EMT: lessons from live in vivo imaging of embryonic development. Cell Commun Signal 2021, 19(1): 79;
Bunnell TM, Ervasti JM. Delayed embryonic development and impaired cell growth and survival in Actg1 null mice. Cytoskeleton (Hoboken) 2010, 67(9): 564-572
Chen Q, Wang Y, Yang L, Sun L, Wen Y, Huang Y, et al. PM2.5 promotes NSCLC carcinogenesis through translationally and transcriptionally activating DLAT-mediated glycolysis reprograming. J Exp Clin Cancer Res 2022, 41(1): 229;
Cooper AB, Aggarwal M, Bartels MJ, Morriss A, Terry C, Lord GA, et al. PBTK model for assessment of operator exposure to haloxyfop using human biomonitoring and toxicokinetic data. Regul Toxicol Pharmacol 2019, 102: 1-12;
Lautz LS, Jeddi MZ, Girolami F, Nebbia C, Dorne J. Metabolism and pharmacokinetics of pharmaceuticals in cats (Felix sylvestris catus) and implications for the risk assessment of feed additives and contaminants. Toxicol Lett 2021, 338: 114-127.
Lehman A.J. O.G. Fitzhugh, 100-fold margin of safety, Association of the Food Drug Officials Quartely Bulletin (1954).
Li Y, Batibawa JW, Du Z, Liang S, Duan J, Sun Z. Acute exposure to PM(2.5) triggers lung inflammatory response and apoptosis in rat. Ecotoxicol Environ Saf 2021, 222: 112526.
Li J, Hu Y, Liu L, Wang Q, Zeng J, Chen C. PM2.5 exposure perturbs lung microbiome and its metabolic profile in mice. Sci Total Environ 2020, 721: 137432.
Theiler K, JQRoB. The house mouse : development and normal stages from fertilization to 4 weeks of age. 1972, 17(3): 133-145
Tome D. Admissible daily intake for glutamate. Curr Opin Clin Nutr Metab Care 2020, 23(2): 133-137.
Zhang J, Liu J, Ren L, Wei J, Duan J, Zhang L, et al. PM(2.5) induces male reproductive toxicity via mitochondrial dysfunction, DNA damage and RIPK1 mediated apoptotic signaling pathway. Sci Total Environ 2018, 634: 1435-1444;
Zhang Y, Hu H, Shi Y, Yang X, Cao L, Wu J, et al. (1)H NMR-based metabolomics study on repeat dose toxicity of fine particulate matter in rats after intratracheal instillation. Sci Total Environ 2017, 589: 212-221;
2. The metformin data at the end of the manuscript are unnecessary, and I believe they should be removed from the manuscript. While the authors demonstrate that a single high dose (20 mM) metformin can alleviate select phenotypes induced by PM2.5, these data are not rigorous enough to justify the use of metformin to alleviate PM2.5 toxicity in mice. Collection of such data would be beyond the scope of this manuscript, as it is already 11 figures worth of data. Furthermore, the authors suggest that metformin acts through the CYP1A1/KLF9 signaling axis, but they only show correlative data that these two proteins change at one dose of metformin administered for one timepoint. While these two key PM2.5 targets do change in response to metformin, significantly more data would need to be collected to demonstrate that these targets are required for this response. Finally, the justification for looking at metformin is obscure, and it is unclear why the authors chose this compound other than their statement that metformin is a 'miracle' drug. Collectively, the lack of rationale, effects only at a single high dose, and correlative nature of involvement with the KLF9/CYP1A1 pathway leave this line of investigation with insufficient rigor. As a substantial amount of work would be required to alleviate this, it would be advisable for the authors to remove this portion of the manuscript so as to be able to more fully characterize these phenotypes in a future study.
Thank you very much for your valuable advice for our manuscript. In our study, we have observed a robust correlation between PM2.5 and adverse pregnancy outcomes; however, there is currently no clinical intervention or prophylactic medication available to alleviate this association. To mitigate the incidence of unfavorable pregnancy outcomes in the presence of atmospheric pollution, we had performed some research of metformin. However, our investigation of metformin was insufficient because of time limit. We only utilized a single concentration of metformin and solely examined its mechanistic effects on KLF9 and CYP1A1. Therefore, as suggested by the reviewer, we have removed the metformin-related content. Considering metformin could be a promising avenue for the clinical management of adverse pregnancy outcomes associated with PM2.5 exposure. So, we will explore the effects of different concentrations of metformin and investigate the mechanism of metformin through cell function experiments combined with new RNA sequencing in the future work.
3. Some data would be more powerful if shown in a more quantitative manner. This includes the MitoSOX microscopy (Figures 5G, 7I, 10G) and the JC-1 microscopy (Figures 5H, 7J, 10F). There are also portions of the manuscript in which the authors claim "significant" changes in their data, but these experiments are not accompanied by statistical analysis (Figure 7B… "The results showed that, compared to the control group, the expression of CYP1A1 was significantly increased by PM2.5 exposure.") The authors should change the verbiage (e.g., 'substantially') or perform the relevant statistical analysis (which would be preferred).
Many thanks for your suggestion. We have added the relevant statistical analysis for the MitoSOX staining results in Figure 5H, 7J, 10I and for the JC-1 staining results in Figure 5J, 7L, 10J. The figure legends have also been added in line with the new figures.
4. The paper is too long, particularly in the discussion and conclusions (8 pages). The manuscript would be better if it were shortened.
Many thanks for your suggestion. We have eliminated the metformin-related content and streamlined the discussion to 2200 words from previous 2612 words. Additionally, we have condensed the conclusion to 111 words from previous 163 words.
Reviewer #3 (Recommendations for the authors):
This article investigated the PM2.5-induced toxicity on pregnancy outcomes and trophoblasts and revealed a novel mechanism by which PM2.5 caused trophoblast mitochondrial damage through KLF9/CYP1A1 transcriptional axis. Furthermore, this was the first time to identify KLF9 acted as the transcription factor positively modulating CYP1A1 in humans. This article also suggested a potential therapeutic effect of metformin. Overall, the work is logical and well supported by the data organized, and sufficiently innovative.
Thank you very much for your recognition on our study.
I have a few suggestions to improve the manuscript, please see below.
1. The authors constructed a PM2.5-exposed pregnant mice model by intratracheal instillation. The concentrations setting of PM2.5 were described in detail, but the selection of PM2.5 treatment time points (1.5 d, 7.5 d, and 12.5 d of pregnancy) was not explained. The authors need to describe the reason why these time points were chosen. In addition, the intratracheal instillation did not simulate PM2.5 environmental exposure properly, could the authors construct the animal model of PM2.5 exposure using a meteorological and environmental animal exposure system? (Ran Z, An Y, Zhou J, Yang J, Zhang Y, Yang J, et al. Subchronic exposure to concentrated ambient PM2.5 perturbs gut and lung microbiota as well as metabolic profiles in mice. Environ Pollut 2021, 272: 115987)
Many thanks for your advice. In our in vivo experiments, we opted to perform intratracheal instillation on pregnant rats at 1.5d, 7.5d and 12.5d of pregnancy to mitigate potential harm caused by the procedure. These time points corresponded to First, second and third trimesters respectively, given that the gestation period is approximately 20 days for rats and 280 days for humans (Theiler, K et al. Springer. Berlin 1972; Amack JD. et al. Cell Commun Signal 2021; Bunnell TM,et al. Cytoskeleton (Hoboken) 2010). So, we performed PM2.5 intratracheal instillation at these three time points to investigate the effect of PM2.5 on the entire gestation period. In many toxicological studies on embryonic development, same or similar time point was also chosen for in vivo experiments (Koren O et al. Cell 2012; Tata B et al. Nat Med 2018).
As recommended by the reviewer, intratracheal instillation is not a faithful representation of PM2.5 environmental exposure. However, due to our limited laboratory resources, we are currently restricted to conducting in vivo experiments via intratracheal instillation – a commonly employed method for in vivo studies related to PM2.5 such as Chen Q et al. J Exp Clin Cancer Res 2022; Zhang J et al. Sci Total Environ 2018; Zhang Y et al. Sci Total Environ 2017. In future research, we will collaborate with other advanced experimental platforms to conduct more scientifically rigorous studies on PM2.5 using meteorological and environmental animal exposure system. We appreciate your valuable suggestion on our testing methodologies.
Reference:
(1) Amack JD. Cellular dynamics of EMT: lessons from live in vivo imaging of embryonic development. Cell Commun Signal 2021, 19(1): 79.
(2) Bunnell TM, Ervasti JM. Delayed embryonic development and impaired cell growth and survival in Actg1 null mice. Cytoskeleton (Hoboken) 2010, 67(9): 564-572
(3) Chen Q, Wang Y, Yang L, Sun L, Wen Y, Huang Y, et al. PM2.5 promotes NSCLC carcinogenesis through translationally and transcriptionally activating DLAT-mediated glycolysis reprograming. J Exp Clin Cancer Res 2022, 41(1): 229.
(4) Koren O, Goodrich JK, Cullender TC, Spor A, Laitinen K, Backhed HK, et al. Host remodeling of the gut microbiome and metabolic changes during pregnancy. Cell 2012, 150(3): 470-480.
(5) Tata B, Mimouni NEH, Barbotin AL, Malone SA, Loyens A, Pigny P, et al. Elevated prenatal anti-Mullerian hormone reprograms the fetus and induces polycystic ovary syndrome in adulthood. Nat Med 2018, 24(6): 834-846.
(6) Theiler K, JQRoB. The house mouse: development and normal stages from fertilization to 4 weeks of age. 1972, 17(3): 133-145
(7) Zhang J, Liu J, Ren L, Wei J, Duan J, Zhang L, et al. PM(2.5) induces male reproductive toxicity via mitochondrial dysfunction, DNA damage and RIPK1 mediated apoptotic signaling pathway. Sci Total Environ 2018, 634: 1435-1444.
(8) Zhang Y, Hu H, Shi Y, Yang X, Cao L, Wu J, et al. (1)H NMR-based metabolomics study on repeat dose toxicity of fine particulate matter in rats after intratracheal instillation. Sci Total Environ 2017, 589: 212-221.
2. In result 3.9, the authors concluded that metformin reversed oxidative stress damage caused by PM2.5 through the KLF9/CYP1A1 transcriptional axis, but there were no results on the impact of metformin on the transcriptional level of CYP1A1. The authors should provide additional experiments to illustrate this issue and also add pertinent content to the discussion.
Thank you very much for your advice. In the previous manuscript, we only confirmed the reversal of PM2.5-induced increase in CYP1A1 protein expression levels by metformin through Western Blot. As suggested by the reviewer, we assessed whether metformin modulated CYP1A1 mRNA levels. Total RNA was extracted from control, PM2.5 and PM2.5+metformin groups followed by RT-PCR analysis for evaluating CYP1A1 mRNA expression levels. The results showed that metformin reduced the increase in CYP1A1 mRNA expression caused by PM2.5, as shown in Author response image 2.
The other two reviewers and the editor expressed concerns regarding the depth of our study on metformin, citing that we only examined one concentration of the metformin and investigated its impact on a limited number of genes (KLF9 and CYP1A1). As such, they suggested us to remove the section of metformin from this article and instead devote another study to exploring its effects in greater detail. So we have deleted the metformin section from our current manuscript and conduct a more in-depth analysis of its role in another study. Your suggestions regarding the regulation of CYP1A1 mRNA expression levels by metformin will be incorporated into this future study. Thank you once again for your valuable suggestions regarding our metformin section.
3. As the authors described in the paper, trophoblast biological functions such as invasion, migration, and tube formation were essential for placental development. The authors did not conduct relevant studies exploring the toxic effects of metformin in protecting trophoblast cells from PM2.5. The authors should perform further experiments to optimize the effects of metformin.
Many thanks for your advice. We have conducted experiments to investigate the potential effect of metformin in reversing PM2.5-induced functional impairment of trophoblasts as per your recommendation. Our findings demonstrated that metformin can partially restore the invasion, migration and tube-forming capacity of trophoblasts. The results were delineated as in Author response image 3.
These findings reinforced the protective role of metformin against PM2.5-induced damage in trophoblast cells. Although we have excluded metformin from the current manuscript based on suggestions from the other two reviewers and editors, your valuable advice will guide our future research on metformin, and we plan to incorporate these results into the forthcoming article. Thank you again for your insightful advice.
4. KLF9 is the focus of this manuscript to explore the toxic effects of PM2.5, but there are not many studies describing the role of KLF9 in toxicology in the Discussion section. For example, YUE GU et al. found that Klf9 is involved in BLM-induced pulmonary toxicity in human lung fibroblasts (Gu Y, Wu YB, Wang LH, Yin JN. Involvement of Kruppel-like factor 9 in bleomycin-induced pulmonary toxicity. Mol Med Rep 2015, 12(4): 5262-5266.) and Daqian Yang et al. identified that KLF9 was essential in allicin resisting against arsenic trioxide-Induced hepatotoxicity (Yang D, Lv Z, Zhang H, Liu B, Jiang H, Tan X, et al. Activation of the Nrf2 Signaling Pathway Involving KLF9 Plays a Critical Role in Allicin Resisting Against Arsenic Trioxide-Induced Hepatotoxicity in Rats. Biol Trace Elem Res 2017, 176(1): 192-200). Previously published evidence of KLF9-dependent toxicological responses needs to be cited more clearly in the manuscript.
Many thanks for your advice. As per the reviewer's suggestion, we have incorporated a section in our discussion elucidating the role of KLF9 in toxicological studies:
“There are also numerous studies indicating the critical role of KLF9 in toxicological research. For example, Yue Gu et al. found that Klf9 is involved in BLM-induced pulmonary toxicity in human lung fibroblasts, Daqian Yang et al. identified that KLF9 was essential in allicin resisting against arsenic trioxide-Induced hepatotoxicity, but little is known regarding its role in the occurrence of PM2.5-induced toxicological processes.” (P22 L514-518)
5. Is it possible to evaluate the role of KLF9 in placental toxicity caused by PM2.5 using knockout mice models?
Many thanks for your advice. As suggested by the reviewer, the conduction of KLF9 knockout mice would facilitate a more comprehensive investigation into the role of KLF9 in PM2.5-induced placental toxicity. However, due to technological constraints within our laboratory, we are currently unable to generate KLF9 knockout mice. In future studies, we plan to collaborate with external laboratories to establish this model and further elucidate the role of KLF9.
6. The authors used only trophoblast cell line HTR8/SVneo for in vitro experiments. Could it be possible to add trophoblast primary cells or other primary cells such as HUVEC? The authors should mention this and refer to this point in the manuscript.
Many thanks for the helpful advice. HTR-8/SVneo trophoblast cell line is the representative and commonly used extravillous trophoblasts (EVTs) model for research on trophoblast function. HTR-8/SVneo has been utilized as the subject of study in numerous authoritative articles on trophoblast toxicology (Li T et al. Environ Res 2022; Hu J et al. Environ Pollut 2022; Liao Y et al. Ecotoxicol Environ Saf 2021; Liu W et al. Ecotoxicol Environ Saf 2022). Therefore, the HTR8 trophoblast cell line was selected for in vitro experiments in the current study to investigate the impact of PM2.5 on trophoblast cells. As the reviewer suggested, together by using trophoblasts primary cells can better illustrate the effect of PM2.5 on the impairment of trophoblasts. However, the extraction of primary trophoblast cells remains a challenge for us due to current limitations in laboratory technology. We have also included our limitations for this point in the Discussion section (“We also lack the utilization of primary cells in our in vitro experiments. These limitations should be further investigated in future” ).(P22 L525-526) At present, we are cultivating trophoblast stem cells, and then inducing them to differentiate into extravillous trophoblasts with the characteristics of primary trophoblast. We will definitely use primary trophoblast cells in our future research.
Reference:
Hu J, Zhu Y, Zhang J, Xu Y, Wu J, Zeng W, et al. The potential toxicity of polystyrene nanoplastics to human trophoblasts in vitro. Environ Pollut 2022, 311: 119924.
Li T, Li Z, Fu J, Tang C, Liu L, Xu J, et al. Nickel nanoparticles exert cytotoxic effects on trophoblast HTR-8/SVneo cells possibly via Nrf2/MAPK/caspase 3 pathway. Environ Res 2022, 215(Pt 2): 114336.
Liao Y, Peng S, He L, Wang Y, Li Y, Ma D, et al. Methylmercury cytotoxicity and possible mechanisms in human trophoblastic HTR-8/SVneo cells. Ecotoxicol Environ Saf 2021, 207: 111520.
Liu W, Li S, Zhou Q, Fu Z, Liu P, Cao X, et al. 2, 2', 4, 4'-tetrabromodiphenyl ether induces placental toxicity via activation of p38 MAPK signaling pathway in vivo and in vitro. Ecotoxicol Environ Saf 2022, 244: 114034.
7. In result 3.8, the authors described "Cellular immunofluorescence showed that the increase in KLF9 expression was primarily observed in the nucleus (Figure 10D)". The authors assumed that KLF9 functioned as a transcription factor through nuclear translocation. To better corroborate this conclusion, I suggest that the authors should extract nuclear protein and detect the expression of KLF9 quantitatively.
Many thanks for your suggestion. As suggested by the reviewer, extractng nuclear protein and assessing KLF9 expression would provide greater clarity regarding the role of KLF9 as a transcription factor through nuclear translocation. Therefore, we isolated nuclear proteins from PM2.5-treated cells and assessed the expression of KLF9. The results revealed that the expression level of KLF9 in the nuclei was increased in a PM2.5 concentration-dependent manner. The results were delineated in Figure 10—figure supplement 1A.
This result reinforced the prvotal role of PM2.5 in promoting KLF9 as a transcription factor via nuclear translocation. We have added this to the Figure 10—figure supplement 1A and Results section (“The protein expression level of KLF9 in the nucleus was increased with the concentration of PM2.5 by western blotting (Figure 10—figure supplement 1A)”). (P15 L357)
8. AHR has been recognized as a receptor of environmental pollutants and a mediator of chemical toxicity including PM2.5. Meanwhile, AHR is an essential ligand-activated transcription factor of CYP1A1, which is also mentioned in the discussion of the manuscript. I am interested in the expression of AHR in trophoblast cells under PM2.5 exposure, does PM2.5 also increase AHR expression? Is it possible for the authors to conduct research on the role of PM2.5 on AHR?
Many thanks for your advice. The primary concern of our study is to identify the molecular mechanism of PM2.5 induced cytotoxicity on trophoblasts mediated by a novel transcription factor KLF9 and its regulation on CYP1A1. So we didn’t consider AHR. As the reviewer has pointed out, AHR is a crucial transcription factor that plays a pivotal role in regulating CYP1A1 expression, which has also been substantiated by numerous authoritative studies. We followed the reviewer's suggestion and conducted tests to investigate whether PM2.5 affects AHR expression. Western Blot results demonstrated that increasing concentrations of PM2.5 led to elevated levels of AHR expression as follows, suggesting that AHR may also play a critical role in the impact of PM2.5 on trophoblast cells.
In our present article, we have omitted AHR-related studies to clarify the primary focus of our research. However, in future investigations, we intend to concentrate on AHR and explore its role in PM2.5-induced adverse pregnancy outcomes. Thank you for providing valuable guidance on the future direction of our research.[Editors’ note: what follows is the authors’ response to the second round of review.]
The manuscript has been improved, but there are some remaining issues that need to be addressed, as outlined below:
To ensure transparency and reproducibility, we kindly request the supplemental material containing the complete dataset of the RNA-Seq analysis, including the total of 17,795 genes identified and the corresponding statistical parameters.
Reviewer #1 (Recommendations for the authors):
This study used PM2.5 collected from the urban region of Jinan, China, to establish pollutant exposure experiments by in vivo animal models and trophoblast cells. This relevant study applies several in vitro and in silico techniques from these models. The authors identify that PM2.5 activates the KLF9/CYP1A1 signaling pathway causing oxidative stress damage with mitochondrial apoptosis, which can be correlated to poor pregnancy outcomes observed in mice.
In general, the authors have adequately addressed the primary issues I raised in this revised version.
However, the importance of the authors providing a supplementary Table containing the complete dataset of the RNA-Seq analysis is necessary. In the current scientific landscape, transparency and reproducibility of experiments are vital principles that promote the advancement of knowledge and enable the scientific community to build upon previous findings.
By providing the entire dataset, including the total of 17,795 genes identified in the sequencing, along with the corresponding statistical parameters of the differential expression analysis (DEG) such as P-value, FDR, and Log2FC, you will contribute significantly to the transparency and reproducibility of your study. This will enable other researchers to validate and replicate your findings, facilitating scientific progress.
Firstly, we would like to express our gratitude for your recognition on our study. Secondly, we wholeheartedly concur with your advice that providing comprehensive RNA-Seq analysis data is necessary. Because our RNA-Seq sequencing data file was too large, containing both the raw data and processed data, we have uploaded the sequencing data into GEO database (accession number: GSE237795). The aforementioned information has been incorporated into the manuscripts:
“The RNA sequencing data were deposited into the Gene Expression Omnibus (GEO) database (accession number: GSE237795).”(P30 L709).
We have also indicated in the eLife submission system that we have deposited the RNA-Seq sequencing data into GEO database. As our article is yet to be officially published, we have designated August 1, 2023 as the date for the GEO database system to release RNA-Seq sequencing data to the public. We encourage further utilization of our RNA-Seq sequencing data by other researchers to investigate the impact of PM2.5 on pregnancy.
Thank you for your all valuable suggestion on our manuscript, which help making our study more comprehensive and in-depth.
Reviewer #2 (Recommendations for the authors):
This is an important study in which Zhang, Wang, and colleagues collect PM2.5 samples from city air and use these to establish a mouse model of air pollutant exposure and its effects on pregnancy. Using a wide breadth of techniques, the authors use this model to show that PM2.5 induces a KLF9/CYP1A1 signaling axis that leads to placental dysfunction, oxidative stress, mitochondrial dysfunction, and poor gestational outcomes.
In the first draft of this paper, I had four concerns. The first involved the dosages of the particulate matter administered in mouse and cell models, as these seemingly were too high to model physiologically relevant doses. The authors have provided further context into their rationale in choosing the doses and administration time frames, which I believe are necessary for the general and broad audience of eLife's readership. My second concern was the lack of depth in the original metformin analysis, which the authors have removed. My third concern involved the lack of quantitative representation of select figures, including MitoSOX microscopy (Figures 5G, 7I, 10G) and the JC-1 microscopy (Figures 5H, 7J, 10F). These analyses have been added. Finally, I suggested that the paper could be shortened, which the authors addressed through elimination of their discussion of the metformin data. Overall, the authors have addressed my concerns in this revision.
Thank you very much for your recognition on our study and our revison of first draft. We would like to express our gratitude for your valuable suggestions on our study. Your suggestions and advice for our manuscript are very important and the revised manuscript has become more comprehensive and in-depth. Thank you again for your altruistic help!
https://doi.org/10.7554/eLife.85944.sa2Article and author information
Author details
Funding
The National Natural Science Foundation of China (82301903)
- Meihua Zhang
Maternal and Child Health Care Hospital of Shandong Province (High-level talent incubation program (2022RS07))
- Meihua Zhang
Maternal and Child Health Care Hospital of Shandong Province (YJKY2022-024)
- Shuxian Li
The funders had no role in study design, data collection and interpretation, or the decision to submit the work for publication.
Acknowledgements
The authors are grateful to members at Jinan Environmental Monitoring Center of Shandong Province for their help in providing PM2.5 samples. This work was supported by the foundation of National Natural Science Foundation of China (82301903), the foundation of the Maternal and Child Health Care Hospital of Shandong Province High-level talent incubation program (2022RS07) and the scientific research foundation of the Maternal and Child Health Care Hospital of Shandong Province (YJKY2022-024).
Ethics
Human subjects: The qualification and experience of researcher meet the test requirements; the research project is accordance with the scientific and ethical principles; the method of obtaining informed consent is right. The study was approved by the Research Ethics Committee approval of Maternal and Child Health Care Hospital of Shandong Province Approval Number: 2020-115.
The experimental design is in accordance with the principles of animal protection, experimental animal welfare ethics and other ethical requirements, Applicants are committed to abide by the relevant experimental animal ethics, and accept the supervision and inspection of the Committee at any time. Experiment related personnel qualification and experiment related units are appropriate. Varieties, quality grade and specifications of animals used in experiments are appropriate. Research Ethics Committee approval of Maternal and Child Health Care Hospital of Shandong Province Approval Number: 2021-116.
Senior Editor
- Diane M Harper, University of Michigan, United States
Reviewing Editor
- Marisa Nicolás, Laboratório Nacional de Computação Científica, Brazil
Version history
- Received: January 4, 2023
- Accepted: September 21, 2023
- Accepted Manuscript published: September 22, 2023 (version 1)
- Version of Record published: October 18, 2023 (version 2)
Copyright
© 2023, Li, Li et al.
This article is distributed under the terms of the Creative Commons Attribution License, which permits unrestricted use and redistribution provided that the original author and source are credited.
Metrics
-
- 318
- Page views
-
- 64
- Downloads
-
- 0
- Citations
Article citation count generated by polling the highest count across the following sources: Crossref, PubMed Central, Scopus.
Download links
Downloads (link to download the article as PDF)
Open citations (links to open the citations from this article in various online reference manager services)
Cite this article (links to download the citations from this article in formats compatible with various reference manager tools)
Further reading
-
- Cell Biology
- Developmental Biology
Cylicins are testis-specific proteins, which are exclusively expressed during spermiogenesis. In mice and humans, two Cylicins, the gonosomal X-linked Cylicin 1 (Cylc1/CYLC1) and the autosomal Cylicin 2 (Cylc2/CYLC2) genes, have been identified. Cylicins are cytoskeletal proteins with an overall positive charge due to lysine-rich repeats. While Cylicins have been localized in the acrosomal region of round spermatids, they resemble a major component of the calyx within the perinuclear theca at the posterior part of mature sperm nuclei. However, the role of Cylicins during spermiogenesis has not yet been investigated. Here, we applied CRISPR/Cas9-mediated gene editing in zygotes to establish Cylc1- and Cylc2-deficient mouse lines as a model to study the function of these proteins. Cylc1 deficiency resulted in male subfertility, whereas Cylc2-/-, Cylc1-/yCylc2+/-, and Cylc1-/yCylc2-/- males were infertile. Phenotypical characterization revealed that loss of Cylicins prevents proper calyx assembly during spermiogenesis. This results in decreased epididymal sperm counts, impaired shedding of excess cytoplasm, and severe structural malformations, ultimately resulting in impaired sperm motility. Furthermore, exome sequencing identified an infertile man with a hemizygous variant in CYLC1 and a heterozygous variant in CYLC2, displaying morphological abnormalities of the sperm including the absence of the acrosome. Thus, our study highlights the relevance and importance of Cylicins for spermiogenic remodeling and male fertility in human and mouse, and provides the basis for further studies on unraveling the complex molecular interactions between perinuclear theca proteins required during spermiogenesis.
-
- Cell Biology
- Structural Biology and Molecular Biophysics
Previously we showed that 2D template matching (2DTM) can be used to localize macromolecular complexes in images recorded by cryogenic electron microscopy (cryo-EM) with high precision, even in the presence of noise and cellular background (Lucas et al., 2021; Lucas et al., 2022). Here, we show that once localized, these particles may be averaged together to generate high-resolution 3D reconstructions. However, regions included in the template may suffer from template bias, leading to inflated resolution estimates and making the interpretation of high-resolution features unreliable. We evaluate conditions that minimize template bias while retaining the benefits of high-precision localization, and we show that molecular features not present in the template can be reconstructed at high resolution from targets found by 2DTM, extending prior work at low-resolution. Moreover, we present a quantitative metric for template bias to aid the interpretation of 3D reconstructions calculated with particles localized using high-resolution templates and fine angular sampling.