Ketamine’s rapid antidepressant effects are mediated by Ca2+-permeable AMPA receptors
- Molecular, Cellular and Integrative Neurosciences Program, Colorado State University, United States
- Department of Biomedical Sciences, Colorado State University,, United States
- Department of Cell Biology, New York University Grossman School of Medicine, United States
Figures
Figure 1
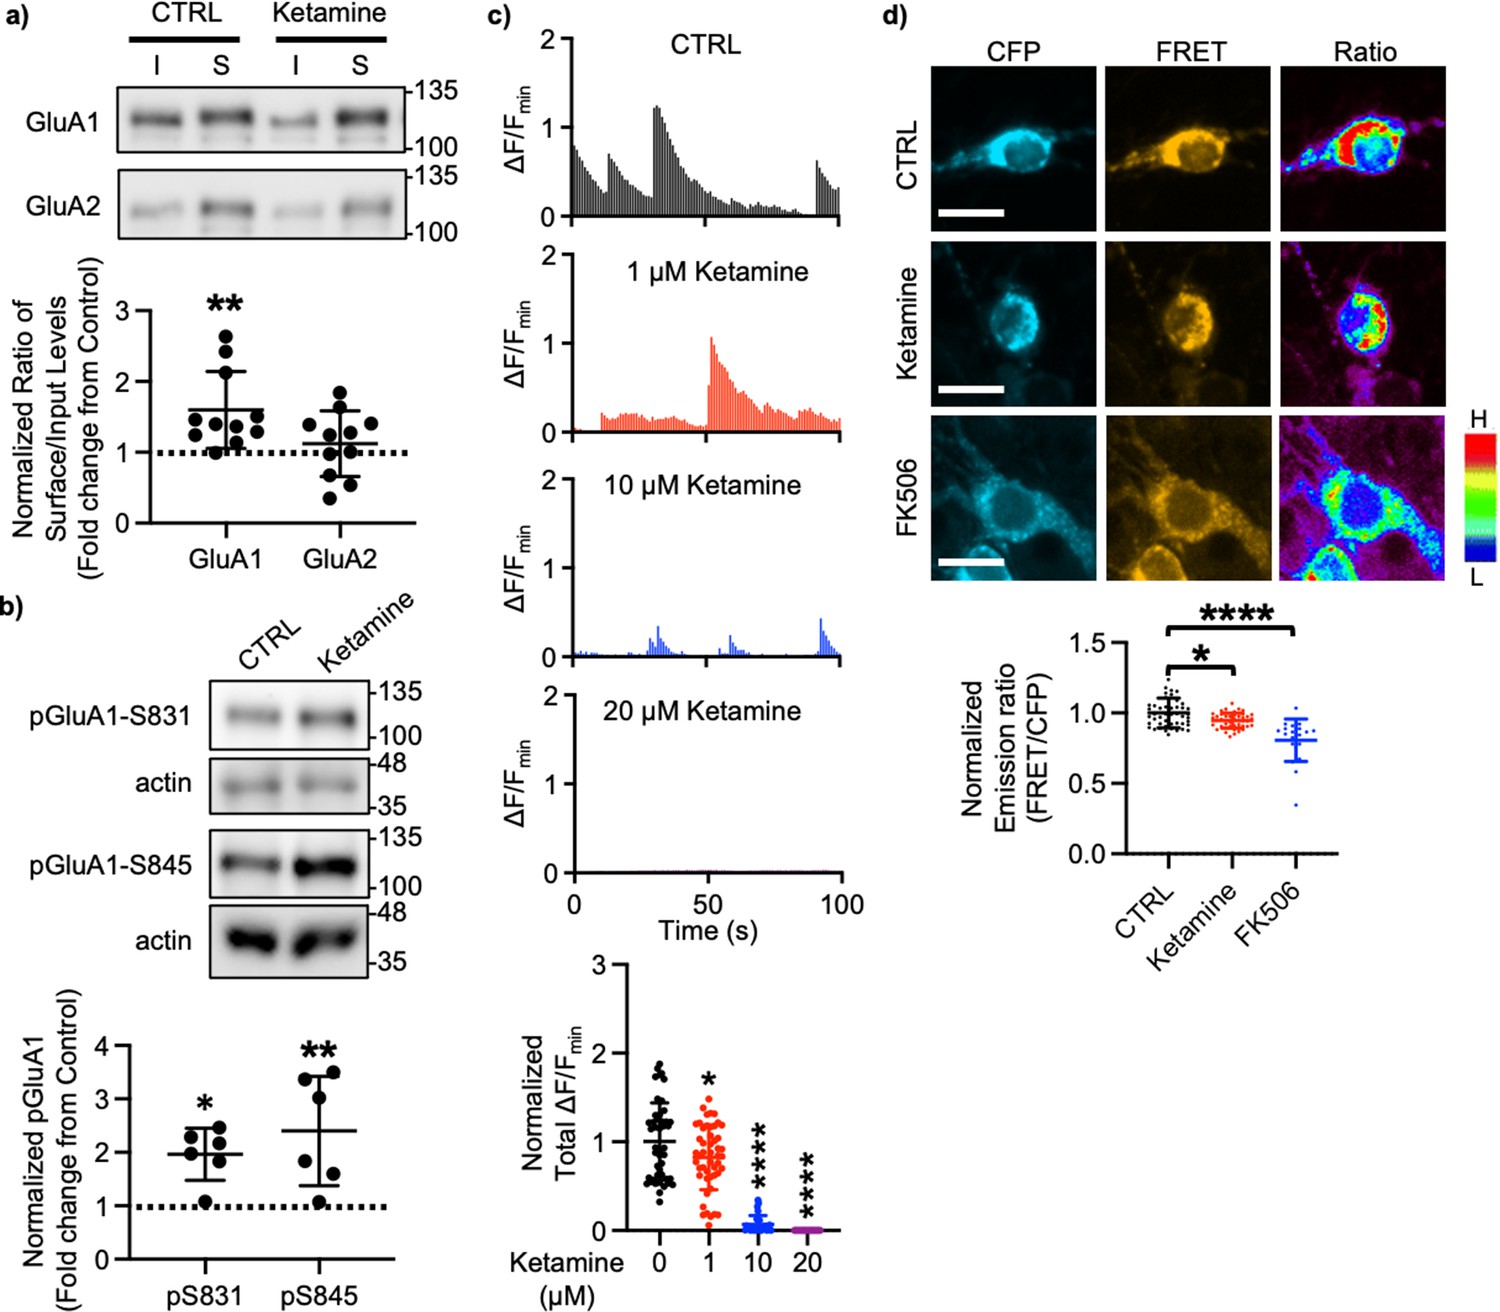
Ketamine treatment selectively increases GluA1-containing AMPAR surface expression by decreasing calcineurin activity in cultured mouse hippocampal neurons.
(a) Representative immunoblots of input (I) and surface (S) levels in control (CTRL) and ketamine-treated neurons. Summary bar graphs of normalized surface GluA1 and GluA2 levels in each condition (n=11 immunoblots from 4 independent cultures, **p<0.01, the Kruskal-Wallis test with the Dunn’s test). (b) Representative immunoblots of pGluA1 levels in control (CTRL) and ketamine-treated neurons. Summary graphs of normalized GluA1 phosphorylation levels in each condition (n=6 immunoblots from three independent cultures, *p<0.05 and **p<0.01, the Kruskal-Wallis test with the Dunn’s test). (c) Representative traces of GCaMP7s signals in excitatory cells and summary data of normalized total Ca2+ activity in each condition (n=number of neurons from two independent cultures, CTRL = 46, 1 μM Ketamine = 49, 10 μM Ketamine = 27, and 20 μM Ketamine = 26, *p<0.05 and ****p<0.0001, One-way ANOVA with the Tukey test). (d) Representative images of a CFP channel, a FRET channel, and a pseudocolored emission ratio (Y/C) in each condition [blue (L), low emission ratio; red (H), high emission ratio]. Scale bar is 10 µm. A summary graph showing average of emission ratio (Y/C) in each condition (n= number of cells, CTRL = 47, ketamine = 44, and FK506=20 from two independent cultures; *p<0.05 and ****p<0.0001; One-way ANOVA with the Tukey test). A scale bar indicates 10 μm. The position of molecular mass markers (kDa) is shown on the right of the blots. Mean ± SD.
-
Figure 1—source data 1
A compressed file containing images of (1) figures with the uncropped blots with the relevant bands labeled, (2) the original files of the full raw unedited blots, and (3) excel tables with the numerical data used to generate the Figure 1a and b.
- https://cdn.elifesciences.org/articles/86022/elife-86022-fig1-data1-v2.zip
Figure 2
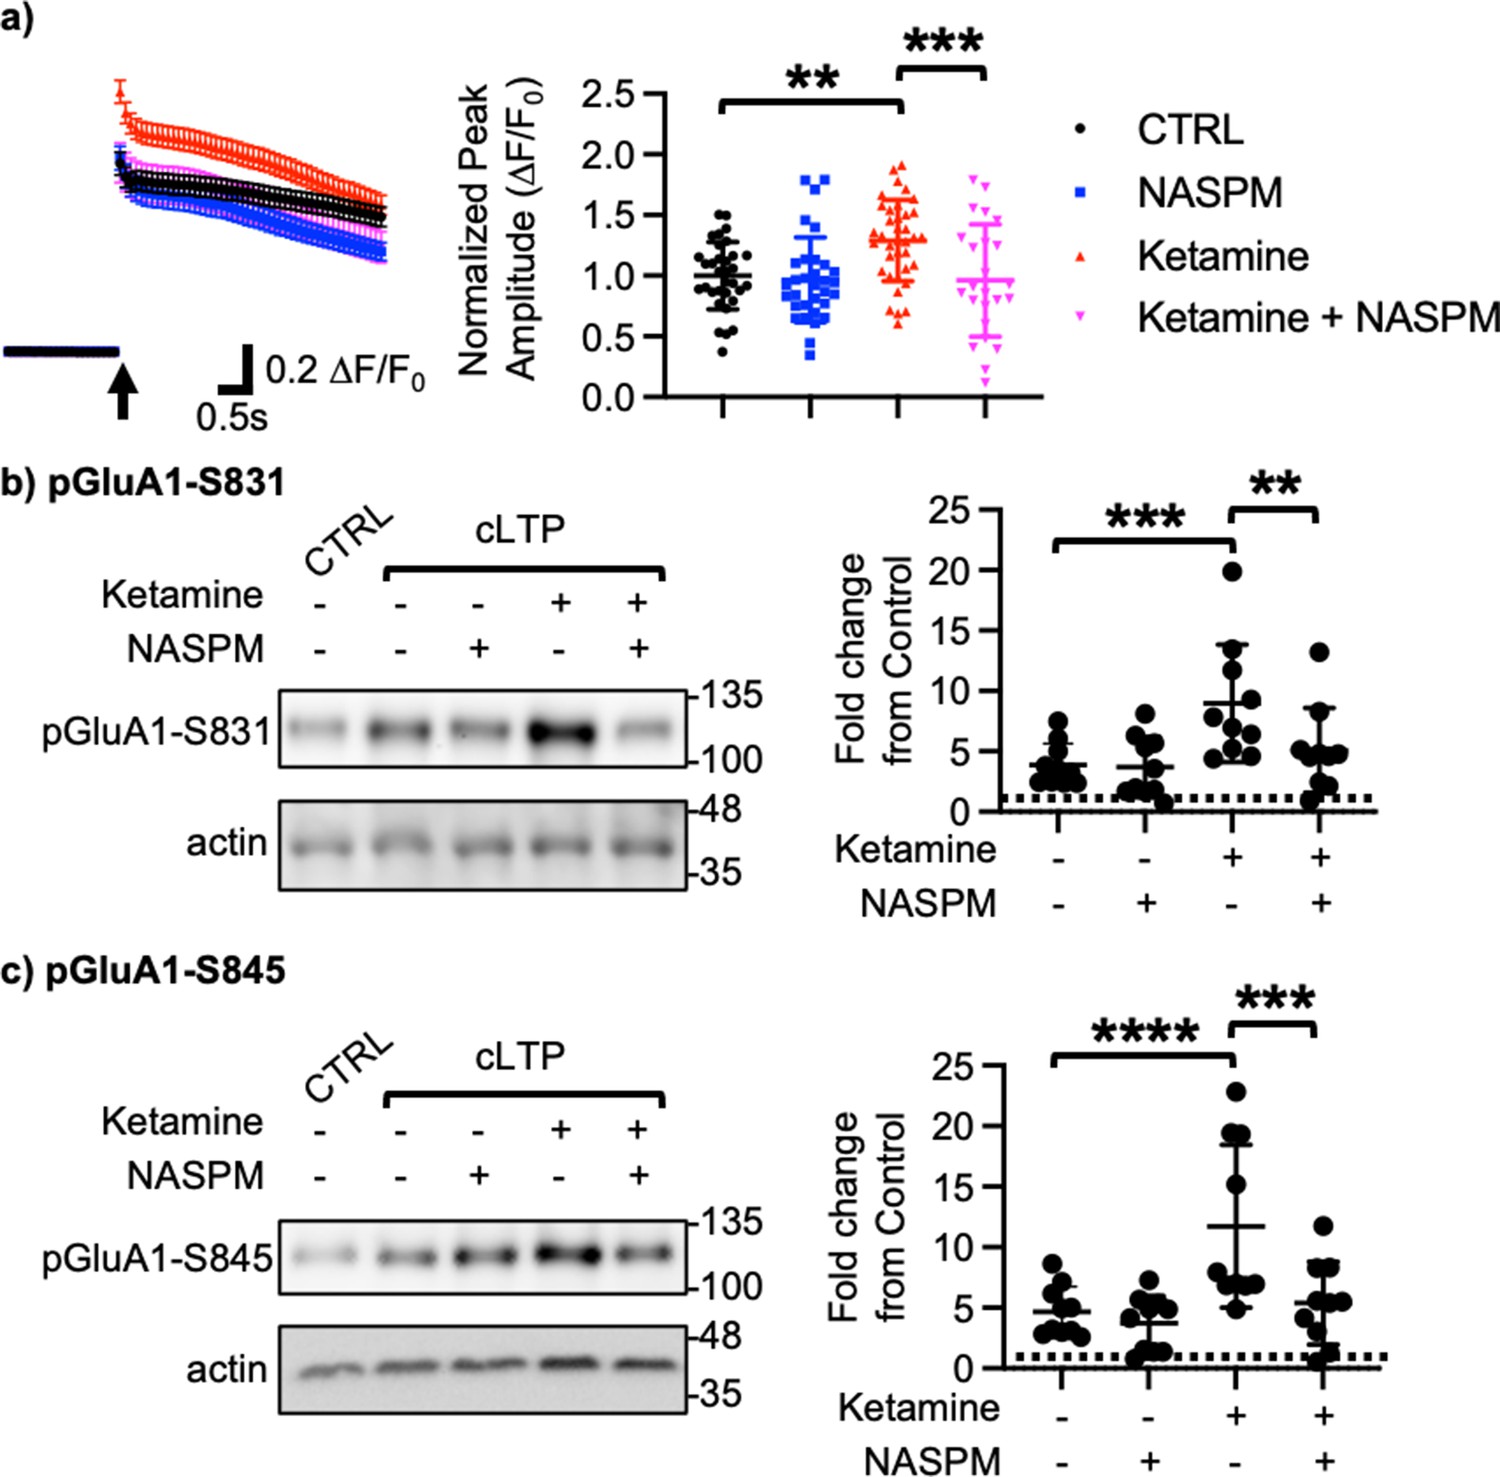
Ketamine treatment induces CP-AMPAR expression to enhance glutamatergic activity and glutamate receptor plasticity in cultured mouse hippocampal neurons.
(a) Average traces of virally expressed GCaMP7s signals, and summary data of normalized peak amplitude in each condition (n=number of neurons, CTRL = 33, NASPM = 32, Ketamine = 37, and Ketamine +NASPM = 24 from two independent cultures; **p<0.01 and ***p<0.001; Two-way ANOVA with the Tukey test). An arrow indicates photostimulation. Representative immunoblots and quantitative analysis of (b) pGluA1-S831 and (c) pGluA1-S845 levels in each condition (n=10 immunoblots from five independent cultures, **p<0.01, ***p<0.001, and ****p<0.0001, the Kruskal-Wallis test with the Dunn’s test). The position of molecular mass markers (kDa) is shown on the right of the blots. Mean ± SD.
-
Figure 2—source data 1
A compressed file containing images of (1) figures with the uncropped blots with the relevant bands labeled, (2) the original files of the full raw unedited blots, and (3) excel tables with the numerical data used to generate the Figure 2b and c.
- https://cdn.elifesciences.org/articles/86022/elife-86022-fig2-data1-v2.zip
Figure 3
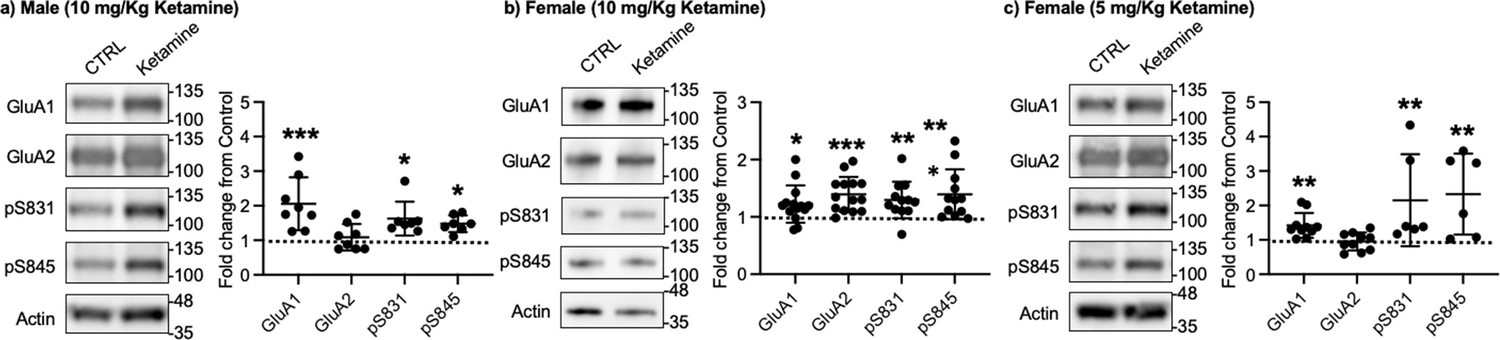
Synaptic GluA1 levels are selectively increased in the hippocampus following ketamine treatment.
Representative immunoblots of AMPAR levels in the hippocampus of control (CTRL) and ketamine-treated (a) male (10 mg/Kg ketamine), (b) female (10 mg/kg ketamine), and (c) female (5 mg/Kg ketamine) mice. Summary graphs of normalized GluA1, GluA2, and GluA1 phosphorylation levels in each condition (n=number of immunoblots from 4 male and 3 female mice in each condition; Male (10 mg/Kg ketamine), CTRL = 8, GluA1=8, GluA2=8, pS831=7, and pS845=7, Females (10 mg/kg ketamine), CTRL = 14, GluA1=14, GluA2=14, pS831=12, and pS845=12, and Female (5 mg/Kg ketamine), CTRL = 10, GluA1=10, GluA2=10, pS831=6, and pS845=6, *p<0.05, **p<0.01, and ***p<0.001; the Kruskal-Wallis test with the Dunn’s test). The position of molecular mass markers (kDa) is shown on the right of the blots. Mean ± SD.
-
Figure 3—source data 1
A compressed file containing images of (1) figures with the uncropped blots with the relevant bands labeled, (2) the original files of the full raw unedited blots, and (3) excel tables with the numerical data used to generate the Figure 3a, b and c.
- https://cdn.elifesciences.org/articles/86022/elife-86022-fig3-data1-v2.zip
Figure 4
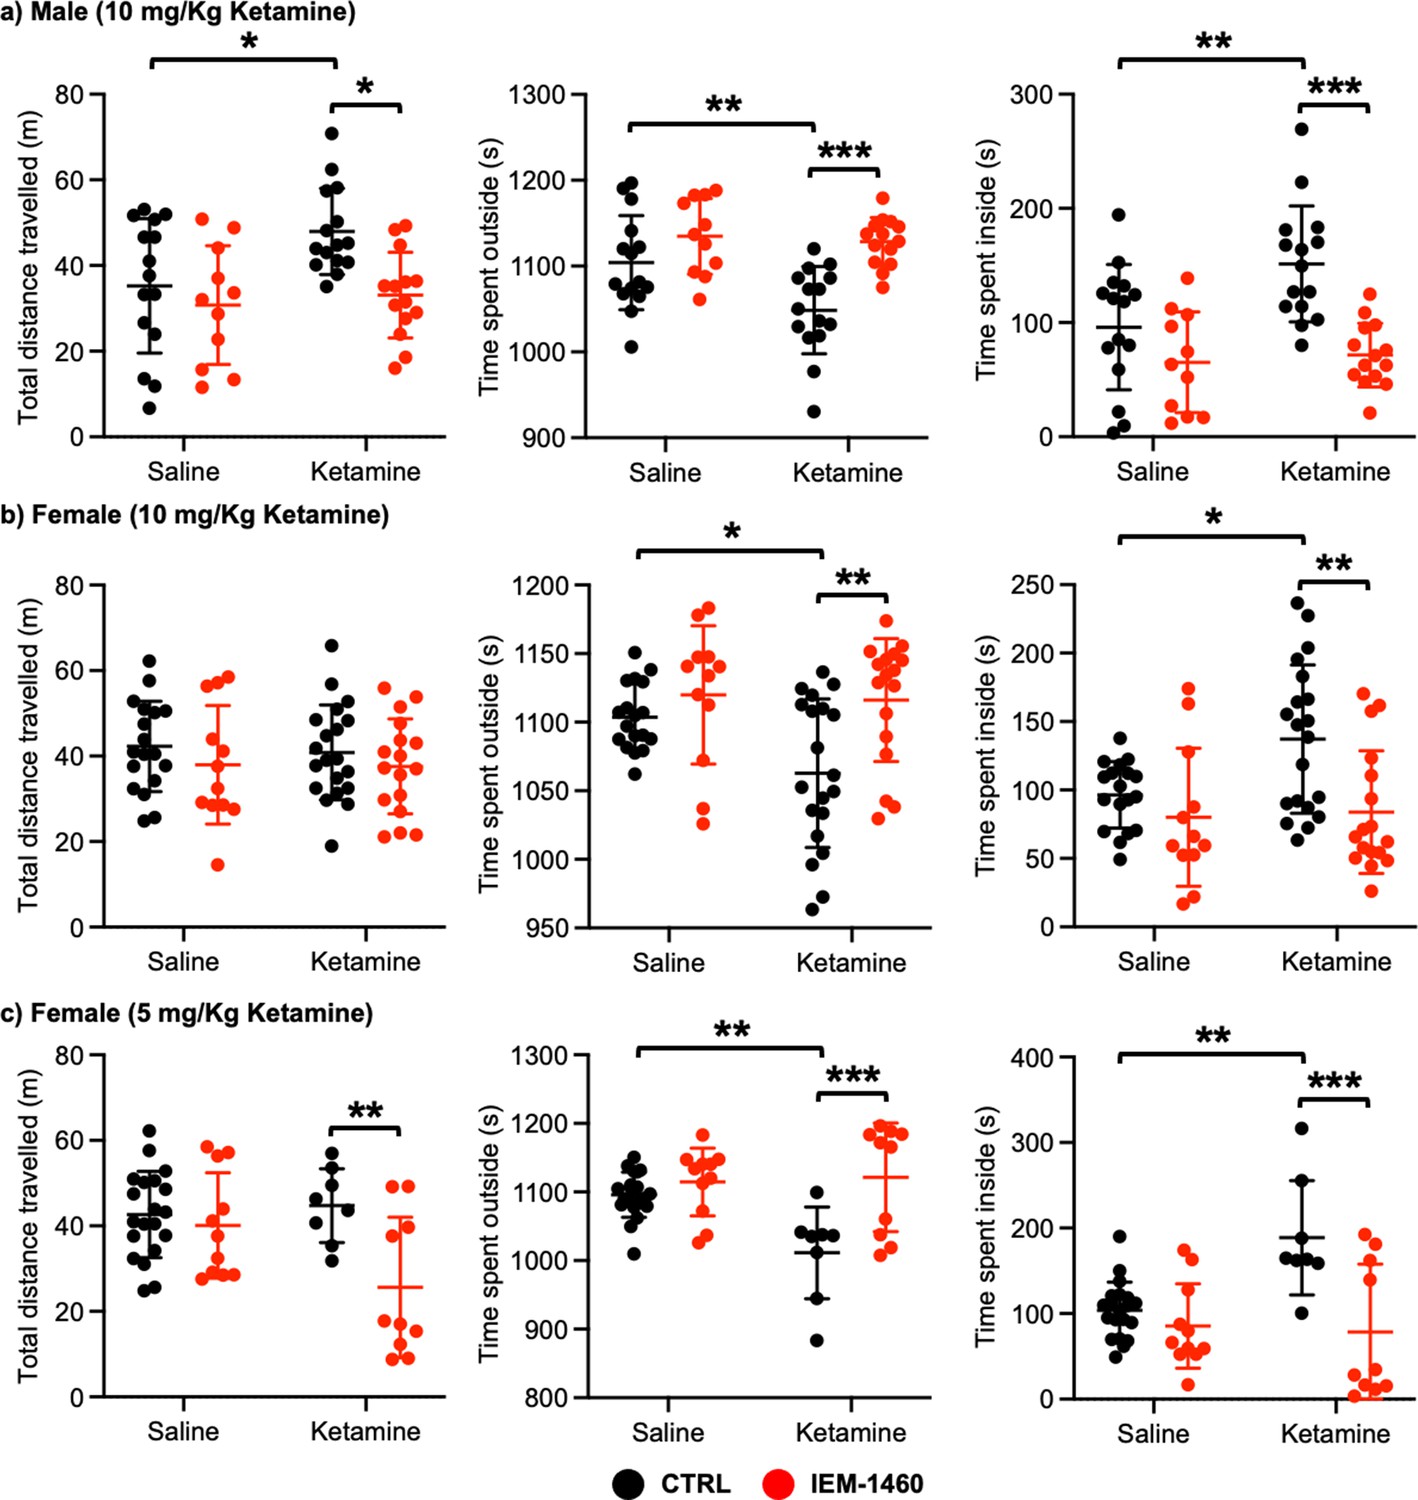
Ketamine treatment significantly reduces anxiety-like behavior in mice, which requires CP-AMPARs.
The results of the open-field test measuring total distance travelled and time spent outside and inside in (a) male (10 mg/Kg ketamine), (b) females (10 mg/kg ketamine), and (c) females (5 mg/Kg ketamine) mice in each condition (n=number of mice, Male (10 mg/Kg ketamine); saline = 15, IEM 1460=11, Ketamine = 15, and Ketamine +IEM 1460=14, Female (10 mg/kg ketamine); saline = 18, IEM 1460=12, Ketamine = 20, and Ketamine +IEM 1460=17, and Female (5 mg/kg ketamine); saline = 20, IEM 1460=11, Ketamine = 8, and Ketamine +IEM 1460=10, *p<0.05, **p<0.01, and ***p<0.001, Two-way ANOVA with the Tukey test). Mean ± SD.
-
Figure 4—source data 1
A source data containing excel tables with the numerical data used to generate the Figure 4a, b and c.
- https://cdn.elifesciences.org/articles/86022/elife-86022-fig4-data1-v2.xlsx
Figure 5
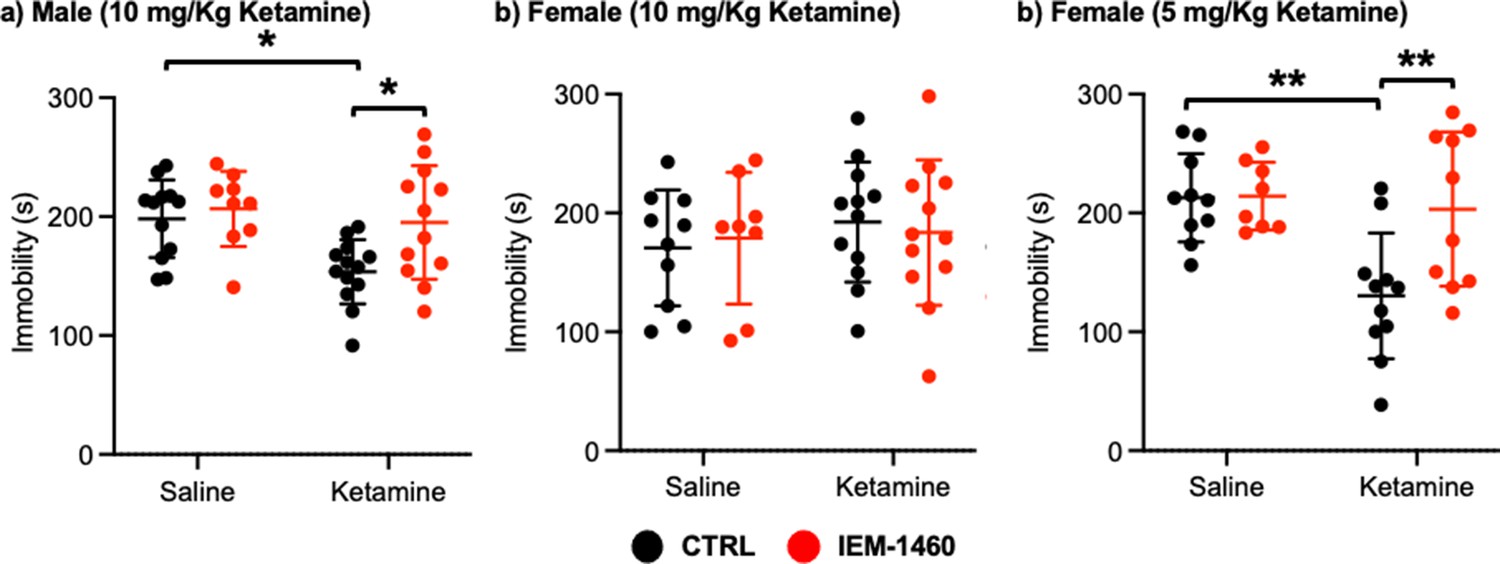
Ketamine treatment significantly reduces depression-like behavior in mice, which requires CP-AMPARs.
The results of the tail suspension test measuring total immobility in (a) male (10 mg/Kg ketamine), (b) female (10 mg/kg ketamine), and (c) female (5 mg/Kg ketamine) mice in each condition (n=number of mice, Male (10 mg/Kg ketamine); saline = 12, IEM 1460=9, Ketamine = 13, and Ketamine +IEM 1460=12, Female (10 mg/kg ketamine); saline = 10, IEM 1460=8, Ketamine = 12, and Ketamine +IEM 1460=12, and Female (5 mg/Kg ketamine); saline = 10, IEM 1460=8, Ketamine = 11, and Ketamine +IEM 1460=10, *p<0.05 and **p<0.01, Two-way ANOVA with the Tukey test). Mean ± SD.
-
Figure 5—source data 1
A source data containing excel tables with the numerical data used to generate the Figure 5a, b and c.
- https://cdn.elifesciences.org/articles/86022/elife-86022-fig5-data1-v2.xlsx
Figure 6
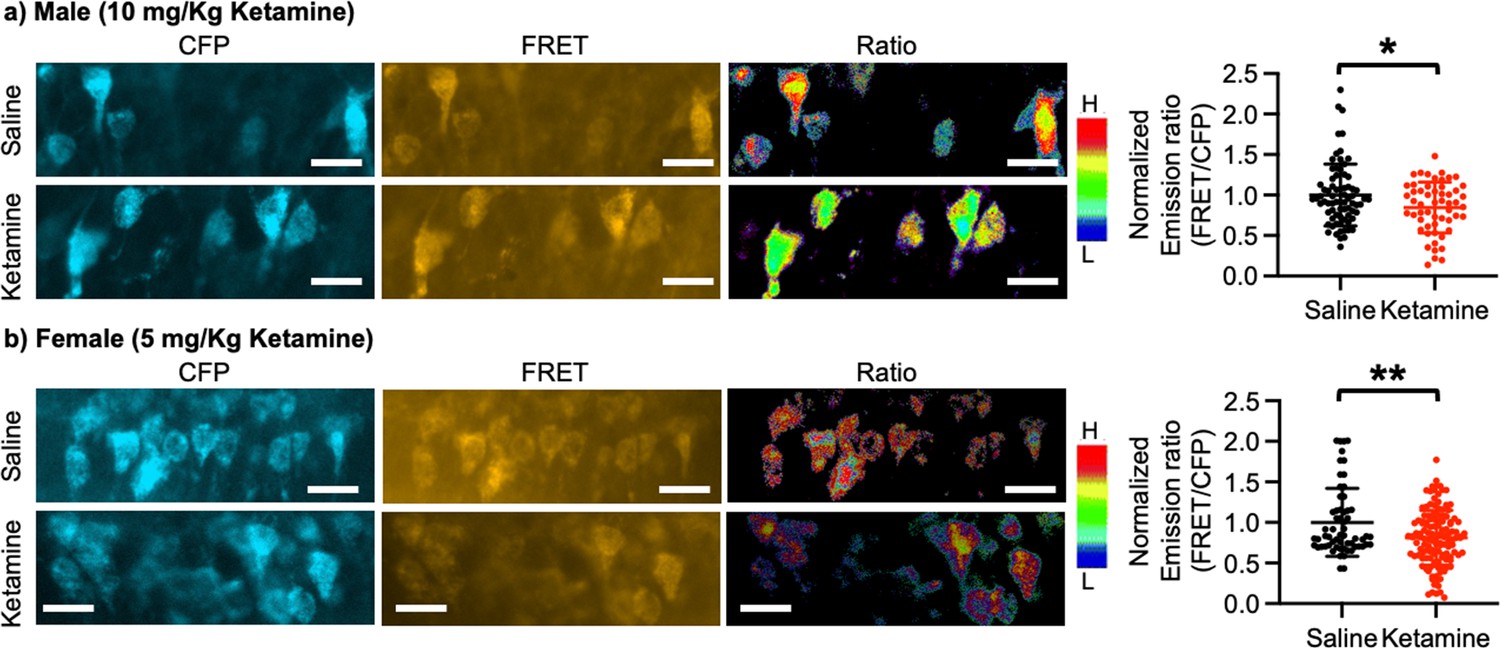
Ketamine treatment significantly reduces calcineurin activity in the hippocampus.
Representative images of a CFP channel, a FRET channel, and a pseudocolored emission ratio (Y/C) in the (a) male and (b) female hippocampus in each condition [blue (L), low emission ratio; red (H), high emission ratio]. Scale bar is 10 µm. A summary graph showing average of emission ratio (FRET/CFP) in each condition n=number of cells [number of animals], Male; saline = 74 (Ali et al., 2020) and ketamine = 55 (Akillioglu et al., 2012), Female; saline = 61 (Ali et al., 2020) and ketamine = 130 (Akillioglu and Karadepe, 2021), *p<0.05 and **p<0.01, unpaired two-tailed student t-test. A scale bar indicates 25 μm. Mean ± SD.
-
Figure 6—source data 1
A source data containing excel tables with the numerical data used to generate the Figure 6a and b.
- https://cdn.elifesciences.org/articles/86022/elife-86022-fig6-data1-v2.xlsx
Figure 7

A schematic model of ketamine’s antidepressant effects.
(a) Under the basal conditions, stimulation of excitatory synapses results in Ca2+ influx through glutamatergic NMDA receptors (NMDARs), which initiates intracellular pathways for neural plasticity. NMDAR-mediated Ca2+ can activate calcineurin (CaN), a Ca2+-dependent phosphatase that dephosphorylates the AMPA receptor (AMPAR) subunit GluA1, leading to AMPAR endocytosis. Several kinases, including PKA, cGKII, PKC, and CaMKII, on the other hand, can phosphorylate GluA1 to promote AMPAR surface expression. As a result, AMPAR trafficking and synaptic activity are controlled by the balance of kinases and phosphatases. (b) Because ketamine is a noncompetitive NMDAR antagonist, a therapeutic dose is enough to block NMDAR-mediated Ca2+ influx in excitatory synapses. This can lower CaN activation and promote GluA1 phosphorylation, resulting in increased synaptic expression of GluA2-lacking, GluA1-containing Ca2+-permeable AMPARs (CP-AMPARs). When ketamine is administered, CP-AMPAR-mediated Ca2+ influx may replace NMDA-dependent Ca2+ signaling. This increases neural plasticity, which leads to antidepressant benefits from ketamine.
Tables
Key resources table
| Reagent type (species) or resource | Designation | Source or reference | Identifiers | Additional information |
|---|---|---|---|---|
| Strain, strain background (musculus males and females) | CD1(ICR) | Charles River Laboratories | Stock No: 022 | |
| Transfected construct (The Escherichia coli bacteriophage P1) | pENN.AAV.CamKII 0.4.Cre.SV40 | Addgene | Addgene plasmid # 105558-AAV1; RRID:Addgene_105558 | |
| Transfected construct (R. norvegicus (rat), G. gallus (chicken); A. victoria (jellyfish)) | pGP-AAV-CAG-FLEX-jGCaMP7s-WPRE | Addgene | Addgene plasmid # 104495-AAV1; RRID:Addgene_104495 | |
| Transfected construct (H. sapiens (human), Synthetic) | pSinRep5-pcDNA3-CaNAR | This paper | Mehta and Zhang, 2014 | Sindbis construct to infect and express calcineurin activity biosensor |
| Antibody | Anti-GluR1-NT (NT) antibody, clone RH95 (Mouse monoclonal) | Millipore | Cat. # MAB2263 | WB (1:2000) |
| Antibody | Anti-GluA2 antibody [EPR18115] (Rabbit monoclonal) | Abcam | Cat. # ab206293 | WB (1:2000) |
| Antibody | Anti-phospho-GluR1 (Ser831) antibody, clone N453 (Rabbit polyclonal) | Millipore | Cat. # 04–823 | WB (1:1000) |
| Antibody | Anti-GluR1 Antibody, phosphoSer 845 (Rabbit polyclonal) | Millipore | Cat. # AB5849 | WB (1:1000) |
| Antibody | Anti-Actin antibody [ACTN05 (C4)] (Mouse monoclonal) | Abcam | Cat. # ab3280 | WB (1:2000) |
| Commercial kit | Sindbis Expression System | Invitrogen | Cat. #: K750-01 | |
| Commercial kit | Enhanced Chemiluminescence (ECL) | Thermo Fisher Scientific | Cat. #: PI34580 | |
| Chemical compound, drug | PDS Kit, Papain Vial | Worthington Biochemical Corp. | Cat. #: LK003176 | ≥100 units per vial |
| Chemical compound, media | Neurobasal Medium without phenol red | Thermo Fisher Scientific | Cat. #: 12348017 | |
| Chemical compound, supplement | B27 | Thermo Fisher Scientific | Cat. #: 17504044 | |
| Chemical compound, drug | Glutamax | Thermo Fisher Scientific | Cat. #: 35050061 | |
| Chemical compound, antibiotics | Penicillin/Streptomycin | Thermo Fisher Scientific | Cat. #: 15070063 | |
| Chemical compound, drug | Ketamine hydrochloride | VetOne | Cat. #: 510189 | |
| Chemical compound, drug | Urethane | Sigma | Cat. #: U2500 | 1.2 g/kg |
| Chemical compound, drug | FK506 | Tocris Bioscience | Cat. #: 3631 | 5 μM |
| Chemical compound, drug | Tetrodotoxin (TTX) | Abcam | Cat. #: ab120055 | 2 μM |
| Chemical compound, drug | 4-methoxy-7-nitroindolinyl (MNI)-caged L-glutamate | Tocris Bioscience | Cat. #: 1490 | 1 mM |
| Chemical compound, drug | 1-Naphthyl acetyl spermine trihydrochloride (NASPM) | Tocris Bioscience | Cat. #: 2766 | 20 μM |
| Chemical compound, drug | IEM-1460 | Tocris Bioscience | Cat. #: 1636 | 10 mg/kg |
| Chemical compound, biotin | Sulfo-NHS-SS-biotin | Thermo Fisher Scientific | Cat. #: PI21331 | |
| Chemical compound, beads | Streptavidin-coated beads | Thermo Fisher Scientific | Cat. #: PI53150 | |
| Chemical compound, drug | Strychnine hydrochloride | Tocris Bioscience | Cat. #: 2785 | 1 μM |
| Chemical compound, drug | (-)-Bicuculline methochloride | Tocris Bioscience | Cat. #: 0131 | 20 μM |
| Software | ANY-maze tracking program | Stoelting Co. | https://www.any-maze.com | |
| Software | Prism 9 | GraphPad | https://www.graphpad.com/features | |
| Software | CellSens | Olympus | https://www.olympus-lifescience.com/en/software/cellsens/ |
Additional files
Download links
A two-part list of links to download the article, or parts of the article, in various formats.
Downloads (link to download the article as PDF)
Open citations (links to open the citations from this article in various online reference manager services)
Cite this article (links to download the citations from this article in formats compatible with various reference manager tools)
Ketamine’s rapid antidepressant effects are mediated by Ca2+-permeable AMPA receptors
eLife 12:e86022.
https://doi.org/10.7554/eLife.86022


