Digital wearable insole-based identification of knee arthropathies and gait signatures using machine learning
- Precision Medicine, Regeneron Pharmaceuticals Inc, United States
- Early Clinical Development & Experimental Sciences, Regeneron Pharmaceuticals Inc, United States
- Molecular Profiling & Data Science, Regeneron Pharmaceuticals Inc, United States
- Clinical Outcomes Assessment and Patient Innovation, Global Clinical Trial Services, Regeneron Pharmaceuticals Inc, United States
- Biostatistics and Data Management, Regeneron Pharmaceuticals Inc, United States
- General Medicine, Regeneron Pharmaceuticals Inc, United States
Figures
Figure 1
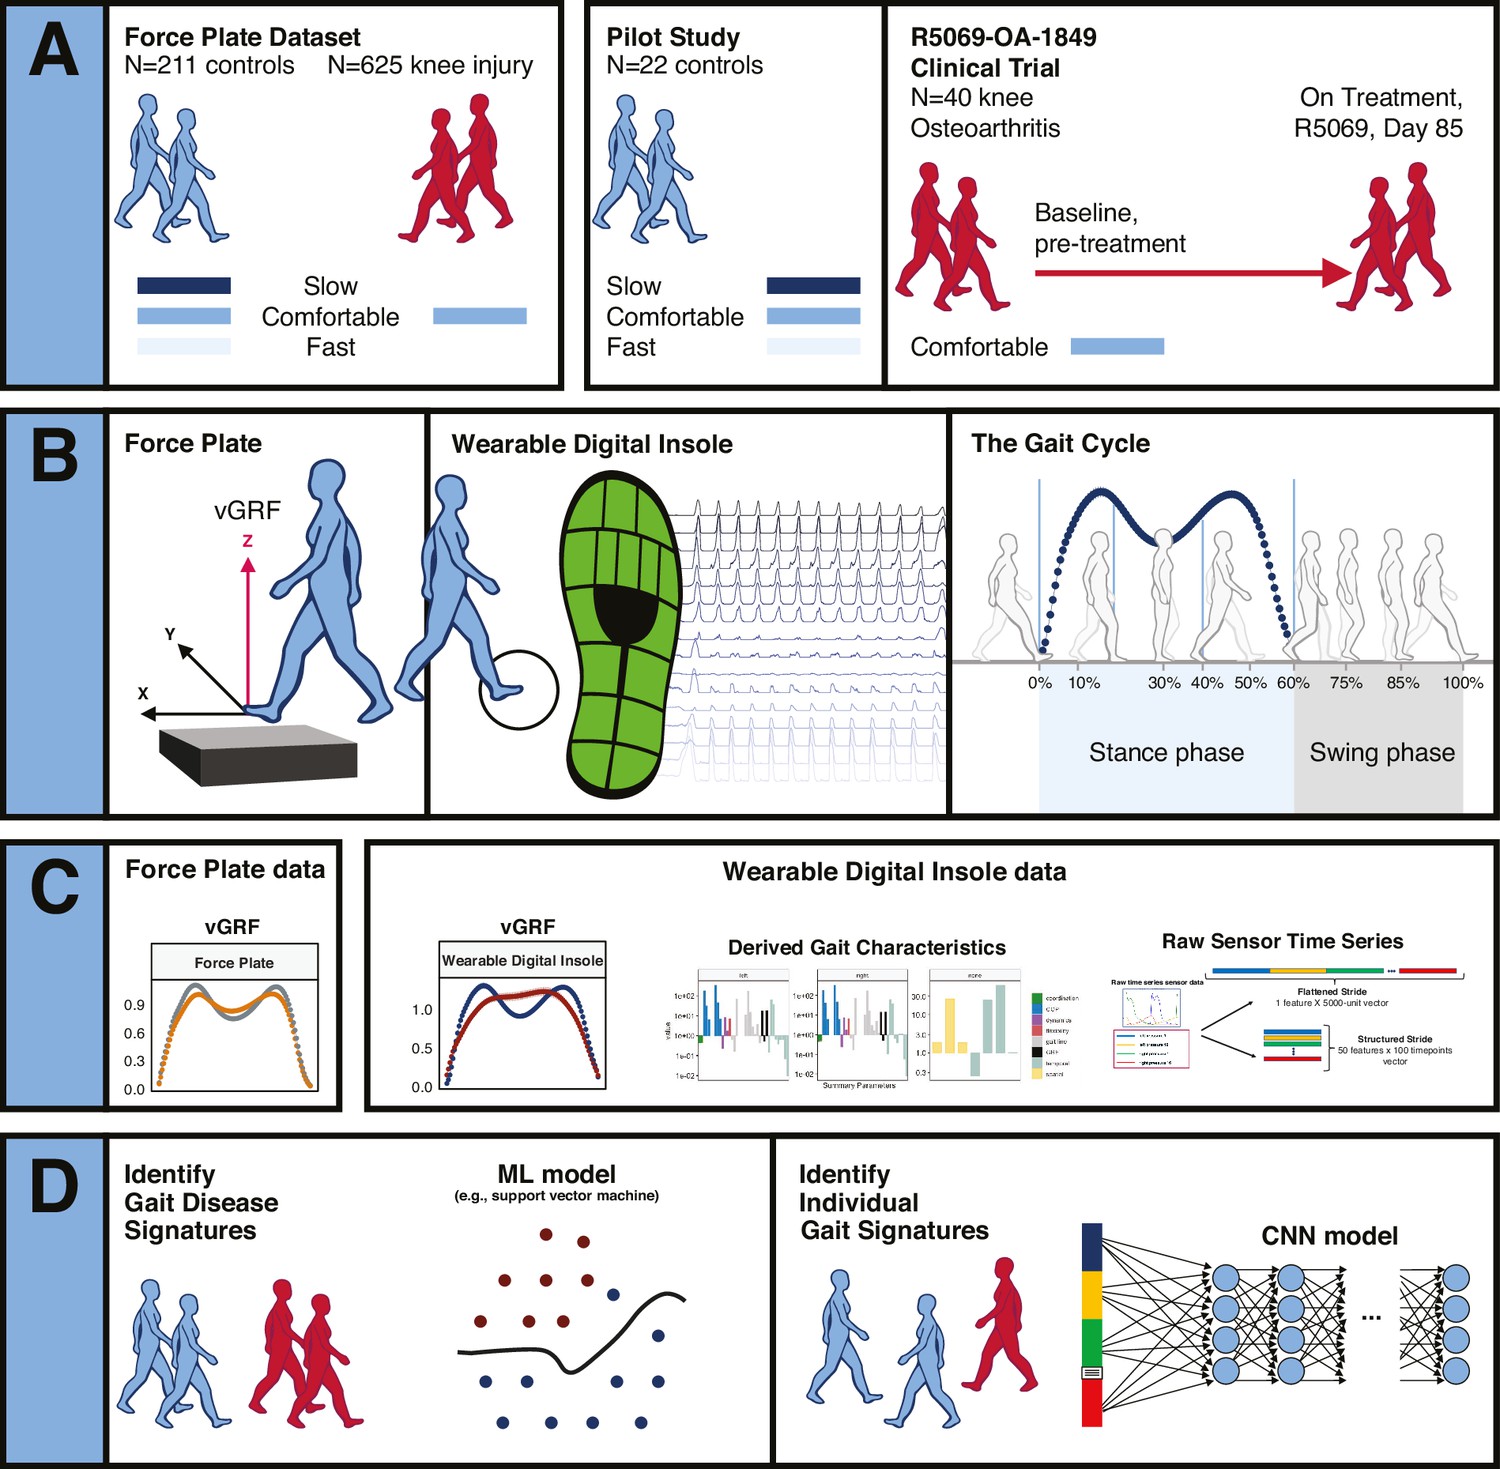
Overview of data sources and study participants, device types, data types, and clinical research questions.
(A) Three datasets were used for analyses. The GaitRec force plate dataset (force plate data) contains N = 211 controls, who walked at three different walking speeds (slow, comfortable, and fast), and N = 625 knee injury subjects, who walked at a comfortable walking speed (Horsak et al., 2020). The second dataset is from a digital insole pilot study, where N = 22 controls walked at three different walking speeds (slow, comfortable, and fast). The third dataset is from a digital insole sub-study from a longitudinal clinical trial in knee osteoarthritis (OA), where N = 40 knee OA subjects performed a 3 min walk test (3MWT) at a comfortable walking speed at baseline (pretreatment) and at day 85 (on treatment). (B) Both force plates and digital insoles produce data collected during stance and swing phases of a person’s gait cycle. (C) Types of data produced by these devices include vertical ground reaction force (vGRF), derived gait characteristics, and raw sensor time series. (D) Clinical research questions addressed in this work include the derivation of gait disease signatures of knee OA and investigation of the individuality and consistency of gait patterns. Two analytical methods were used to evaluate these data. Support vector machine (SVM) models were used to analyze vGRF, derived gait characteristics, and raw sensor time-series flattened stride data. A one-dimensional convolutional neural network (CNN) was used to analyze structured stride raw sensor time-series data.
Figure 2 with 4 supplements
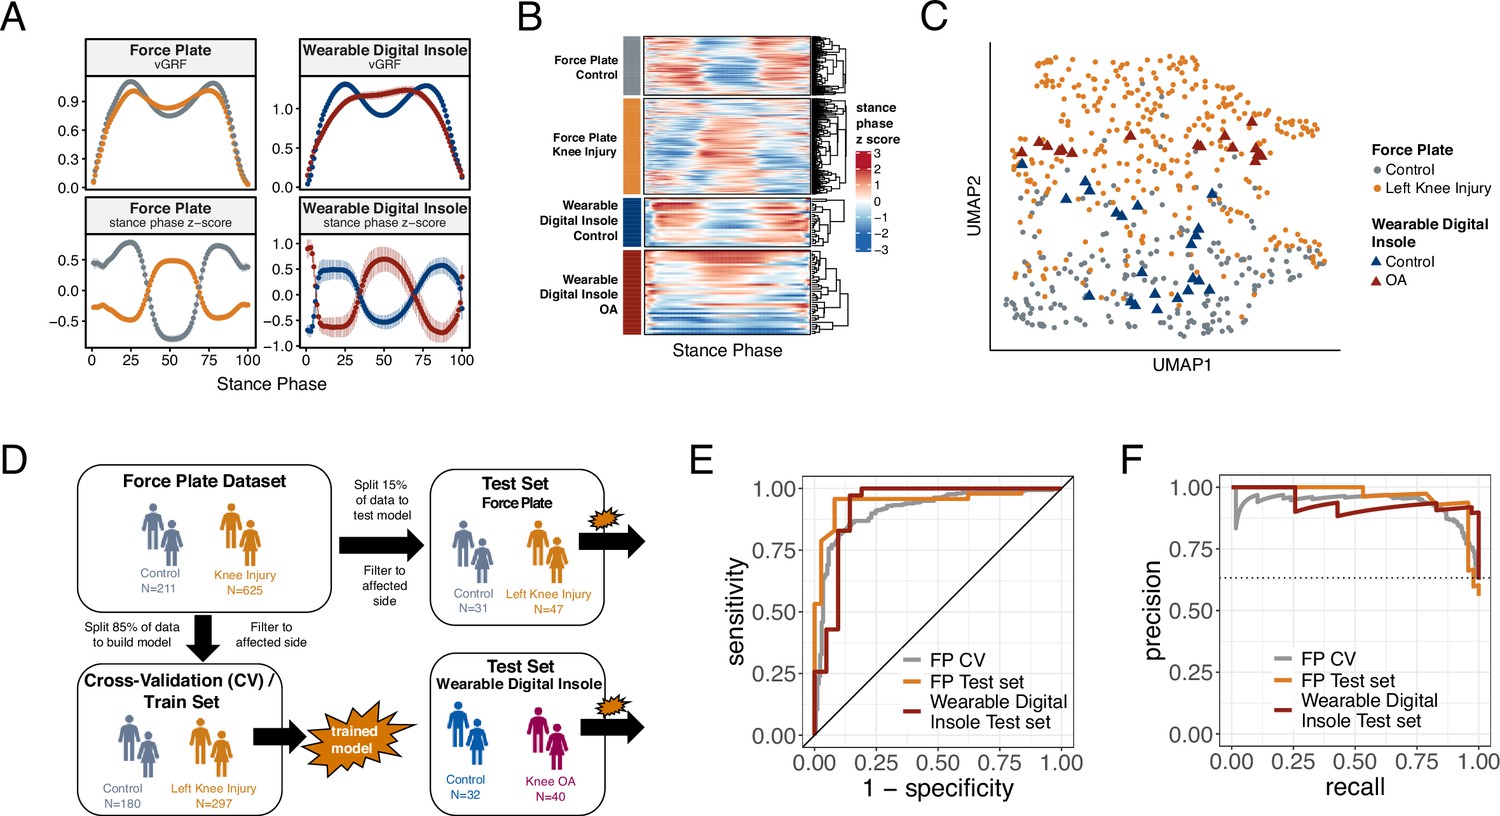
Machine learning (ML) model trained on knee injury subjects walking on force plates accurately classifies osteoarthritis (OA) patients wearing digital insoles.
(A) Vertical ground reaction force (vGRF) curves derived from force plate and digital insole data for controls, and knee injury and knee OA patients, respectively. Left foot data are shown as mean of values (top panels) and mean of normalized z-scores (bottom panels) at each percent stance phase within each device and health status. Groups are color-coded as in (B) and (C). (B) vGRF curves for an individual’s left foot shown as heatmap rows, after data was z-transformed at each percent stance phase (as in A). Rows are hierarchically clustered within each group of subjects. (C) Uniform Manifold Approximation and Projection (UMAP) dimensionality reduction of the z-transformed left foot vGRF data. Each point represents a subject, and points are colored by phenotype, and shaped by device. (D) Schematic of machine learning model building of training/validation and testing sets. Two support vector machine (SVM) models were created, one for left knee injury (depicted) and one for right knee injury. The full force plate vGRF dataset with both controls (comfortable walking speed) and left or right knee injury subjects (comfortable walking speed, excluding subjects with knee injury on both joints) were split 85% into training/validation datasets, and 15% into a hold-out testing set. One model predicts control versus knee injury subjects using left foot data (of left knee injury subjects and all controls), and the other predicts using right foot data (of right knee injury subjects and all controls). These models were then applied on a separate, independent testing set of digital insoles vGRF data with N = 22 control subjects and N = 38 patients with knee OA. (E) Receiver operating characteristic curve for SVM classification of force plate (85%) cross-validation (CV, training/validation) set, force plate (15%) hold-out test set, and the digital insole test set. (F) Precision-recall curve for SVM classification of the same groups in (E).
Figure 2—figure supplement 1

Heatmap representation of vertical ground reaction force (vGRF) data from GaitRec dataset for all joints with injuries and controls (Horsak et al., 2020).
Data are z-scored by each column (% stance phase) across all walks. Heatmaps are separate by injury class (control, knee, calcaneus, hip, and ankle), and vGRF from each walk are unsupervised clustered within each category. The right of the heatmap annotates the joint side with the arthropathy (left joint, right joint, both joints, or no injury in the control group).
Figure 2—figure supplement 2
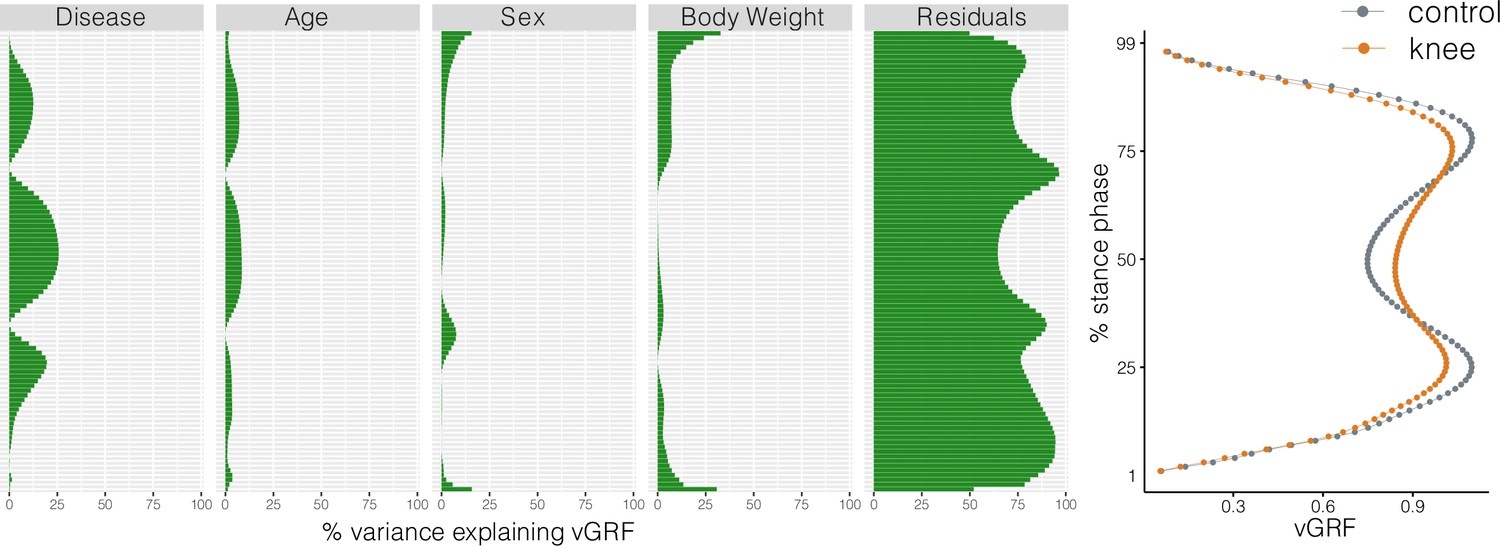
Variance explained in vertical ground reaction force (vGRF) with clinical and demographic characteristics of the participants.
Linear models were fit at each % stance phase (timepoint), excluding the edges of the curve which are bounded by 0 (and as such have no variance). We used disease (knee arthropathy or control), age, sex (male or female), and body weight as covariates in the model, with each subsequent vGRF % stance phase timepoint as the dependent variable. Within each linear model, using the sum of squares for each category compared to the total sum of squares, we calculated of the variance each component’s contribution to the total variance, with the residuals indicating the unexplained variance in these models. We observed that the disease state is the major contributor to vGRF for most of the curve, with age, sex, and body weight also explaining a smaller proportion of the variance.
Figure 2—figure supplement 3
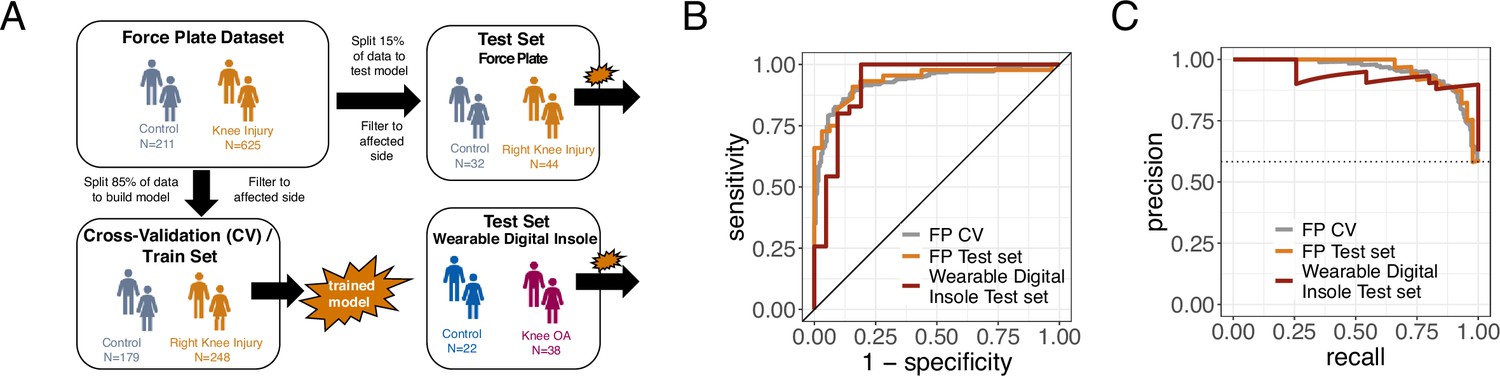
Model results from the right foot only data.
(A) Schematic of machine learning model building of training/validation and testing sets with the right foot data, as in Figure 2. (B) Receiver operating characteristic curve for support vector machine (SVM) classification of force plate (85%) cross-validation (CV, training/validation) set, force plate (15%) hold-out test set, and the digital insole test set for right foot data. (C) Precision-recall curve for SVM classification of the same groups in (B) for right foot data.
Figure 2—figure supplement 4
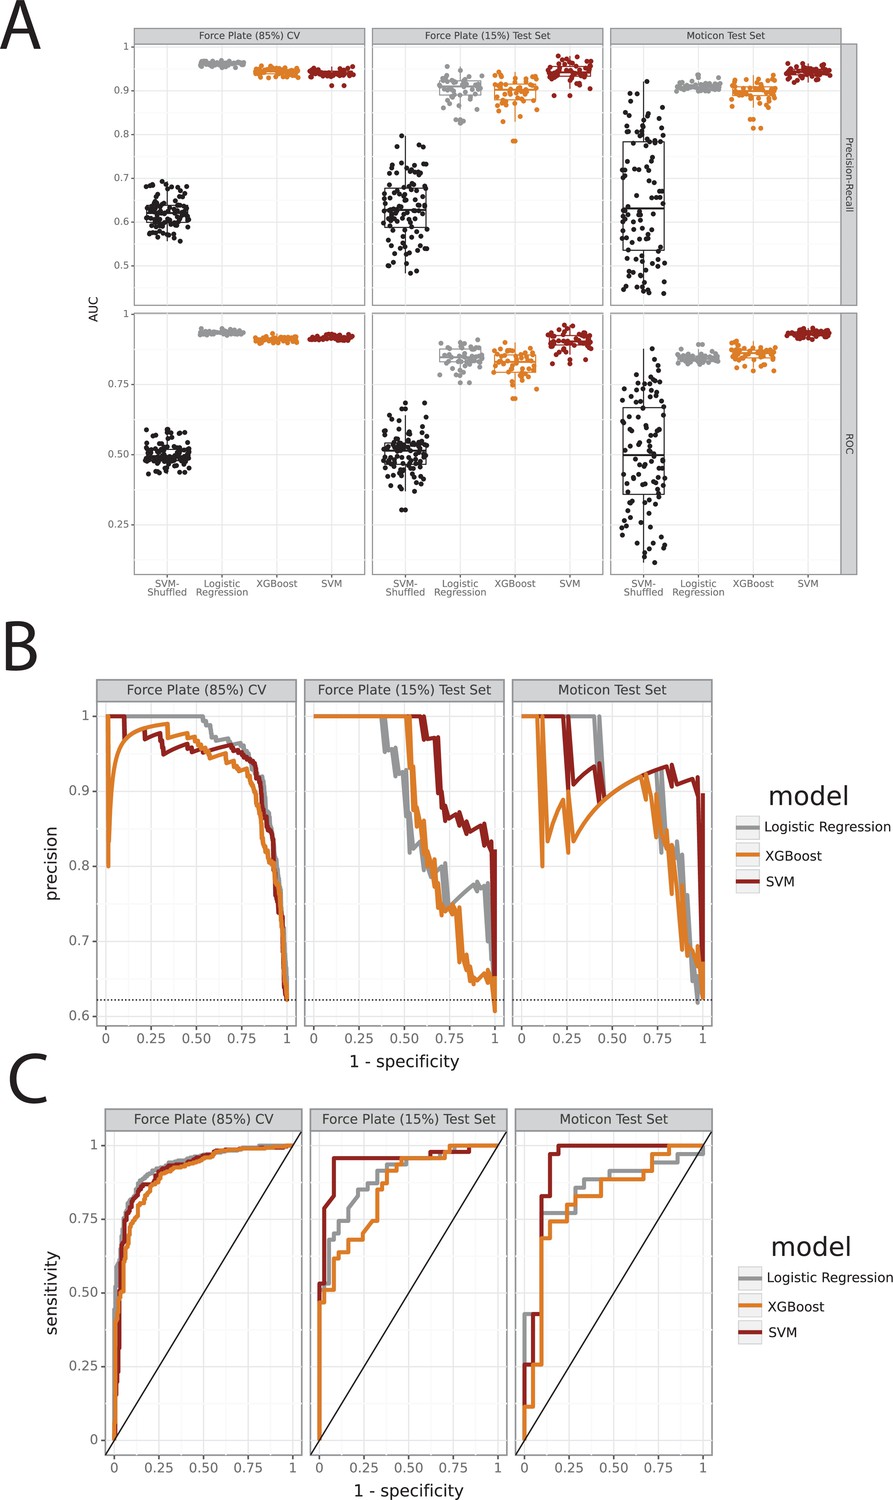
Comparison between logistic regression, support vector machine, and XGBoost models.
(A) Force plate repeated cross-validation (CV) set with 85% of the training/validation data, force plate test set with 15% of the observations, and the Moticon digital insole independent test set (see ‘Methods’). We evaluated three models: logistic regression, support vector machine (SVM), and XGBoost modeling approaches, as well as SVM with shuffled labels for comparison. This was repeated 100 times. The top row shows the area under the curve for the precision-recall (top) and ROC (bottom) curves, plotted in a box-and-whisker plot. (B) Precision-recall curves for all three models. (C) ROC curves for all three models.
Figure 3 with 1 supplement
Derived gait characteristics from a digital insole measured across all subjects from the pilot study and knee osteoarthritis patients in the clinical trial.
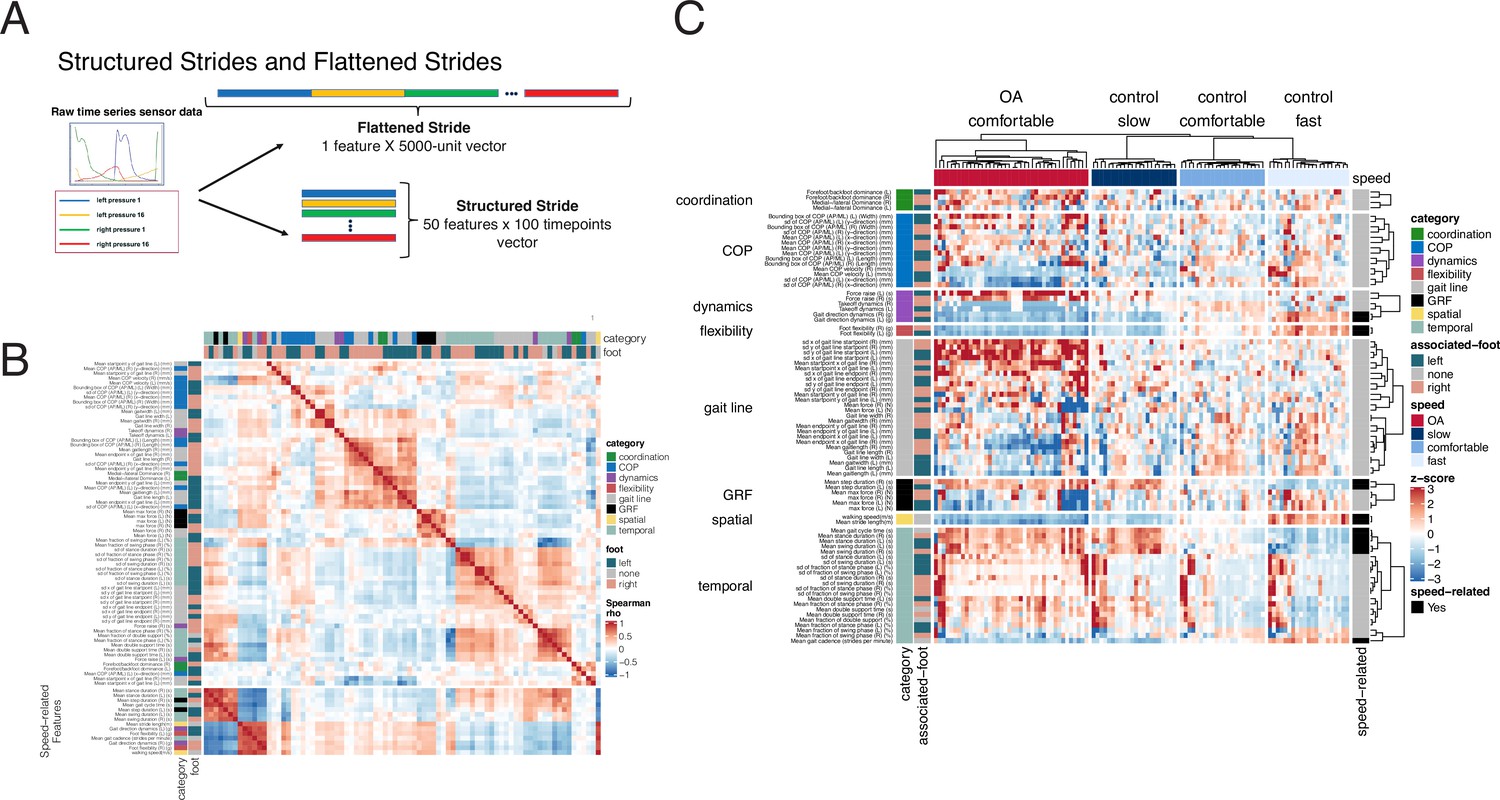
(A) Schematic of raw sensor time-series data from a digital insole. Data can be processed from the device in three ways: (1) vertical ground reaction forces (Figure 1); (2) derived gait characteristics on force, spatio-temporal, and center of pressure aspects; and (3) raw sensor time-series data from the 50 sensors embedded across both insoles. Each segmented stride of raw sensor time-series data can be analyzed as is (structured strides) or collapsed (flattened strides). (B) The derived gait characteristics (parameters) of the digital insole from all individuals in the pilot study were correlated against each other at the comfortable walking speed. Spearman correlation coefficients were computed and shown in a correlation matrix ranging from –1 (perfect anti-correlation) to +1 (perfectly correlation). Each parameter has a Spearman correlation coefficient of +1 with itself (red diagonal). The parameter, the foot from which it was generated, and its category are labeled on the left of the correlation matrix. (C) Heatmap representation of the average of each of the 82 digital insole parameters (rows) across all walks for each patient (columns) from the pilot study. Parameter values are shown as normalized z-scores (bounded within ± 3), calculated across all participants, and walking speeds. The heatmap is split by the three walking speeds (slow, normal, fast), and columns are clustered within each walking speed using hierarchical clustering with Euclidean distances. The 14 parameters strongly correlated with walking speed are indicated on the right of the heatmap.
Figure 3—figure supplement 1
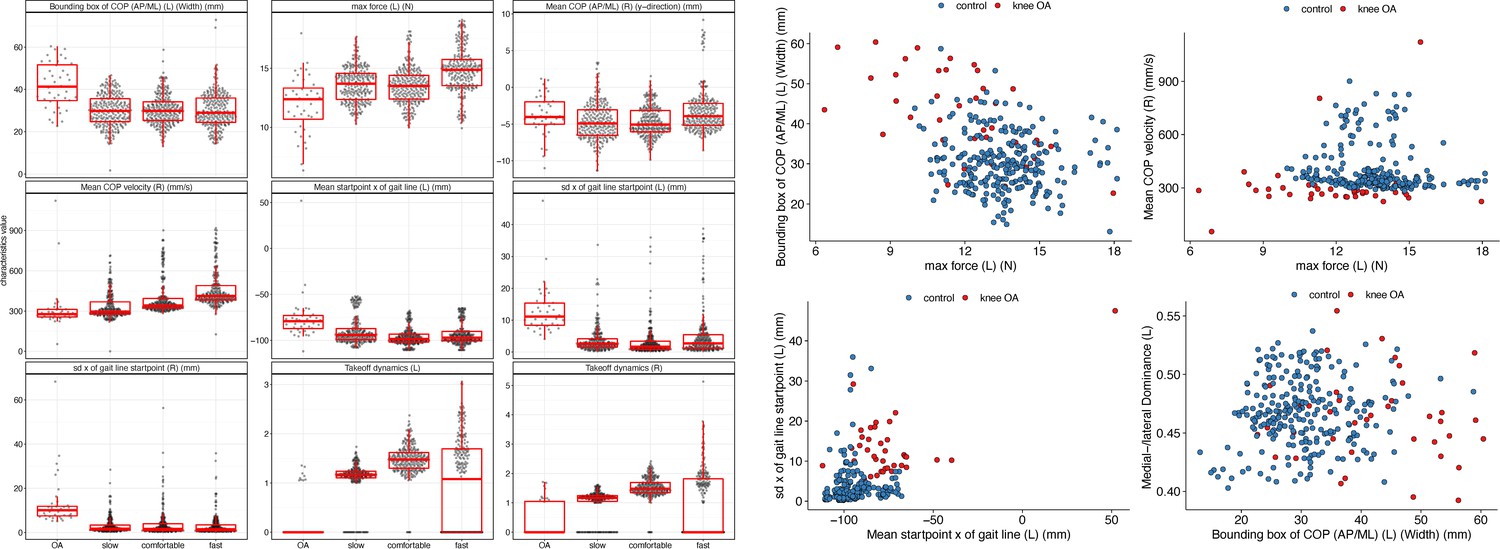
Derived gait characteristics that are most discriminative of knee osteoarthritis (OA) versus controls include features shown in Supplementary file 1.
Left: boxplots in knee OA, control slow, comfortable, and fast walking speeds for some parameters predictive of knee OA versus controls. Right: scatter plots of select parameters in control versus knee OA subjects at comfortable walking speed.
Figure 4 with 1 supplement
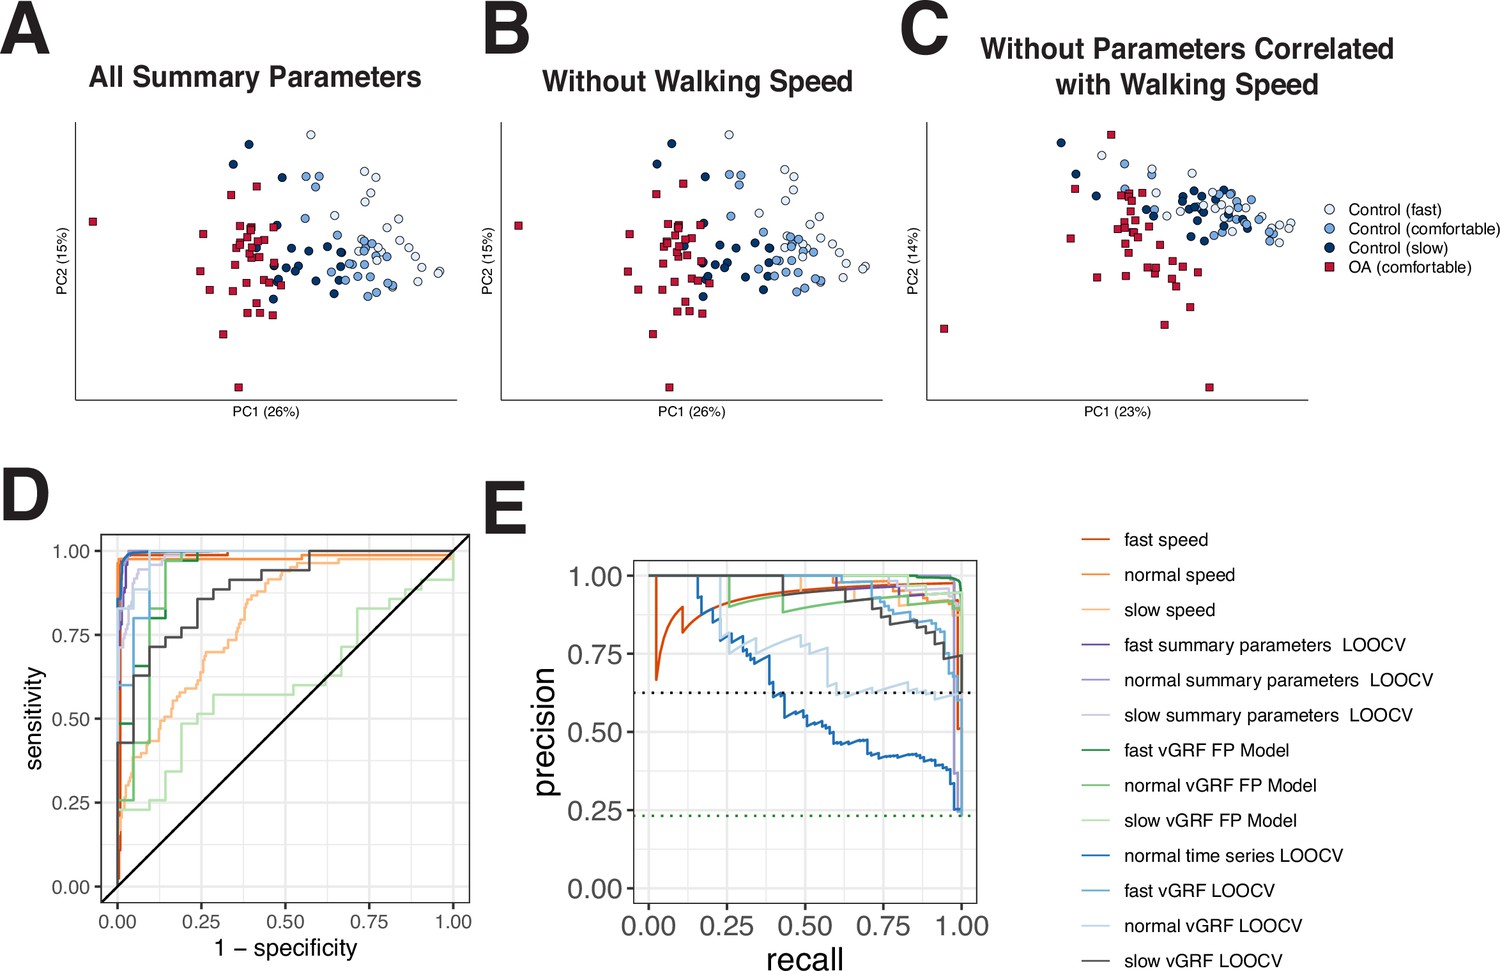
Different methods to analyze control subject versus knee osteoarthritis (OA) patient data from a digital insole enable refined classification of disease signatures.
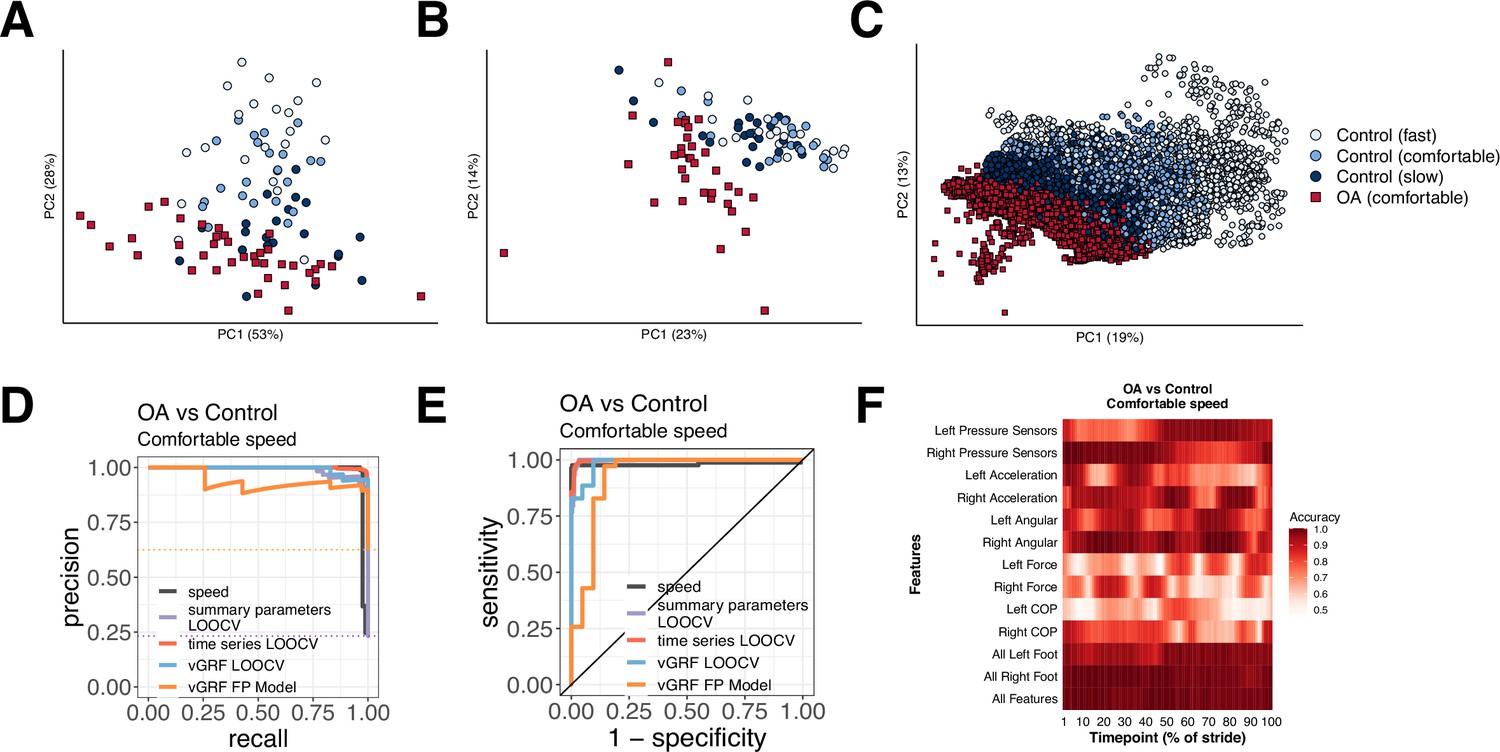
(A) Principal component analysis (PCA) dimensionality reduction of vertical ground reaction force (vGRF) data from all walks of pilot study subjects and baseline walks of knee OA clinical trial patients. Each dot represents data from a single subject at a given walking speed. (B) PCA dimensionality reduction of derived gait characteristic data from the digital insole, without the 14 speed-correlated derived gait characteristics. (C) PCA dimensionality reduction of raw sensor time series of each stride from all walks. Each dot represents data from a single stride and repeat strides from the same participant are shown. (D) Receiver operating characteristic curves for knee OA versus control (both at comfortable walking speed) prediction using only walking speed (speed), derived gait characteristics (excluding 14 speed-correlated features), raw sensor time series, and vGRF. Classification metrics were derived using leave-one-out cross-validation (LOOCV). The single derived gait characteristic speed separates out digital insole knee OA patients versus control subjects. (E) Precision-recall curves of the same comparisons in (D). (F) Classification accuracy using raw sensor time-series data from control subjects versus knee OA patients using subsets or all 50 sensors at each timepoint of the stride (0–100% of the stride). Timepoints start with the stance phase of the right foot and swing phase of the left foot, and end with the swing phase of the right foot and the stance phase of the left foot. Classification accuracy of 1.0 indicates perfect knee OA versus control classification using data from that timepoint.
Figure 4—figure supplement 1
Evaluation of all speed-independent characteristics for OA vs control classification.
(A) Principal component analysis (PCA) of all derived gait characteristics measured using the Moticon insole device, where each point represents the average of all walks from a particular subject, and the dot color indicates the group (control or knee osteoarthritis [OA]) or walking speed of control subjects. (B) PCA as in (A), without the walking speed gait characteristic. (C) PCA as in (A), without the 14 derived gait characteristics correlated to walking speed. (D) Classification performance area under the receiver operating characteristics curve (auROC) using walking speed as a sole predictor, vertical ground reaction force (vGRF) data, derived gait characteristics, and time-series data. (E) Precision-recall curve for classification as in (D).
Figure 5 with 1 supplement
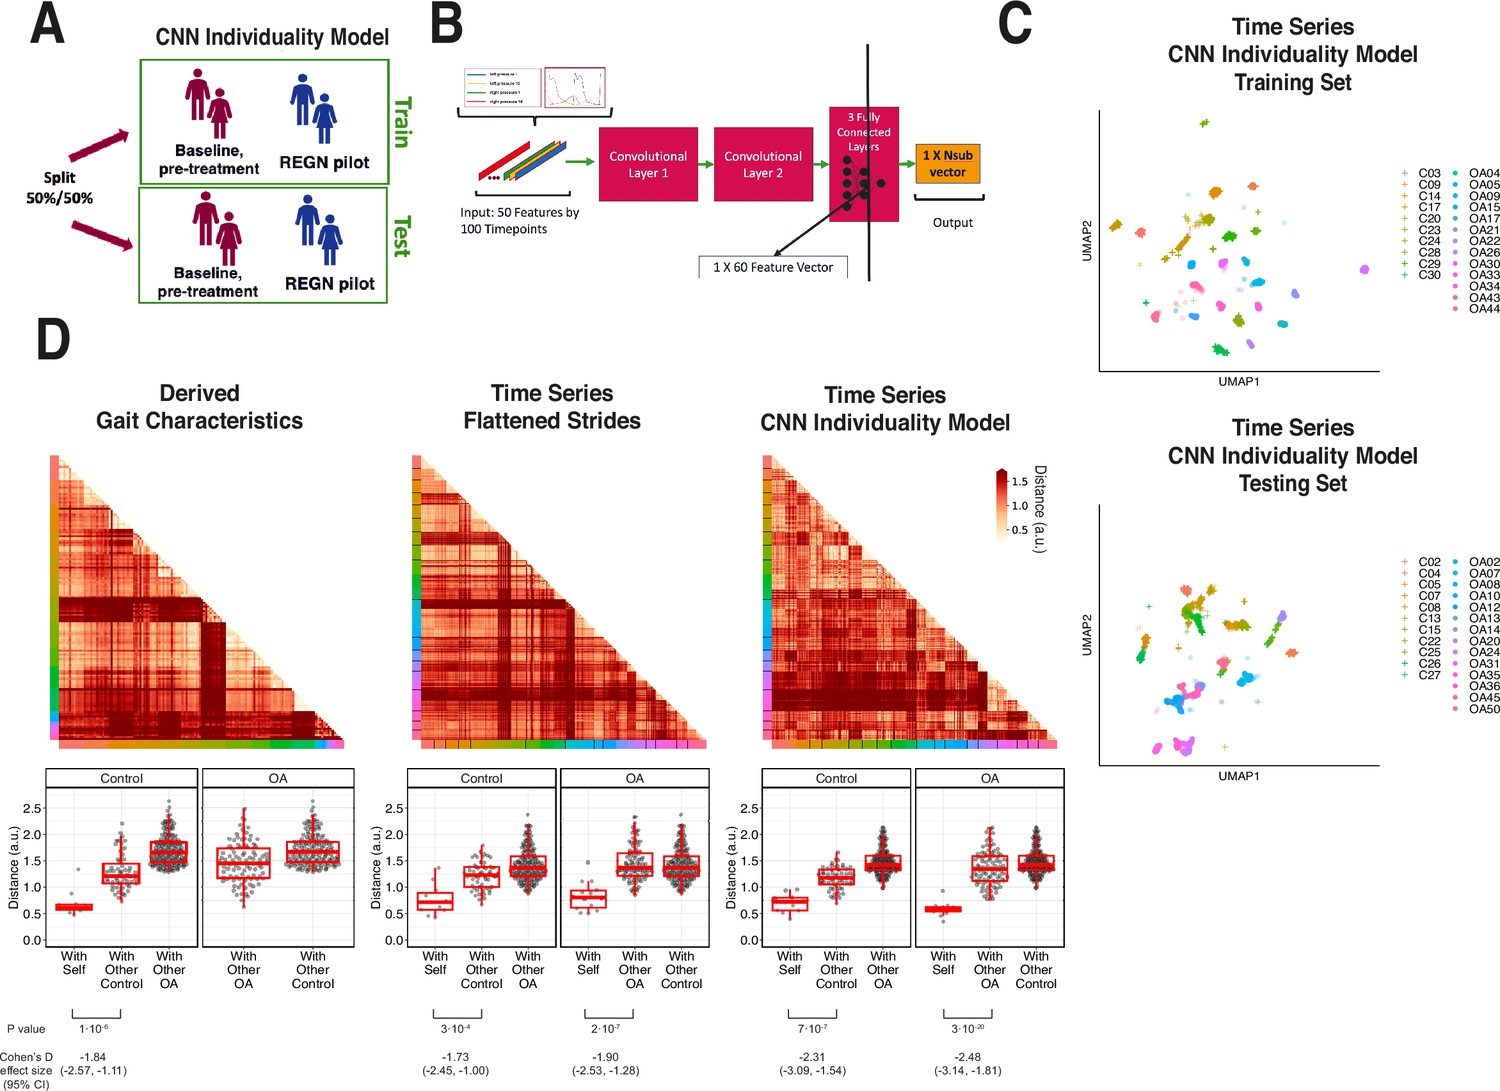
Latent convolutional neural net (CNN) representation of raw sensor time-series data from digital insoles: identifying subject-specific patterns of human gait.
(A) Pilot study subjects and knee osteoarthritis (OA) clinical trial patients were split 50:50 into training and testing sets, stratified by disease status, for the first CNN model investigating the individuality of gait patterns. (B) A CNN was trained on segmented structured strides from the digital insole in the training set, to predict from which subject the stride came. The activation of the last fully connected layer in the CNN consists of 60 features and represents the model’s latent representation of gait. (C) Uniform Manifold Approximation and Projection (UMAP) clustering of these 60 latent features for each stride captures the individuality of participants in both the training and testing sets. Each dot represents a single stride, colors represent each participant, and shapes represent participants’ health status (C = control). Intra- and inter-subject clustering and separation is greater in the training set, as expected, and is present in the testing set as well. (D) Distances (in arbitrary units) between each pair of walks (for derived gait parameters) or strides (for time series) from the testing set shown as heatmaps for each of the three methods (top panels). Subject of the walk/stride are color identified along the edge. Boxplot of mean distance of each walk/stride with other walk/strides from the same individual, and with walk/strides from other individuals separated by disease class (bottom panels). Distances are faceted by the disease class of the individual. A good representation has low distance for ‘with self’, and high distance for ‘with other’ classes.
Figure 5—figure supplement 1

Example heatmap of a good representation that has low distance between all pairs of walks/strides from the same participant and high distance between all pairs of walks/strides from different participants.
Color along the edge indicates each person.
Figure 6 with 1 supplement
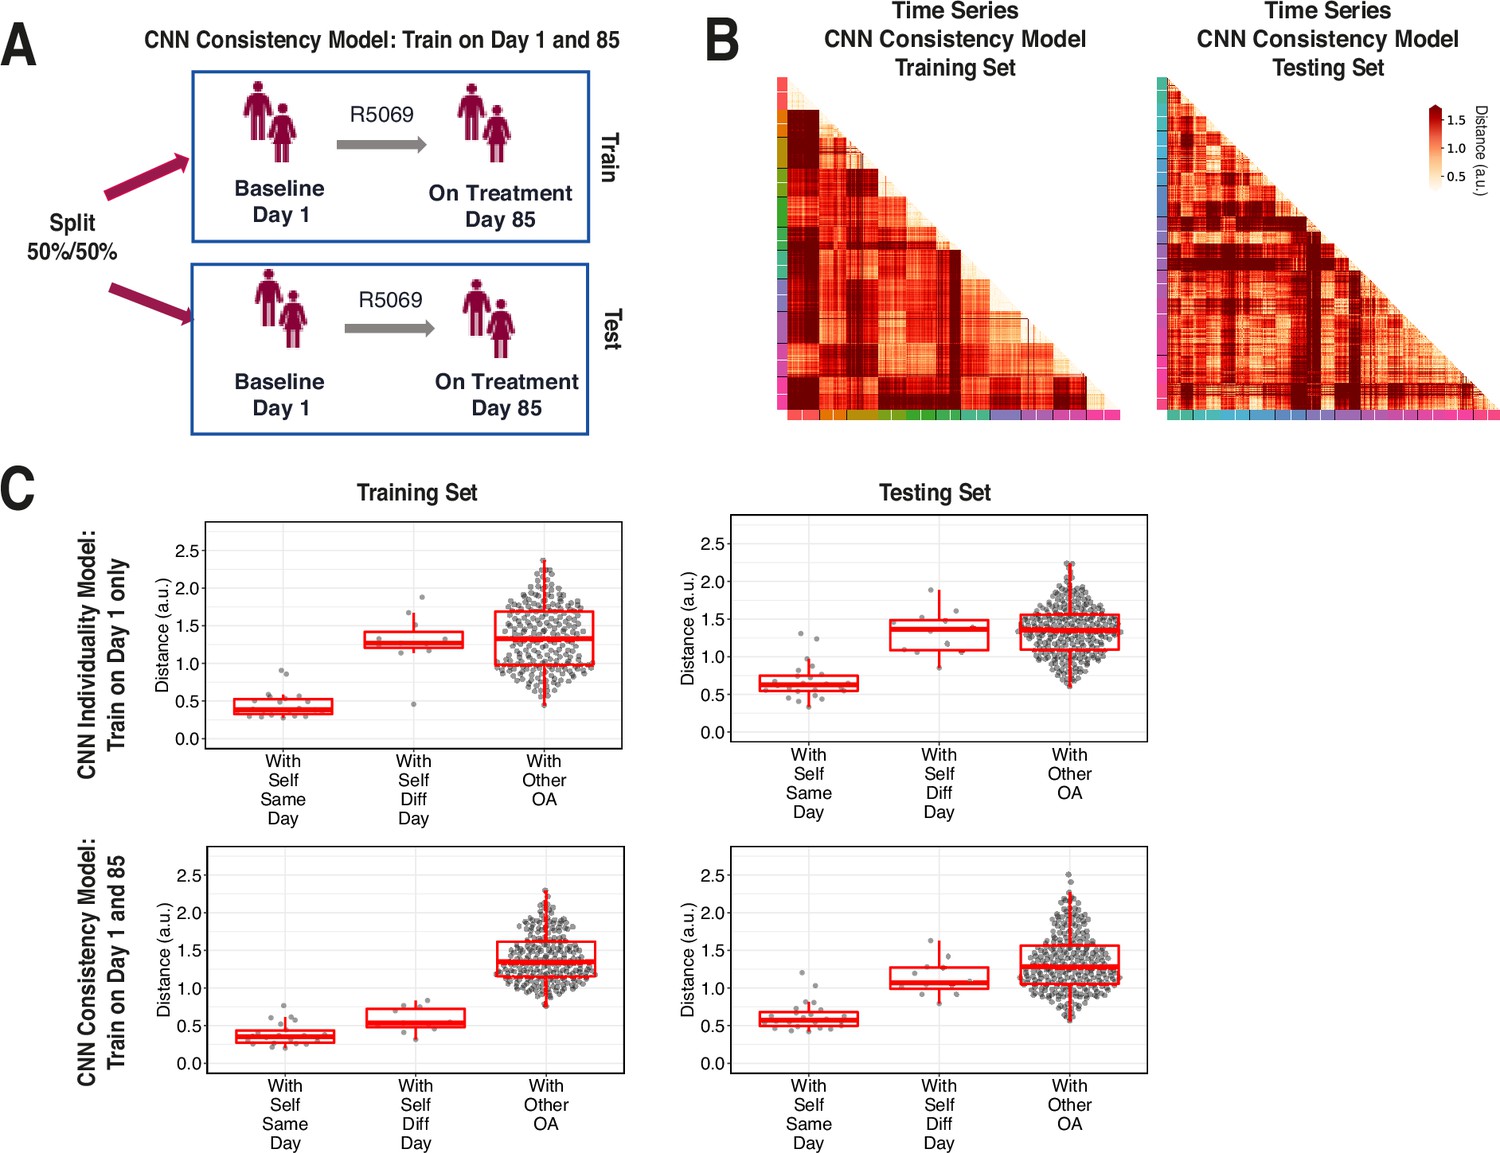
Training across multiple days increases consistency of convolutional neural network (CNN) model latent representation.
(A) Knee osteoarthritis (OA) clinical trial participants were split 50:50 into training and testing sets containing both day 1 (baseline) and day 85 (on treatment) data, for the second CNN model investigating the consistency of gait patterns. (B) Distances (in arbitrary units) between pairs of strides in the latent representation from the consistency CNN model in the training and testing sets, shown as heatmaps. Strides from the same person are arranged next to each other, with strides from day 1 listed first then strides from day 85. Color along the edge indicates each person. (C) Boxplots of mean distance of each stride with other strides from the same person on the same day, from the same person on different days, and from other people, for both the individuality model (Figure 5) and consistency model (A–B). Distances are shown using the different models in both the training and testing sets.
Figure 6—figure supplement 1

Boxplots of mean distance (in arbitrary units) of each stride with other strides from the same person on different days for both the convolutional neural network (CNN) individuality model (Figure 5) and CNN consistency model (Figure 6A and B) in both the training and testing sets.
Values are replotted from Figure 6C, and lines are drawn between the same participants. Significance of difference in distances between the CNN individuality and consistency models was analyzed with paired t-tests.
Author response image 1

Tables
Table 1
Force plate vertical ground reaction force (vGRF) control versus knee arthropathies support vector machine (SVM) classification model evaluation statistics (left foot/right foot).
An SVM model was trained on 85% of the force plate dataset vGRF data to predict control or knee arthropathies (knee injury or knee osteoarthritis) classes, with left foot vGRF data used to predict left knee arthropathies and right foot vGRF data used to predict right knee arthropathies. The model was evaluated using fivefold cross-validation, a hold-out force plate test set, and a digital insole test set. Area under the receiver operating characteristics curve (auROC) and area under the precision-recall curve (auPR) statistics are reported for the three models. F1 scores for each class for each model are also reported.
| Per class binary classification metrics | auROC actual/mean (SD) | auPR actual/mean (SD) | F1 score | |||||
|---|---|---|---|---|---|---|---|---|
| Control | Arthropathy | |||||||
| Left | Right | Left | Right | Left | Right | Left | Right | |
| Force plate fivefold cross validation | 0.917 (0.034) | 0.937 (0.023) | 0.944 (0.029) | 0.960 (0.015) | 0.78 | 0.84 | 0.87 | 0.88 |
| Force plate test set | 0.949 | 0.935 | 0.955 | 0.950 | 0.78 | 0.76 | 0.87 | 0.87 |
| Digital insole test set | 0.928 | 0.925 | 0.937 | 0.938 | 0.89 | 0.83 | 0.95 | 0.90 |
-
SD, standard deviation.
Table 2
Baseline characteristics and gait assessments of subjects in the digital insole pilot study and patients with knee osteoarthritis (OA) in the R5069-OA-1849 clinical trial digital insole sub-study.
Note that this table represents the total subjects enrolled with data used in any analysis of this study. Specific Ns are given where relevant and reflect subsets of these subjects.
| Controls Pilot study (N=22) Cross-sectional | Knee osteoarthritis Clinical trial (N=44 enrolled in sub-study, N=43 data collected) Longitudinal | |
|---|---|---|
| Age (years) | ||
| Mean | 39 | 62.75 |
| Median | 35 | 63 |
| Range | 19–85 | 52–77 |
| Sex | ||
| Female | 11 | 28 |
| Male | 11 | 8 |
| Body Mass Index (kg/m2) | ||
| Mean | 26.2 | 34.5 |
| Median | 26.0 | 34.8 |
| Range | 20.1–37.0 | 26.6–38.9 |
| Arthropathy class | N/A | K-L2-3: N=23 K-L4: N=13 |
| Walk test | Walk straight for 30 s | 3 min walk test (3MWT) |
| Walking speed | 3 speeds (comfortable, fast, slow) | 1 speed (comfortable) |
| Number of walk test performed | ~12 times (at each speed) | 1 time at baseline and 1-time on-treatment (day 85) |
| Total length of gait evaluation | 20 min | 3 min |
-
K-L, Kellgren–Lawrence.
Author response table 1
| Model | Train/Validation | Test | Number of CV folds | Figure |
|---|---|---|---|---|
| Left foot XGBoost vGRF model | N=471 total (85%) N=297 left foot injury N=174 no injury auROC = 0.905 (0.033) auPR = 0.938 (0.026) | N=84 total (15%) N=47 left foot injury N=37 no injury auROC = 0.857 auPR = 0.895 | 5 folds | Figure 2d |
| Digital insole vGRF (left) N=21 control N=35 OA auROC=0.815 auPR=0.862 | N/A | Figure 2d/e | ||
| Digital insole vGRF (left) N=21 control N=35 OA auROC = 0.967 auPR = 0.979 | N/A | leave-one-out cross-validation (LOOCV) | Figure 4d/e | |
| Right foot XGBoost vGRF model | N=427 total (85%) N=248 left foot injury N=179 no injury auROC = 0.929 (0.025) auPR = 0.954 (0.020) | N=76 total (15%) N=44 left foot injury N=32 no injury auROC = 0.863 auPR = 0.920 | 5 folds | Figure 2—figure supplement 3 |
| Digital insole vGRF (right) N=21 control N=35 OA auROC=0.859 auPR=0.909 | N/A | |||
| Digital insole vGRF (right) N=21 control N=35 OA auROC = 0.951 auPR = 0.952 | N/A | leave-one-out cross-validation (LOOCV) | ||
| Derived gait characteristics XGBoost | N=243 walks (N=21 subjects) control N=73 walks (N=37 subjects) OA auROC = 0.9997 auPR = 0.9989 | N/A | leave-one-out cross-validation (LOOCV) | Figure 4d/e |
| Derived gait characteristics without highly correlated (rho>0.7) walking speed characteristics XGBoost | N=243 walks (N=21 subjects) control N=73 walks (N=37 subjects) OA auROC = 0.998 auPR = 0.993 | N/A | leave-one-out cross-validation (LOOCV) | Figure 4d/e |
| Time series XGBoost | N=21 control N=32 OA (subjects with either Day 1 or Day 85) | N/A | leave-one-out cross-validation (LOOCV) | Figure 4d/e |
| Time series CNN | N=21 control N=32 OA (subjects with either Day 1 or Day 85) | N/A | leave-one-out cross-validation (LOOCV) | Figure 4d/e |
| Time series XGBoost at each timepoint | N=21 control N=27 OA (subjects with at least Day 1) | N/A | leave-one-out cross-validation (LOOCV) | Figure 4f |
| Sensor models for CNN individuality model | N=10 control N=13 OA (subjects with at least Day 1) | N=11 control N=14 OA (subjects with at least Day 1) | N/A | Figure 5 |
| Sensor models for CNN consistency model | N=11 OA (subjects with both Day 1 and Day 85) | N=12 OA (subjects with both Day 1 and Day 85) | N/A | Figure 6 |
Author response table 2
| auROC | auPR | |||
|---|---|---|---|---|
| LOOCV | r5FCV | LOOCV | r5FCV | |
| vGRF | 0.984 | 0.988 | 0.990 | 0.992 |
| Derived gait characteristics | 0.997 | 0.996 | 0.988 | 0.986 |
Additional files
Download links
A two-part list of links to download the article, or parts of the article, in various formats.
Downloads (link to download the article as PDF)
Open citations (links to open the citations from this article in various online reference manager services)
Cite this article (links to download the citations from this article in formats compatible with various reference manager tools)
Digital wearable insole-based identification of knee arthropathies and gait signatures using machine learning
eLife 13:e86132.
https://doi.org/10.7554/eLife.86132


