Figures
Figure 1 with 1 supplement
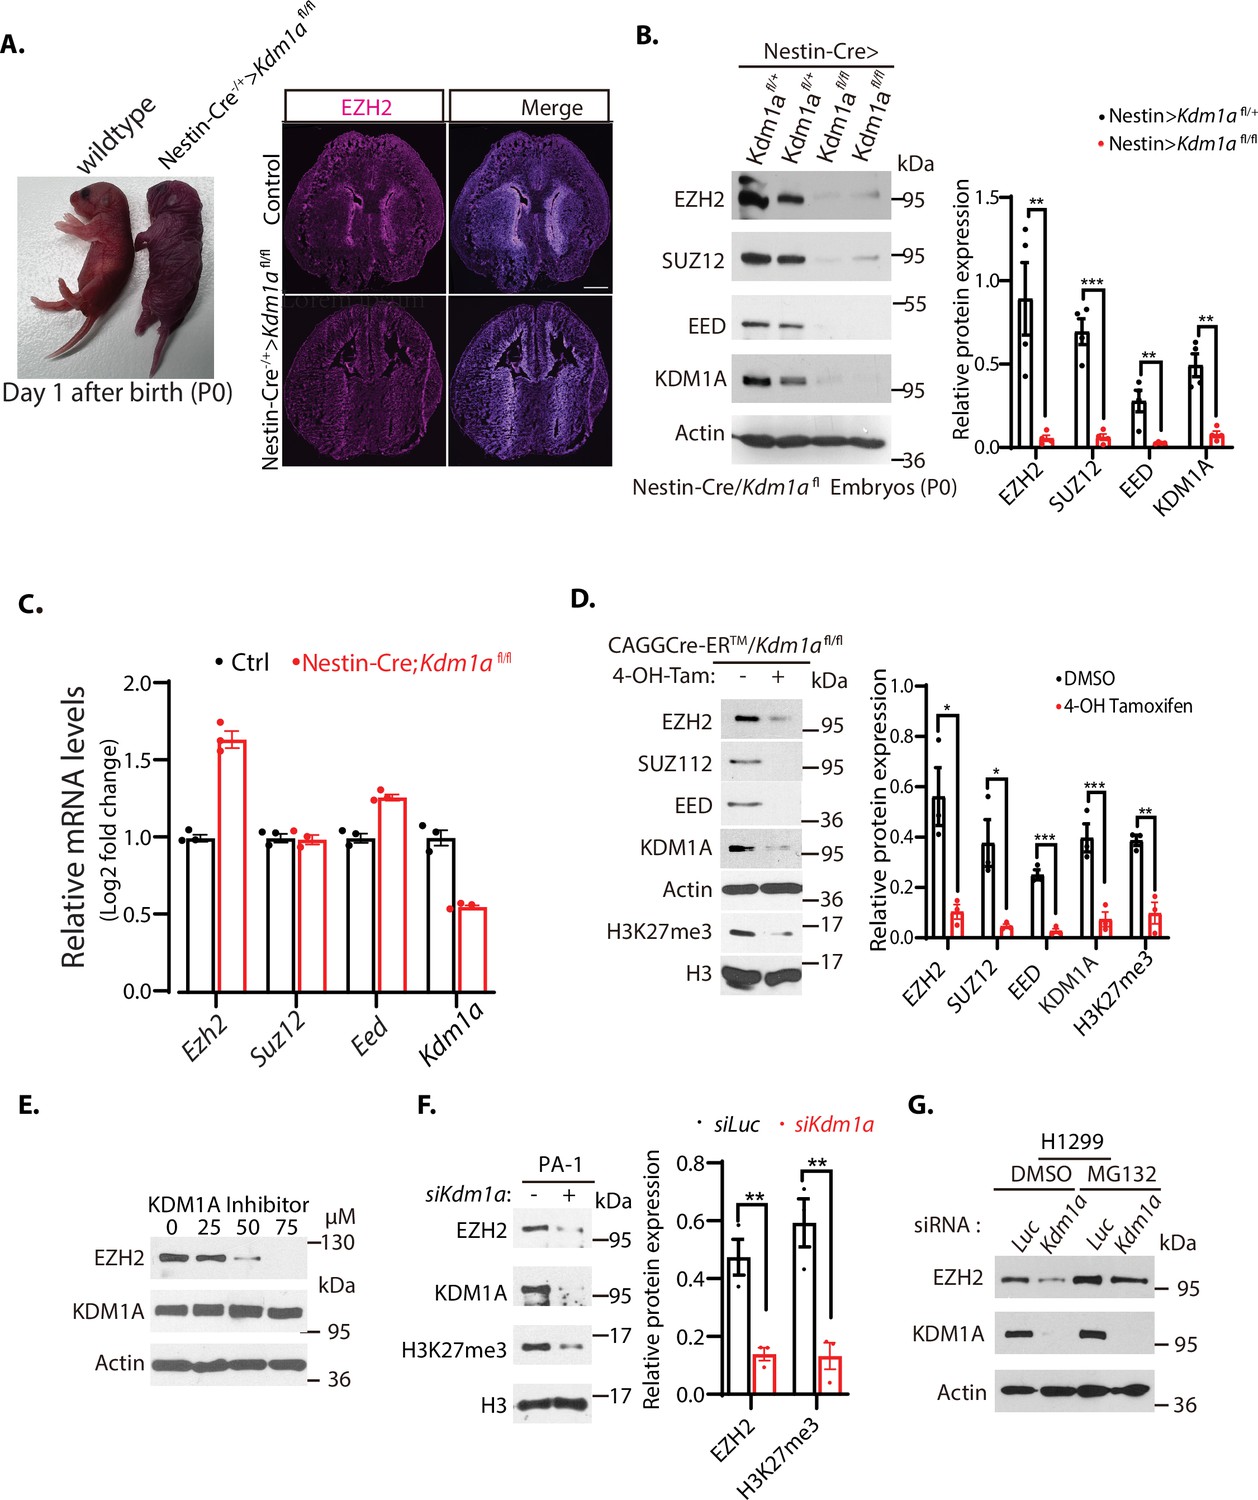
Downregulation of EZH2 in Kdm1a null mice.
(A) Left: Nestin-Cre-directed conditional inactivation of mouse Kdm1a gene causes immediate postnatal death after birth (P0). Right: Immunofluorescence staining of EZH2 from the brain sections of the wild-type and Nestin-Cre;Kdm1a fl/fl mice on P0 day. Scale bars, 500 μm. (B) Polycomb repressive complex 2 (PRC2) protein levels in the brain extracts of P0 Nestin-Cre;Kdm1a fl/+ heterozygous control or Nestin-Cre;Kdm1a fl/fl homozygous Kdm1a conditional deletion mice were analyzed by Western blotting. (C) Reverse-transcriptional quantitative PCR (RT-qPCR) analysis of the mRNA levels of Ezh2, Suz12, Eed, and Kdm1a in the brain of the Nestin-Cre;Kdm1a fl/fl mice. The mRNA levels were measured in triplicate by RT-qPCR. Quantifications are represented by bar graph with mean and standard deviation (S.D.) for error bars from three replicate samples and normalized to the control wild-type Kdm1a fl/fl mice. (D) Excision of Kdm1a by 4-OH-TAM in the Kdm1afl/fl-Actin-CreER MEFs reduces PRC2 proteins. Embryonic fibroblasts from CAGGCre-ER/Kdm1afl/fl mouse embryos (E13.5) were treated with 4-hydroxytamoxifen (20 μg/ml) for 12 hr to delete Kdm1a by inducible Actin-Cre-ER. (E) Wild-type MEFs were treated with various concentrations of KDM1A inhibitor CBB3001 (20 μM) for 20 hr and EZH2 and KDM1A protein levels were analyzed by blotting with indicated antibodies. (F) PA-1 cells were transfected with 50 nM luciferase control (Luc) or Kdm1a (Kdm1a-1) siRNAs for 48 hr and the levels of indicated proteins were analyzed. (G) H1299 cells were transfected with 50 nM luciferase (Luc) control or Kdm1a (Kdm1a-1) siRNAs for 48 hr and added 5 μg/ml MG132 for the last 6 hr before lysing the cells for blotting. For (B), (D) and (F), Significance was indicated as a two-tailed, unpaired, t-test. Values are expressed as the mean ± SEM. *p<0.05. **p<0.01. ***p<0.001. Protein molecular weight markers are in kilodalton (kDa).
-
Figure 1—source data 1
Original photos for Figure 1A and original blots for Figure 1B–G.
- https://cdn.elifesciences.org/articles/86168/elife-86168-fig1-data1-v2.zip
-
Figure 1—source data 2
Original table sources for quantification of Figure 1 plots.
- https://cdn.elifesciences.org/articles/86168/elife-86168-fig1-data2-v2.xlsx
Figure 1—figure supplement 1

Regulation of EZH2 by KDM1A.
(A) H520 cells were transfected with 50 nM luciferase (Luc) control or Kdm1a (Kdm1a-1 or Kdm1a-3’UTR) siRNAs for 48 hr and the levels of indicated proteins were analyzed. (B–C) H1299 cells were transiently transfected with the expression constructs of the Flag-tagged KDM1A wild-type (B) or Flag-tagged enzyme-dead mutant of KDM1A containing the amino-region (1–531 amino acid residues) (C) for 24 hr. They were then transfected with 50 nM luciferase (Luc) control or Kdm1a-3’UTR siRNAs for 48 hr and the levels of indicated proteins were analyzed.
-
Figure 1—figure supplement 1—source data 1
Original blots for Figure 1—figure supplement 1.
- https://cdn.elifesciences.org/articles/86168/elife-86168-fig1-figsupp1-data1-v2.zip
Figure 2 with 2 supplements
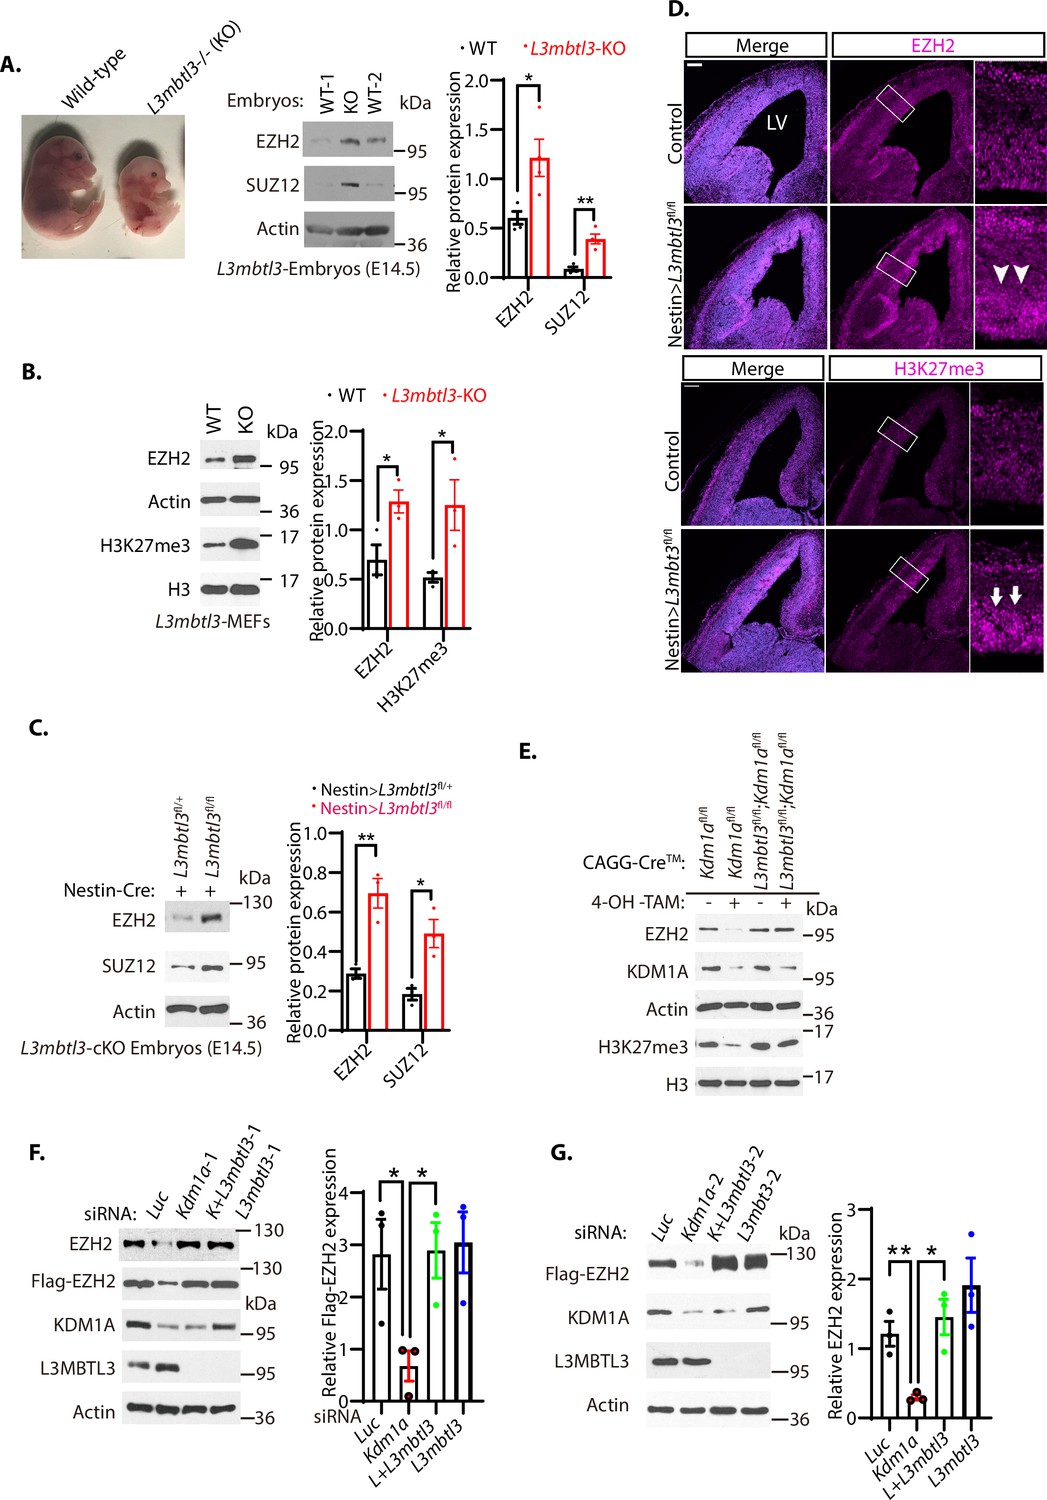
Loss of L3MBTL3 stabilizes EZH2 protein.
(A) Left: The mouse L3mbt3 wild-type (+/+) and L3mbtl3 null (-/-, KO) mutant embryos on embryonic day 17.5 (E17.5) after breeding. Right: Total lysates from the heads of mouse L3mbt3 (+/+) wild-type and L3mbt3 homozygous deletion (-/-, KO) mutant embryos (equal total proteins) were analyzed by Western blotting with antibodies for the indicated proteins. (B) Mouse embryonic fibroblasts from the wild-type and L3mbtl3 deletion mutant embryos (E13.5) were examined for EZH2 and H3K27me3 proteins by Western blotting. (C) Western blot analysis of EZH2 and SUZ12 proteins in the head extracts of Nestin-Cre;L3mbtl3fl/+ control and Nestin-Cre;L3mbtl3fl/fl conditional deletion (cKO) embryos (E14.5) using the indicative antibodies. (D) Coronal sections of the developing mouse brain at E15.5 were stained with anti-EZH2 and H3K27me3 antibodies in wild-type control and Nestin-Cre;L3mbtl3fl/fl conditional deletion mice. Scale bars, 100 μm. Arrows and arrowheads indicate the regions of EZH2 and H3K27me3 expression, respectively. LV: lateral ventricle. (E) Deletion of both Kdm1a and L3mbtl3 by 4-OH-TAM restores the protein levels of EZH2 and H3K27me3. MEFs from the Nestin-Cre;Kdm1afl/fl and CAGGCre-ER;Kdm1afl/fl;L3mbtl3fl/fl mouse embryos (E13.5) were treated with 4-hydroxytamoxifen (4-OH-TAM, 20 μg/ml) for 12 hr to delete Kdm1a and L3mbtl3. (F) Silencing of L3mbtl3 re-stabilizes the protein levels of EZH2 in Kdm1a deficient cells. The Flag-EZH2 under the retroviral LTR promoter control were ectopically and stably expressed in H1299 cells and the cells were transfected with 50 nM siRNAs of luciferase (Luc), Kdm1a (Kdm1a-1), and L3mbtl3 (L3mbtl-1) siRNAs. (G) Silencing of L3mbtl3 stabilizes EZH2 protein in Kdm1a deficient cells. The Flag-EZH2 under the retroviral LTR promoter control were ectopically and stably expressed in H1299 cells and the cells were transfected with 50 nM siRNAs of luciferase (Luc), Kdm1a (Kdm1a-2), Kdm1a and L3mbtl3 (L3mbtl3-2), and L3mbtl3 siRNAs. The indicated proteins were analyzed by Western blotting. For (A–C), (F), and (G), band intensities were quantified and normalized to that of the luciferase or actin control. Significance was indicated as a two-tailed, unpaired, t-test. Values are expressed as the mean ± SEM. *p<0.05. **p<0.01. ***p<0.001.
-
Figure 2—source data 1
Original blots for Figure 2A–C, original photos for Figure 2D, and original blots for Figure 2E–G.
- https://cdn.elifesciences.org/articles/86168/elife-86168-fig2-data1-v2.zip
-
Figure 2—source data 2
Original table sources for quantification of Figure 2 plots.
- https://cdn.elifesciences.org/articles/86168/elife-86168-fig2-data2-v2.xlsx
Figure 2—figure supplement 1
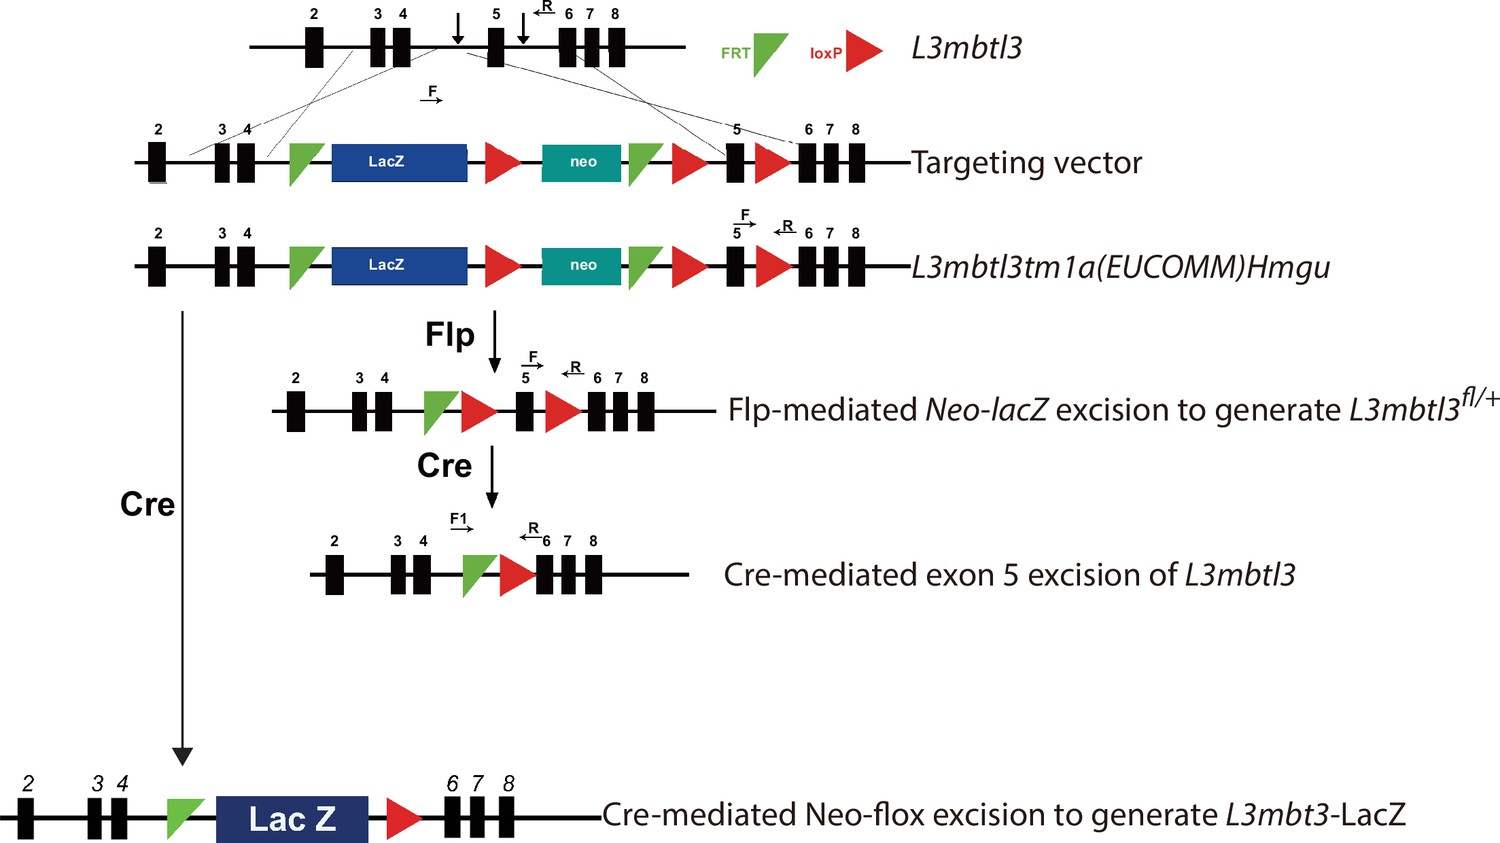
Schematic illustration to generate a conditional flox allele in L3mbtl3fl/fl with the FRT-loxP sites at the exon 5 of the L3mbtl3 locus.
The LacZ-neo fragment was removed by breeding with the FLPo-10 mice to obtain the conditional L3mbtl3fl/+ mice. The loxP-neo fragment was removed by breeding with the Sox2-Cre mice to obtain L3mbtl3-LacZ mice. Green triangles are FRT sites and the red arrows are loxP sites. F and R in the figure are PCR primers for genotyping.
Figure 2—figure supplement 2

The EZH2 protein is regulated by L3MBTL3.
(A) The genomic L3mbtl3 alleles were deleted in HCT116 cells by the CRISPR-Cas9 gene editing. The protein levels of EZH2 in wild-type and L3MBTL3 deleted (KO) HCT116 cells were analyzed by western blotting. (B). The Flag-L3mbt3 under the retroviral LTR promoter control were ectopically and stably expressed in HCT116 cells. The change in the EZH2 protein level was measured by western blotting.
-
Figure 2—figure supplement 2—source data 1
Original blots for Figure 2—figure supplement 2.
- https://cdn.elifesciences.org/articles/86168/elife-86168-fig2-figsupp2-data1-v2.zip
Figure 3
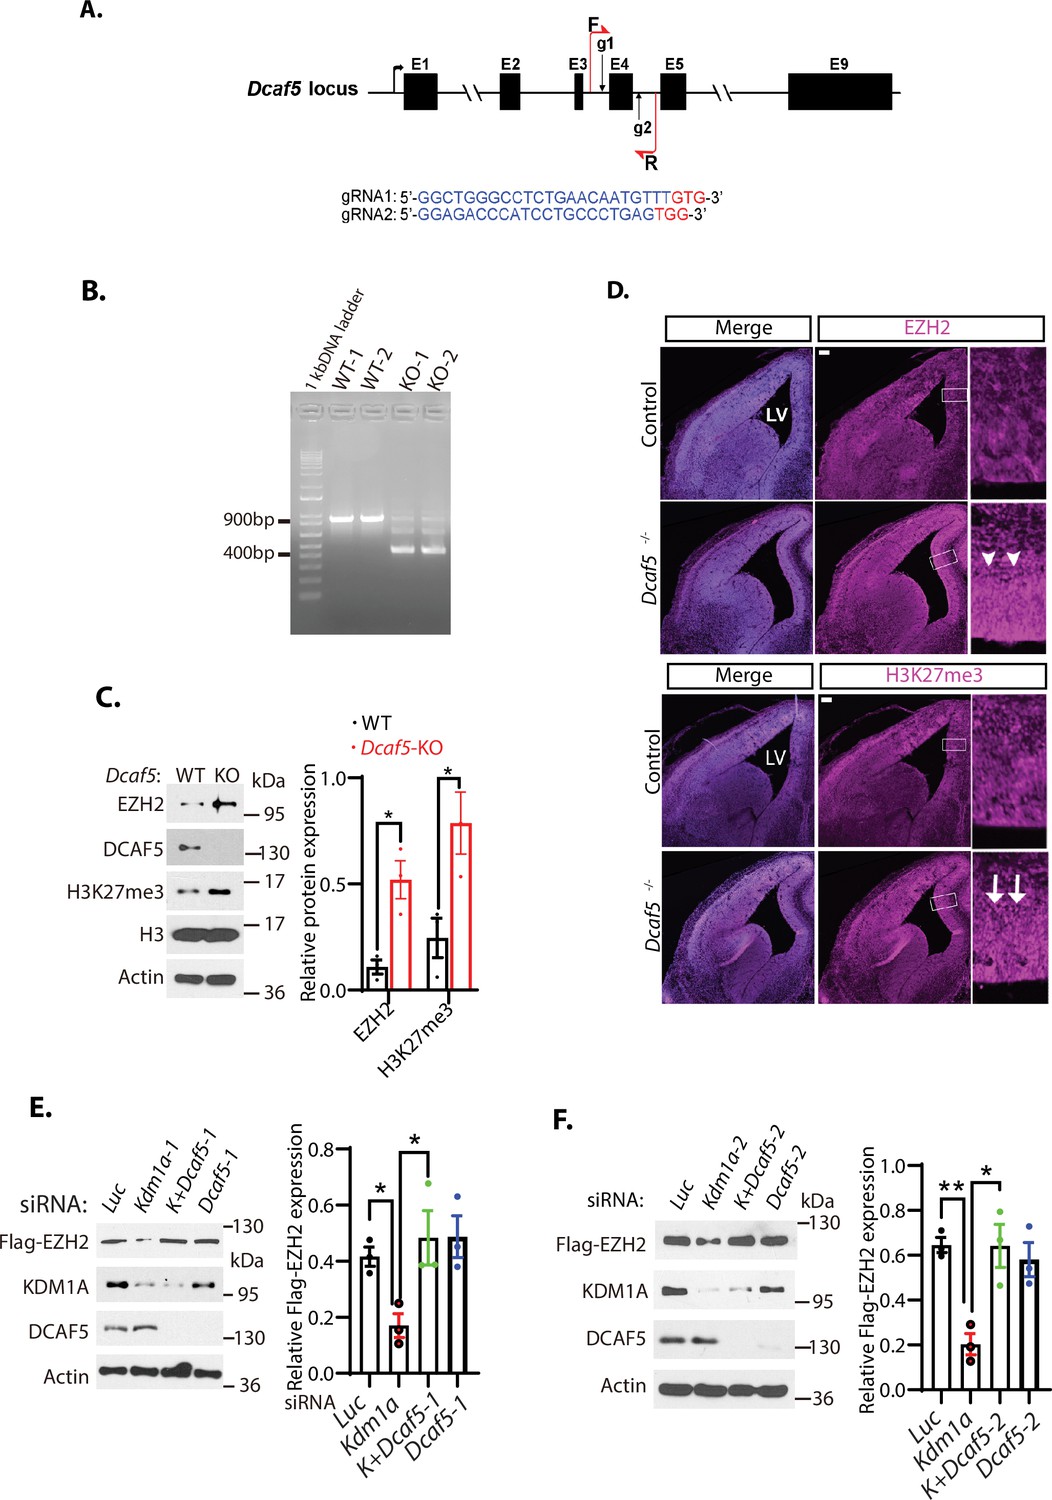
Loss of Dcaf5 stabilizes EZH2 protein.
(A) The strategy to delete the exon 4 of the mouse Dcaf5 gene by CRISPR-Cas9 gene edition with two guide RNAs (gRNAs). (B) Genome typing of the wild-type (WT) and Dcaf5 knock-out (KO) mice by PCR. (C) Western blot analysis of EZH2 and H3K27me3 proteins in the brains of the wild-type control and homozygous Dcaf5 deletion mice using the indicative antibodies. (D) Accumulation of EZH2 and H3K27me3 proteins in mouse Dcaf5 deleted embryonic brains. Immunostainings of anti-EZH2 and H3K27me3 in the coronal sections of the mouse embryonic brains of the wild-type control and Dcaf5 at E15.5. Scale bars, 100 μm. Arrows and arrowheads indicate the expression regions of EZH2 and H3K27me3, respectively. Boxed regions are enlarged on the right panels. LV: lateral ventricle. (E) Silencing of Dcaf5 re-stabilizes the protein levels of EZH2 in Kdm1a deficient cells. H1299 cells expressing stably expressed Flag-EZH2 were transfected with 50 nM siRNAs of luciferase (Luc), Kdm1a-1, Kdm1a and Dcaf5-1, and Dcaf5-1 siRNAs. The indicated proteins were analyzed by Western blotting. (F) Silencing of Dcaf5 re-stabilizes the protein levels of EZH2 in Kdm1a deficient cells. H1299 cells expressing stably expressed Flag-EZH2 were transfected with 50 nM siRNAs of luciferase (Luc), Kdm1a-2, Kdm1a-2+Dcaf5-2, and Dcaf5-2 siRNAs. The indicated proteins were analyzed by Western blotting. Band intensities in (C), (E), and (F) were quantified and normalized to that of the histone H3 or luciferase control. Significance was indicated as a two-tailed, unpaired, t-test. Values are expressed as the mean ± SEM. *p<0.05. **p<0.01.
-
Figure 3—source data 1
Original photos for Figure 3B and D, original blots for Figure 3C, E and F.
- https://cdn.elifesciences.org/articles/86168/elife-86168-fig3-data1-v2.zip
-
Figure 3—source data 2
Original table sources for quantification of Figure 3 plots.
- https://cdn.elifesciences.org/articles/86168/elife-86168-fig3-data2-v2.xlsx
Figure 4 with 2 supplements
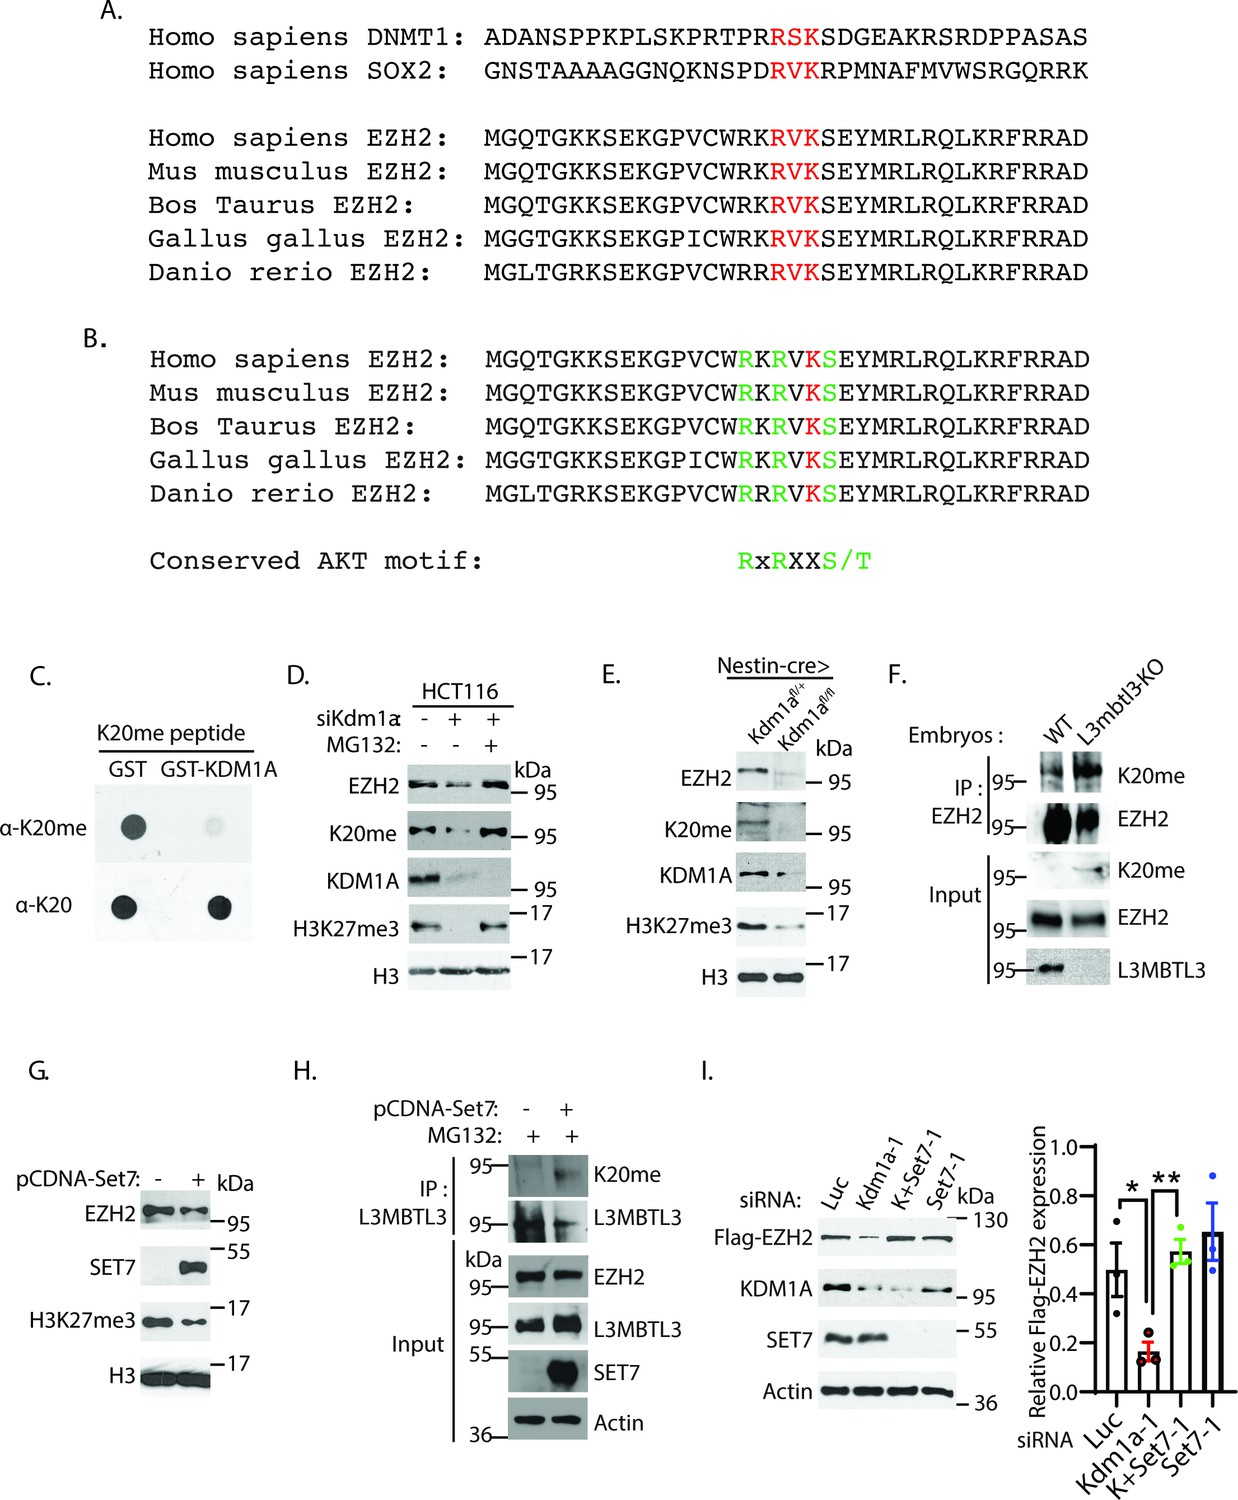
The K20 residue in EZH2 is methylated by SET7.
(A) EZH2 contains a conserved lysine residue, Lys 20 (K20), within the consensus lysine residues (K*) of the H3K4-like R/K-S/T/V-K* methylation motifs methylated by SET7. (B) K20 (red) is next to serine 21 (S21) that is phosphorylated by AKT in EZH2. The critical amino acid residues (RXRXXS) in the AKT phosphorylation consensus motif are labeled green. (C) KDM1A demethylates the methylated K20 peptide. Purified 1 μg GST control or GST-KDM1A proteins were incubated with 100 ng of mono-methylated K20 peptides for 4 hr at room temperature and the resulting peptides and input methylated peptides were spotted onto nitrocellulose membrane and blotted with affinity purified anti-methylated K20 and anti-K20 antibodies as indicated. (D) HCT116 cells were transfected with 50 nM luciferase (Luc) control or Kdm1a siRNAs for 48 hr and added 5 μg/ml MG132 or DMSO for the last 6 hr before lysing the cells for blotting. Proteins were detected by Western blotting with indicative antibodies. (E) The protein levels of EZH2, EZH2-K20me, and H3K27me3 in the brain extracts of E18.5 Nestin-Cre;Kdm1afl/+ heterozygous control or Nestin-Cre;Kdm1afl/fl homozygous Kdm1a conditional deletion mice were analyzed by Western blotting. (F) The L3mbt3 wild-type and deletion (−/−) mutant embryos on embryonic day 15.5 (E15.5) were analyzed for monomethylated K20 of EZH2. Total lysates were immunoprecipitated with EZH2 antibody and blotted with indicated antibodies. (G) HCT116 cells were transfected with control vector (pcDNA3) or SET7 expression construct for 48 hr and protein extracts were prepared. Proteins were detected by Western blotting with indicative antibodies (H) The K20-methylated EZH2 preferentially binds to L3MBTL3. The 293T cells were transfected with control vector (pcDNA3) or SET7 expression construct for 48 hr, and proteasome inhibitor MG132 (5 μg/ml) was added for the last 6 hr. Interactions between L3MBTL3 and EZH2-K20me were analyzed by co-immunoprecipitation and Western blotting analyses. (I) Silencing of SET7 re-stabilizes the protein levels of EZH2 in KDM1A deficient cells. H1299 cells expressing stably expressed Flag-EZH2 were transfected with 50 nM siRNAs of luciferase (Luc), Kdm1a (Kdm1a-1), Set7 (Set7-1) siRNAs and their combination. The indicated proteins were analyzed by Western blotting. The protein bands were quantified and normalized to that of the luciferase control. Significance was indicated as a two-tailed, unpaired, t-test. Values are expressed as the mean ± SEM. *p<0.05. **p<0.01.
-
Figure 4—source data 1
Original blots for Figure 4C–I.
- https://cdn.elifesciences.org/articles/86168/elife-86168-fig4-data1-v2.zip
-
Figure 4—source data 2
Original table sources for quantification of Figure 4 plots.
- https://cdn.elifesciences.org/articles/86168/elife-86168-fig4-data2-v2.xlsx
Figure 4—figure supplement 1
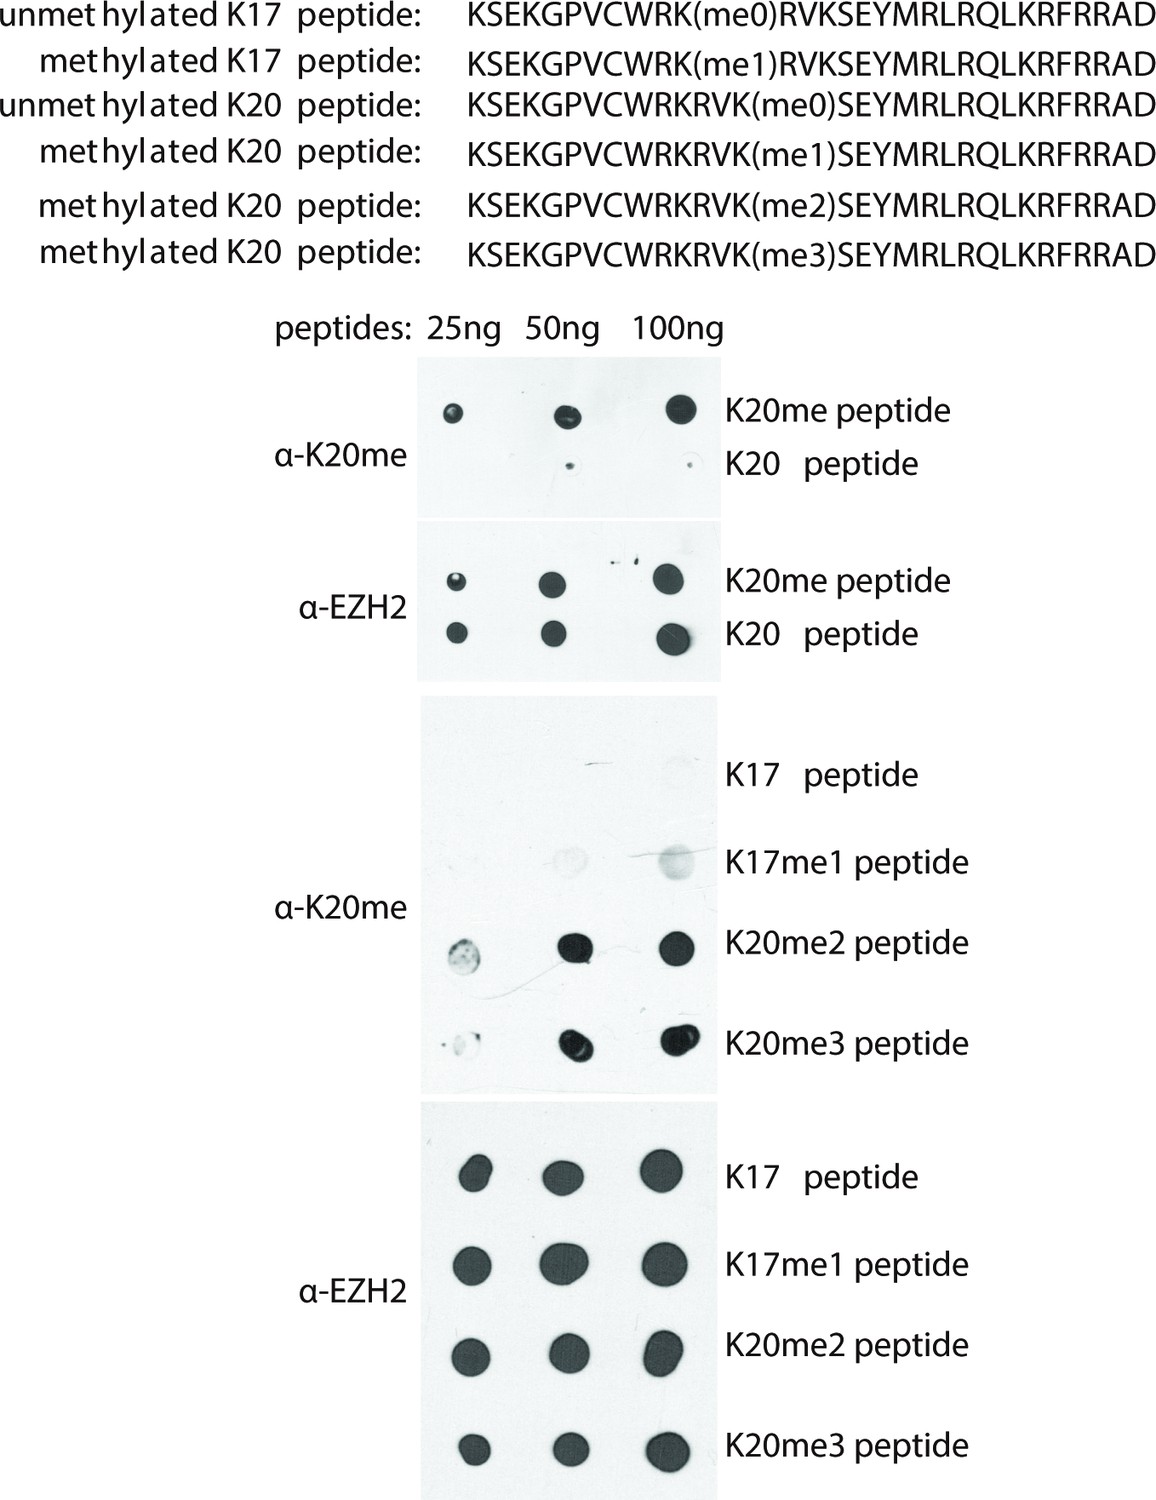
Specificity of anti-methylated K20 peptide antibodies.
The unmethylated and monomethylated K20 cognate peptides, the unmethylated K17 and the monomethylated K17 cognate peptides, di-methylated and tri-methylated K20 cognate peptides were spotted onto nitrocellulose membrane as indicated. The methylated peptides were detected by the affinity-purified anti-mono-methylated K20 peptide and EZH2 antibodies.
-
Figure 4—figure supplement 1—source data 1
Original dot blots for Figure 4—figure supplement 1.
- https://cdn.elifesciences.org/articles/86168/elife-86168-fig4-figsupp1-data1-v2.zip
Figure 4—figure supplement 2

Loss of L3mbtl3 reduces the decrease of EZH2 protein induced by Kdm1a silencing.
(A) Silencing of Set7 re-stabilizes the protein levels of EZH2 in Kdm1a deficient cells. H1299 cells stably expressing Flag-EZH2 were transfected with 50 nM siRNAs of luciferase (Luc), Kdm1a (Kdm1a-2), Set7 (Set7-2) siRNAs. The indicated proteins were analyzed by Western blotting. The protein bands were quantified and normalized to that of the luciferase control. Significance was indicated as a two-tailed, unpaired, t-test. Values are expressed as the mean ± SEM. *p<0.05. **p<0.01. (B and C) Silencing of L3mbtl3 re-stabilizes the protein levels of EZH2 in Phf20l1 deficient cells. H1299 cells expressing stably Flag-EZH2 were transfected with 50 nM siRNAs of luciferase (Luc), Phf20l1 (Phf20l1-1 or Phf20l1-2), L3mbtl3-1 and Phf20l1 or Phf20l1-2, and L3mbtl3-1 siRNAs as indicated. The indicated proteins were analyzed by Western blotting. (D) T47D cells were transfected with control vector (pcDNA3) or SET7 expression construct for 48 hr and protein extracts were prepared. Proteins were detected by Western blotting with indicative antibodies.
-
Figure 4—figure supplement 2—source data 1
Original blots for Figure 4—figure supplement 2.
- https://cdn.elifesciences.org/articles/86168/elife-86168-fig4-figsupp2-data1-v2.zip
Figure 5 with 1 supplement
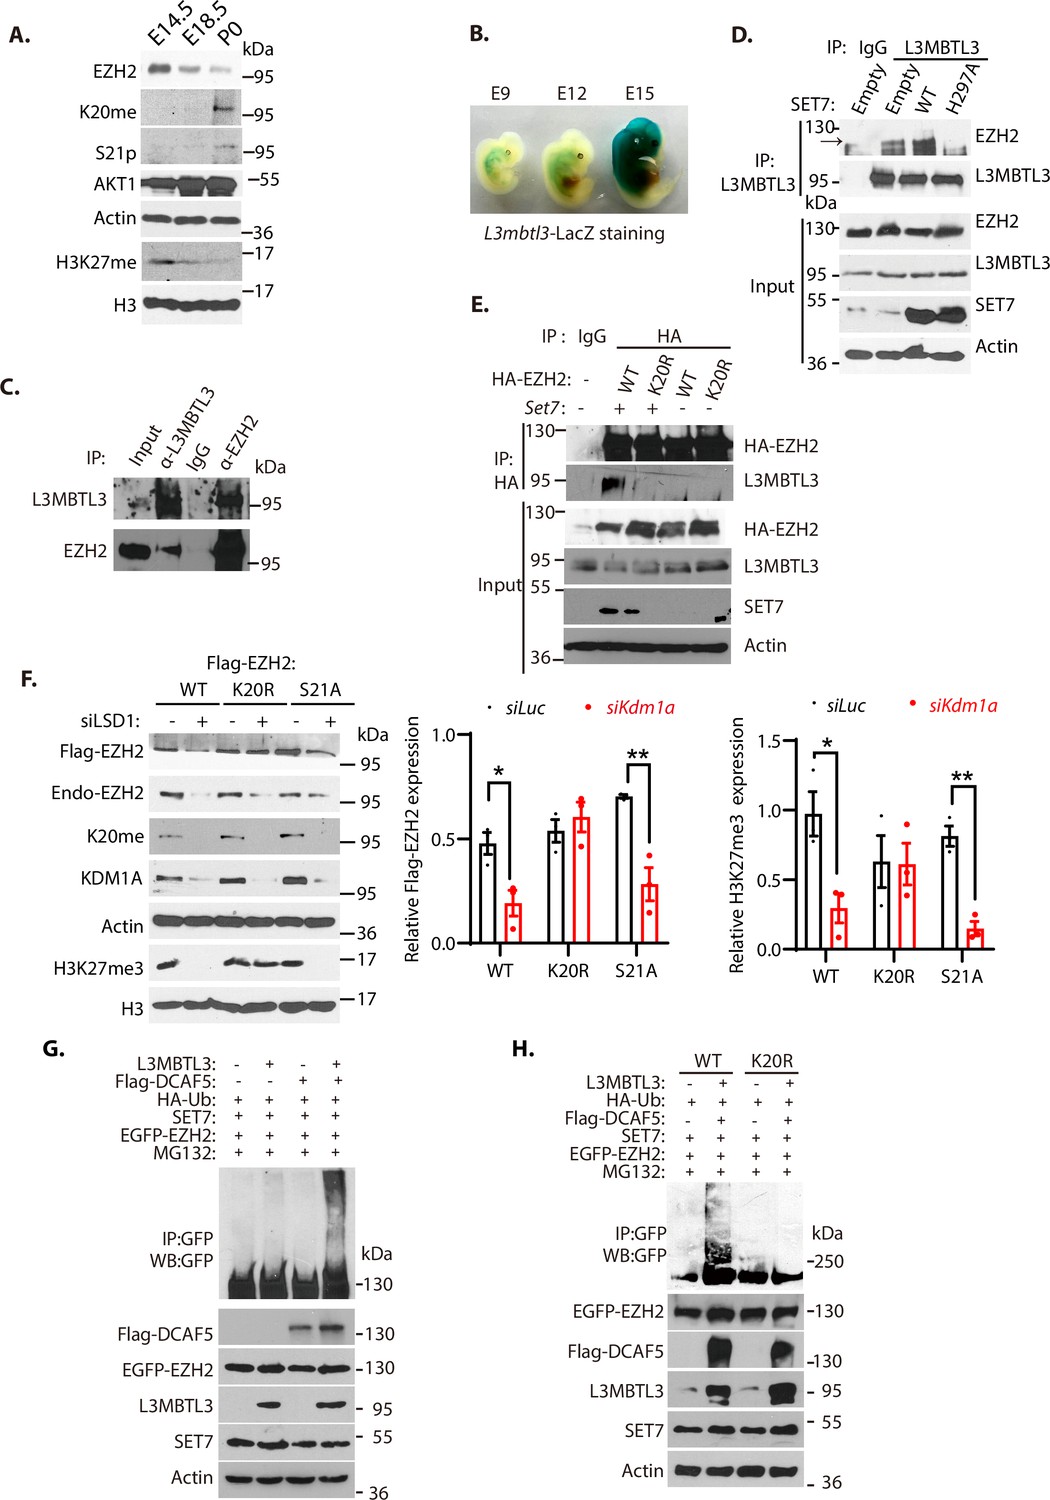
L3MBTL3 and DCAF5 target methylated K20 to promote EZH2 proteolysis.
(A) Mouse embryos at the indicated embryonic days were prepared and the indicated proteins in the lysates were examined with respective antibodies. (B) LacZ staining in mouse embryos carrying the LacZ gene under the L3mbtl3 promoter control (L3mbtl-LacZ) identifies the endogenous L3MBTL3 expression during mouse development. (C) Endogenous L3MBTL3 interacts with EZH2. Lysates were extracted from mouse embryos (E14.5) and the interaction between L3MBTL3 and EZH2 were analyzed by co-immunoprecipitation and blotted with respective antibodies. Input: 1/10 of the lysates for Western blotting. (D) SET7 stimulates the interaction between L3MBTL3 and EZH2. 293T cells were transiently transfected with the expression vector of Set7 wild-type, Set7H297A mutant, or the empty vector for 48 hr. Cell lysates were immunoprecipitated by anti-L3MBTL3 antibodies and blotted with antibodies against EZH2 and L3MBTL3. (E) The K20R mutant does not interact with L3MBTL3. HA-tagged EZH2 or the HA-K20R mutant expressing constructs were co-transfected with vector expressing Set7 or empty vector into 293T cells. Cell lysates were immunoprecipitated with the anti-HA antibody and the blots were immunoblotted with anti-L3MBTL3 and anti-HA antibodies. (F) The Flag-tagged Ezh2 wild-type, K20r, or S21a mutant were stably expressed in G401 cells. The cells were then transfected with 50 nM siRNAs of luciferase or Kdm1a for 48 hr. The protein levels of Flag-EZH2, H3K27me3, and indicated other proteins were analyzed by immunoblotting. The protein bands were quantified and normalized to that of the luciferase control. Significance was indicated as a two-tailed, unpaired, t-test. Values are expressed as the mean ± SEM. *p<0.05. **p<0.01. (G) and (H) The EGFP-tagged wild-type Ezh2 or K20r mutant were co-transfected into 293T cells together with vectors expressing HA-tagged ubiquitin (HA-Ub) and SET7 in the presence or absence of L3MBTL3 and DCAF5 expressing constructs as indicated. Proteasome inhibitor MG132 (5 μg/ml) was added for the last 6 hr to stabilize the polyubiquitinated EZH2. Proteins were immunoprecipitated with anti-GFP antibodies and Western blotted with anti-GFP and other antibodies against indicated proteins.
-
Figure 5—source data 1
Original blots for Figure 5.
- https://cdn.elifesciences.org/articles/86168/elife-86168-fig5-data1-v2.zip
-
Figure 5—source data 2
Original table sources for quantification of Figure 5 plots.
- https://cdn.elifesciences.org/articles/86168/elife-86168-fig5-data2-v2.xlsx
Figure 5—figure supplement 1

The mRNA analysis in the mouse embryos.
Mouse embryos (E12.5) at the indicated embryonic days were prepared and reverse-transcriptional quantitative PCR (RT-qPCR) analysis of the mRNA levels of Kdm1a, Ezh2, Set7, Dcat5, and L3mbtl3 in the brain. The mRNA levels were measured in triplicate by RT-qPCR. Quantifications are represented by a bar graph with mean and standard deviation (S.D.) for error bars from three replicate samples and normalized to the control E12.5 embryo mRNAs and plotted.
Figure 6 with 4 supplements
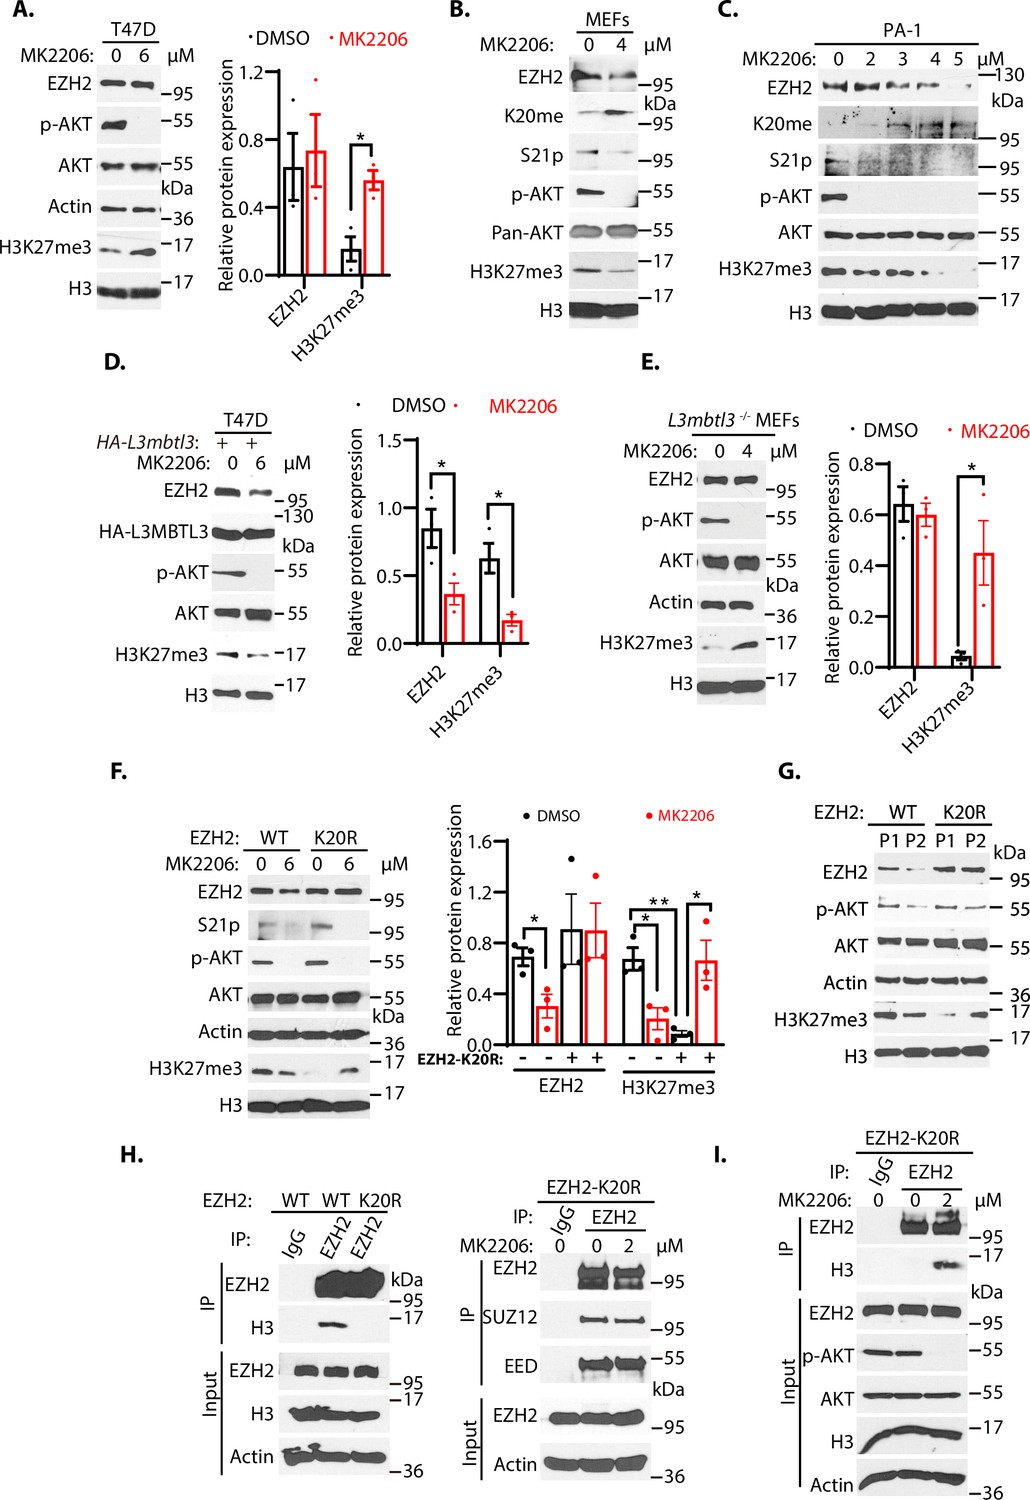
The methylation-phosphorylation switch regulates the stability of EZH2.
(A–C) T47D cells (A), mouse embryonic fibroblasts MEFs, (B), or PA-1 (C) were treated with AKT inhibitor MK2206 (2–6 μM) or dimethyl sulfoxide (control, DMSO) as indicated for 6 hr (A) or 4 hr 9 (B and C). Protein lysates were blotted with indicated antibodies. (D) T47D cells were transfected with the HA-L3mbtl3 expression construct for 48 hrs and the cells were then treated with or without 6 μM MK2206 for 4 hr. The indicated proteins were blotted with specific antibodies. (E) Primary L3mbtl3 (-/-) MEFs were cultured and the cells were treated with or without 4 μM MK2206 for 4 hr. The indicated proteins were blotted with specific antibodies. (F) Primary MEFs were obtained from the EZH2 wild-type and homozygous K20r mutant embryos (E14.5). They were treated with DMSO or MK2206 for 4 hr. Lysates were prepared and proteins were blotted with indicated antibodies. (G) Primary MEFs were obtained from the Ezh2 wild-type and homozygous K20r mutant mouse embryos (E14.5) and cultured as passage 1 (P1). They were passaged by splitting 1/3 and cultured as passage 2 (P2). Lysates were prepared and proteins were blotted with indicated antibodies. (H) Left: lysates from primary Ezh2 wild-type and K20r mutant MEFs were immunoprecipitated with antibodies against EZH2. The proteins were blotted with anti-EZH2 and histone H3 antibodies. Right: primary Ezh2 K20r mutant MEF lysates were immunoprecipitated and blotted with anti-EZH2, SUZ12, and EED antibodies as indicated. (I) Primary Ezh2 K20r mutant MEFs were treated with or without MK2206 (2 μM) for 4 hr. The lysates were immunoprecipitated by anti-EZH2 antibodies. and the blot was blotted with anti-histone H3 antibodies. The input lysates were also blotted for indicated proteins. For (A), (D), (E), and (F), protein band intensities were quantified and normalized to that of histone H3 or actin control. Significance was indicated as a two-tailed, unpaired, t-test. Values are expressed as the mean ± SEM. *p<0.05. **p<0.01.
-
Figure 6—source data 1
Original blots for Figure 6.
- https://cdn.elifesciences.org/articles/86168/elife-86168-fig6-data1-v2.zip
-
Figure 6—source data 2
Original table sources for quantification of Figure 6 plots.
- https://cdn.elifesciences.org/articles/86168/elife-86168-fig6-data2-v2.xlsx
Figure 6—figure supplement 1
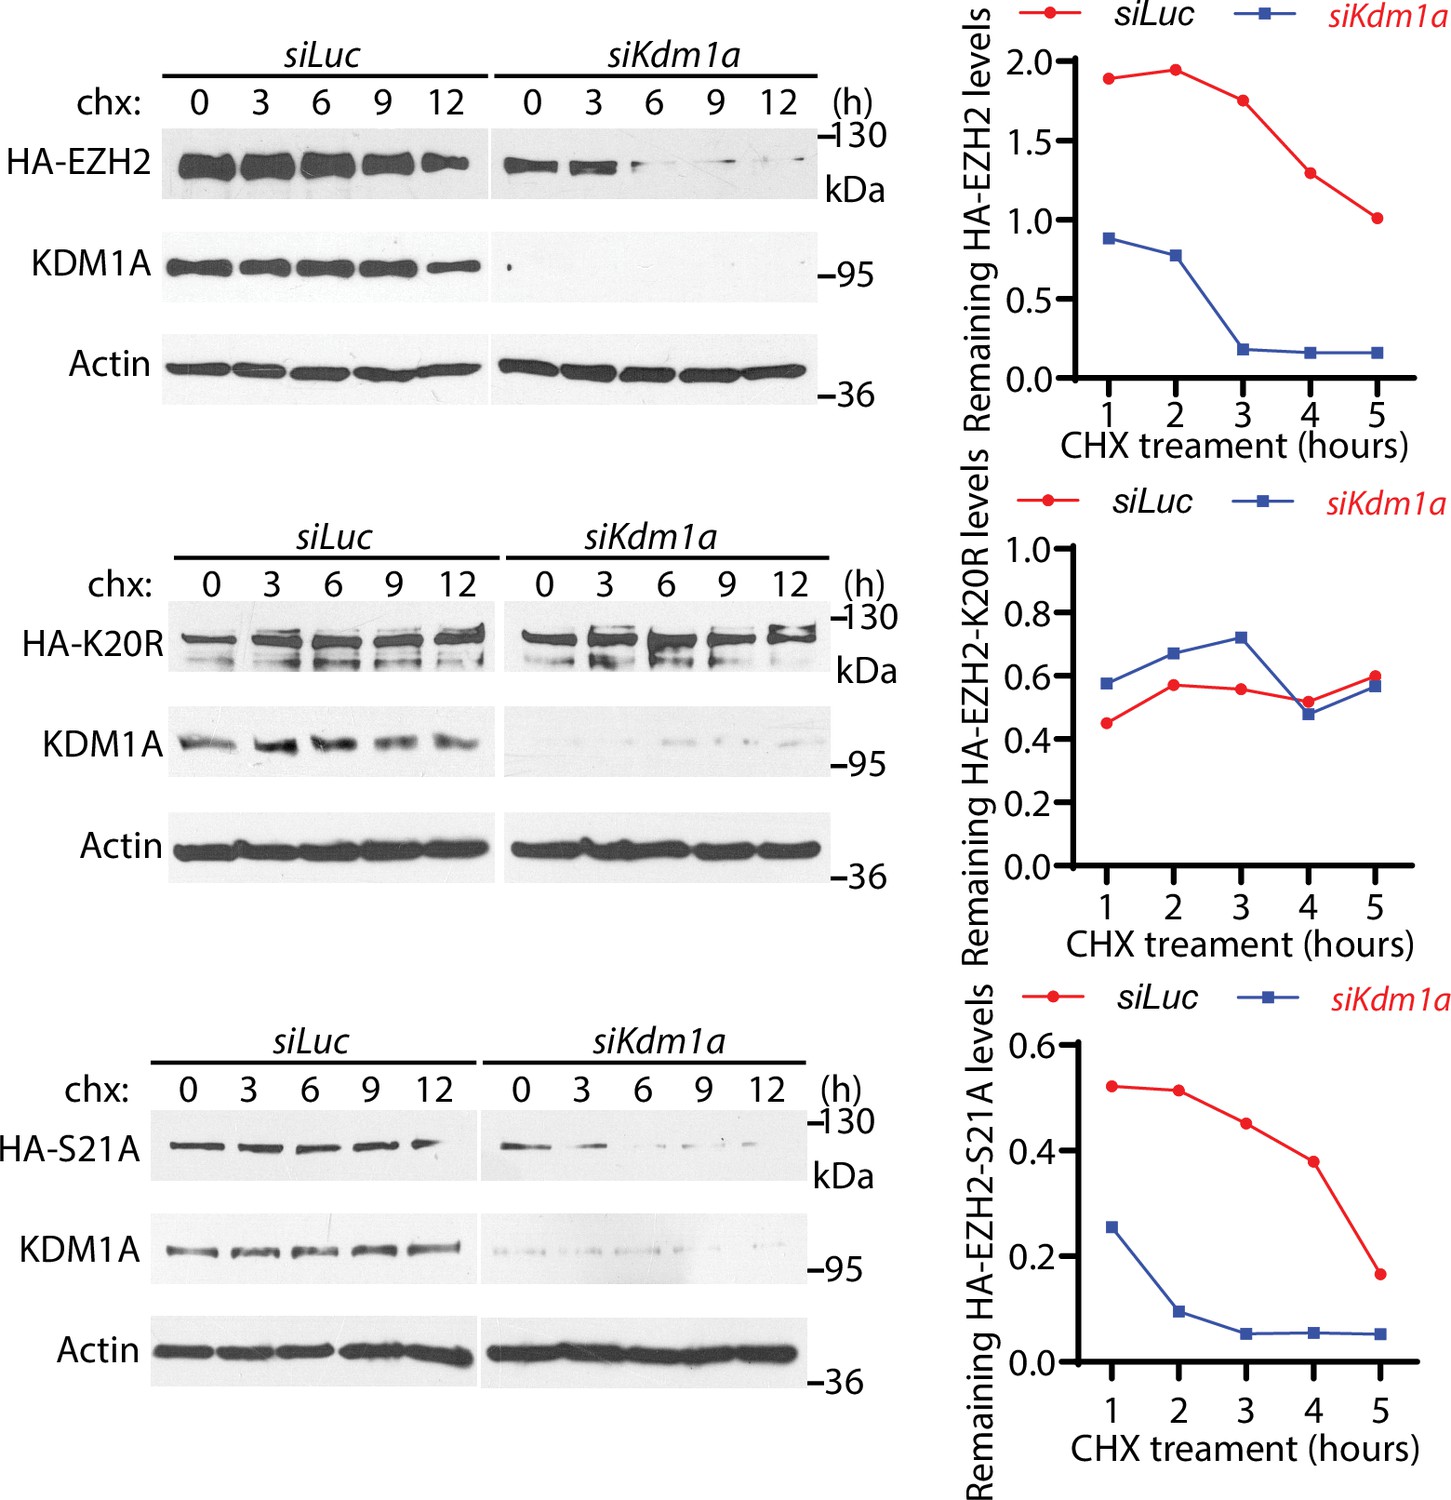
Regulation of EZH2 protein stability by K20 methylation with protein decay assays.
The HA-tagged Ezh2 wild-type, K20r, and S21a mutant expressing G401 cells were transfected with 50 nM siRNAs of luciferase or Kdm1a for 48 hr, treated with 100 μM cycloheximide (CHX), and collected at the indicated times to measure the half-lives of HA-EZH2 proteins by Western blotting. The protein intensities were quantified by ImageJ software and normalized to the intensity of HA-EZH2 proteins at the zero time when cycloheximide was added.
-
Figure 6—figure supplement 1—source data 1
Original blots for Figure 6—figure supplement 1.
- https://cdn.elifesciences.org/articles/86168/elife-86168-fig6-figsupp1-data1-v2.zip
Figure 6—figure supplement 2
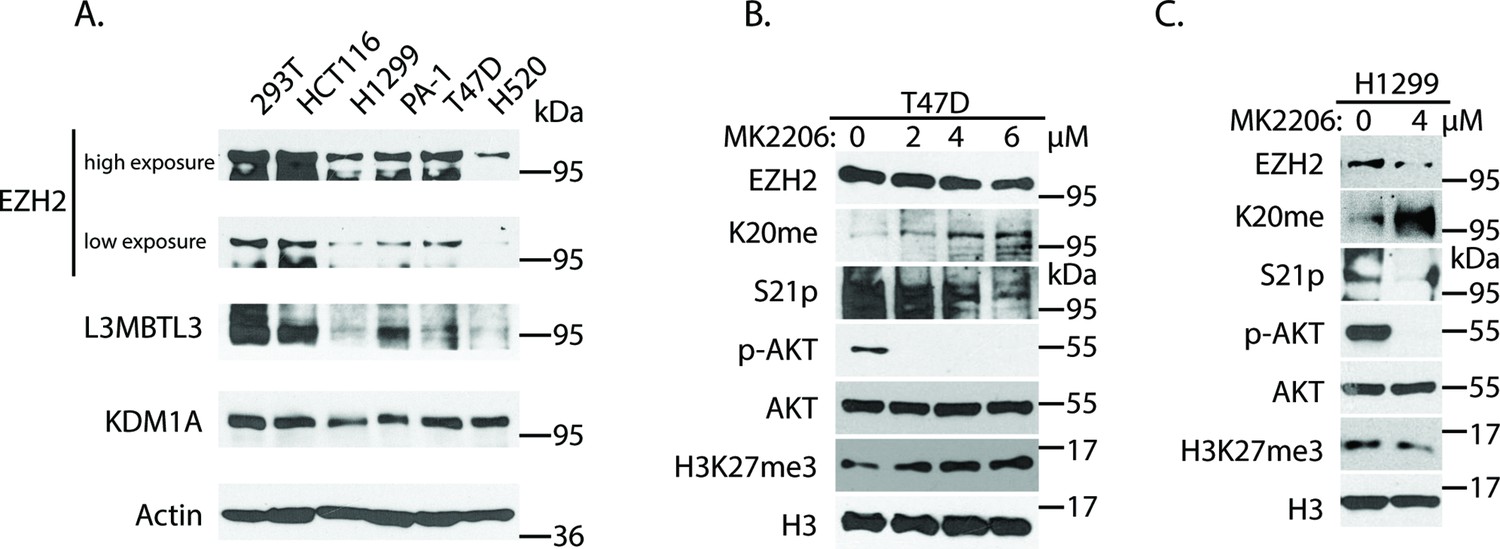
L3MBTL3 levels in various cancer cell lines.
Examination of L3MBTL3, EZH2, and KDM1A protein levels by West blotting in lysates from indicated cancer cell lines. (B) T47D cells were treated with various concentrations of MK2206 for 4 hr and indicated proteins were Western blotted. (C) H1299 cells were treated with or without 4 μM MK2206 for 4 hr and indicated proteins were Western blotted.
-
Figure 6—figure supplement 2—source data 1
Original blots for Figure 6—figure supplement 2.
- https://cdn.elifesciences.org/articles/86168/elife-86168-fig6-figsupp2-data1-v2.zip
Figure 6—figure supplement 3

Schematic demonstration of the mouse Ezh2 K20r knock-in mutagenesis and a representative DNA sequencing profile performed on the mouse K20r mutant of EZH2.
Figure 6—figure supplement 4
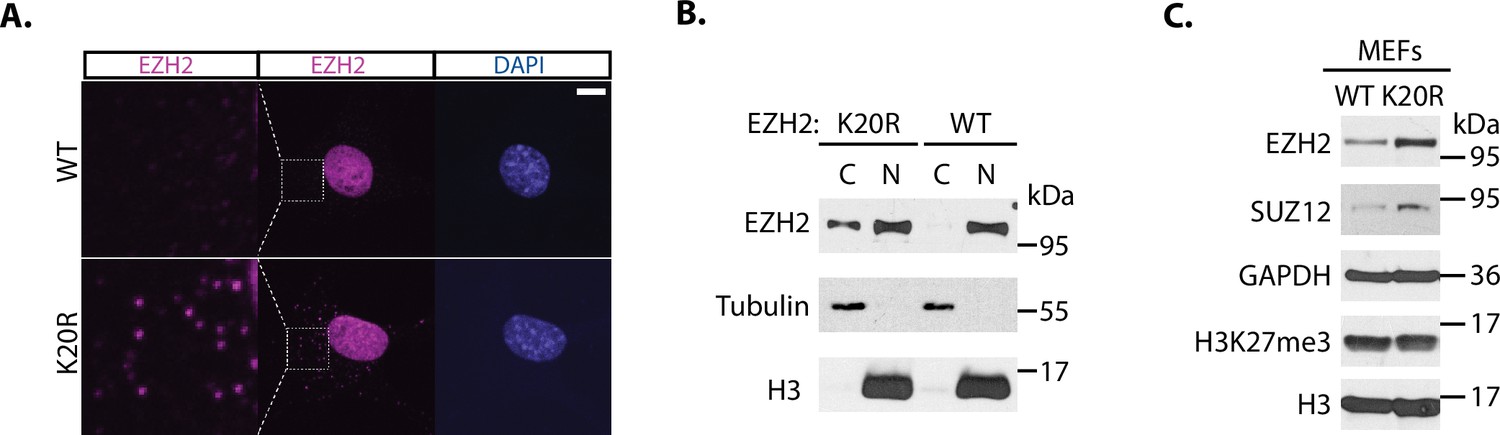
A fraction of K20R mutant protein is in the cytoplasm.
(A) The wild-type and Ezh2 K20r immortalized mouse embryonic fibroblasts (MEFs) were fixed for anti-EZH2 immunofluorescence staining for EZH2, counter-stained with DNA dye, 4′,6-diamidino-2-phenylindole (DAPI). Cell images were acquired with a Nikon ECLIPSE Ti-S microscope. (B) Cellular fractionation of the wild-type and Ezh2 K20r MEFs into the cytoplasm (C) and nuclear (N) fractions. Proteins were blotted with anti-EZH2, histone H3, and tubulin. (C) Primary wild-type and Ezh2 K20r MEFs were analyzed by Western blotting for indicated proteins.
-
Figure 6—figure supplement 4—source data 1
Original photos and blots for Figure 6—figure supplement 4.
- https://cdn.elifesciences.org/articles/86168/elife-86168-fig6-figsupp4-data1-v2.zip
Figure 7 with 2 supplements
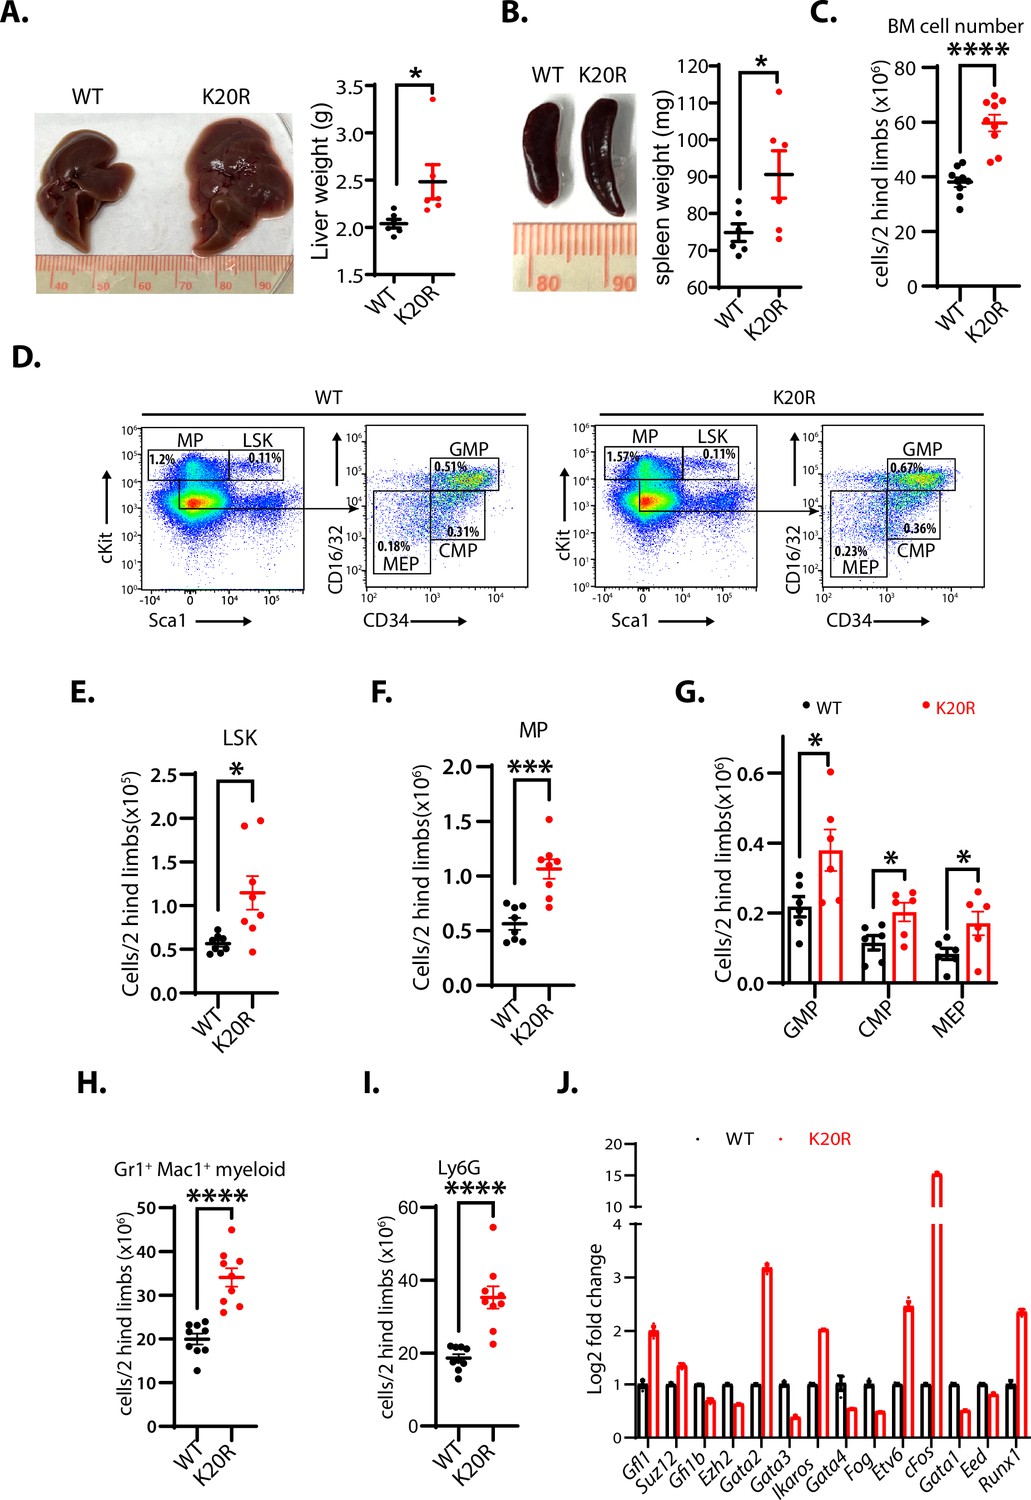
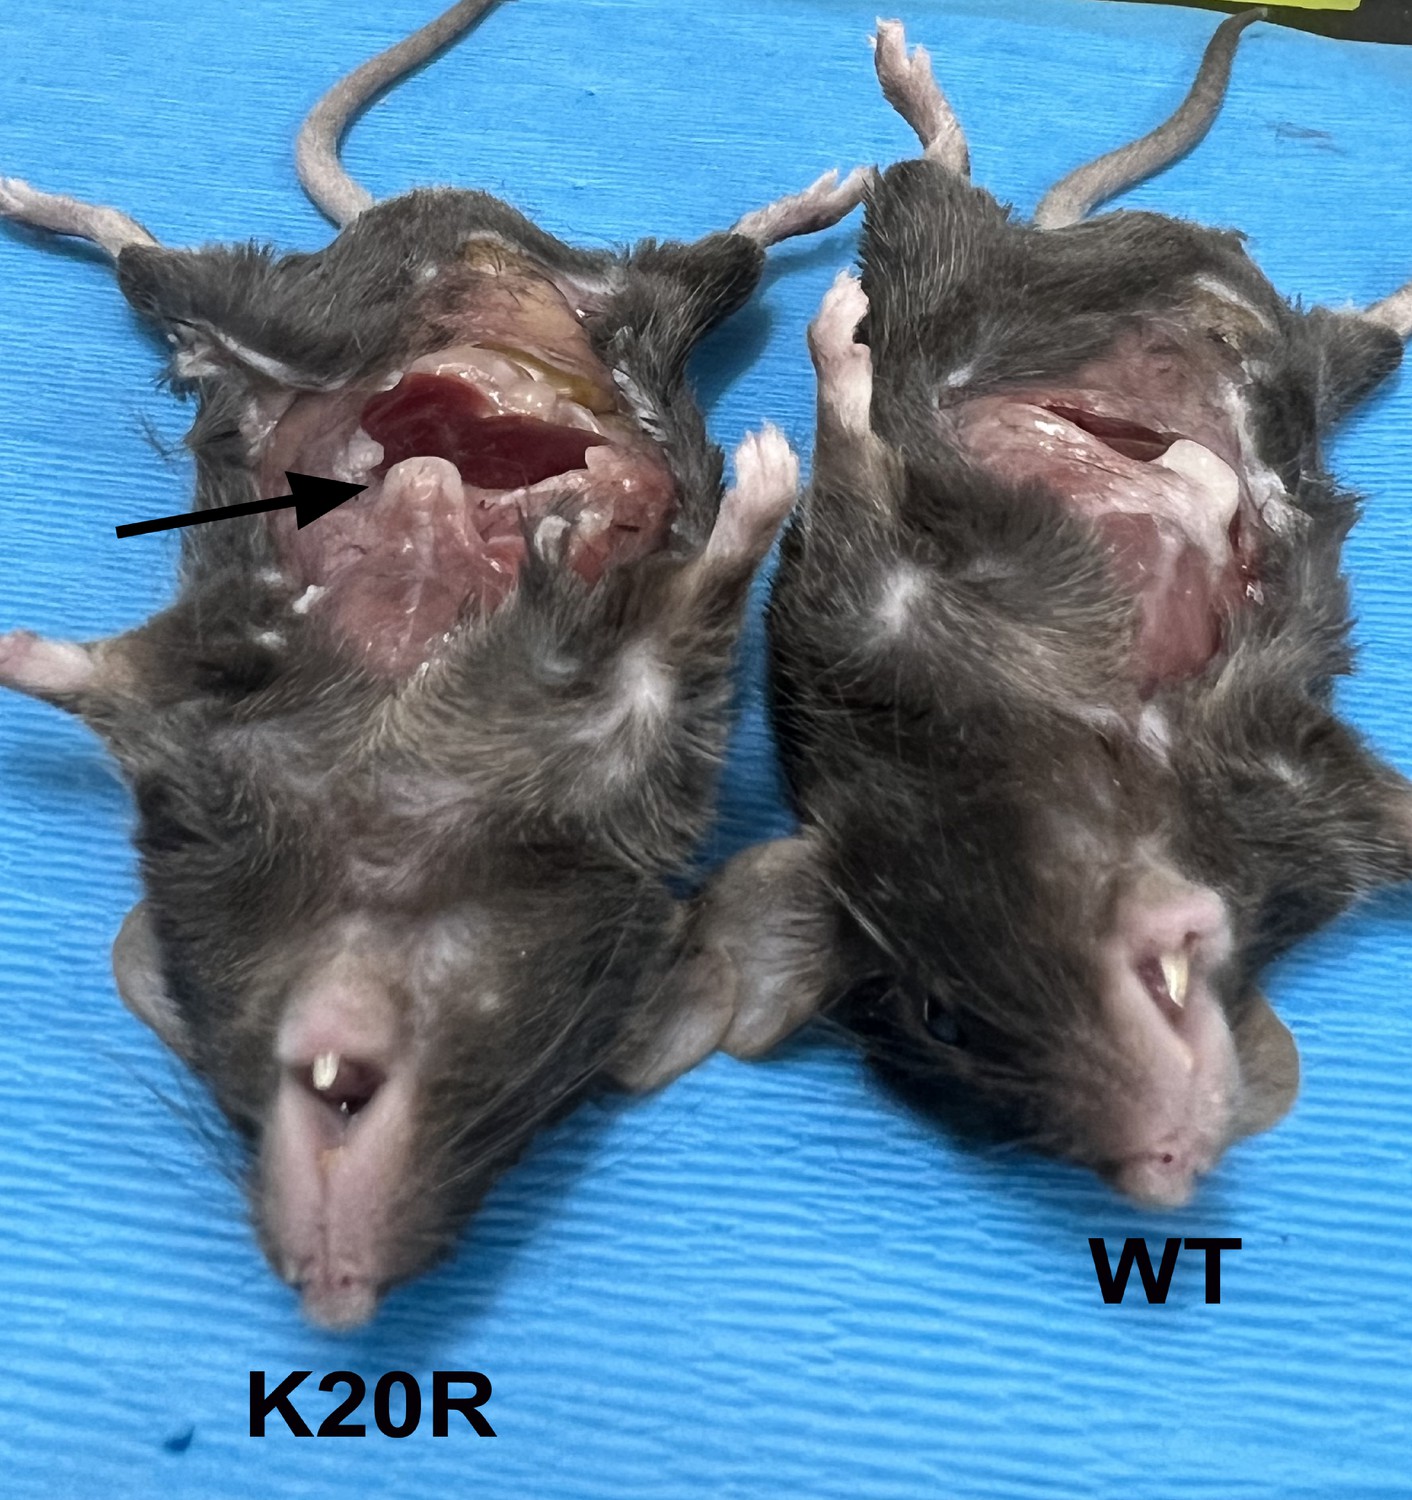
K20R mutation causes hepatosplenomegaly and expansion of hematopoietic populations.
(A and B) The enlarged liver or spleen from the homozygous K20r mutant mice, as compared to that of the Ezh2 wild-type mice (8 months old). The weights of livers or spleens from the K20r and wild-type Ezh2 mice (7~10-month-old) were measured and plotted. Values are means ± SEM (N=6, *P<0.05). (C) Number of total cells in bone marrows harvested from 5-month-old K20r and wild-type Ezh2 mice. Values are means ± SEM (n=9, ****p<0.0001). (D–F) Representative flow cytometric (FACS) profiles of bone marrow cells from the K20r and Ezh2 wild-type mice. Flow cytometry plots were gated on the Lin-cKit+ (myeloid progenitors) subpopulation that is subclassified into common myeloid progenitor (CMP), granulocyte-monocyte progenitor (GMP), and myeloid erythroid progenitor (MEP) based on Lin-cKit+ CD16/32 and CD34 expression. The number of immature cells Lin-cKit+Scal1+(E), Lin-cKit+ (F), CMP, GMP, and MEP in (G), and differentiated cells Mac1+Gr1+ myeloid (H) and Ly6.6G myeloid (I) in bone marrow samples harvested from the Ezh2 wild-type and K20r mutant mice. Values are means ± SEM (n=6–9). Significance was indicated as a two-tailed, unpaired, t-test. *p<0.05.***p<0.001. ****p<0.0001. (J) The quantitative RT-PCR (qRT-PCR) analysis shows mRNA expression levels of indicated genes in bone marrow samples harvested from the Ezh2 wild-type and K20r mutant mice.
-
Figure 7—source data 1
Original photos for Figure 7.
- https://cdn.elifesciences.org/articles/86168/elife-86168-fig7-data1-v2.zip
-
Figure 7—source data 2
Original table sources for quantification of Figure 7 plots.
- https://cdn.elifesciences.org/articles/86168/elife-86168-fig7-data2-v2.xlsx
Figure 7—figure supplement 1
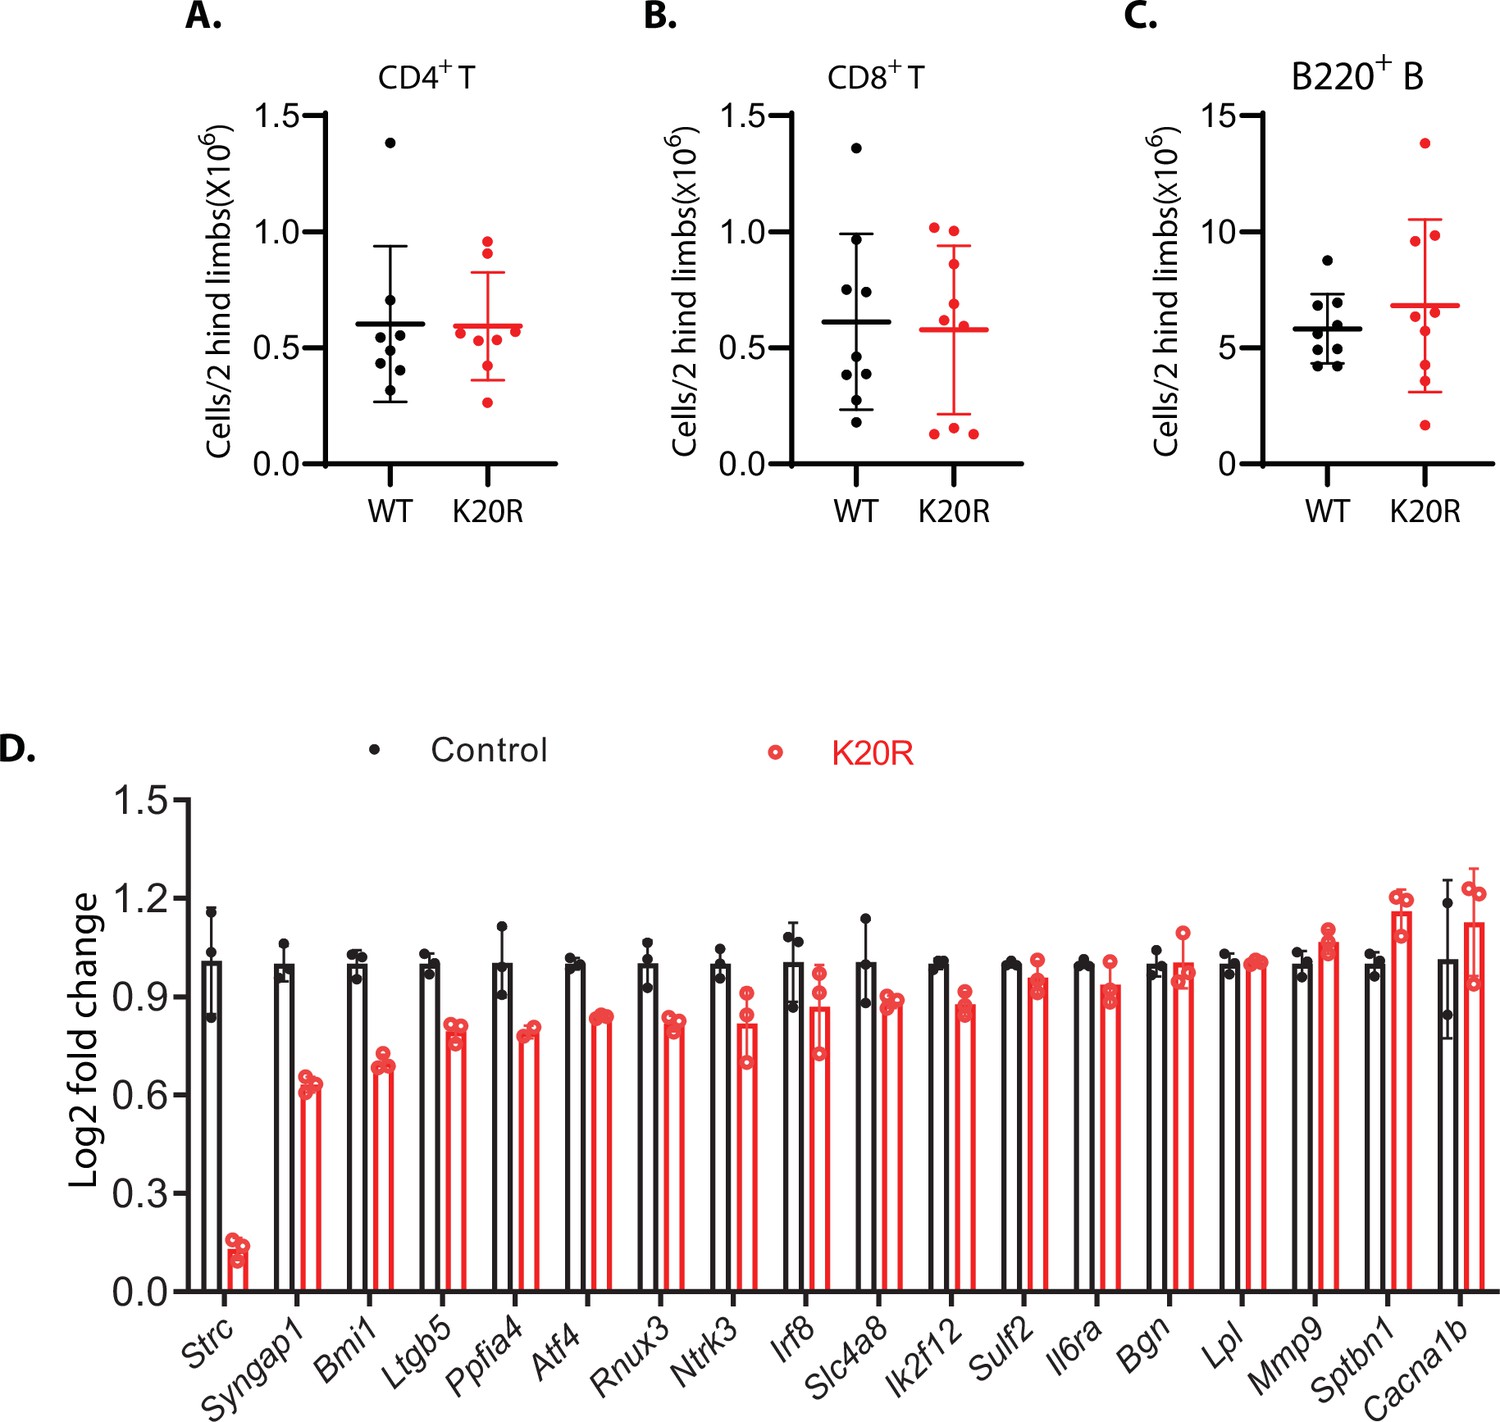
Effects of K20R mutation in T and B cells.
(A–C) Representative flow cytometric profiles of bone marrow cells harvested from the wild-type control and K20r mutant mice. Flow cytometric plots were gated on the CD4+ and CD8+ T cells (A and B) and B cells (C), B220+. Values are means ± SEM (n=6–9). Significance levels were indicated as a two-tailed, unpaired, t-test. (D) The quantitative RT-PCR (qRT-PCR) analysis shows mRNA expression levels of indicated genes in bone marrow samples harvested from the Ezh2 wild-type and K20r mutant mice.
Figure 7—figure supplement 2
Other defects of K20r mutation in the mouse.
The wild-type and homozygous K20r mutant mice (9-month-old) were examined and the xiphoid process of K20r mutant mice was more pronounced and harder than that of the wild-type mice.
-
Figure 7—figure supplement 2—source data 1
Original photo for Figure 7—figure supplement 2.
- https://cdn.elifesciences.org/articles/86168/elife-86168-fig7-figsupp2-data1-v2.zip
Figure 8 with 1 supplement
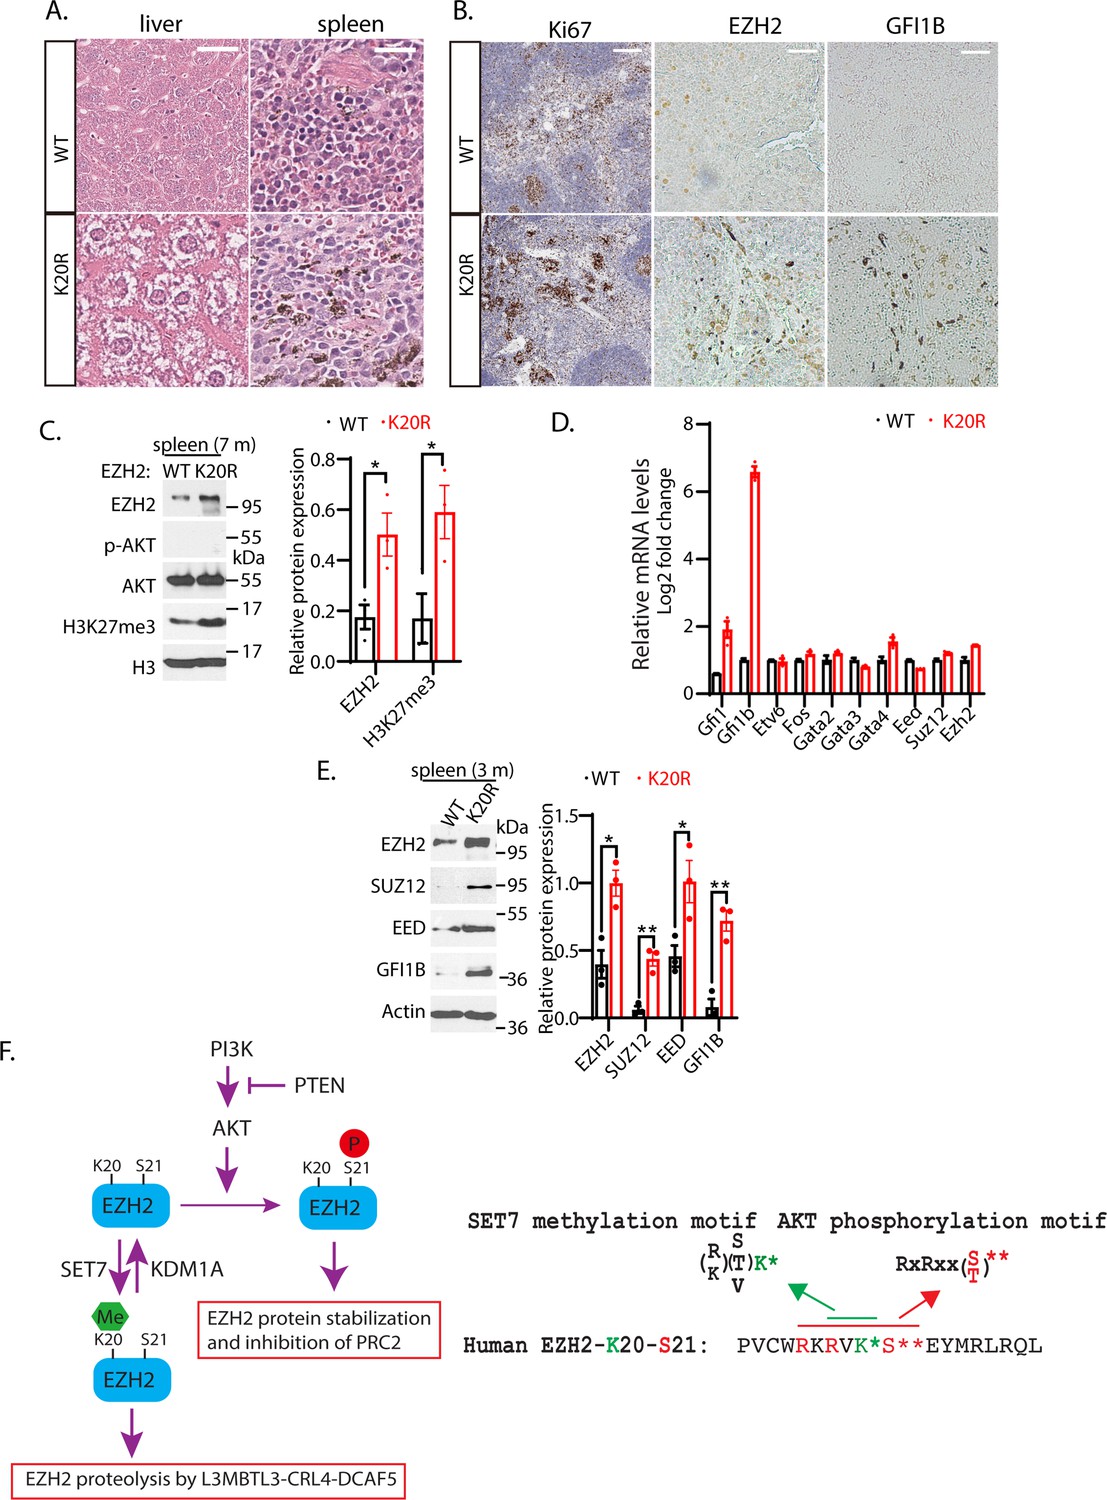
K20R mutation induces hyperplasia in the mouse spleen.
(A) Hematoxylin and eosin (H&E) histological staining of liver and spleen sections from the K20r and Ezh2 wild-type mice (8-month-old). Scale bar: 200 μm. (B) The anti-Ki67 and anti-GFI1B immunostaining of spleen sections from the K20r and Ezh2 wild-type mice (8-month-old). Scale bar: 50 mm. (C) Left: protein lysates were extracted from the spleen of the K20r and Ezh2 wild-type mice and blotted with indicated antibodies. Right: band intensities were quantified and normalized to that of histone H3 control. Significance was indicated as a two-tailed, unpaired, t-test. Values are expressed as the mean ± SEM. *p<0.05. (D) RNA levels of indicated hematopoietic regulatory genes were measured by quantitative RT-PCR (RT-qPCR) from the spleens of the Ezh2 wild-type and K20r mice (4-month-old). The mRNA levels were measured in triplicate by RT-qPCR. (E) Protein lysates were extracted from the spleens of the Ezh2 wild-type and K20r mice and detected with anti-EZH2, SUZ12, EED, and GFI1B antibodies, using the actin antibody as a control. The protein band intensity values are means ± SEM (n=3). Significance is indicated as a two-tailed, unpaired, t-test. *p<0.05.**p<0.01. (F) Model: Left panel: The lysine residue 20 (K20) of EZH2 is methylated by SET7 methyltransferase and the level of methylated K20 is reversibly removed by KDM1A demethylase. L3MBTL3 preferentially binds to the methylated K20 in EZH2 to recruit the CRL4DCAF5 ubiquitin E3 ligase complex to target the methylated EZH2 for ubiquitin-dependent proteolysis. Right panel: The K20 methylation is negatively regulated by the phosphorylation of serine 21 (S21) by the PI3K-activated AKT. Conversely, the S21 phosphorylation is mutually exclusive to the methylation of K20, resulting in the methylation-phosphorylation switch to control the activity and proteolysis of EZH2 for H3K27 trimethylation.
-
Figure 8—source data 1
Original photos and bots for Figure 8.
- https://cdn.elifesciences.org/articles/86168/elife-86168-fig8-data1-v2.zip
-
Figure 8—source data 2
Original table sources for quantification of Figure 8 plots.
- https://cdn.elifesciences.org/articles/86168/elife-86168-fig8-data2-v2.xlsx
Figure 8—figure supplement 1
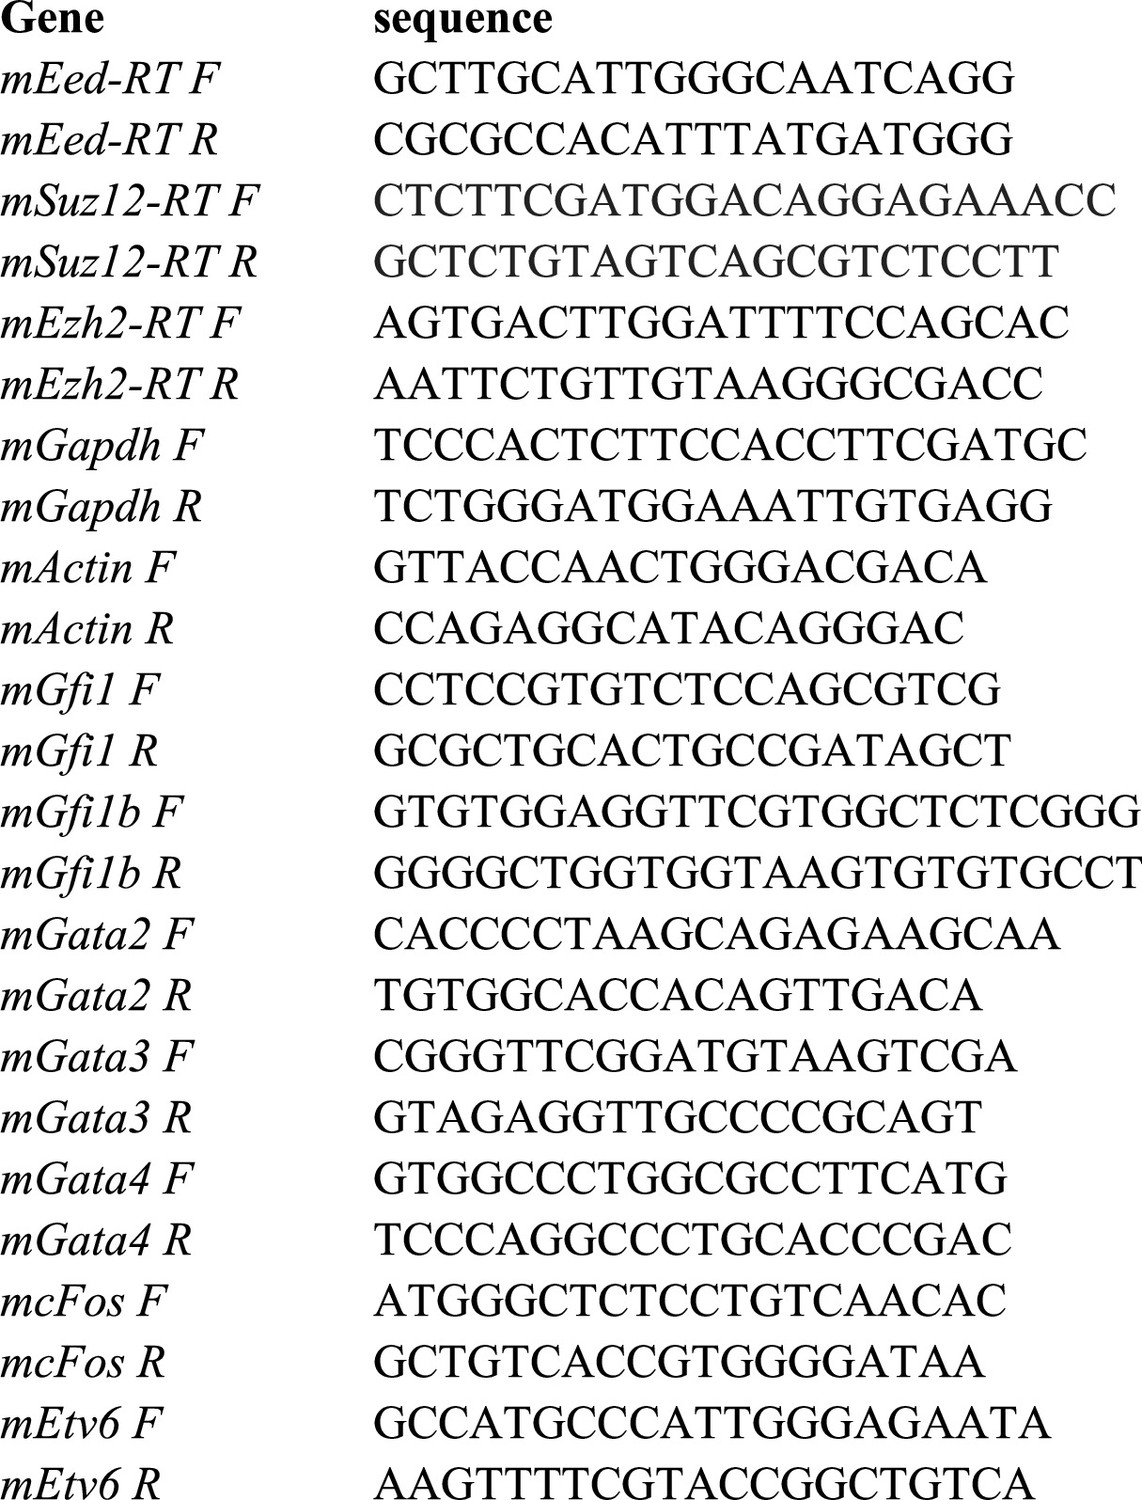
The list of DNA oligonucleotide primers for RT-PCR.
Author response image 1
Author response image 2

Tables
Appendix 1—key resources table
| Reagent type (species) or resource | Designation | Source or reference | Identifiers | Additional information |
|---|---|---|---|---|
| Gene (Homo sapiens) | EZH2 | RefSeq | 2146, NM_001203247.2 | DNA sequencing authentication. |
| Strain (Mus musculus) | Kdm1afl/+conditional mutant strain | Jackson Laboratory | B6.129-Kdm1a tm1.1Sho/J; Strain #: 023969 | Kerenyi et al., 2013 |
| Strain (Mus musculus) | Transgenic actin-Cre-ER strain | Jackson Laboratory | CAGGCre-ER, B6.Cg-Tg(CAG-cre/Esr1*) 5Amc/J; Strain #: 004682 | Hayashi and McMahon, 2002 |
| Strain (Mus musculus) | Transgenic Vav-iCre transgenic mice | Jackson Laboratory | B6.Cg-Commd10Tg(Vav1-icre)A2Kio/J; Strain #:008610 | de Boer et al., 2003 |
| Strain (Mus musculus) | transgenic Sox2-Cre strain | Jackson Laboratory | B6.Cg-Edil3Tg(Sox2-cre)1Amc/J; Strain #: 008454 | Hayashi et al., 2002 |
| Strain (Mus musculus) | L3mbt3+/-mutant strain | Leng et al., 2018, | Mbt-1+/-, B6;129-L3mbtl3tm1Tmiy | Arai and Miyazaki, 2005 |
| Strain (Mus musculus) | Dcaf5+/-mutant strain | This paper | Centre for Phenogenomics (Toronto, Canada) | produced with gRNA1: CTAGTTAGGTACAATAGGGC and gRNA2: TATTCCTCTGCGACCACTCA. |
| Strain (Mus musculus) | L3mbtl3fl/+ mutant strain | European Mouse Mutant Cell Repository (EuMMCR) | L3mbtl3tm1a(EUCOMM) Hmgu mice | Produced with the FLPo-10 mouse strain. |
| Strain (Mus musculus) | FLPo-10 mouse strain | Jackson Laboratory | B6.Cg-Tg(Pgk1-flpo)10Sykr/J; Strain #: 011065 | Wu et al., 2009 |
| Cell line (Homo sapiens) | 293T | ATCC | CRL-3216 | Authenticated by high levels of CDK inhibitor CDKN2A and p53 |
| Cell line (Homo sapiens) | HCT116 | ATCC | CCL-247 | Authenticated by expression of wild- type p53 and induction of CDKN1A by UV irradiation |
| Cell line (Homo sapiens) | G401 | CRL-1441 | ATCC | Authenticated by lack of expression of SMARCB1 |
| Cell line (Homo sapiens) | T47D | ATCC | HTB-133 | Authenticated by lack of ARID1A expression |
| Cell line (Homo sapiens) | HeLa | ATCC | CRM-CCL-2 | Authenticated by high levels of CDK inhibitor CDKN2A and p53 |
| Cell line (Homo sapiens) | PA-1 | ATCC | CRL-1572 | Authenticated by expression of SOX2 and OCT4 |
| Cell line (Homo sapiens) | H1299 (NCI-H1299) | ATCC | CRL-5803 | Authenticated by lack of p53 |
| Cell line (Homo sapiens) | H520 (NCI-H520) | ATCC | HTB-182 | Authenticated by high expression of SOX2 |
| Cell line (Mus musculus) | Mouse embryonic fibroblasts (MEFs) | This paper | Primary embryonic fibroblasts from isolated mouse embryos | Primary cells; prepared according to IACUC approved protocols (IACUC-01161) 711621 and (IACUC-01177)832146. |
| Cell line (Mus musculus) | Mouse embryonic fibroblasts (MEFs) from K20R mutant mice | This paper | Mouse embryonic fibroblasts (MEFs) from homozygous Ezh2K20R/K20R mutant mice | Primary cells; prepared according to IACUC approved protocols (IACUC-01161) 711621 and (IACUC-01177)832146. |
| Cell line (Mus musculus) | L3mbtl3-knockout MEFs | This paper | MEFs from homozygous L3mbtl3 KO mutant mice | Primary cells; prepared according to IACUC approved protocols (IACUC-01161)711621 and (IACUC-01177)832146. |
| Cell line (Mus musculus) | Kdm1afl/fl MEFs | This paper | MEFs from homozygous Kdm1afl/fl mutant mice | Primary cells; prepared according to IACUC approved protocols (IACUC-01161) 711621 and (IACUC-01177)832146. |
| Cell line (Mus musculus) | L3mbtl3tm1a(EUCOMM)Hmgu (L3mbtl3fl/fl) | This paper | MEFs from homozygous (L3mbtl3fl/fl) mice | Primary cells; prepared according to IACUC approved protocols (IACUC-01161) 711621 and (IACUC-01177)832146. |
| Cell line (Mus musculus) | Kdm1afl/fl/ L3mbtl3fl/fl/ actin-Cre-ER | This paper | Kdm1afl/fl/ L3mbtl3fl/fl/ actin-Cre-ER | Primary cells; prepared according to IACUC approved protocols (IACUC-01161) 711621 and (IACUC-01177)832146. |
| Transfected construct (human) | Kdm1a siRNA #1 | Synthesized from Horizon Discovery | Guo et al., 2022 | transfected construct (human) |
| Transfected construct (human) | Kdm1a siRNA #2 | Synthesized from Horizon Discovery | Guo et al., 2022 | transfected construct (human) |
| Transfected construct (human) | Kdm1a-3’UTR siRNA | Synthesized from Horizon Discovery | Guo et al., 2022 | transfected construct (human) |
| Transfected construct (human) | Dcaf5-1 siRNA #1 | Synthesized from Horizon Discovery | Guo et al., 2022 | transfected construct (human) |
| Transfected construct (human) | Dcaf5-2 siRNA #1 | Synthesized from Horizon Discovery | Guo et al., 2022 | transfected construct (human) |
| Transfected construct (human) | L3mbtl3-1 siRNA #1 | Synthesized from Horizon Discovery | Guo et al., 2022 | transfected construct (human) |
| Transfected construct (human) | L3mbtl3-2 siRNA #1 | Synthesized from Horizon Discovery | Guo et al., 2022 | transfected construct (human) |
| Transfected construct (human) | Set7-1 siRNA #1 | Synthesized from Horizon Discovery | Guo et al., 2022 | transfected construct (human) |
| Transfected construct (human) | Set7-2 SMART pool | Synthesized from Horizon Discovery | Guo et al., 2022 | transfected construct (human) |
| Antibody | Anti-KDM1A antibody | Fortis Life Sciences | A300-215A | IF(1:1000), WB (1:1000) |
| Antibody | anti-L3MBTL3 antibody | Fortis Life Sciences | A302-852 | IF(1:1000), WB (1:1000) |
| Antibody | anti-SUZ12 antibody | Fortis Life Sciences | A302-407A | IF(1:1000), WB (1:1000) |
| Antibody | anti-SET7 antibody | Fortis Life Sciences | A301-747A | IF(1:1000), WB (1:1000) |
| Antibody | Anti-EED antibody | Abcam | ab236292 | IF(1:1000), WB (1:1000) |
| Antibody | Anti-Phospho-EZH2 (S21) | Affinity Biosciences | AF3822 | IF(1:1000), WB (1:1000) |
| Antibody | Anti-K20me antibody | This paper | Affinity purified Anti-K20me antibody | IF(1:1000), WB (1:1000) |
| Antibody | anti-GFI1B antibody | Cell Signaling Technology | 5849 | IF(1:1000), WB (1:1000) |
| Antibody | Anti-EZH2 antibody | Cell Signaling Technology | 5246 | IF(1:1000), WB (1:1000) |
| Antibody | anti-H3K27me3 antibody | Cell Signaling Technology | 9733 | IF(1:1000), WB (1:1000) |
| Antibody | Anti-Actin antibody | Santa Cruz Biotechnologies | Sc-1616 | WB (1:5000) |
| Antibody | Anti-FLAG M2 antibody | Sigma | F1804 | WB (1:5000) |
| Antibody | ant-HA antibody | Sigma | 11867423001 | WB (1:5000) |
| Antibody | anti-GFP antibody | Sigma | 11814460001 | WB (1:5000) |
| Antibody | Anti-GAPDH | Proteintech | 60004–1-Ig | WB (1:5000) |
| Antibody | Rabbit anti-L3MBTL3 | This paper | Guo et al., 2022 | IP(1:1000), WB (1:1000) |
| Antibody | Anti-DCAF5 antibody | This paper | Guo et al., 2022 | IP(1:1000), WB (1:1000) |
| Commercial assay or kit | Lipofectamine 2000 Transfection Reagent | Thermo Fisher Scientific | 11668019 | |
| Commercial assay or kit | Oligofectamine Regent | Thermo Fisher Scientific | 2399123 | |
| Commercial assay or kit | DharmaFECT 1 Transfection Reagent | Horizon Discovery | T-2001–03 | |
| Commercial assay or kit | TRIzol reagent | Life Technologies | 423707 | |
| Commercial assay or kit | SuperScript III First-Strand Synthesis System for RT-PCR | Life Technologies | 2490151 | |
| Commercial assay or kit | E.Z.N.A TISSUE DNA Kit | Omega | d3396-02 | |
| Commercial assay or kit | Sulfolinkcoupled-resins | ThermoFisher Scientific | XC339981 | |
| Recombinant DNA reagent | pMSCV--Puro vector | Clontech | 634401 | |
| Recombinant DNA reagent | pEGFP-C1 | Clontech | 6084–1 | |
| Recombinant DNA reagent | pCDNA3.1-puro vector | Invitrogen | Size: 5446 NT | |
| Recombinant DNA reagent | pKH3-vector | Addgene | 12555 |
Additional files
-
MDAR checklist
- https://cdn.elifesciences.org/articles/86168/elife-86168-mdarchecklist1-v2.docx
-
Supplementary file 1
Final list of oliognucleotide primers for RT-PCR.
- https://cdn.elifesciences.org/articles/86168/elife-86168-supp1-v2.xlsx
Download links
A two-part list of links to download the article, or parts of the article, in various formats.
Downloads (link to download the article as PDF)
Open citations (links to open the citations from this article in various online reference manager services)
Cite this article (links to download the citations from this article in formats compatible with various reference manager tools)
A methylation-phosphorylation switch controls EZH2 stability and hematopoiesis
eLife 13:e86168.
https://doi.org/10.7554/eLife.86168


