Death by a thousand cuts through kinase inhibitor combinations that maximize selectivity and enable rational multitargeting
- Department of Pharmacological Sciences, Stony Brook University, United States
- Computational and Systems Biology Program, Sloan Kettering Institute, Memorial Sloan Kettering Cancer Center, United States
- Institute of Pharmaceutical Chemistry, Goethe University Frankfurt, Germany
- Structural Genomics Consortium, Buchmann Institute for Life Sciences, Goethe University Frankfurt, Germany
Figures
Figure 1 with 1 supplement
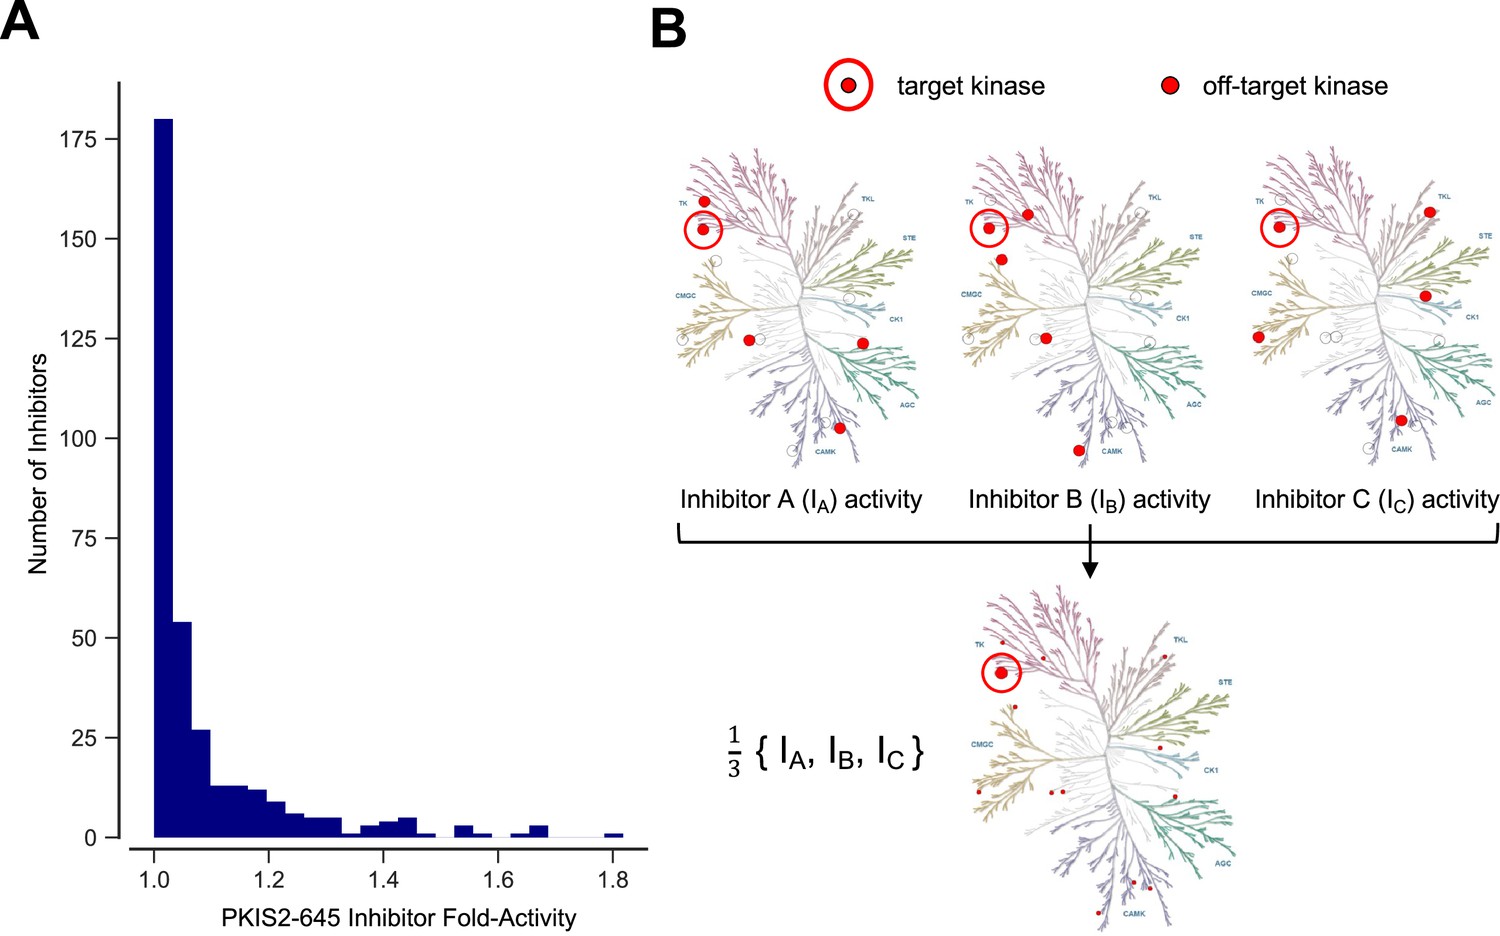
Inhibitor combinations can reduce off-target activity.
(A) Selectivity of kinase inhibitors is limited. Fold activity is the PKIS2 activity of each PKIS2-645 inhibitor against the kinase target it is maximally active against versus the target it is second most active against when screened at 1 µM in the DiscoverX KINOMEscan competitive displacement assay. No inhibitor has even twofold activity for its primary target versus its secondary target. PKIS2-645 inhibitors with 100% activity against multiple targets were excluded from the analysis. (B) Illustrative inhibition profiles of three hypothetical kinase inhibitors with equal activity against a target of interest and different off-targets; a combination of the three inhibitors retains on-target inhibition while diluting off-target effects.
Figure 1—figure supplement 1
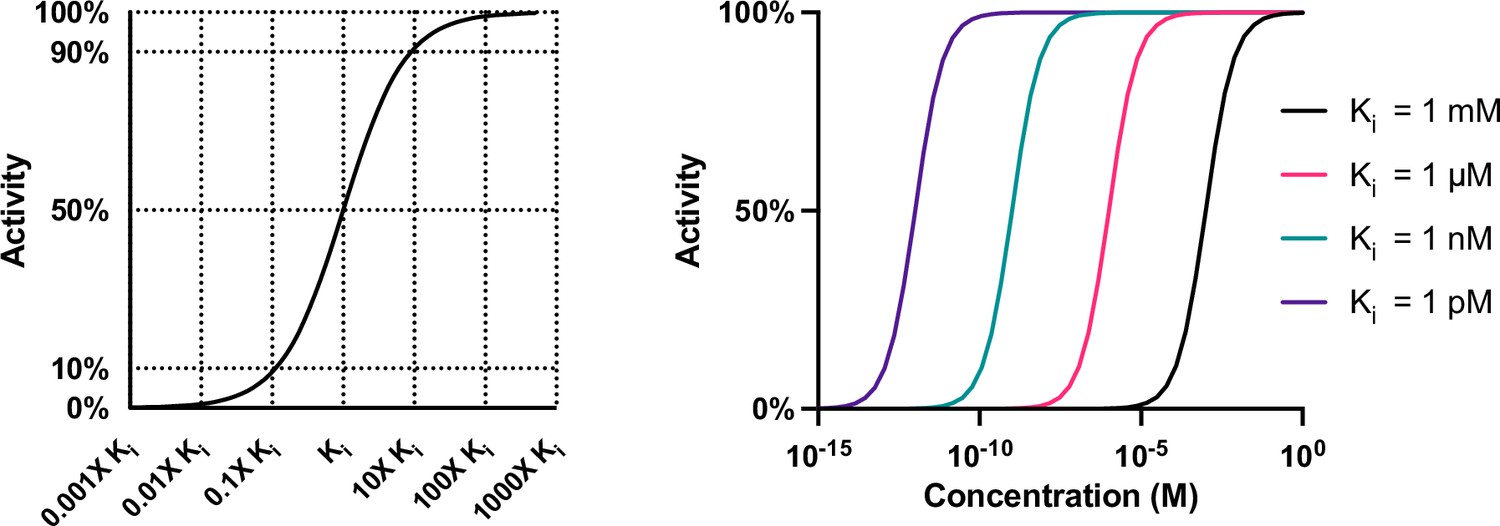
Compound activity is a function of potency and concentration.
The change in the activity of a compound is greatest when the concentration of a compound is altered within tenfold (either greater or less than) of the Ki of that compound for a target. Compounds with Kis that are thousand-fold different may still have similar activities if dosed at very high or low concentrations.
Figure 2 with 3 supplements
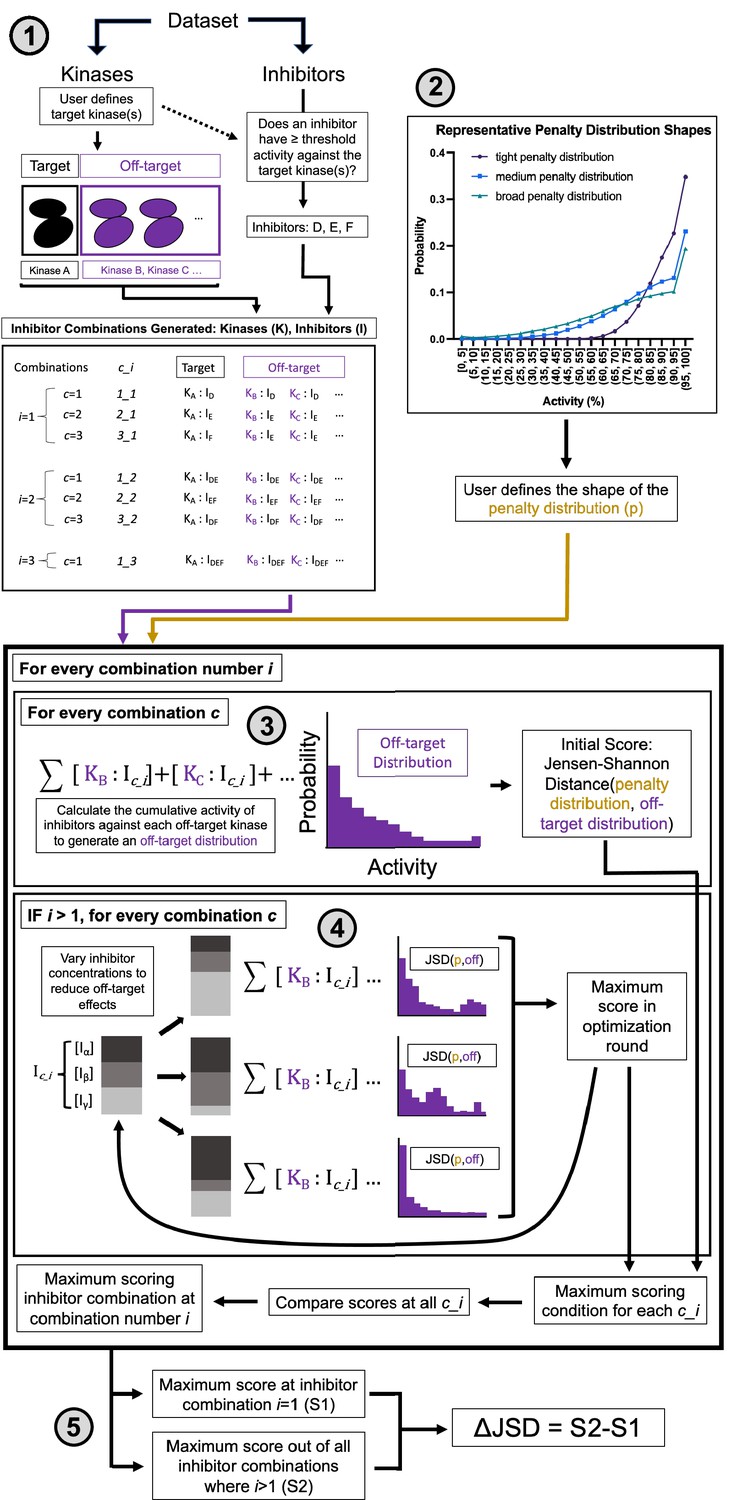
Multicompound–multitarget scoring (MMS) predicts optimally selective inhibitor combinations.
(1) Combinations of sufficiently potent inhibitors are identified and enumerated where i is the number of inhibitors in a combination and c is a unique combination of inhibitors for each i. (2) A user-selected distribution shape (e.g. Poisson pmf) and associated user-selected parameters generate a penalty distribution, which defines what range of off-target activity will be penalized and by how much. (3) The cumulative activity of combinations of inhibitors is calculated, and (4) the relative concentration of inhibitors is adjusted to maximize the Jensen–Shannon distance (JSD) score. (5) The highest scoring combination of inhibitors is compared to the most selective single inhibitor. If the combination has a higher score (positive ΔJSD), then it is predicted to be maximally selective.
Figure 2—figure supplement 1
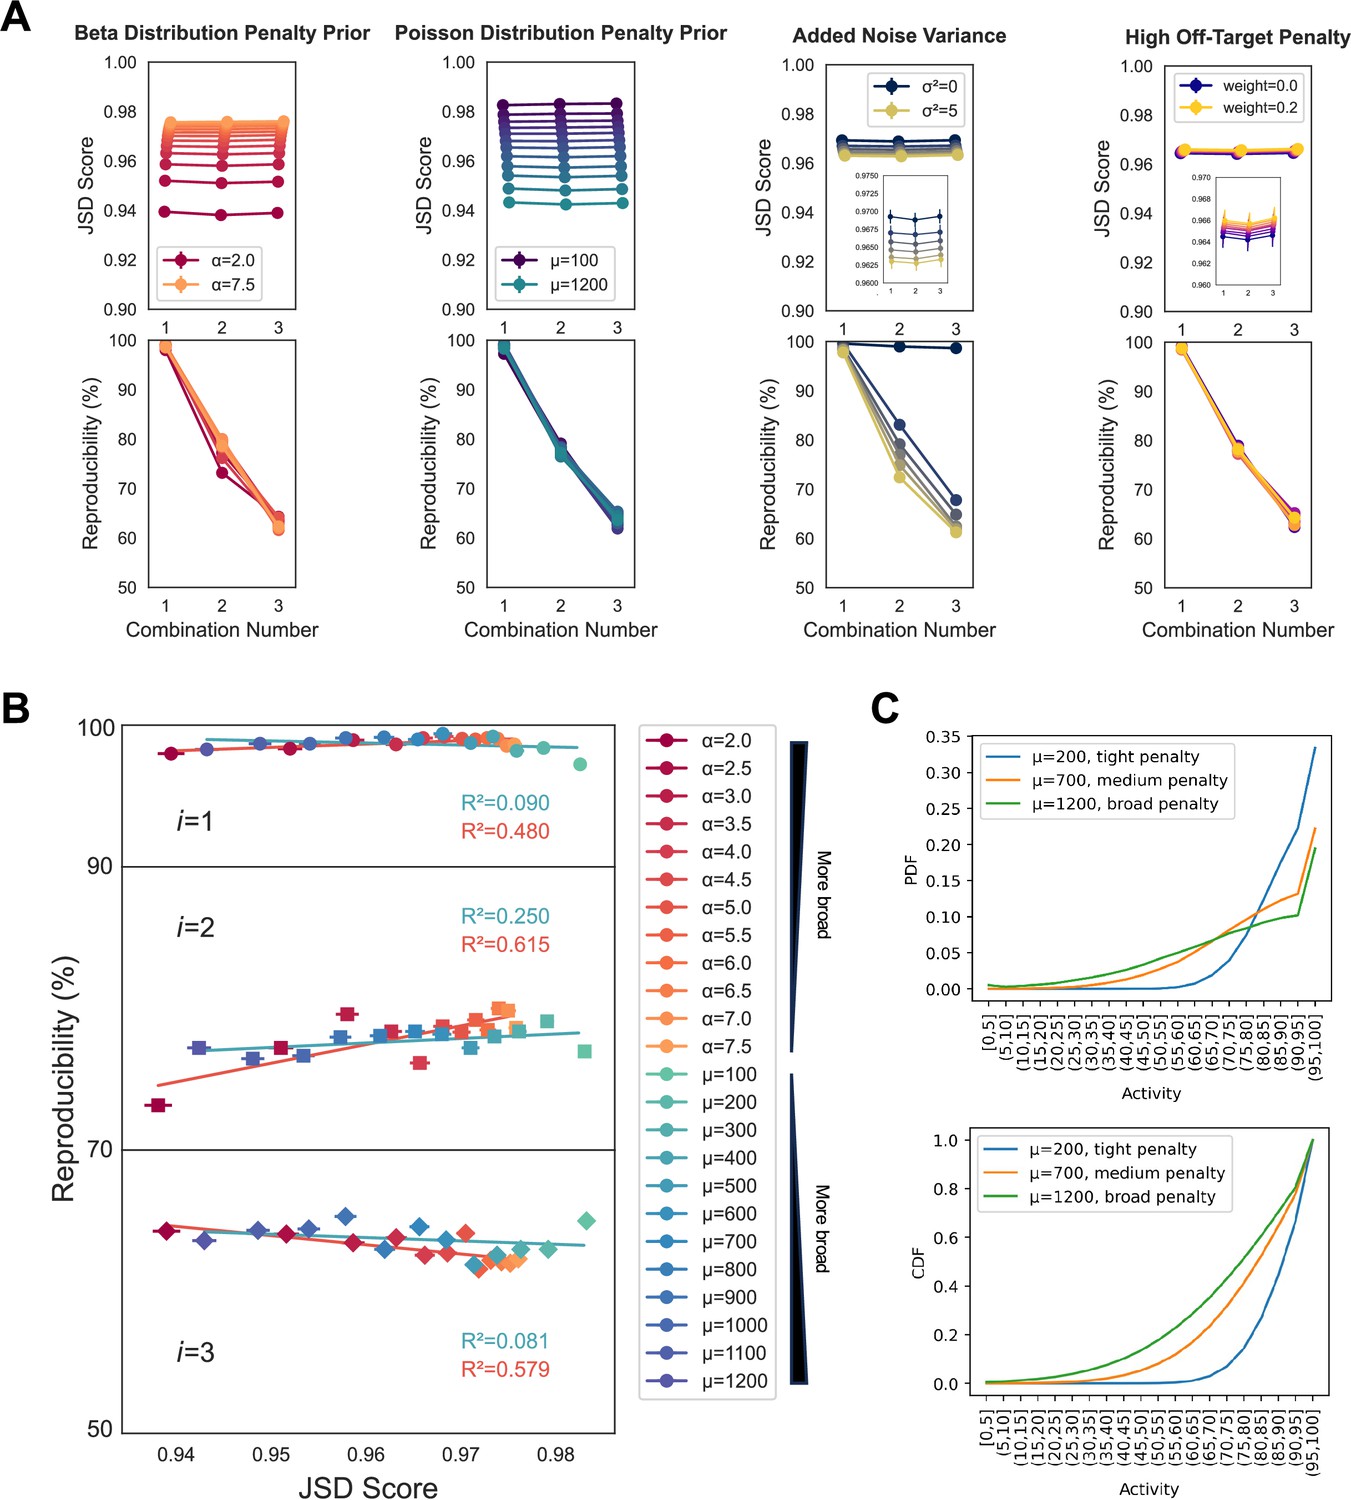
Variation of primary method parameters.
(A) Increasing the broadness of the penalty distribution, with either decreasing values of α for a beta distribution shape, or increasing values of µ for a Poisson distribution shape, increases the range of off-target effects that are penalized and correspondingly decreases the average Jensen–Shannon distance (JSD) score assigned for all combination numbers (values of i). Increasing the variance of the Gaussian that points are sampled from to build cumulative off-target distributions decreases the reproducibility of the method with minimal impact on scoring trend. Increasing the penalty assigned to the highest off-target effects has minimal impact on scoring trends and reproducibility. Five technical replicates were performed for all analyses, using the PKIS2-645 dataset without promiscuous kinases, in order to increase the speed of the analysis. Points represent the mean and error bars, when visible, indicate the standard error of the mean. Default parameters were a Poisson medium (µ = 700) penalty distribution, a noise distribution variance of 2.5, and a high off-target penalty of 0.1. Reproducibility was harshly assessed as the percentage of results across the five technical replicates with identical inhibitor sets for the highest scoring combination. For example, if across five replicates at the i = 3 condition two of the five sets of results differed at only a single inhibitor out of three, then the reproducibility of those five replicates would be scored at 60%. Slight variation is expected with no noise due to alternate sampling of the penalty distribution between replicates, as observed. (B) Changing the underlying shape of the penalty distribution does not have an outsized impact on the reproducibility of the method, as assessed by reproducibility per JSD score. (C) The cumulative density function (CDF) or probability density function (pdf) of each penalty distribution is illustrated, including an additional high off-target penalty for the >95% bin, set to 0.1, as used in most multicompound–multitarget scoring (MMS) experiments presented in this work.
Figure 2—figure supplement 2
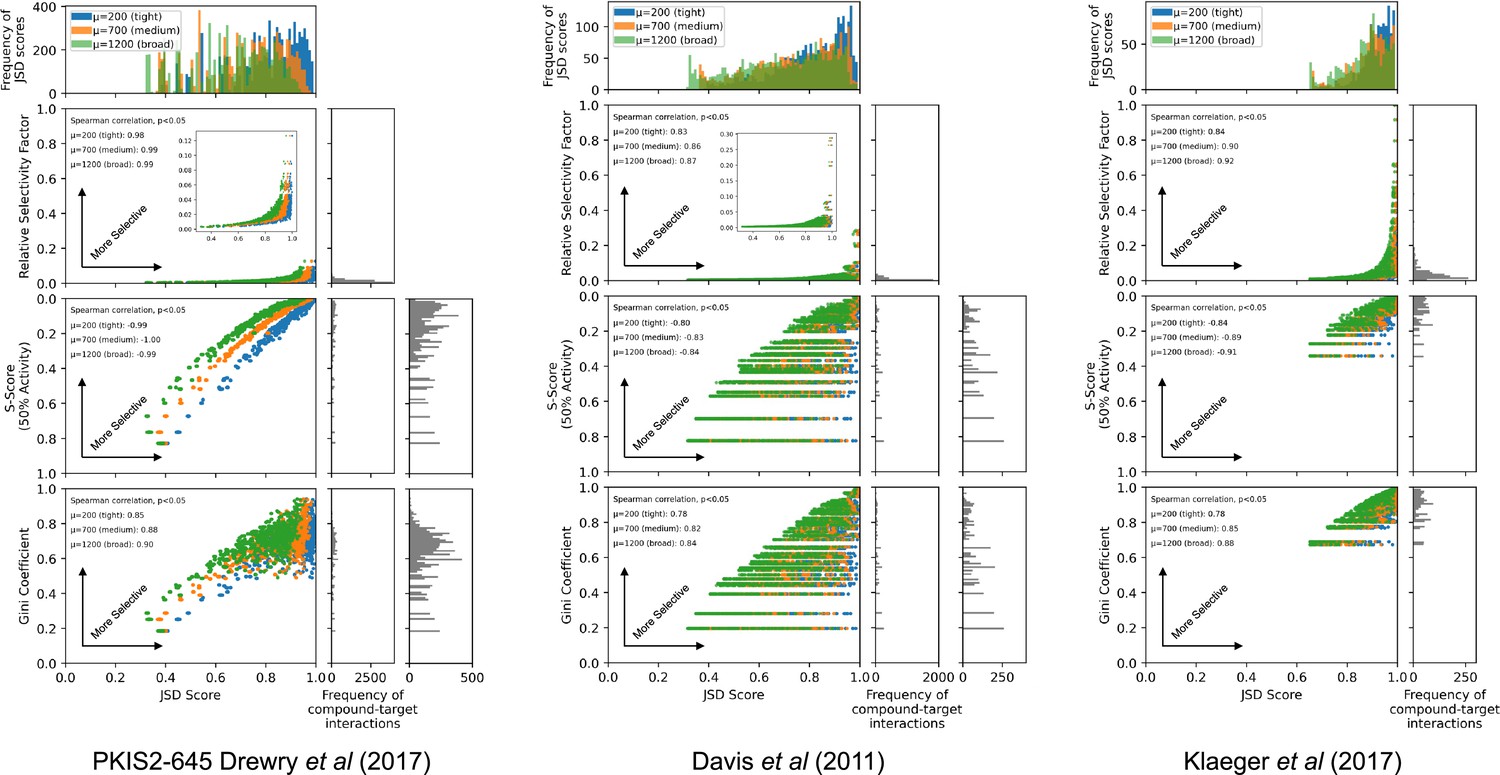
Comparison of Jensen–Shannon distance (JSD) scores with other selectivity scoring methods.
JSD scores were calculated for all compound–target interactions with ≥90% on-target activity across three individual datasets: PKIS2-645, Davis et al., and Klaeger et al. using three (tight µ = 200, medium µ = 700, broad µ = 1200) penalty distributions. Relative selectivity factors, S(50%) scores, and Gini coefficients were calculated for each compound–target interaction. Since S(50%) scores and Gini coefficients are not target specific, the same score was assigned to all compound–target interactions with the same compound. Compound concentrations were not optimized for analyses conducted with the PKIS2-645 compounds due to the imprecision of the single-concentration PKIS2-activity data (see Materials and methods). Consequently, the off-target profiles for a given inhibitor in the PKIS2-645 dataset are fairly similar for all targets, and the subsequent JSD scores are also quite similar. Since concentration optimization was performed for the Davis et al. and the Klaeger et al. datasets, the JSD scores assigned for each target vary much more, producing horizontal lines on the plots for non-target-specific S(50%) scores and Gini coefficients. Calculated JSD scores showed the same general trends as all other selectivity scoring methods: Spearman correlations were all significant (two tails, p < 0.05) for JSD scores generated with all three penalty distributions against each other selectivity scoring method. As expected, JSD scores were lower when using broader penalty distributions since a larger range of off-target activities were included in calculating the scores.
Figure 2—figure supplement 3
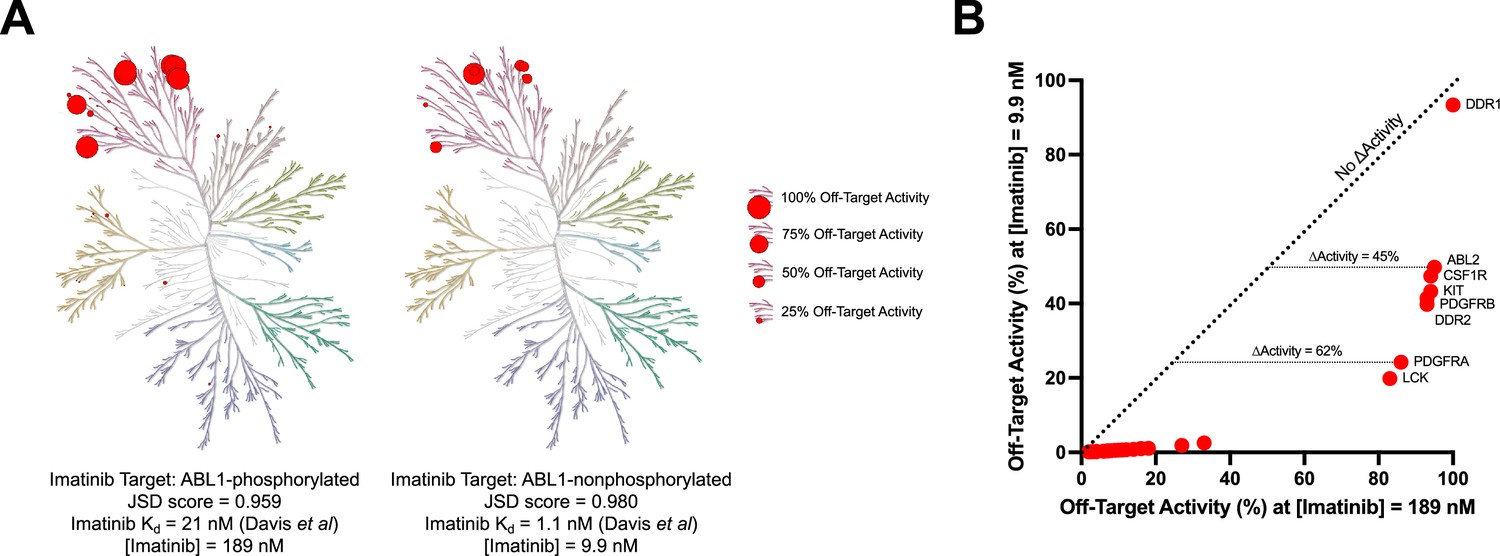
Imatinib selectivity for ABL1-nonphosphorylated versus ABL1-phosphorylated quantified with Jensen–Shannon distance (JSD) scores.
The concentration of imatinib necessary to reach 90% on-target activity against ABL1-phosphorylated (189 nM) or ABL1-nonphosphorylated (9.9 nM) was calculated using Kd values from Davis et al., 2011. The activity of imatinib at these concentrations against off-target kinases was determined using off-target Kd values provided in the same dataset (A, B). For example, imatinib has 45% more activity against ABL2 and 62% more activity against PDGFRA at 189 nM compared to 9.9 nM. The JSD score for imatinib against ABL1-phosphorylated (0.959) or ABL1-nonphosphorylated (0.980) was calculated using the medium penalty prior at the 90% on-target activity threshold. These JSD scores incorporate the same imatinib concentrations and off-target activity values as presented in (A) and (B).
Figure 3 with 1 supplement
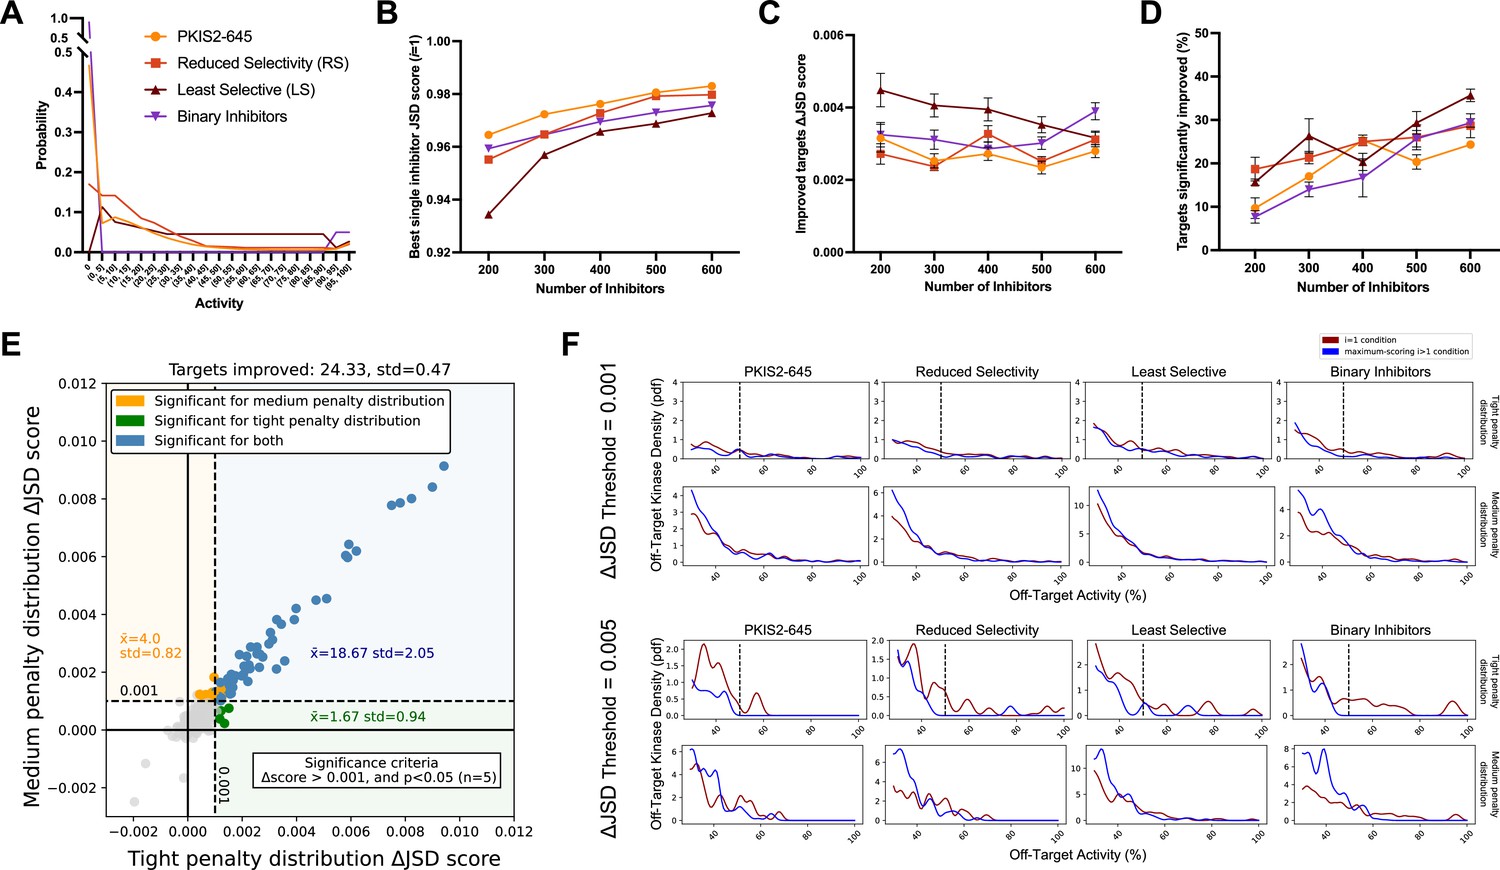
Simulated inhibitor combinations reduce off-target effects for single targets.
(A) Simulated activity profiles for four inhibitor types. The average selectivity profile of PKIS2-645 compounds was smoothed to generate the hypothetical reduced selectivity (RS) and least selective (LS) profiles, and the binary inhibitor profile reflects hypothetical compounds with either potent (>90%) or zero activity. (B) As more inhibitors are simulated, increasingly selective single inhibitors are obtained. (C) The improvement in Jensen–Shannon distance (JSD) score either remains constant or decreases as the window for improvement narrows (max JSD = 1). (D) As more inhibitors are simulated, mimicking larger datasets, more kinase targets are predicted to be more selectively inhibited by a combination over the most selective single inhibitor for each target. (E) The improvement in off-target profiles is not specific to the shape of the penalty distribution used to calculate the JSD score. Here, three different simulated sets of 600 inhibitors generated from the PKIS2-645 parent profile are considered for 100 kinase targets. Points represent single kinase targets from three separate simulations, and the average and standard deviation of the number of kinase targets that could be significantly improved across these simulations are indicated in the figure text. (F) The absolute threshold used in JSD scoring corresponds to the magnitude of the improvement in selectivity; a higher threshold (0.005) selects combinations that are more selective relative to the best single inhibitor compared to combinations at a lower JSD threshold (0.001). In all cases, results from simulated analyses using three sets of 600 inhibitors are presented. The blue and red lines represent the average off-target profiles for all targets with ΔJSD scores greater than the indicated thresholds. Larger or left-shifted spaces between the red (average of the best single compounds) and blue (average of the best combinations) lines indicates a larger improvement in selectivity. The dotted vertical line at 50% activity in the plots scored using the tight penalty distribution indicate the approximate end of that penalty distribution.
Figure 3—figure supplement 1
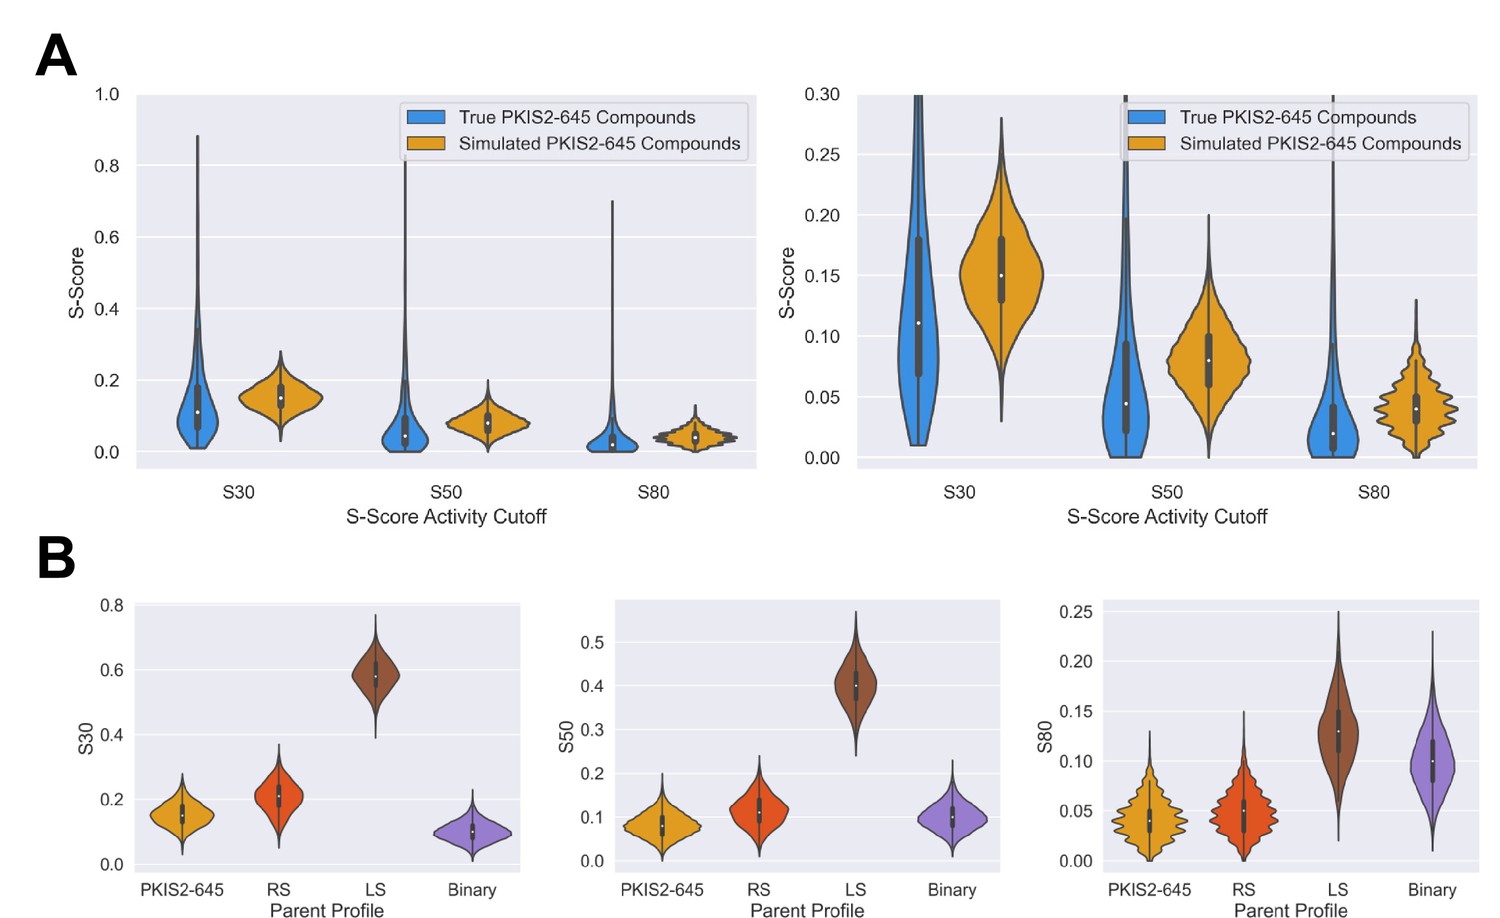
Simulated inhibitors sets have selectivity diversity and overall profiles that match parent profiles.
S-scores were calculated for all simulated inhibitors at the 30%, 50%, and 80% activity thresholds. Inhibitors were aggregated from the 600, 500, 400, 300, and 200 sets, across three separate dataset simulations, for a total of 8000 simulated inhibitors per selectivity profile type. (A) The S-scores of inhibitors simulated from the average PKIS2-645 profile are similar to those of the true PKIS2-645 set. The selectivity of simulated compounds is slightly less since the selectivity profile of PKIS2-645 inhibitors is highly skewed, and simulated inhibitors were generated from the average of this selectivity profile. (B) Selectivity trends match parent profiles. For example, binary-type inhibitors only have a few potent off-targets, and on average have better S(30%) scores than all other profiles. However, as the threshold increases and lower off-targets are no longer counted, S-scores from the other profiles improve relative to the binary profile since they have fewer off-targets with >90% activity.
Figure 4 with 1 supplement
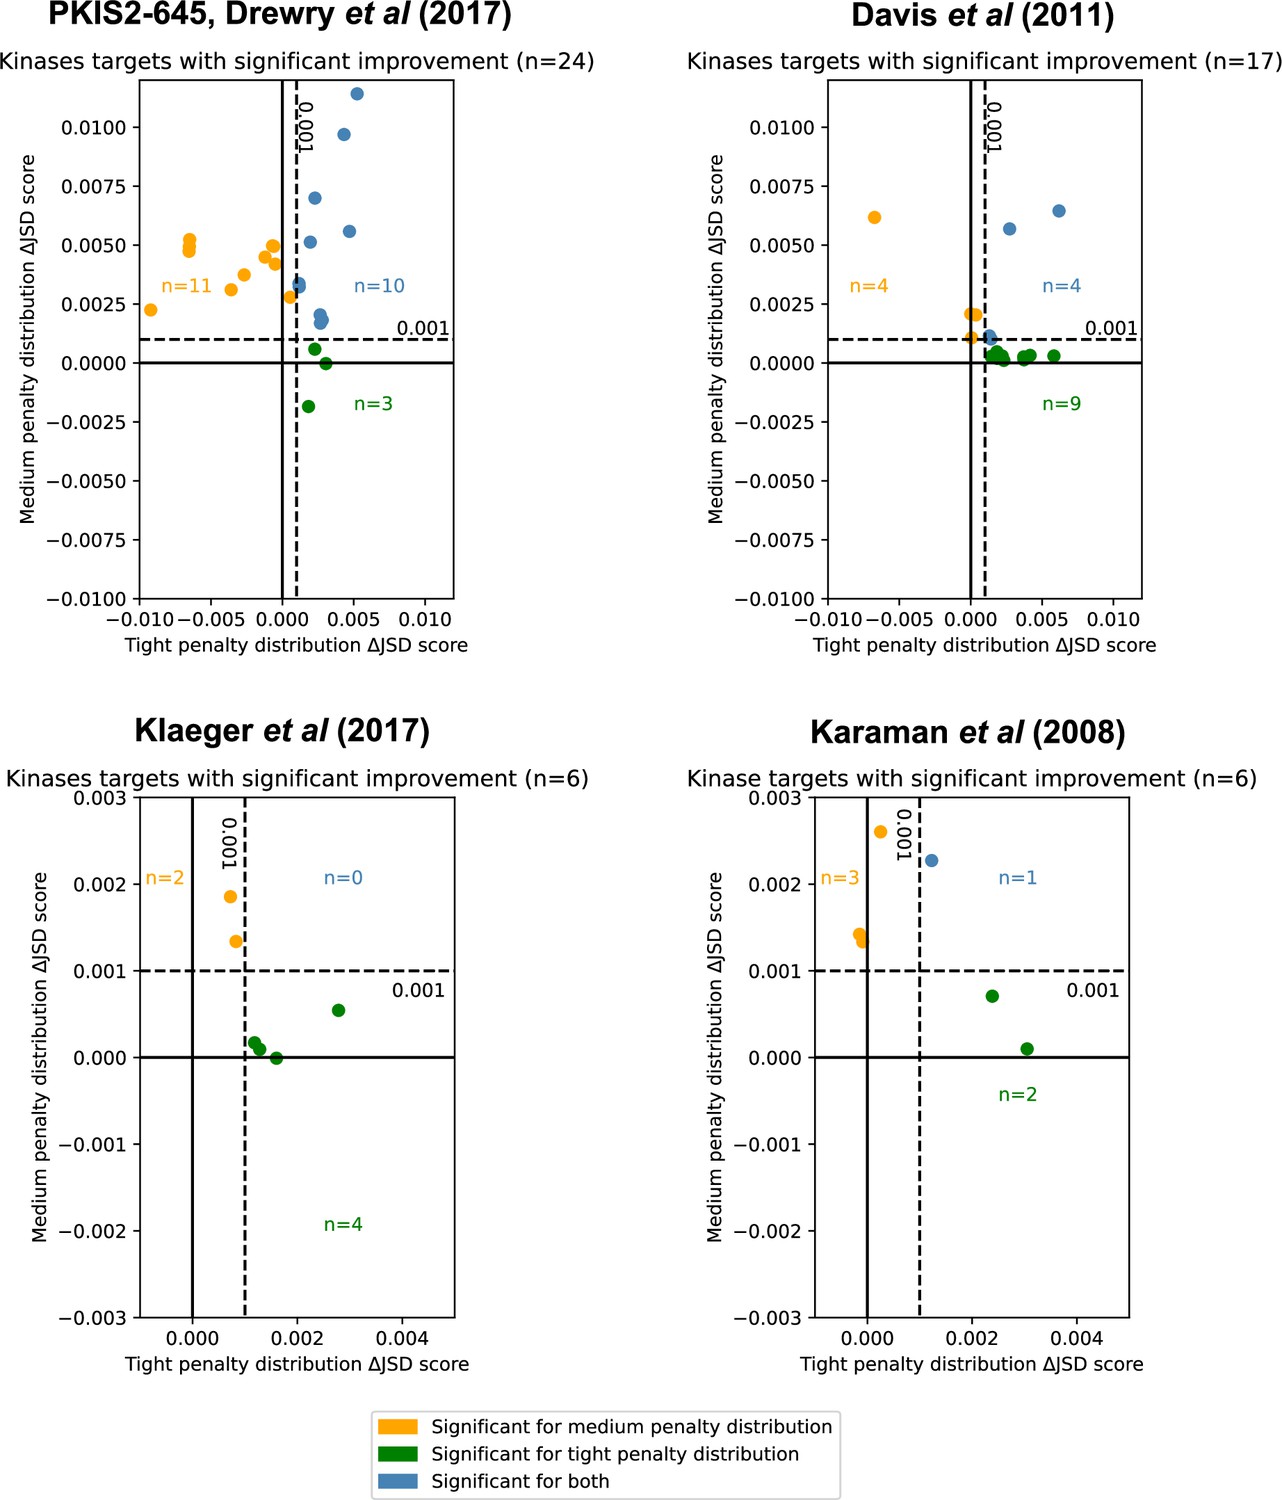
Inhibitor combinations identified using chemogenomic data reduce off-target effects for single kinase targets.
Combinations of two (i = 2) or three (i = 3) inhibitors reduce off-target effects for some kinase targets across three chemogenomic datasets. Each point represents a single-target kinase that can be more selectively inhibited with a combination of inhibitors than with a single inhibitor. Scatterplot data are represented as the ΔJSD score using a tight penalty distribution (x-axis) versus the ΔJSD score using a medium penalty distribution (y-axis). Five technical replicates are performed for all analyses; significance was determined by an absolute improvement of greater than 0.001 in the average score across replicates, as well as statistical significance between the highest scoring i > 1 and i = 1 scores (t-test, two sided, n = 5, p < 0.05). The color scheme for denoting significance is the same as in Figure 3e.
-
Figure 4—source data 1
Kinases with significant improvements in off-target effects using combinations of inhibitors by chemogenomic source dataset.
Kinase targets were assessed using combinations of inhibitors across four individual datasets: PKIS2-645, Davis et al., Klaeger et al., and Karaman et al. The tight penalty distribution and medium penalty distributions were used. Five technical replicates were performed for all analyses. Kinase targets were ranked within each dataset by the total improvement using both penalty distributions.
- https://cdn.elifesciences.org/articles/86189/elife-86189-fig4-data1-v2.xlsx
Figure 4—figure supplement 1
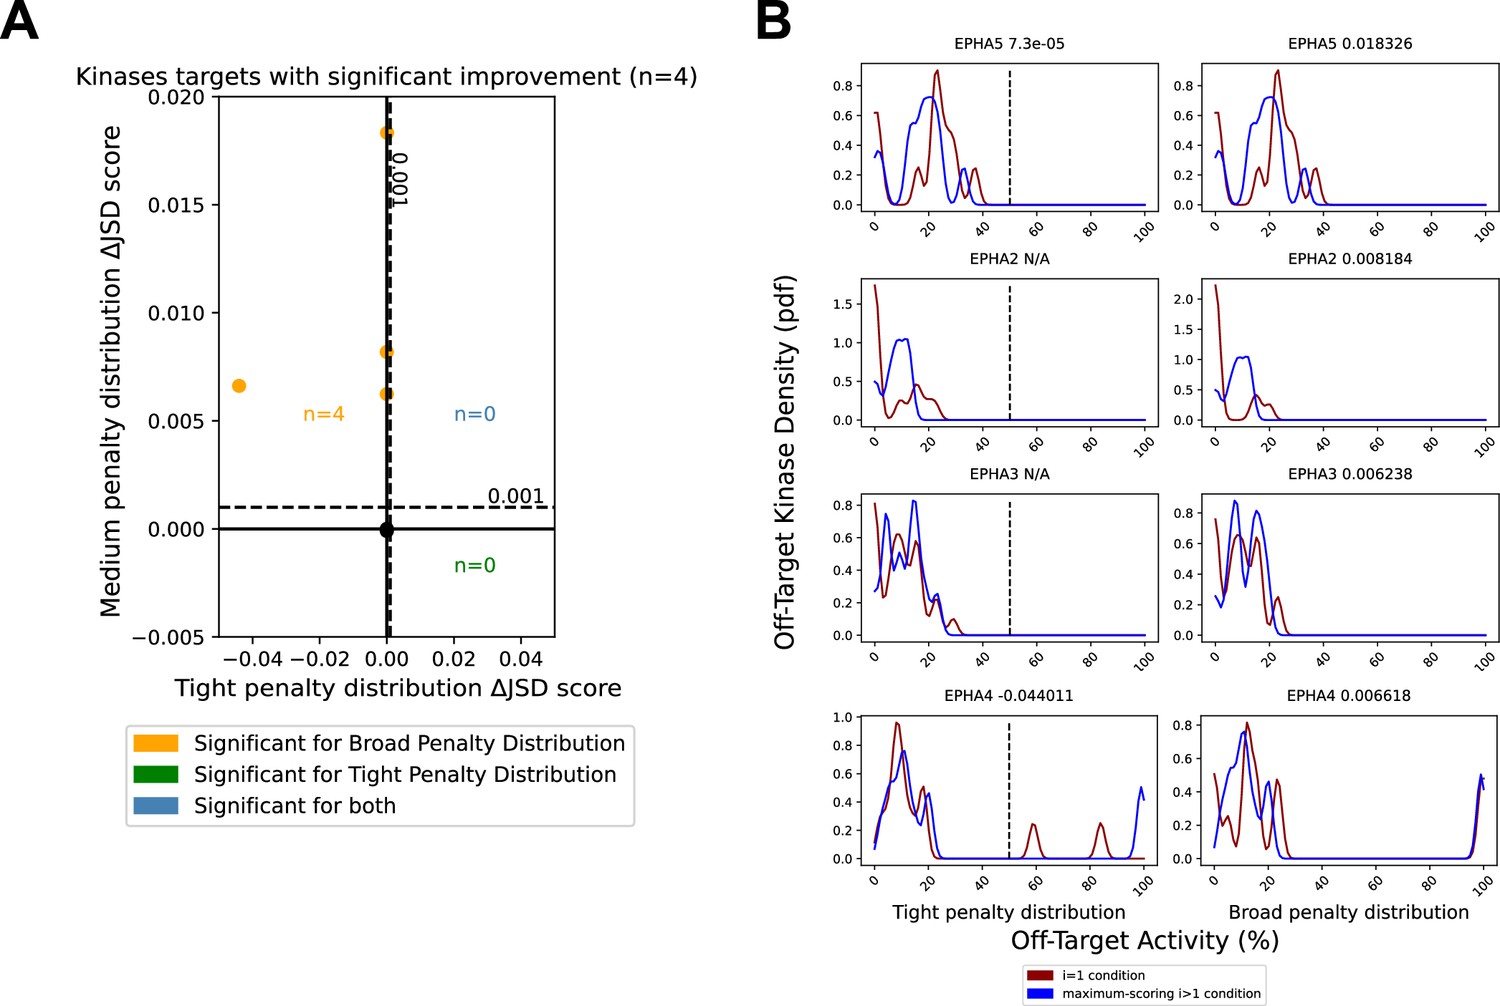
Minor reduction in off-target effects for EPH family kinases.
The PKIS2-645 dataset was reduced to only the EPH kinase family. (A) Analysis of combinations of up to three inhibitors were performed using either a tight (µ = 200) or broad (µ = 1200) penalty distribution. (B) A Jensen–Shannon distance (JSD) score change of N/A is indicated in cases where the single most selective inhibitor had no off-target effects within the range of the penalty distribution, the score was 1, so no further improvements could be made. The variance of the Gaussians in (B) used to generate the probability density functions (pdfs) is the same as was used in the scoring method: 2.5, such that the overall density is an accurate reflection of the off-target penalty distributions. Vertical dotted lines represent the approximate activity value (50%) where the tight probability distribution becomes negligible.
Figure 5 with 1 supplement
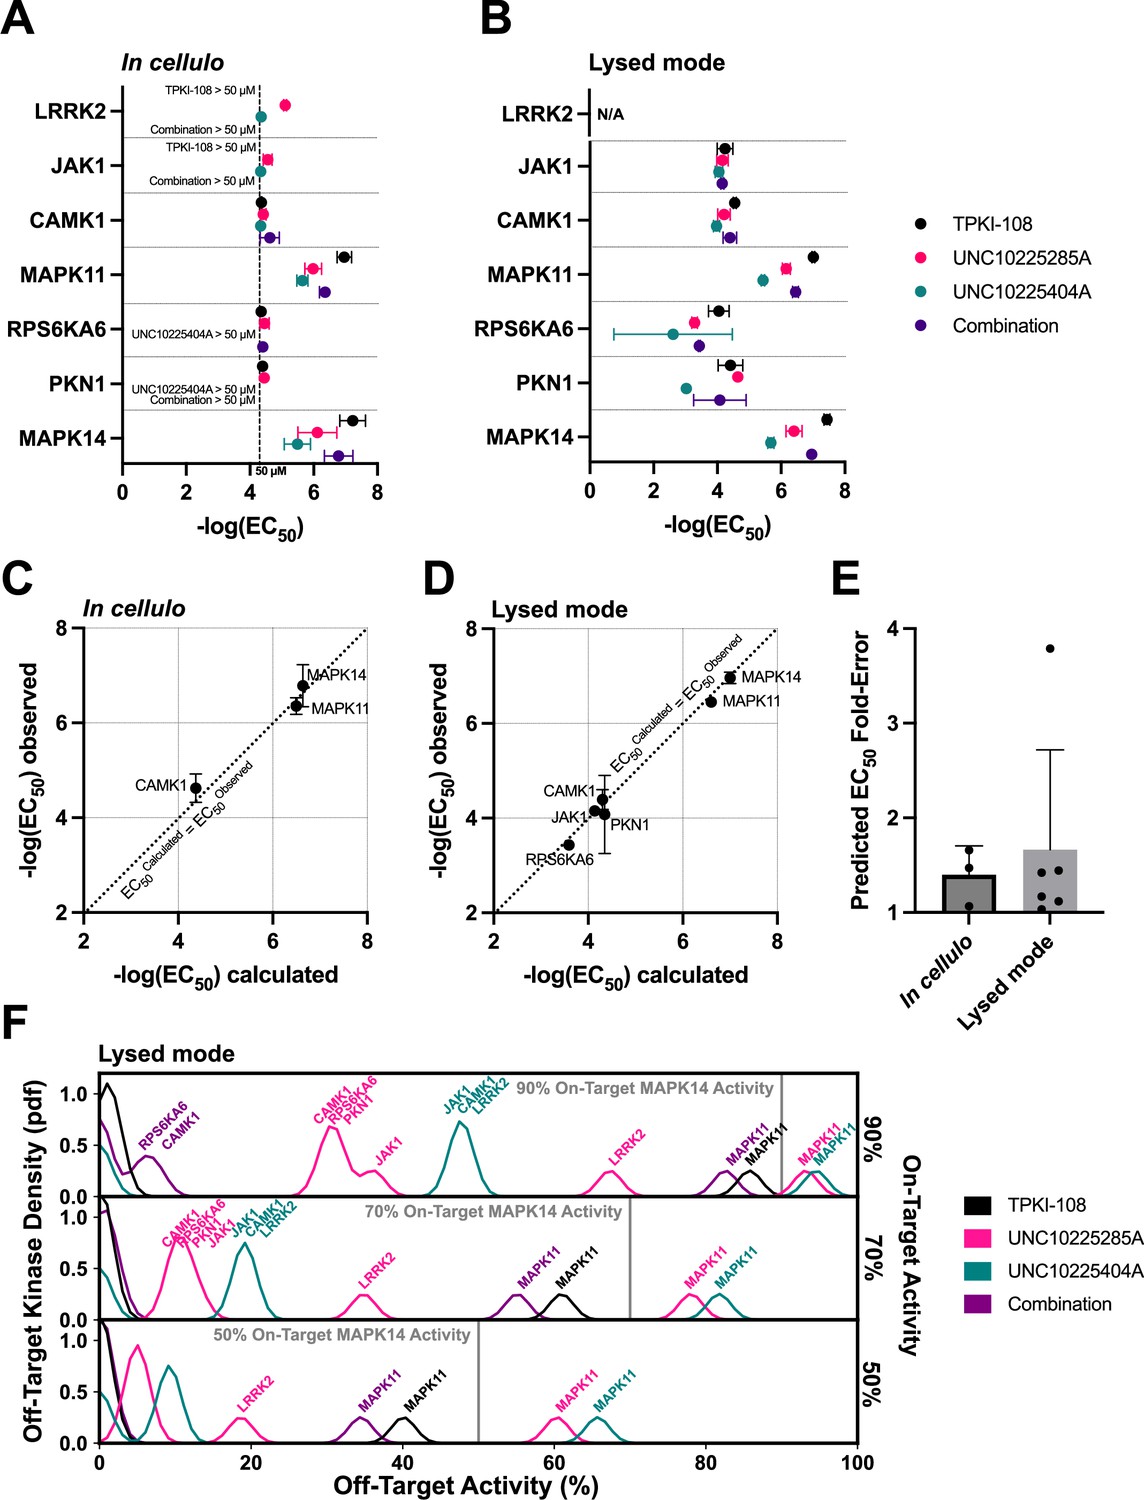
Validation of compound combination predicted activity and selectivity.
The cumulative activity of each compound and equimolar combinations of compounds were studied with the NanoBRET assay in cellulo (A) and in cell lysates (B). EC50 values were obtained for MAPK14 and those off-targets with high PKIS2 activity for any of the three single inhibitors. Error bars indicate the standard deviation. (C, D) The predicted cumulative activity of the three compounds, in their equimolar mixture, was calculated from the average EC50 values of the individual compounds using the same protocol in the multicompound–multitarget scoring (MMS) method. (E) Predictions matched observed EC50 values. Data plotted as mean and includes individual points, error bars indicate the standard deviation. (F) Calculation of the off-target profiles of the inhibitor combination and the individual inhibitors suggests that the combination modestly improves selectivity for MAPK14 over the most selective single inhibitor, TPKI-108. The off-target activity of the inhibitors is calculated based upon their EC50s (lysed mode) for each off-target kinase, at the concentration needed to reach 90%, 70%, or 50% on-target activity against MAPK14. The variance of the Gaussians used to generate probability density functions (pdfs) is the same as was used in the MMS scoring method (2.5) and the activity scale is shown between 0% and 100%.
-
Figure 5—source data 1
NanoBRET in cellulo and lysed mode compound and compound combination activity.
The cumulative activity each compound and the equimolar combination of compounds was studied via an 11-point in-cell NanoBRET target engagement assay for MAPK14 and the set of major off-targets defined by multicompound–multitarget scoring (MMS) analysis. The assay was performed in cellulo and using cell lysate. A conservative 50 µM cutoff was imposed for reporting all in cellulo EC50 values. The cumulative activity of the three compounds was calculated for each kinase using the same method as in the MMS protocol with the average EC50 of each compound for each kinase. The cumulative activity and cumulative EC50s for both the in cellulo and lysed mode experiments are indicated, along with the average observed EC50s. N/A indicates that a value could not be calculated due to an EC50 > 50 µM for one or more of the single inhibitors.
- https://cdn.elifesciences.org/articles/86189/elife-86189-fig5-data1-v2.xlsx
Figure 5—figure supplement 1
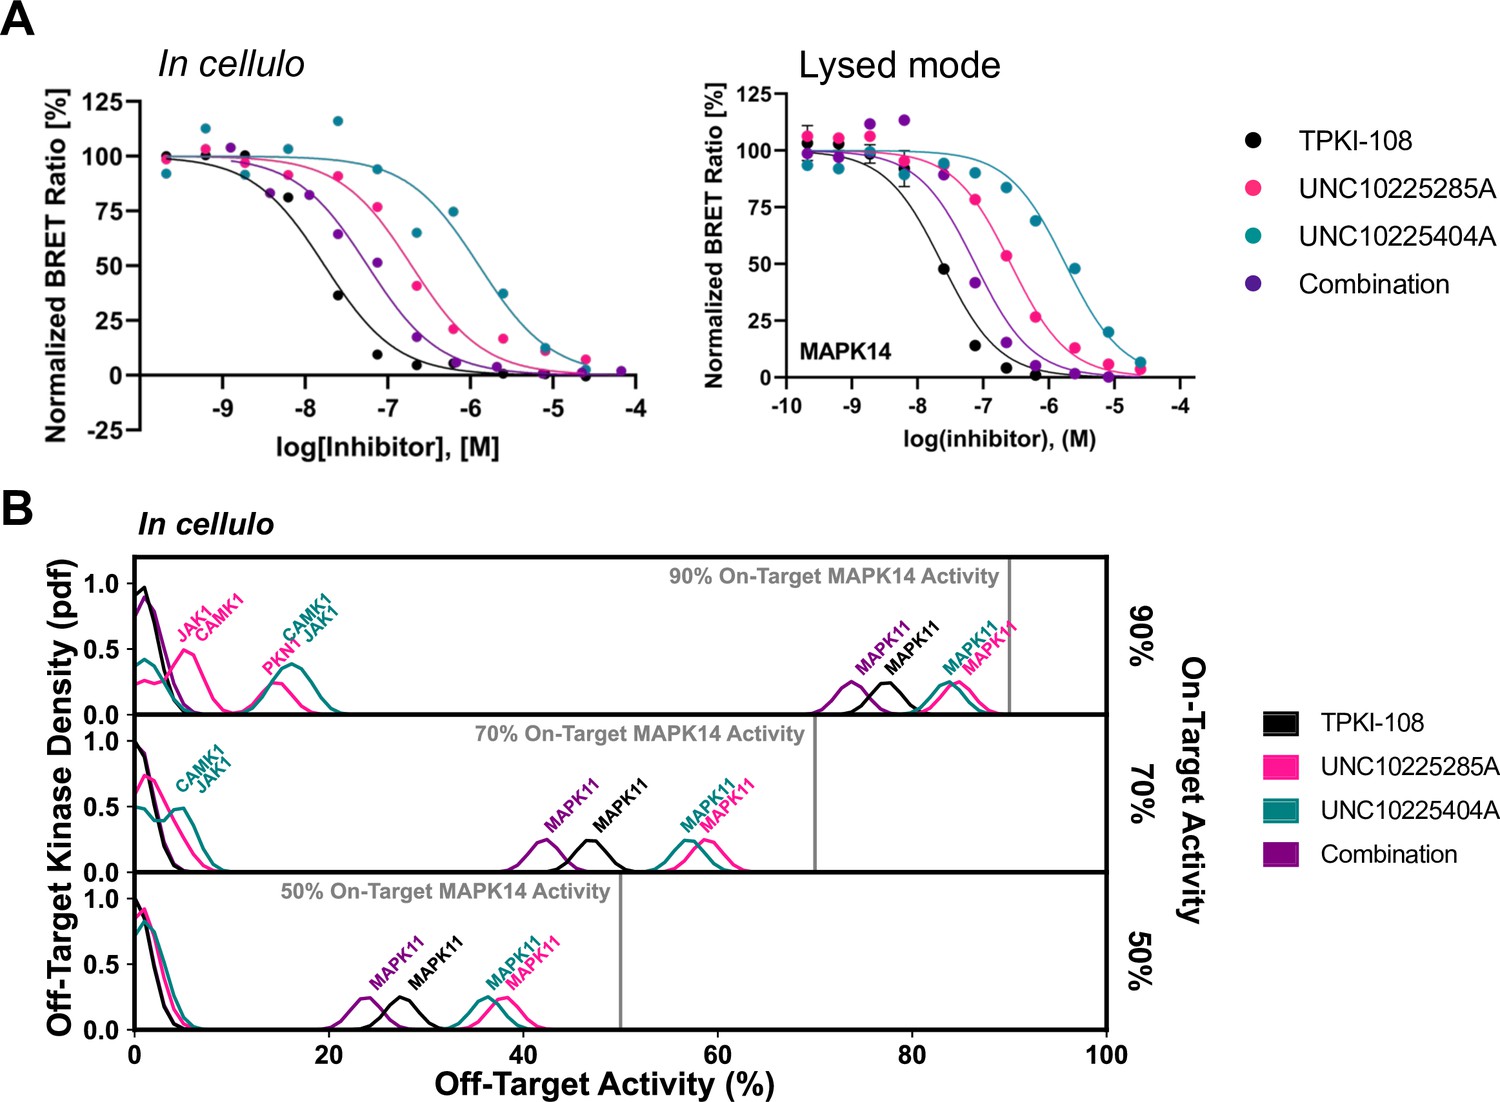
Compound combination activity and selectivity in cellulo and in lysed mode NanoBRET.
(A) Representative traces for MAPK14 from both in cellulo and lysed mode NanoBRET experiments are provided. (B) Calculation of the off-target profiles of the inhibitor combination and the individual inhibitors from in cellulo EC50s suggests that the combination modestly improves selectivity for MAPK14 over the most selective single inhibitor, TPKI-108. The off-target activity of the inhibitors is calculated based upon their EC50s for each off-target kinase, at the concentration needed to reach 90%, 70%, or 50% on-target activity against MAPK14. The variance of the Gaussians used to generate probability density functions (pdfs) is the same as was used in the multicompound–multitarget scoring (MMS) method (2.5) and the activity scale is shown between 0 and 100.
Figure 6 with 1 supplement
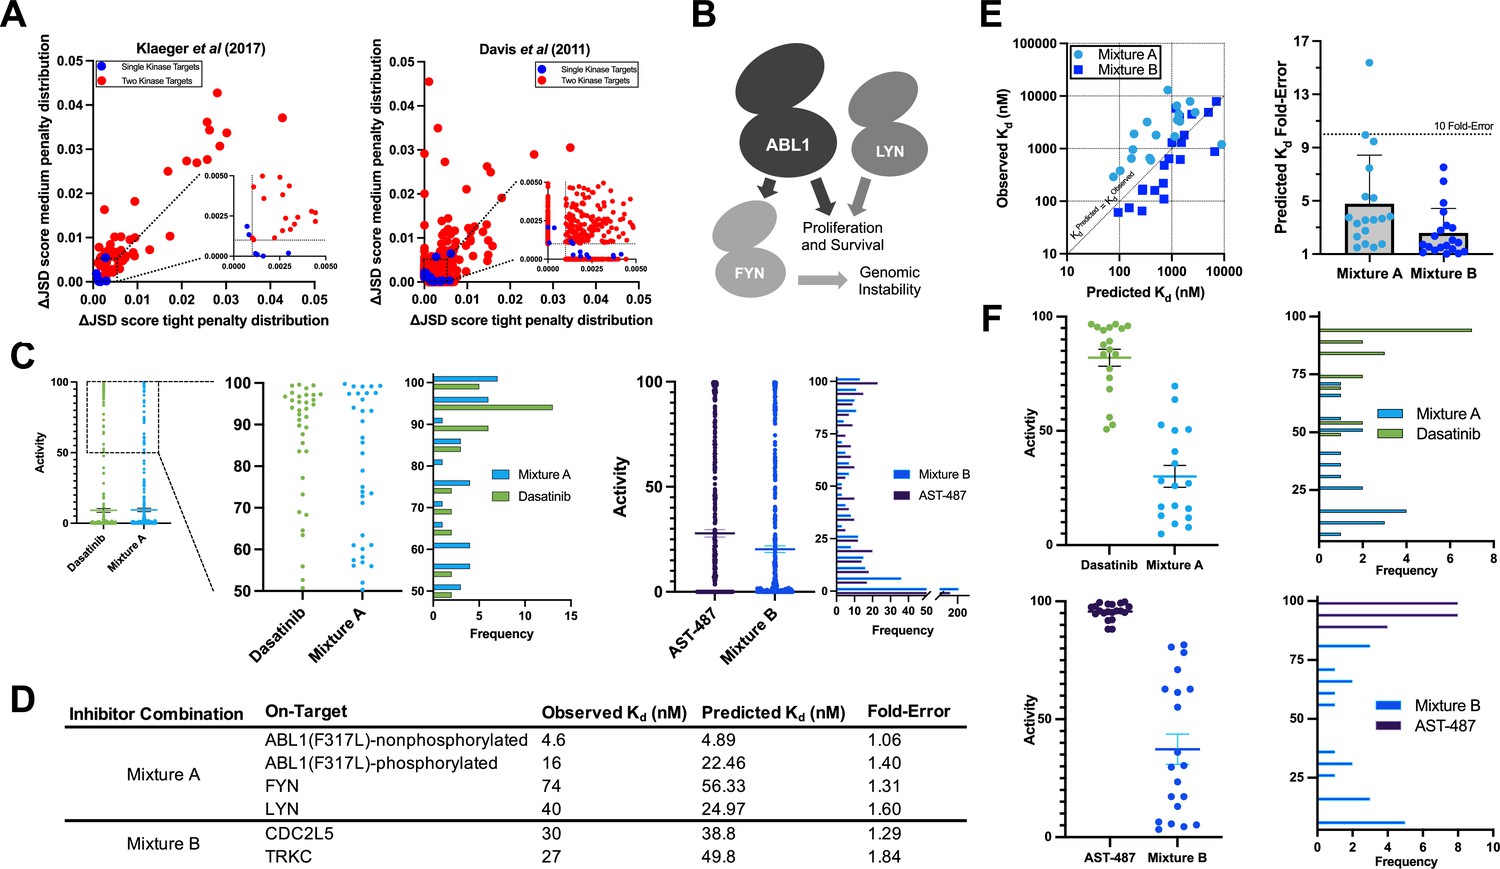
Validation of multicompound–multitarget scoring (MMS) multitarget predictions.
(A) MMS screens suggest that off-target activity reduction may be substantially greater for multiple kinase targets compared to single kinase targets with inhibitor combinations. (B) ABL1, FYN, and LYN represent a translationally interesting target set. (C) MMS predictions suggest that high off-target effects can be reduced for ABL1(F317L), FYN, and LYN relative to dasatinib, and that global off-target effects can be reduced for CDC2L5 and TRKC relative to AST-487. Both dasatinib and AST-487 are the most selective single compounds for their respective targets out of the set of compounds with a Kd of at worst 111 nM for all targets. Each point represents a single off-target kinase and the histograms summarize the adjacent dot plots. The lines in the dot plots represent the mean and the standard error of the mean. (D) Experimental Kd values closely match predicted on-target values, and both Mixtures A and B are potent against all target kinases. (E) The off-target effects of both Mixtures A and B are, on average, within fivefold of predicted Kd values. Each dot represents a single off-target kinase; 18 off-targets were considered for Mixture A and 20 off-targets were considered for Mixture B. Data plotted as mean and includes individual points, error bars indicate the standard deviation. (F) Top: Activity of dasatinib and Mixture A against 18 off-target kinases at the concentration of dasatinib (7.1 nM) and Mixture A (661 nM masatinib, 0.124 nM dasatinib, 4.69 nM PD-173955) required to inhibit ABL(F317L)-nonphosphorylated, ABL1(F317L)-phosphorylated, FYN, and LYN by at least 90%. Bottom: Activity of AST-487 and Mixture B against 20 off-target kinases at the concentration of AST-487 (306 nM) and Mixture B (4.03 nM AST-487, 226 nM ABT-869, 40.0 nM EXEL-2880/GSK-1363089) required to inhibit CDC2L5 and TRKC by at least 90%. Each dot represents a single off-target kinase, and adjacent histograms summarize the dot plots. The lines in the dot plots represent the mean and the standard error of the mean.
-
Figure 6—source data 1
Inhibitor combinations are potent and more selective than the most selective single compound for multiple targets.
The selectivity of Mixtures A and B are compared to the most selective single inhibitor that is sufficiently potent (Kd < 111 nM at all targets) for each respective target set. Fold-selectivity is the potency at an off-target divided by the potency of the least potently inhibited on-target of a given compound or mixture. Fold-selectivity advantage is the fold-selectivity of each mixture divided by the fold-selectivity of the corresponding most selective single compound at a particular off-target. For example, Mixture A is 22.97-fold more selective for FYN than BMX, while dasatinib is only 1.77-fold more selective for FYN than BMX, yielding a fold-selectivity advantage of 12.96 for Mixture A versus dasatinib at this off-target kinase. A total of 22 kinases were considered for validating each mixture; 4 on-target kinases and 18 off-target kinases for Mixture A, and 2 on-target kinases and 20 off-target kinases for Mixture B.
- https://cdn.elifesciences.org/articles/86189/elife-86189-fig6-data1-v2.xlsx
Figure 6—figure supplement 1
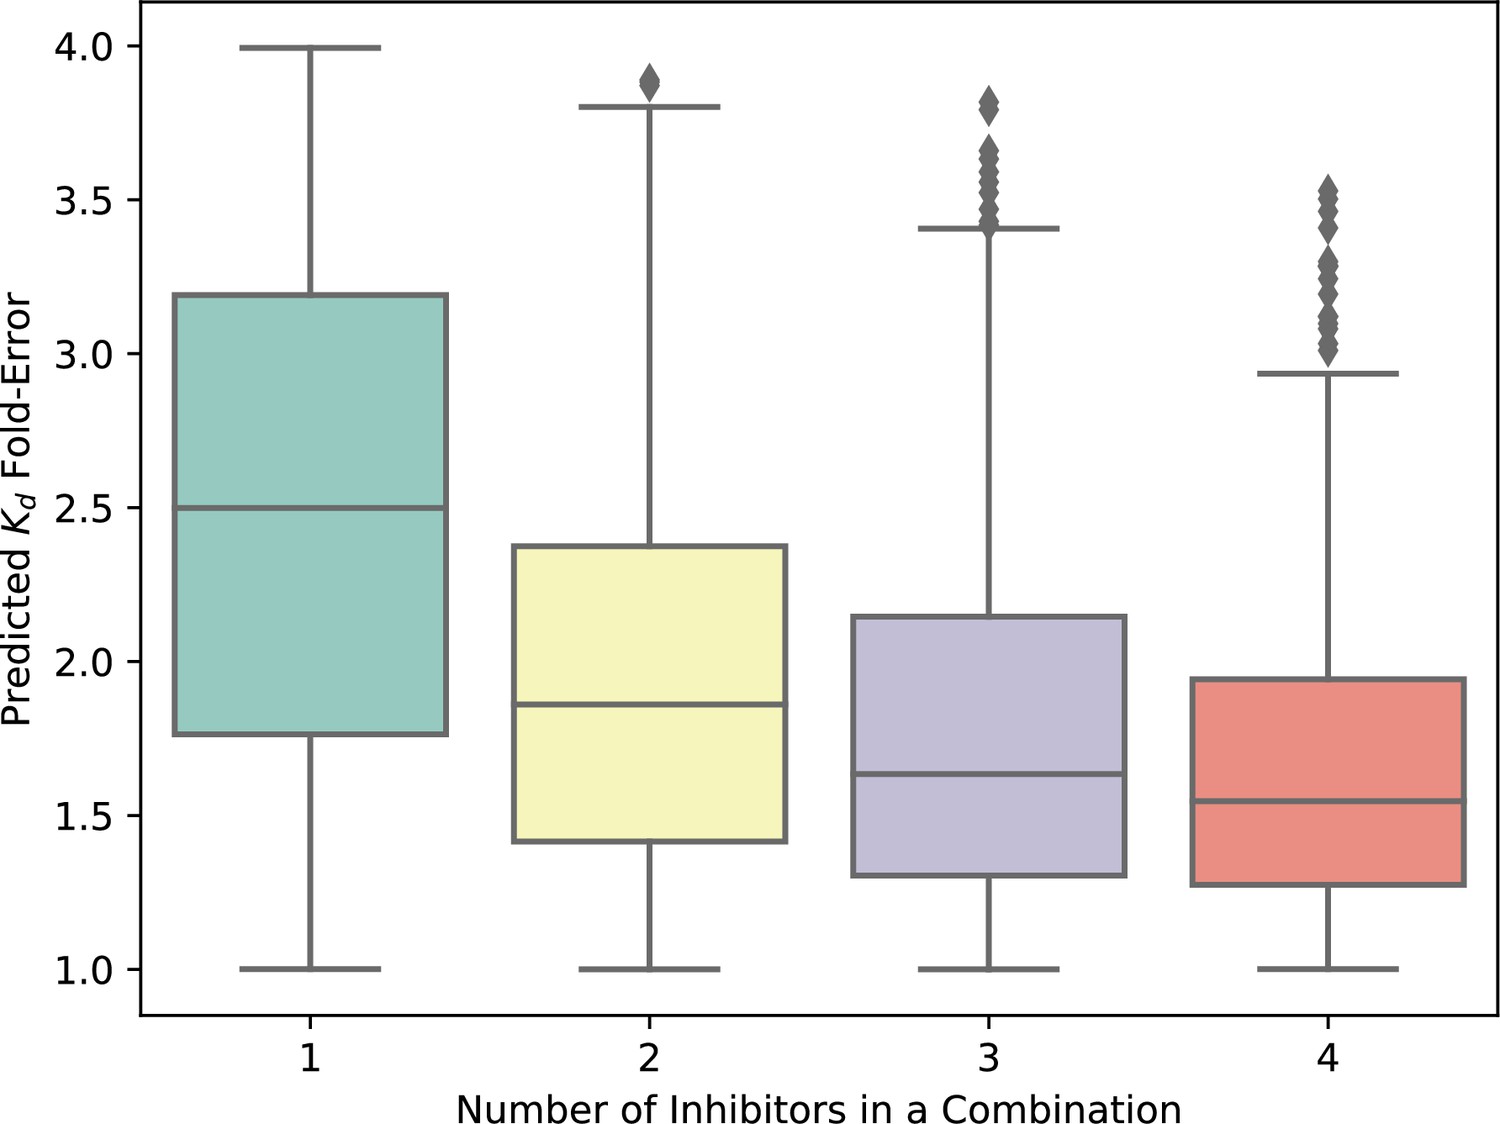
The theoretical error of Kd predictions for inhibitor combinations is limited by the maximum error in single-inhibitor Kd values.
The maximum expected error in the prediction of the cumulative Kd of a mixture of compounds is the greatest error in observed versus expected Kd for any one single compound in the mixture. The expected variation in the predicted Kd values for single compounds is 2.5 (halfway between 1 and 4), and the fold-error in the predicted Kd of combinations of inhibitors decreases as errors average out with increasing numbers of inhibitors per combination. The upper limit of fold-error for the combination Kd predictions is no greater than fourfold in all cases.
Tables
Table 1
FLT3 mutants are predicted to be more selectively inhibited with different inhibitor combinations than FLT3.
Multicompound–multitarget scoring (MMS) analysis was performed with the tight penalty distribution and the Davis et al., 2011 dataset. Concentrations reflect the amount of each respective compound necessary to reach 90% activity against the target. More than one listed combination suggests that there are multiple similar options to improve selectivity relative to the most selective single inhibitor.
| Target | Best single compound | Concentration (90% activity) | Highest scoring combination(s) | Concentrations (90% activity) |
|---|---|---|---|---|
| FLT3 | CHIR-258/TKI-258 | 5.76 nM | AC220, CHIR-258/TKI-258, R406 | 3.90 nM, 1.92 nM, 2.13 nM |
| FLT3(D835H) | BIBF-1120 (derivative) | 6.39 nM | BIBF-1120 (derivative), R406 | 3.19 nM, 2.93 nM |
| FLT3(D835Y) | BIBF-1120 (derivative) | 3.78 nM | ABT-869, BIBF-1120 (derivative), JNJ-28312141 | 9.83 pM, 3.08 nM, 2.75 nM |
| BIBF-1120 (derivative), JNJ-28312141, Sunitinib | 3.08 nM, 2.75 nM, 2.06 pM | |||
| FLT3(ITD) | R406 | 4.86 nM | BIBF-1120 (derivative), JNJ-28312141, R406 | 2.16 nM, 0.81 nM, 3.32 nM |
| BIBF-1120 (derivative), LY-317615, R406 | 2.21 nM, 1.78 nM, 3.41 nM | |||
| BIBF-1120 (derivative), PKC-412, R406 | 2.16 nM, 2.12 nM, 3.33 nM | |||
| FLT3(K663Q) | PKC-412 | 18.0 nM | MLN-518, PKC-412, R406 | 2.05 nM, 10.9 nM, 1.85 nM |
| AC220, PKC-412, R406 | 3.00 nM, 10.9 nM, 1.85 nM | |||
| FLT3(N841I) | MLN-518 | 261 nM | ABT-869, MLN-518, PKC-412 | 7.09 nM, 158 nM, 8.18 nM |
Additional files
Download links
A two-part list of links to download the article, or parts of the article, in various formats.
Downloads (link to download the article as PDF)
Open citations (links to open the citations from this article in various online reference manager services)
Cite this article (links to download the citations from this article in formats compatible with various reference manager tools)
Death by a thousand cuts through kinase inhibitor combinations that maximize selectivity and enable rational multitargeting
eLife 12:e86189.
https://doi.org/10.7554/eLife.86189


