Tiered sympathetic control of cardiac function revealed by viral tracing and single cell transcriptome profiling
- UCLA Neurocardiology Research Center of Excellence, United States
- UCLA Cardiac Arrhythmia Center, United States
- UCLA Bioinformatics Interdepartmental Program, United States
- UCLA Integrative Biology and Physiology, United States
- UCLA Quantitative and Computational Biosciences, United States
- UCSF Bakar Computational Health Sciences Institute, United States
- University of California, San Diego, United States
- Alnylam Pharmaceuticals, United States
- Neuroscience Division, Garvan Institute of Medical Research, St. Vincent’s Hospital, Australia
Figures
Figure 1 with 7 supplements
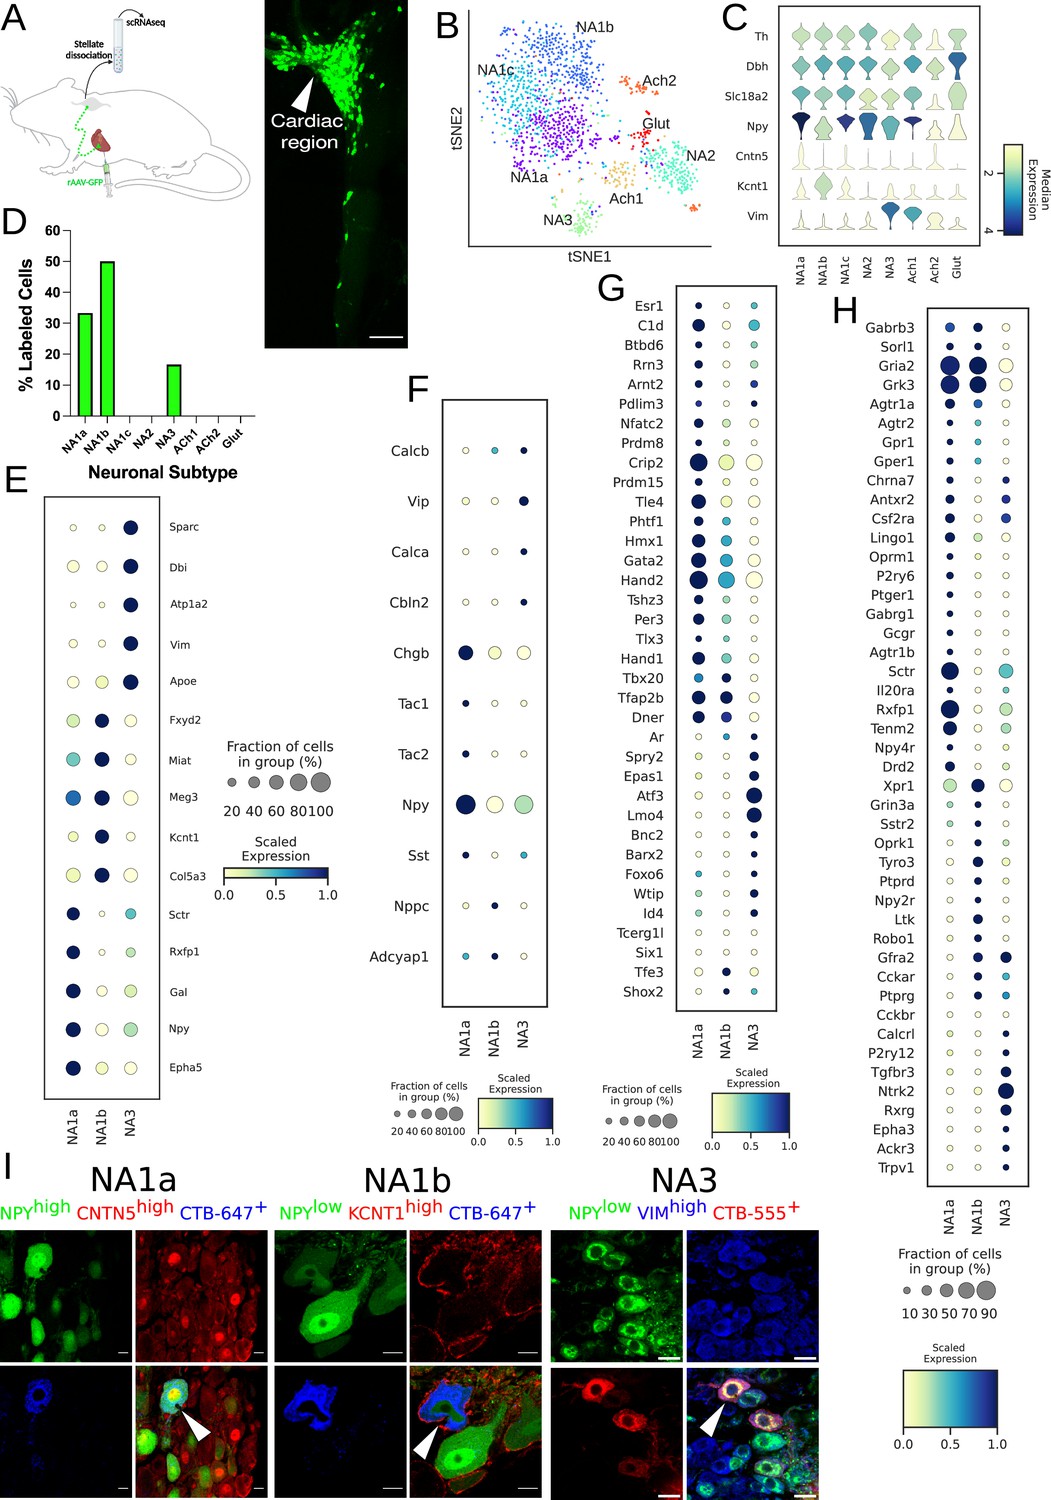
Distribution of cardiac-specific neuronal sub-population in the mouse stellate ganglia.
(A) Experimental overview, diagrammatic representation of tracing from cardiac (AAV-GFP) neurons to the stellate ganglion, followed by single-cell RNA sequencing (scRNAseq) analysis (left). The CTB labeled right stellate ganglion shows the regional specificity of cardiac neurons (right) in the stellate ganglion. (B) tSNE plot visualizes eight Louvain identified neuronal subpopulations with prior annotations. (C) Violin plot of key marker genes used to validate the sympathetic cardiac neuronal subtypes. (D) Distribution of cardiac neuronal subpopulations in stellate ganglia. n=8 mice. (E) Dot-plot shows the transcriptomic profile in each cardiac subtype. Dot-plot shows relative expression of neuropeptides (F); transcription factors (G); and receptors (H) associated with subtypes. (I), Immunohistochemistry validation of cardiac innervating neuronal subtypes (NA1a, NA1b, NA3). Scale bar: 10 and 20 µm.
Figure 1—figure supplement 1
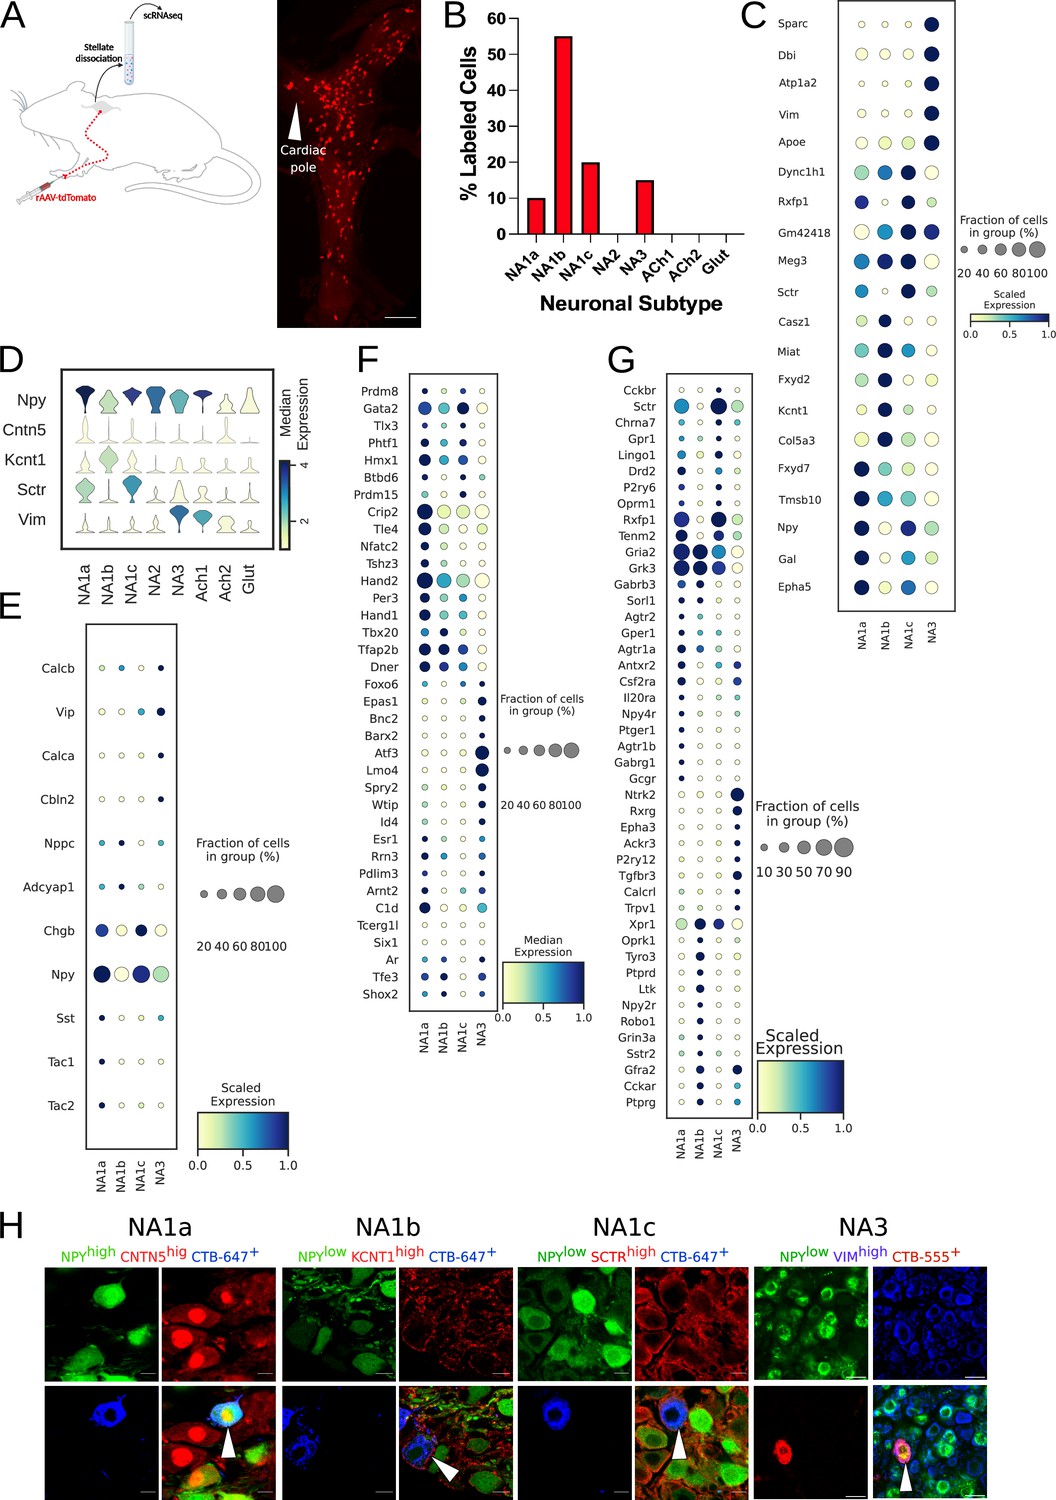
Paw innervating neuronal subpopulation in the mouse stellate ganglion.
(A) Experimental overview, diagrammatic representation of tracing paw-specific neurons to the stellate ganglion, followed by scRNAseq analysis (left). Unlike cardiac-specific neurons, CTB labeled paw neurons did not show regional specificity in the stellate ganglia (right). (B) Distribution of paw innervating neuronal subtypes identified and characterized using scRNAseq data analysis. (n=8 mice). (C) Dot-plot shows the transcriptomic profile for each paw innervating neuronal subtype. (D) Violin plot of key marker genes used for validation of paw neuronal subtypes. (E,F,G) Dot-plot showing relative expression of neuropeptides (E), transcription factors (F), and receptors (G) associated with paw neuronal subtypes. (H), Immunohistochemistry validation of paw innervating neuronal subtypes (NA1a, NA1b, NA1c, NA3). n=6. Scale bar: 10 and 20 µm.
Figure 1—figure supplement 2
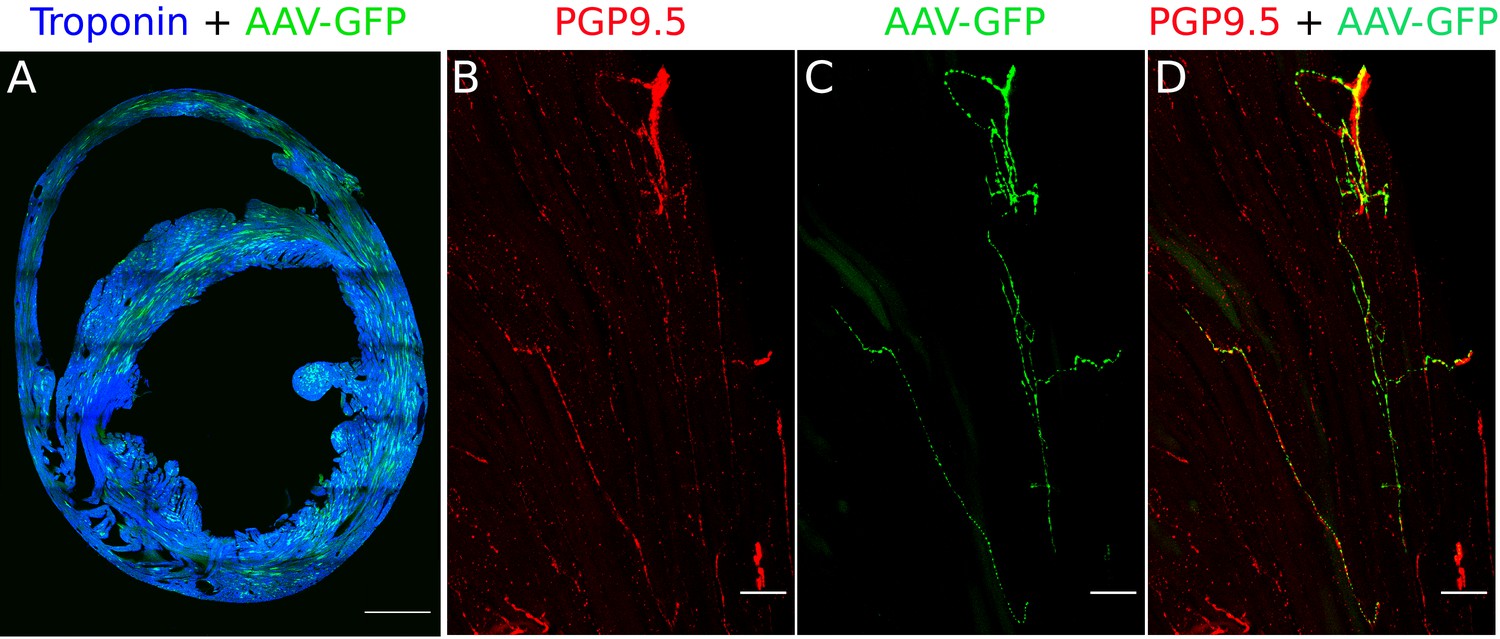
Validation of retrograde tracing of AAVs from myocardium (Heart injections).
(A) Cross-section of the heart labeled with AAV-GFP (green) and cardiac troponin I. Scale bar: 1000 µm. (B) PGP9.5 staining in nerve fibers of a heart section. (C) AAV-GFP labeling in nerve fibers of the heart section. (D) Merge image shows the co-labeling of PGP9.5 and AAV-GFP in nerve fibers of the heart-section that travel to the stellate ganglia. n=3 mice. Scale bar: 50 µm.
Figure 1—figure supplement 3
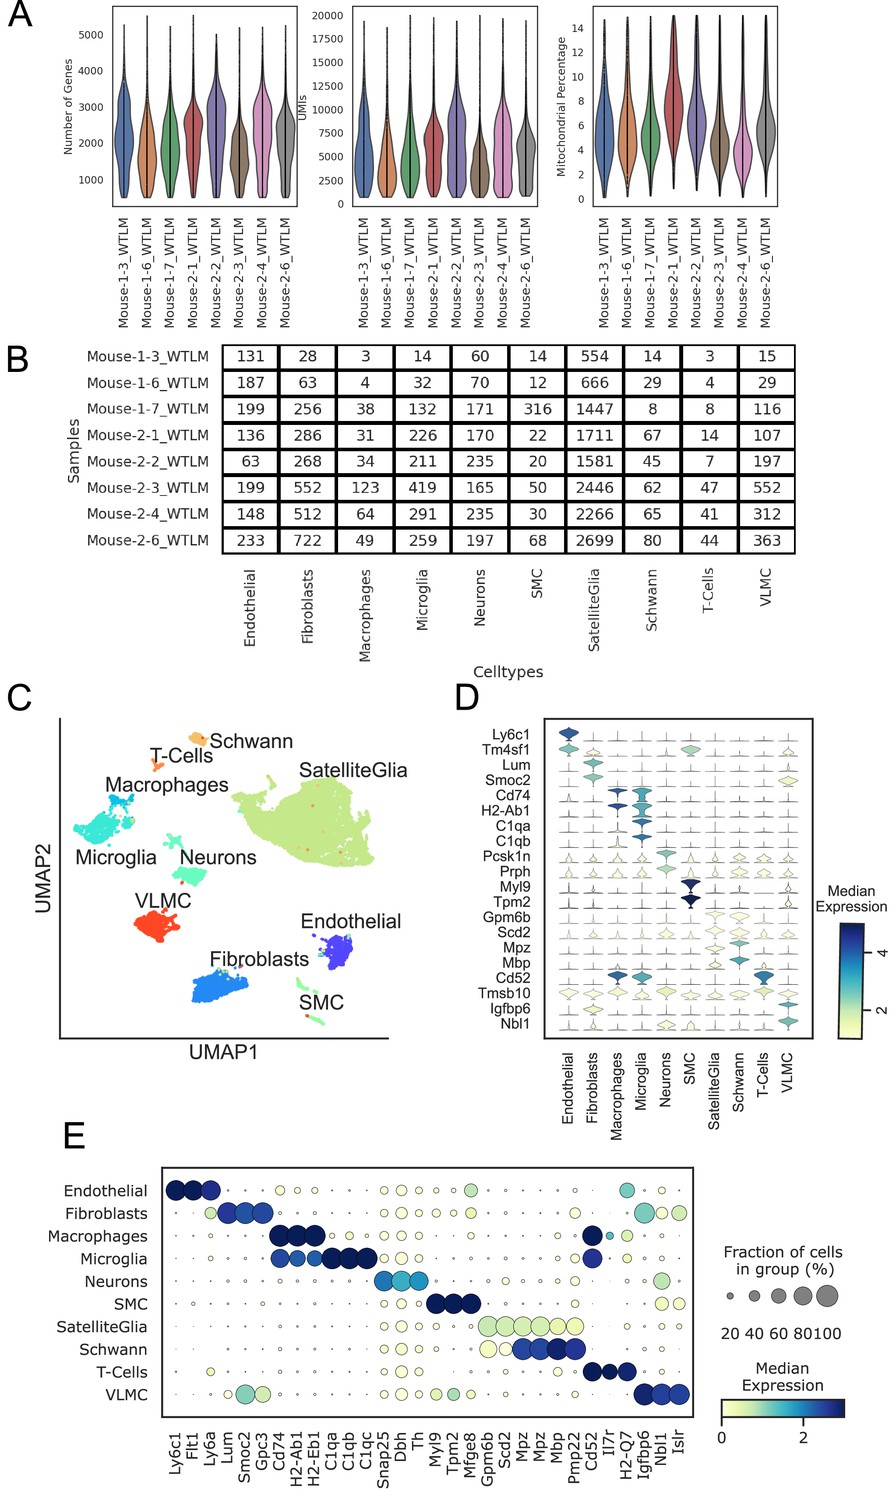
scRNAseq quality control.
Samples are indicated with their batch and sample number. (A) Violin plots showing the distribution of the number of genes, UMIs, and mitochondrial percentage per cell in 8 WT mice. (B) Number of cells in each cell type for each sample in the experiment. (C) scRNAseq clustering of all cell types in the stellate ganglion, showing the heterogeneous populations of cells. UMAP clearly shows separation between major cell types. (D) Violin plot depicting the top 2 statistically most significant marker genes for each cell type; (E) Dot plot shows that different cell types are transcriptionally separable by curated and data driven cell type marker genes. n=8 mice.
Figure 1—figure supplement 4
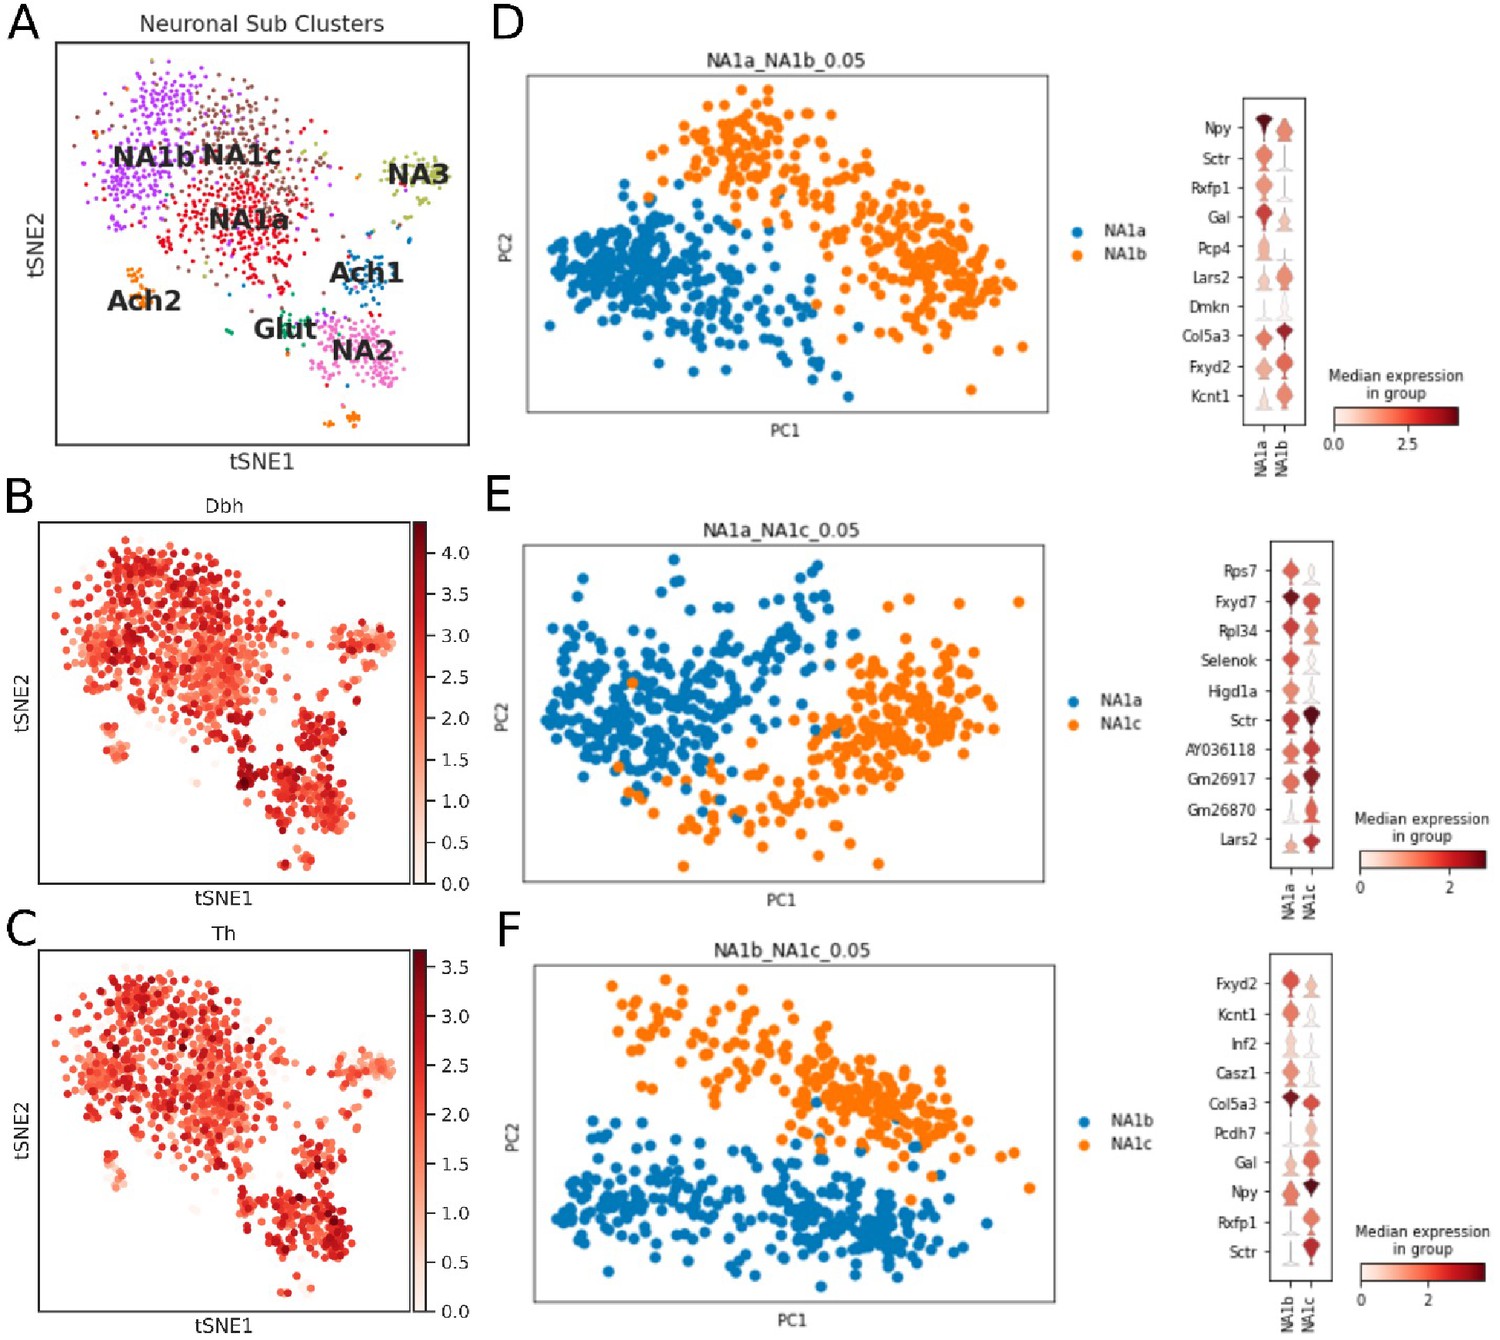
Neuronal subtypes in the bilateral stellate ganglion tissues.
(A) tSNE visualizes eight Louvain identified neuronal subpopulations with prior annotation (n=8 mice). (B,C) Log-scale plots of the neuron population with Dbh and Th (sympathetic neuron markers). (D,E,F) Principal component analysis and violin plot for top 10 markers to visualize the differences among NA1a, NA1b, and NA1c neuronal subtypes.
Figure 1—figure supplement 5
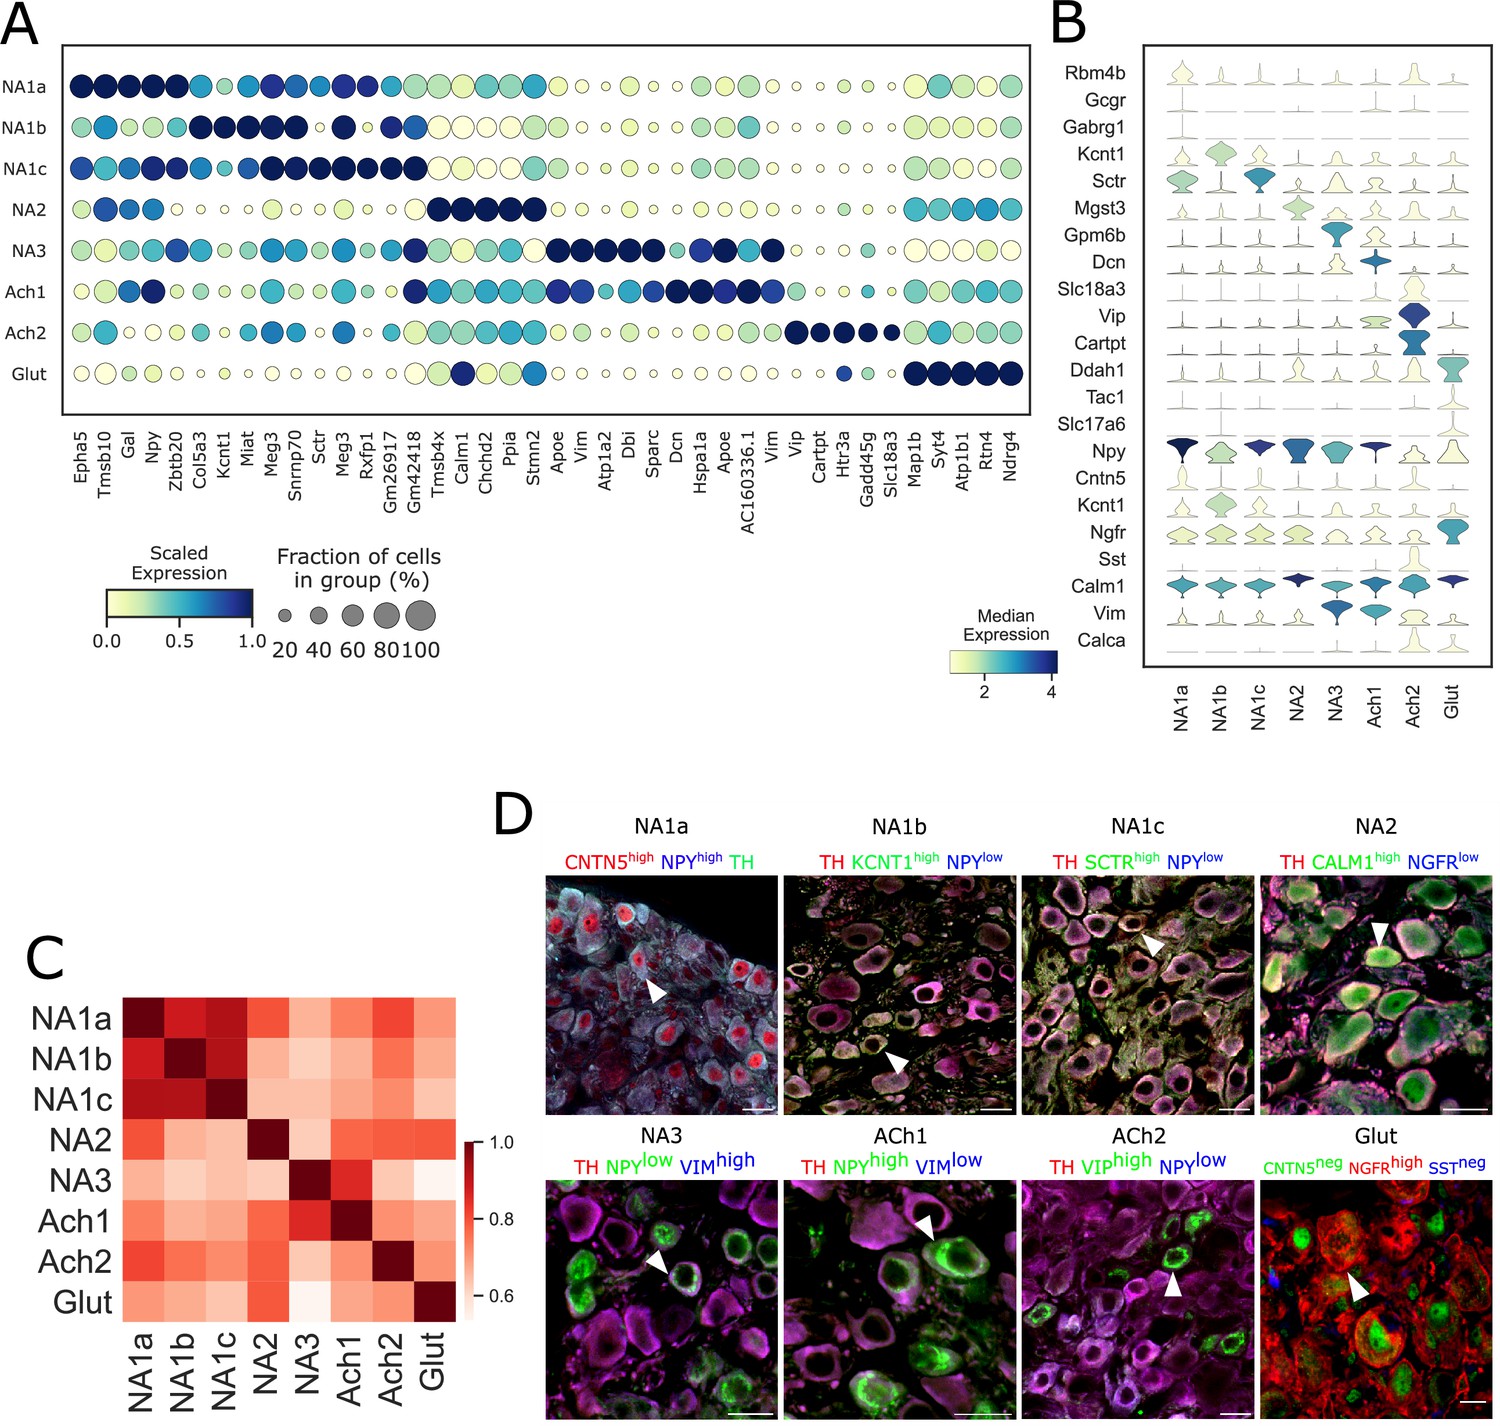
Transcriptomic profiles of each neuronal subtype in stellate ganglia.
(A) Dot-plot shows different transcriptomic profiles of each neuronal subtype in stellate ganglia. (B) Violin plot of expression levels of previously known, and novel marker genes. Genes used to validate the clusters by immunohistochemistry are included. (C) Pearson correlation between neuronal subtypes based on mean gene expression in each cluster. (D) Immunohistochemistry validation of neuronal subtypes in the stellate ganglion identified by scRNAseq. n=6 mice. Scale bar: 20 µm.
Figure 1—figure supplement 6

Immunohistochemistry validation of bilateral stellate ganglion neuronal subtypes identified from scRNAseq data analysis.
Except NA2 and Glut, all other neuronal subtypes express either high or low Npy. NA1a, NA1b, NA1c neurons appeared numerically more compared to the NA2, NA3, ACh1, ACh2, and Glut. (A) NA1a neuronal subtypes in the stellate ganglia. NA1a neurons express high Cntn5 and Npy (Inset) and can be easily distinguished from the low Npy expressing neurons co-labeled with Cntn5high. (B) Stellate section contains neurons that stained for Kcnt1 and express either low or high Npy but the NA1b subtype can be distinguished by low Npy and high Kcnt1 expression (inset). (C) NA1c subtype similar to NA1b contains low Npy but higher Sctr labeled on the cell borders (inset). (D) NA2 neurons are differentiated from the Glut with expression of high Calm1 and low Ngfr while Glut neuronal subtype expresses low Calm1 and high Ngfr. (E) NA3 subtype can be separated from ACh1 based on low Npy and high Vimentin gene expression whereas ACh1 (F); express high Npy and low Vimentin. (G) ACh2 subtype was separated from others with low Npy and high Vip expression. (H) Gluts expressed high Ngfr expression and are negative for Cntn5 and Sst. In insets, all subtypes are marked for each group and their magnified view is shown in the upper right corner of the figure. n=6. Scale bars 50 and 20 µm.
Figure 1—figure supplement 7
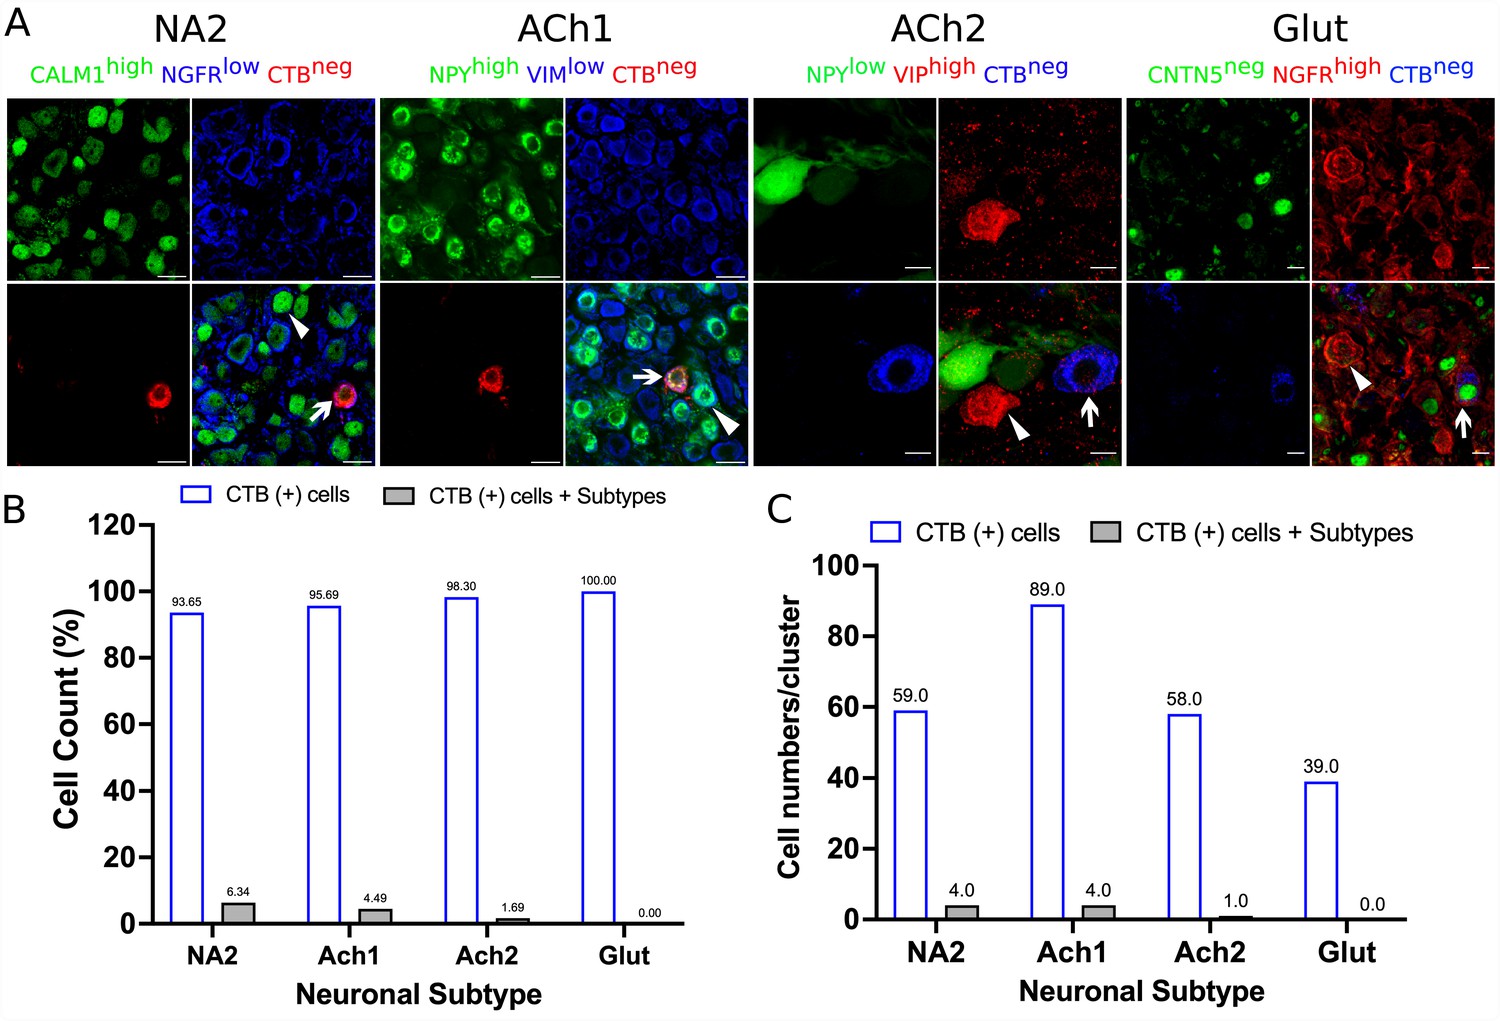
Accuracy of retrograde labeling of cardiac- and paw-innervating neuronal subtypes in stellate ganglia.
Stellate ganglia were labeled retrogradely using either CTB-647 or CTB-555 and stained for specific markers for neuronal subtypes that do not innervate the heart or paw. (A) Representative immunohistochemical stains of labeled ganglia as described. (B) Very low percentage of CTB-labeled cells show immunoreactivity to markers identifying neurons that do not innervate the heart or paw. (C) Number of cells corresponding to panel B. n=3 mice. Scale bar: 10 and 20 µm.
Figure 2
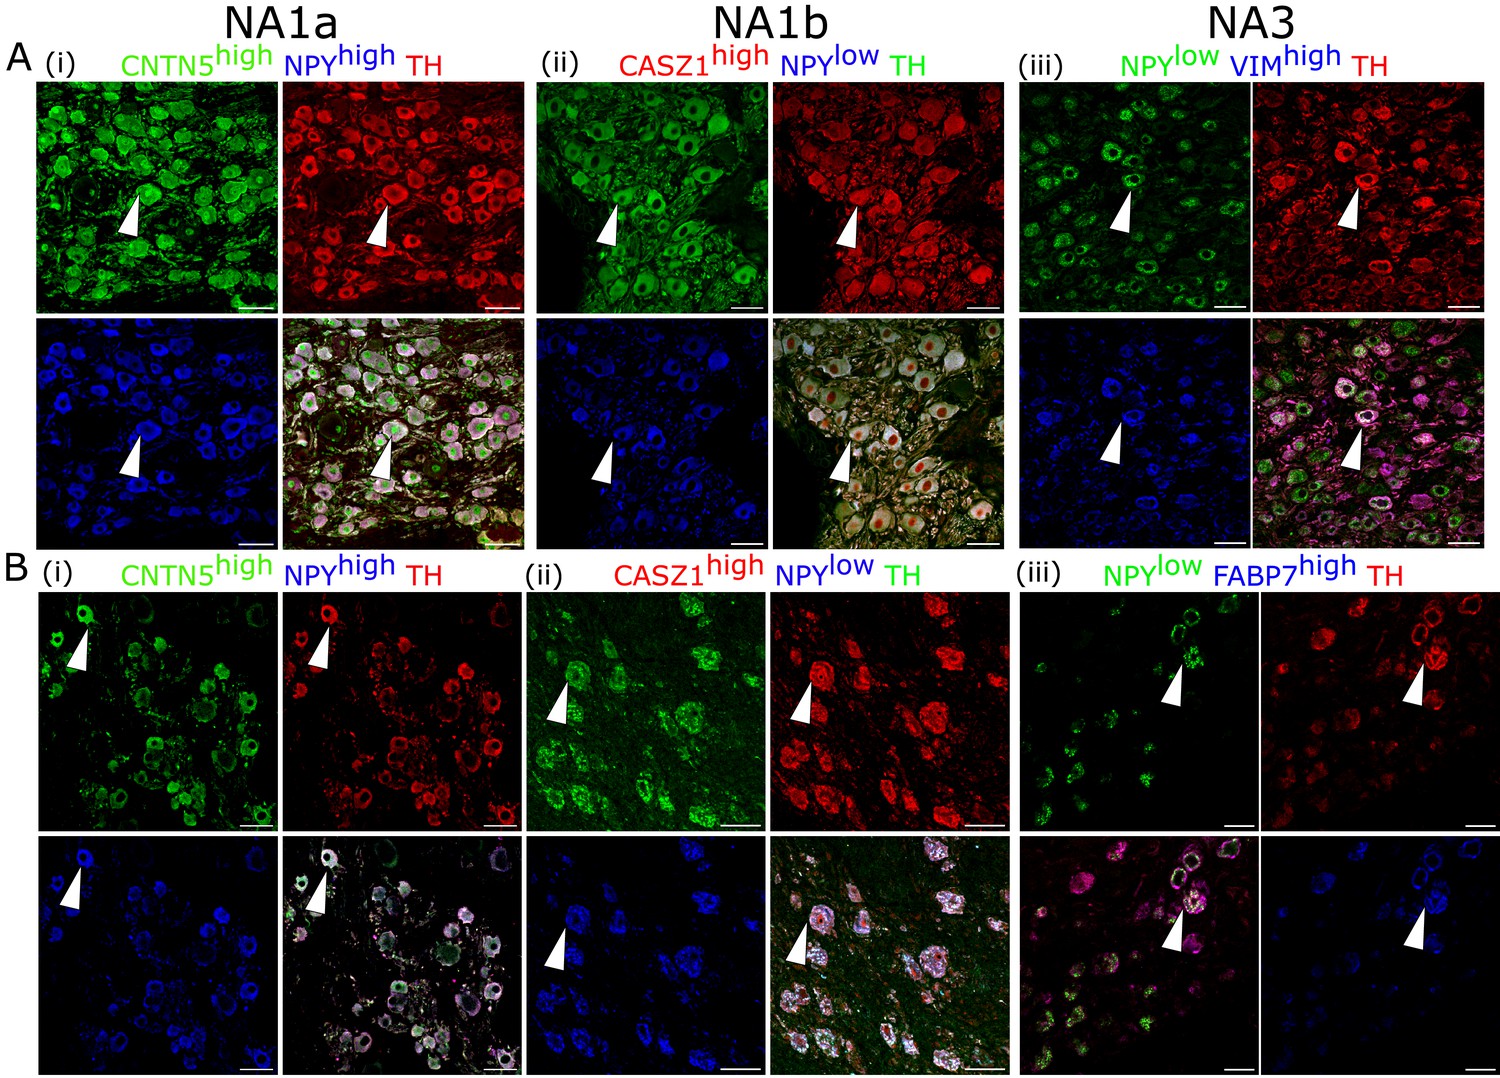
Cardiac clusters were also validated in porcine (A) and human (B) stellate ganglia using immunohistochemistry by combining the specific marker genes for each neuronal subtype.
(A, B) (i) NA1a neurons express high NPY and CNTN5. (A, B) (ii) NA1b subtype has low NPY and high CASZ1 expression level. (A) (iii) NA3, similar to NA1b, has low NPY but uniquely higher Vimentin expression in porcine tissues. (B) (iii) NA3, like NA1b, expresses low NPY and high FABP7 expression in humans. Scale bar: 50 µm. n=3 samples.
Figure 3 with 1 supplement
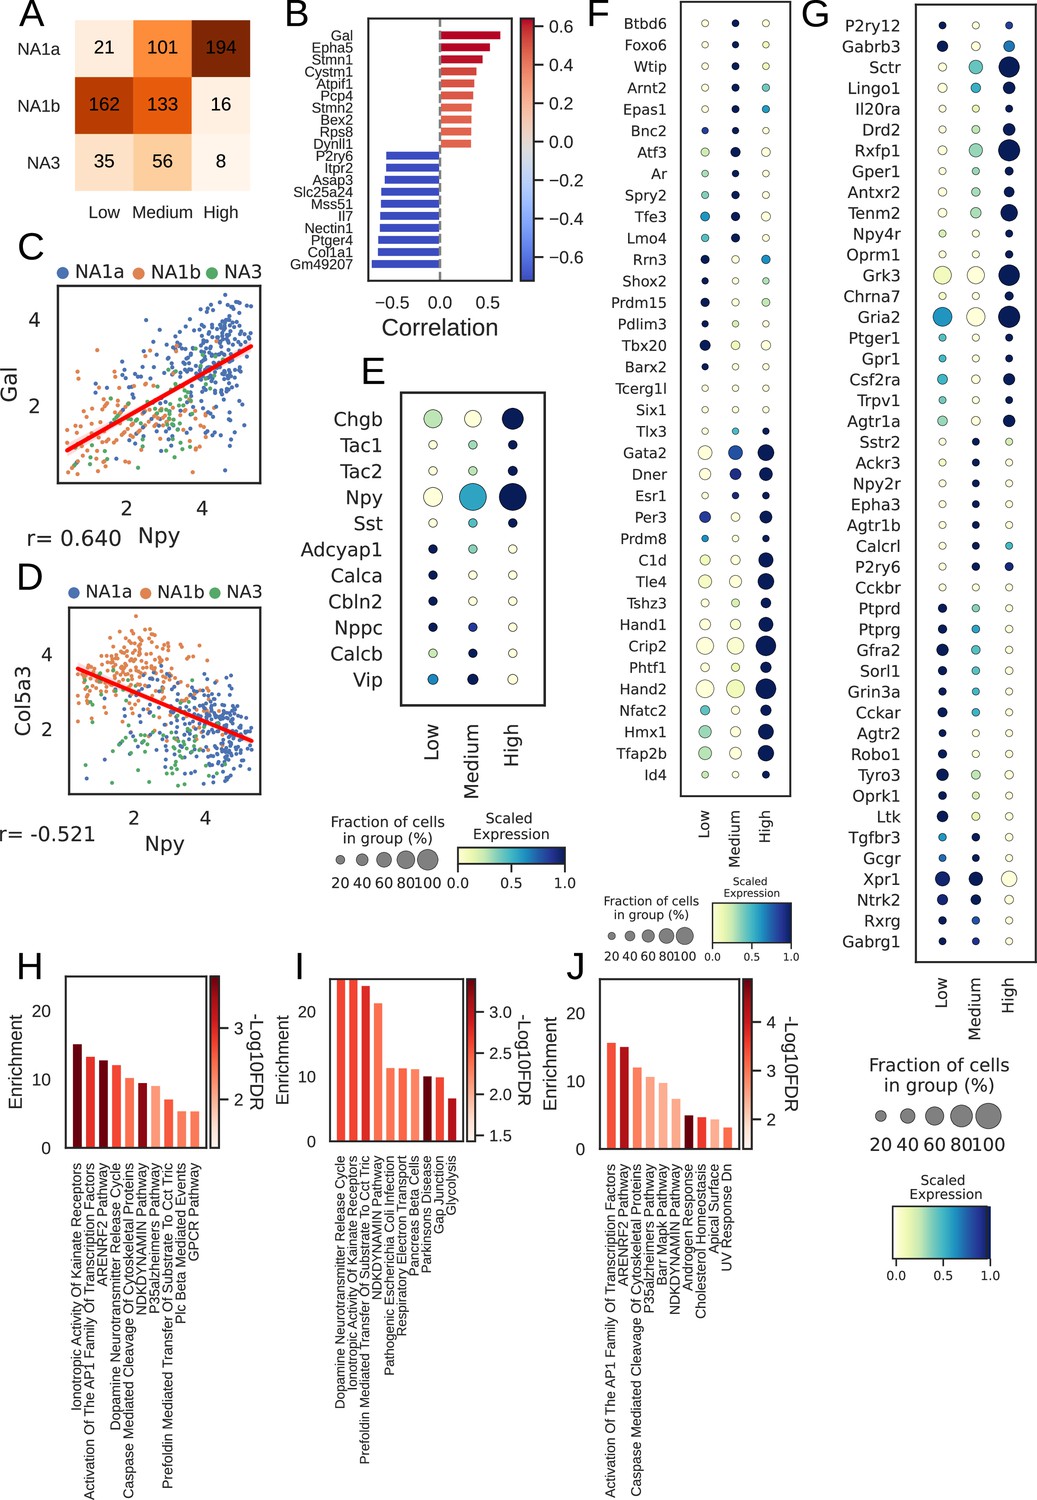
Npy gene distribution and the associated genes in cardiac neuronal subtypes.
(A) Distribution of subtypes across quantiles of Npy expression. (B) Top 10 positively (red) and negatively (Lake et al., 2016) associated genes with Npy. Intensity of the color indicates the strength of the Pearson correlation coefficient. (C, D) Scatter plots show the positive correlation of Gal (C) and, negative correlation of Col5a3 (D) with Npy expression on the log scale. The dots in the scatter plots are colored to represent each cardiac neuronal subtype. Cells containing zeros for either gene were removed. (E, F, G) Dot-plots show relative expression of neuropeptide (E), receptors (F), and transcription factors (G) in cells with low, medium, and high Npy expression. (H) Top 10 combined; (I) Positively and (J) Negatively enriched pathways associated with Npy. n=8 mice.
Figure 3—figure supplement 1

Npy distribution and associated genes in paw innervating neuronal subtypes.
(A) Distribution of subtypes across quantiles of Npy expression. (B) Top 10 positively- (red) and negatively- (blue) Npy associated genes (Lake et al., 2016). Intensity of the color indicates the strength of the Pearson correlation coefficient. (C) Relative expression of neuropeptide; (D) transcription factors; (E) receptors and; (F), ion channels in cells with low, medium, and high Npy expression. Top 10 enriched pathways for the: (G), combined; (H), Positive; and (I), negative associated genes with Npy.
Figure 4
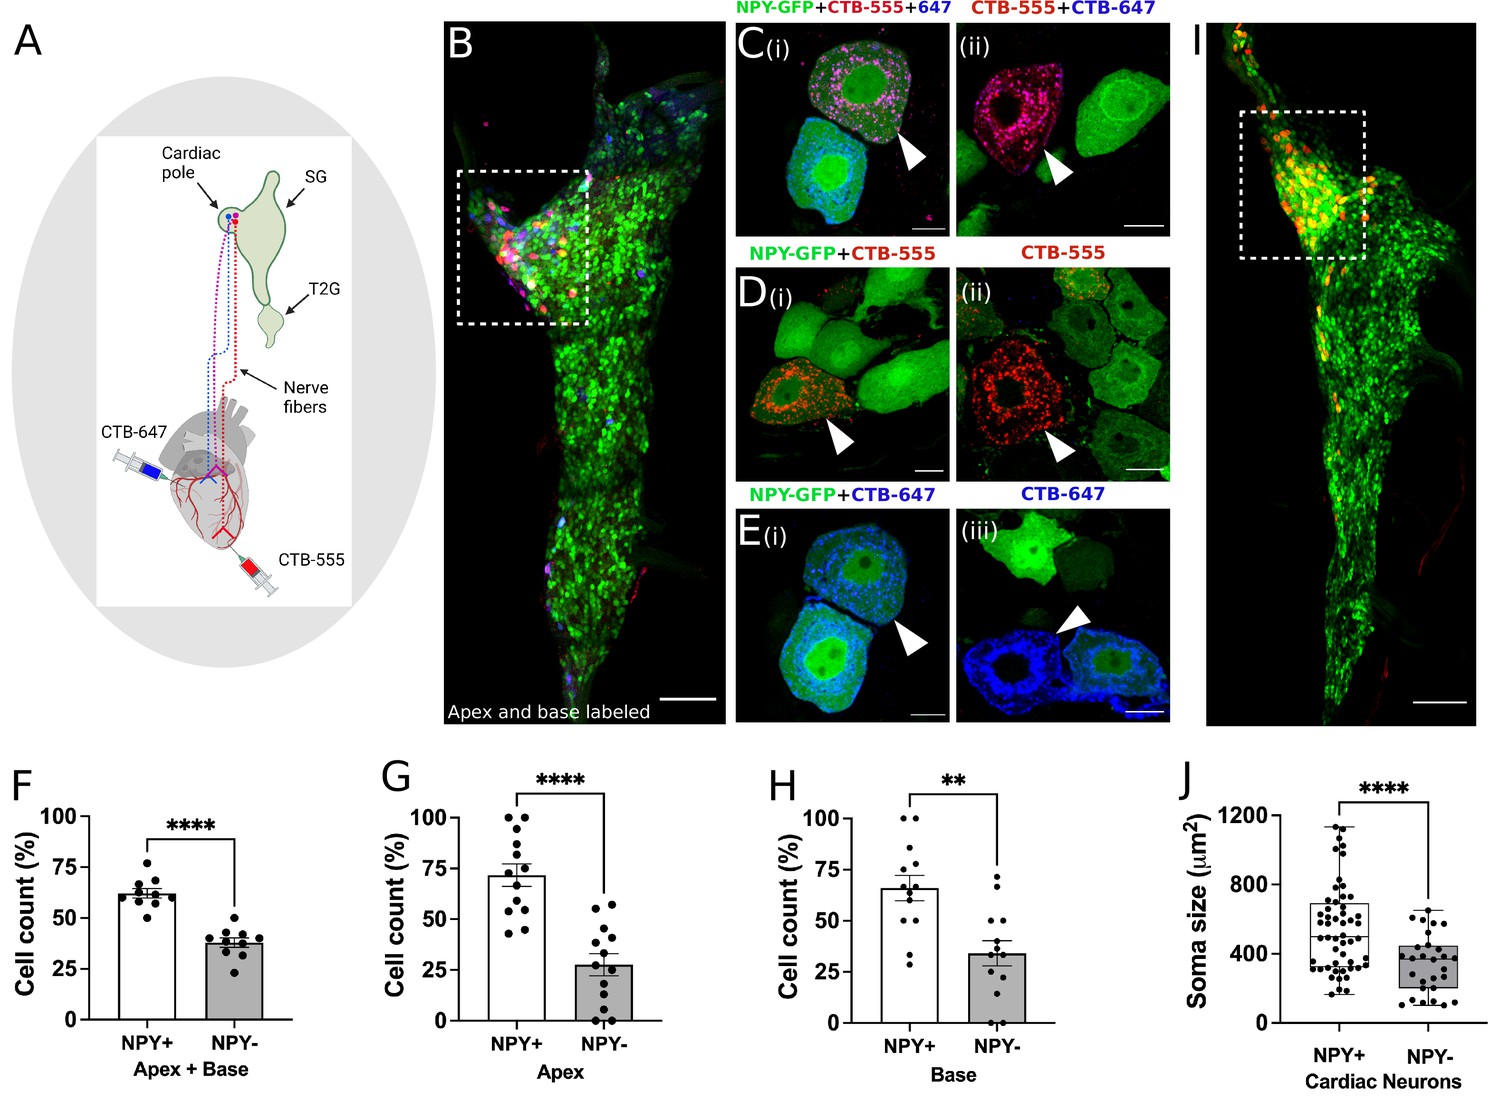
Distribution of NPY neurons innervating disparate regions of the heart.
Cholera toxin subunit B (CTB) conjugated Alexa Fluor 555 and 647 (CTB-555 or –647) were injected into the apex and base of the heart, respectively. (A) A schematic depiction of the approach used to retrograde label stellate ganglion neurons (SGNs). (B) An image of the right stellate ganglia from the heart after CTB-555 and CTB-647 retrograde labeling. Scale bars: 200 µm. (C,D,E) High-resolution images of several types of co-labeled cells appearing in the stellate ganglia. Scale bars: 10 µm. (F) Cell count for NPY +and NPY- neurons that innervate apex and base regions of the heart simultaneously. NPY +and NPY- neurons that innervate either only the apex (G) or base (H) heart regions. (I) Right stellate ganglia from NPY-hrGFP animals labeled retrograde with CTB-555 showing that most cardiac neurons are NPY expressing neurons. High-GFP expression observed in the cardiac pole (box). (J) Soma size measurements for cardiac innervating NPY +and NPY- neurons. n=7 mice/group. Data are shown as mean ± SEM and individual data points in (F, G, and H) represent each stellate ganglion. Normal distribution of data was assessed by Shapiro-Wilk and statistical analyses used Welch’s parametric t-test for (F), (G), (H), and (J). A box and whisker plot representing data points as individual cells visualizes the trend in soma size for cardiac NPY +and NPY- neurons and Welch’s t-test was used for finding the statistical significance in panel (J). **=p < 0.01, ****=p < 0.001.
Figure 5
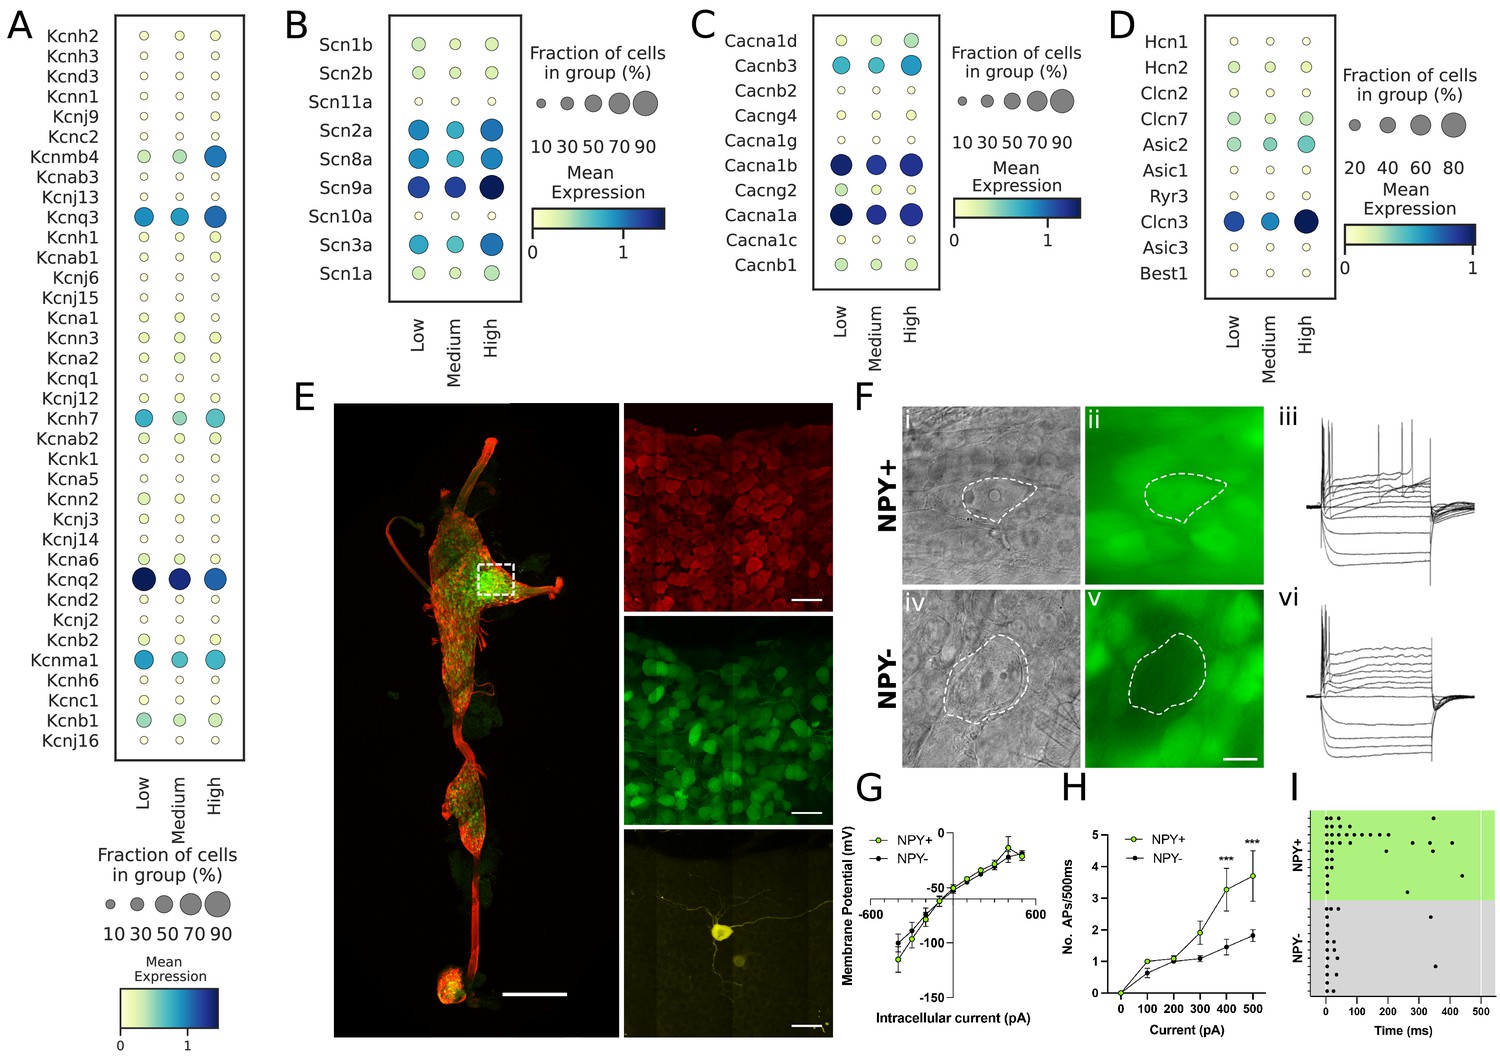
Transcriptomic and electrophysiological properties of Npyhigh vs Npylow/neg neurons.
(A,B,C,D) Distribution of different ion channels associated with Npyhigh and Npylow/neg expressing cells: Potassium channels (A); Sodium channels (B); Calcium channels (C); and several other chloride, acid sensing ion channels (D) in high, medium, and low Npy expressing cells. (E) Confocal image of a fixed right stellate ganglion whole mount. PGP9.5 (red), Npy-GFP+ (green), and Neurobiotin (yellow). Magnified images from boxed region appear in right hand panels. (F) Npy + cells identified by epifluorescence during targeting with intracellular microelectrodes. Left panels DIC image (i,iv), right panel GFP (green) (ii),(v). (iii),(vi); Membrane potential tracings from a GFP+ (iii) and a GFP- (vi) cells in response to 500ms hyperpolarizing and depolarizing pulses. Resting membrane potential for both cells was more or less similar to ~–52.45 mV. Dash is 0 mV. (G,H,I) Summary electrophysiology data for the Npy+ (n=11 mice) and Npy- cells (n=11 mice). GFP + cells had similar current-voltage relationship (G) but showed greater membrane excitability in response to intracellular depolarization (H). Data are shown as means ± SEM; ***p<0.001 compared with Npy- cells. The raster plot (I) illustrates time of peak action potential amplitude in response to 500ms, 500 pA depolarizing current. Note the greater number of APs and shorter interspike interval in Npy + cells that reveal increased neuronal excitability. A two-way ANOVA followed by Sidak’s multiple comparison test was used for statistical analyses.
Figure 6
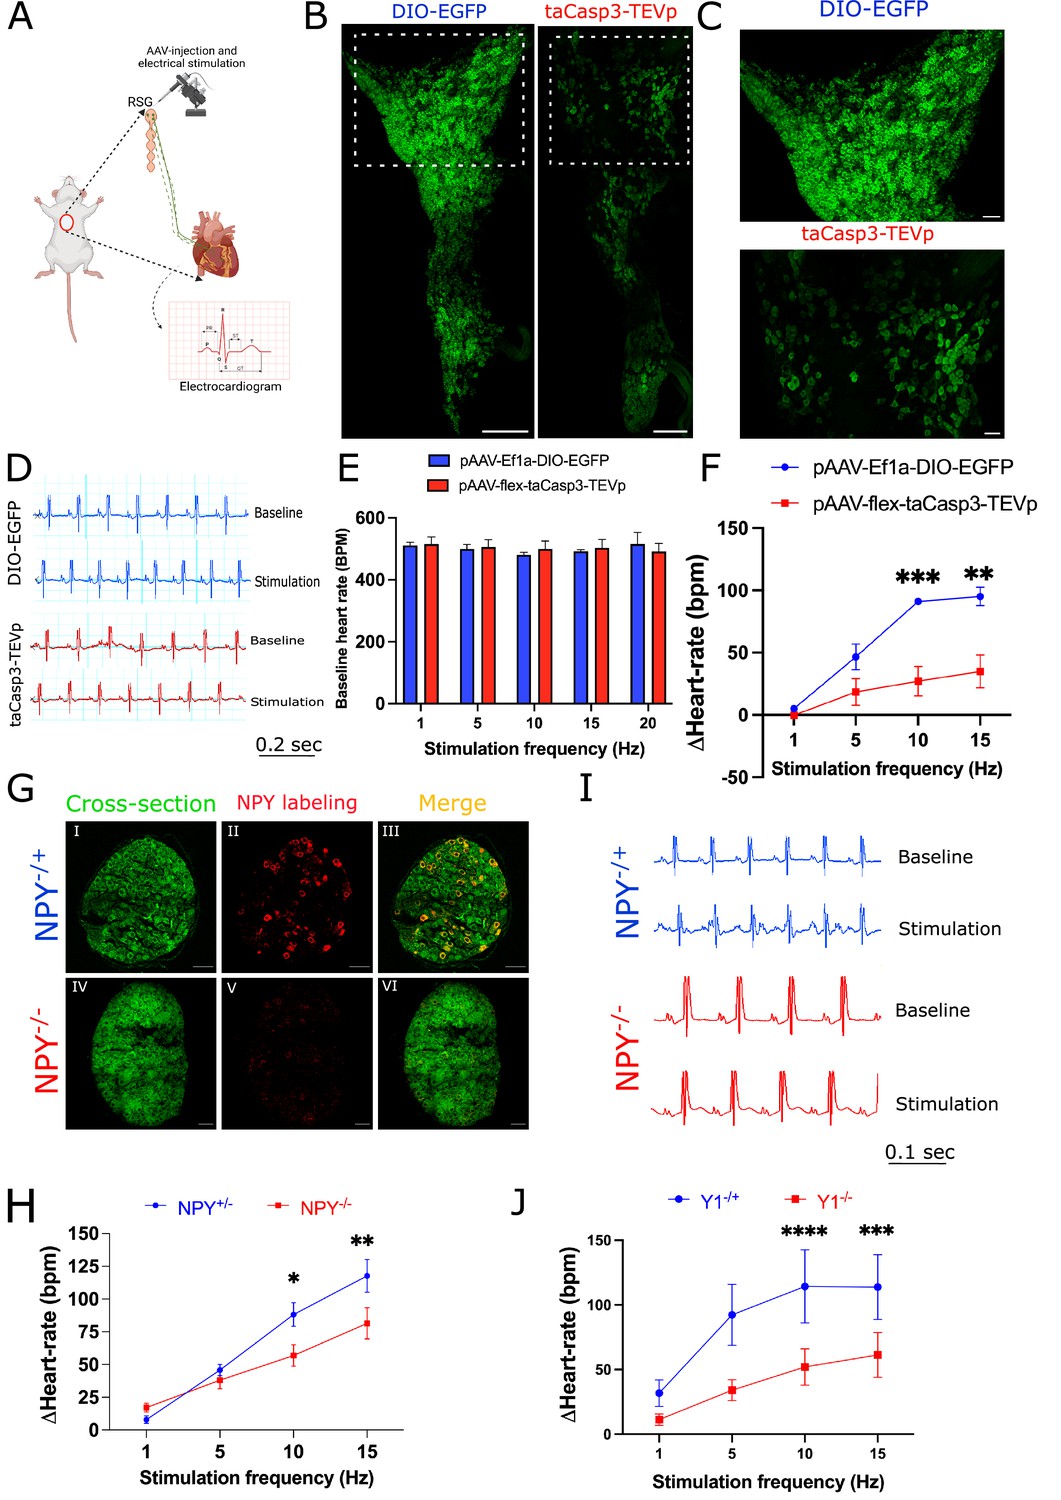
Cardiac sympathetic activation by stellate ganglionic neurons (SGNs) is mediated by NPY and receptor NPY-Y1R.
(A) A schematic representation of electrical stimulation and chemogenetic ablation of Npy-expressing neurons in right stellate ganglia. (B) Whole mount right stellate ganglia prepared and stained with NPY antibody (green) from DIO-EGFP and taCasp3-TEVp injected mice. (C) High-magnification images obtained from DIO-EGFP and taCasp3-TEVp virus injected in right stellate ganglia. (D) The representative electrocardiogram snaps during right stellate ganglion stimulation (RSGS) from control and NPY-expressing neurons ablated mice. (E) Baseline heart rate for control and NPY neurons ablated mice at 1, 5, 10, and 15 Hz stimulation frequencies. (F) Heart rate change at 1, 5, 10, and 15 Hz stimulation frequencies in control vs. NPY neurons ablated mice. n=3 for control mice and n=5 for NPY neurons ablated mice. (G) Validation of Npy null mice. Right stellate ganglionic sections from Npy+/- and Npy-/- mice were stained with NPY antibody. (G) (І,ІV) Autofluorescence to visualize tissue- architecture. (G) (ІІ,V) NPY staining was observed only in tissue sections from Npy+/- mice. (H) The representative electrocardiogram images from RSGS in Npy+/- vs. Npy-/- mice. (I) Change in heart rate at 1, 5, 10, and 15 Hz stimulation frequencies in Npy+/- vs. Npy-/- mice (n=8). (J) Heart rate change at 1, 5, 10, and 15 Hz stimulation frequencies in Npy1r+/- vs. Npy1r-/- mice (n=4). Data are shown as mean ± SEM. *p<0.05, **p<0.01, ***p<0.001, ****p<0.0001; Scale bars: 200 and 50 µm. The two-way ANOVA repeated measures followed by Sidak’s multiple comparison test were used for the statistical analyses.
Figure 7
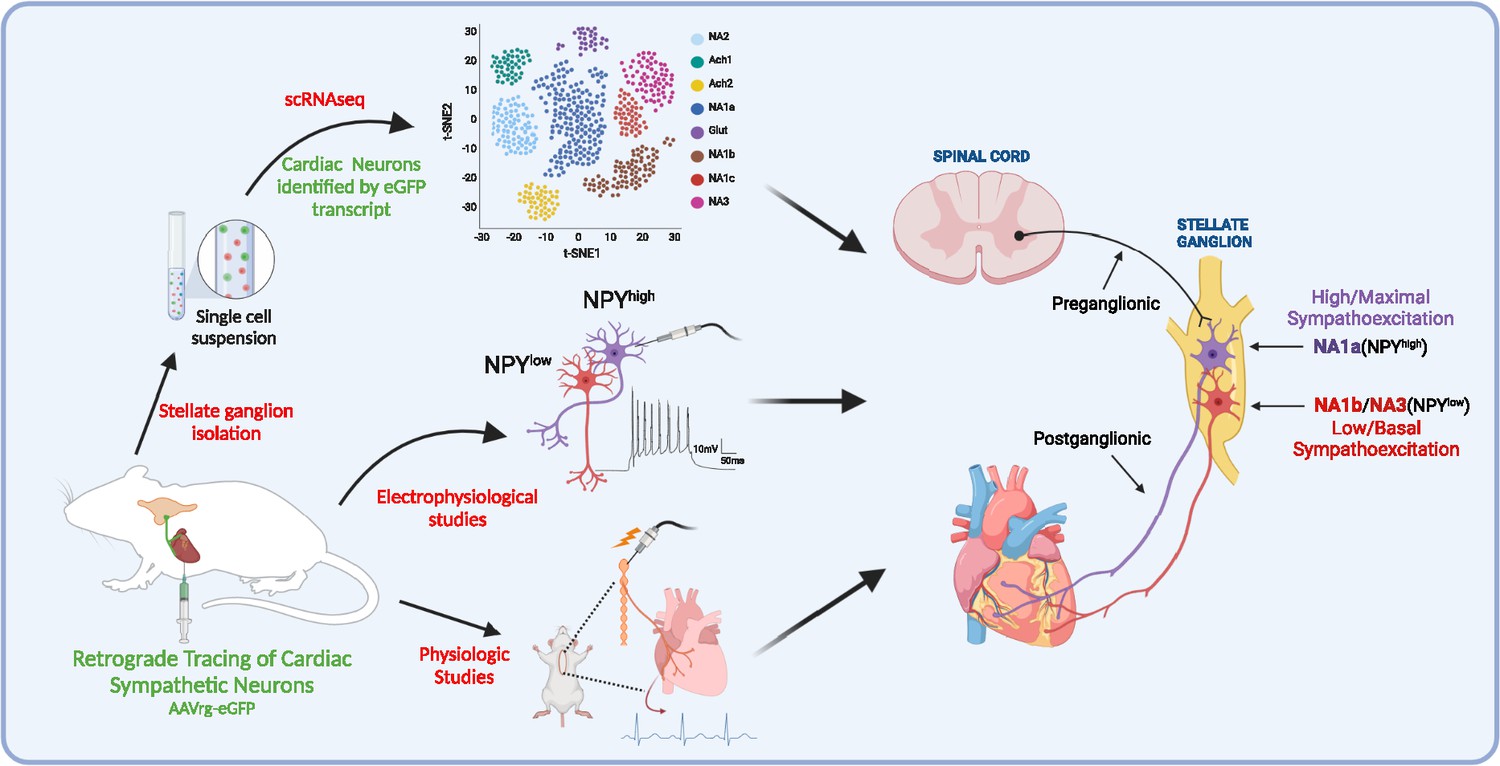
A schematic diagram of the approach taken in the current study.
We identified and characterized cardiac innervating high- or low-Npy expressing neuronal subtypes that reside in the stellate ganglia. We identified intracardiac distribution of Npy-expressing cells, characterized their structural and electrophysiological properties, and determined the physiological function of Npy in relation to cardiac contractility.
Tables
Author response table 1
Supplementary Table 1.
| Sample | Batch | Sequencing Depth (UMIs/Cell) | Sequencing Saturation |
|---|---|---|---|
| Mouse-2–1_WTLM | 2 | 5,558 | 60.9% |
| Mouse-2–2_WTLM | 2 | 6,241 | 68.3% |
| Mouse-2–3_WTLM | 2 | 3,818 | 83.1% |
| Mouse-2–4_WTLM | 2 | 5,627 | 59.8% |
| Mouse-2–6_WTLM | 2 | 4,953 | 60.4% |
| Mouse-1–3_WTLM | 1 | 5,599 | 88.5% |
| Mouse-1–6_WTLM | 1 | 4,441 | 87.8% |
| Mouse-1–7_WTLM | 1 | 5,157 | 81.2% |
Additional files
-
Supplementary file 1
RNA Sequencing Information.
- https://cdn.elifesciences.org/articles/86295/elife-86295-supp1-v2.docx
-
Supplementary file 2
Additional Data on Sequenced Genes.
- https://cdn.elifesciences.org/articles/86295/elife-86295-supp2-v2.xlsx
-
MDAR checklist
- https://cdn.elifesciences.org/articles/86295/elife-86295-mdarchecklist1-v2.docx
Download links
A two-part list of links to download the article, or parts of the article, in various formats.
Downloads (link to download the article as PDF)
Open citations (links to open the citations from this article in various online reference manager services)
Cite this article (links to download the citations from this article in formats compatible with various reference manager tools)
Tiered sympathetic control of cardiac function revealed by viral tracing and single cell transcriptome profiling
eLife 12:e86295.
https://doi.org/10.7554/eLife.86295


