Two conserved vocal central pattern generators broadly tuned for fast and slow rates generate species-specific vocalizations in Xenopus clawed frogs
- School of Biological Science, University of Utah, United States
Figures
Figure 1 with 1 supplement
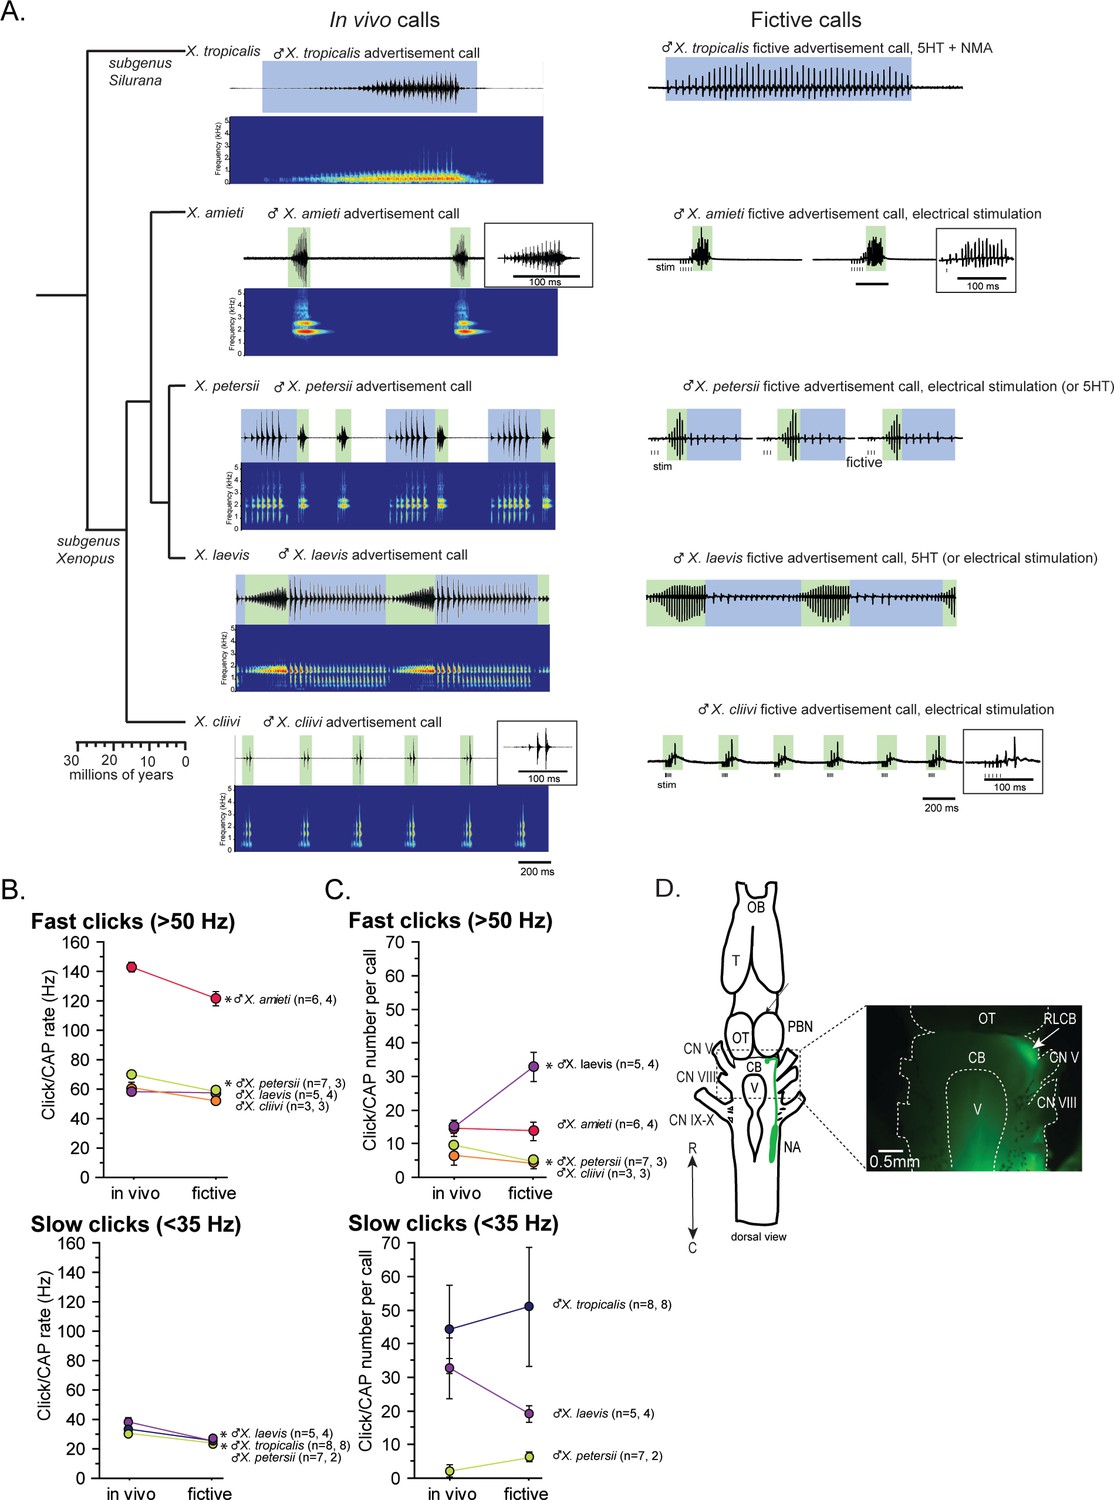
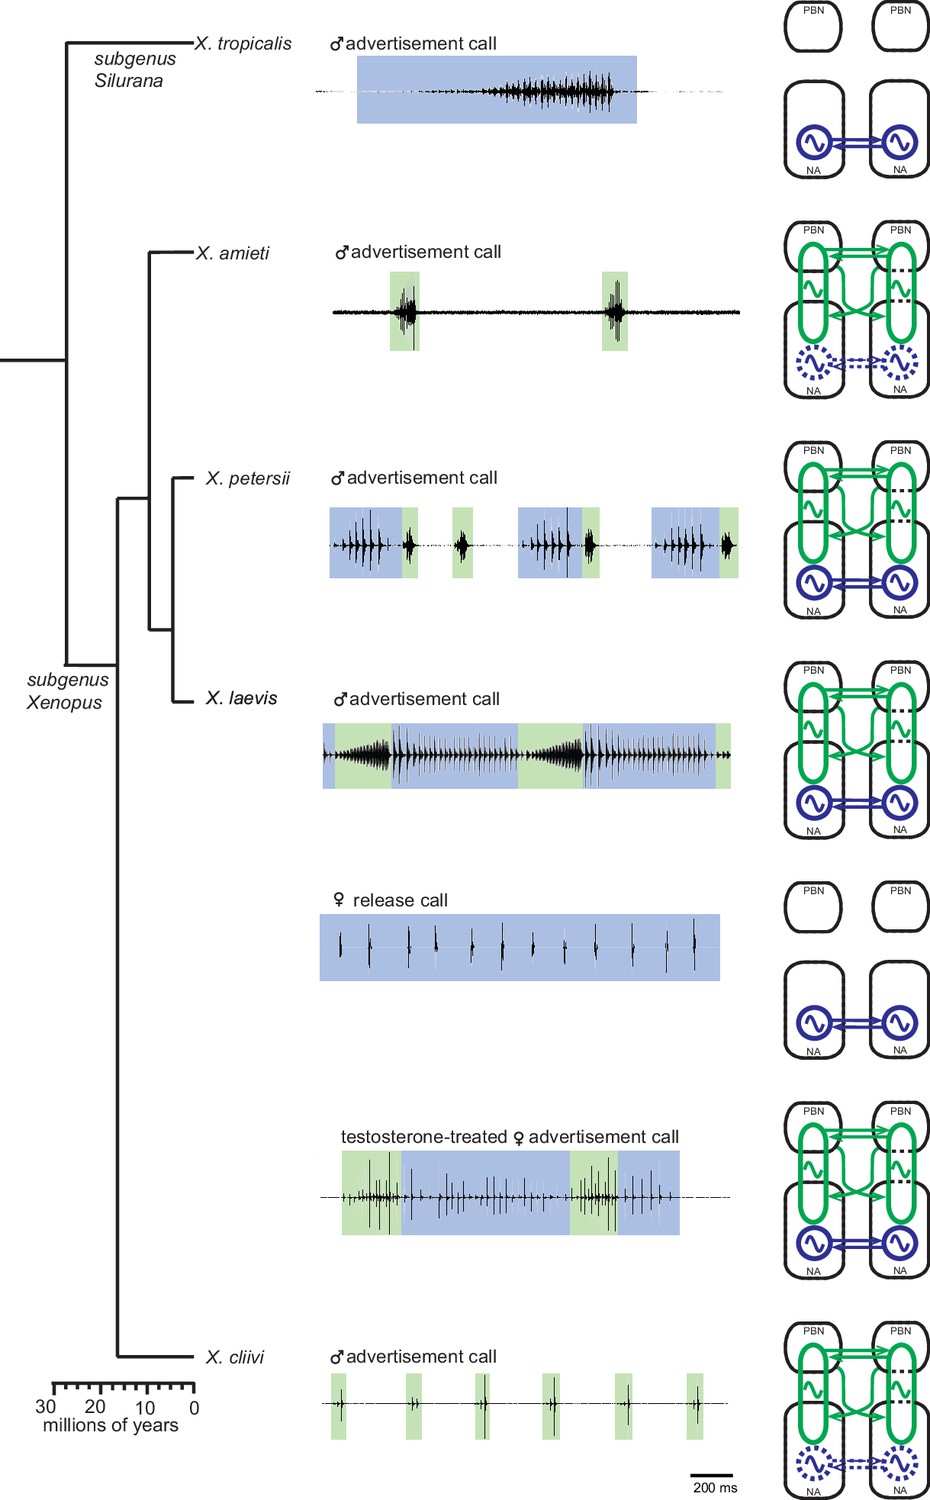
Phylogeny of five species of Xenopus and their advertisement calls.
(A). Chronogram, in vivo vocalizations, and fictive vocalizations recorded from males of each species. Left column: chronogram based on mitochondrial DNA (Modified from Evans et al., 2015) of studied species. Middle column: amplitude envelope (top panel) and sound spectrogram (bottom panel) of in vivo advertisement calls. Right column: fictive advertisement calls recorded ex vivo from the isolated brain. The green and blue background of traces indicate fast (>50 Hz) and slow (<35 Hz) clicks, respectively, and the vertical lines below the fictive vocalizations labeled with ‘stim’ indicate electrical stimuli applied to the rostral-lateral cerebellum (RLCB, D) to elicit fictive calls in some brains. The type of stimulus following the species name indicates what was used to elicit the fictive calls shown, and those in parenthesis are other stimulus types that are also effective in eliciting fictive calls. (B). Comparison of click and compound action potential (CAP) rates of calls recorded in vivo and ex vivo from each species. Each circle with an error bar indicates the mean + s.e. of click or CAP rates (in Hz). For both B and C, asterisks preceding the species name indicate significant differences between the rates of clicks/CAPs produced in vivo and ex vivo. Note that some error bars are hidden behind the data points due to the small size. (C). The number of clicks/CAPS in a call recorded in vivo and ex vivo. Each circle with an error bar indicates the mean + s.e. of click/CAP number. The first and the second sample sizes after species name refers to in vivo and fictive data, respectively. (D). The location of the rostral-lateral cerebellum (RLCB), a site that is effective in eliciting fictive calls when stimulated electrically. Left; a cartoon showing the dorsal view of an isolated brain of Xenopus. The double headed arrow indicates rostral (R) and caudal (C) orientation of the brain. When dextran dye was injected into the nucleus ambiguus (NA), axons of projection neurons in the NA and the parabrachial nucleus (PBN) that project reciprocally to each other are labeled and can be viewed from the dorsal surface of the brain as seen in the photo on the right. The area at the lateral edge of the cerebellum (CB) along the labeled projections is the RLCB (white arrow). Delivering stimulus pulses to this area using a concentric electrode elicits fictive calls in most brains except in the brain of X. tropicalis. CB; cerebellum, CN V; cranial nerve V, NA; nucleus ambiguus, OB; olfactory bulb. OT; optic tectum, PB; parabrachial nucleus, T; telencephalon.
Figure 1—figure supplement 1
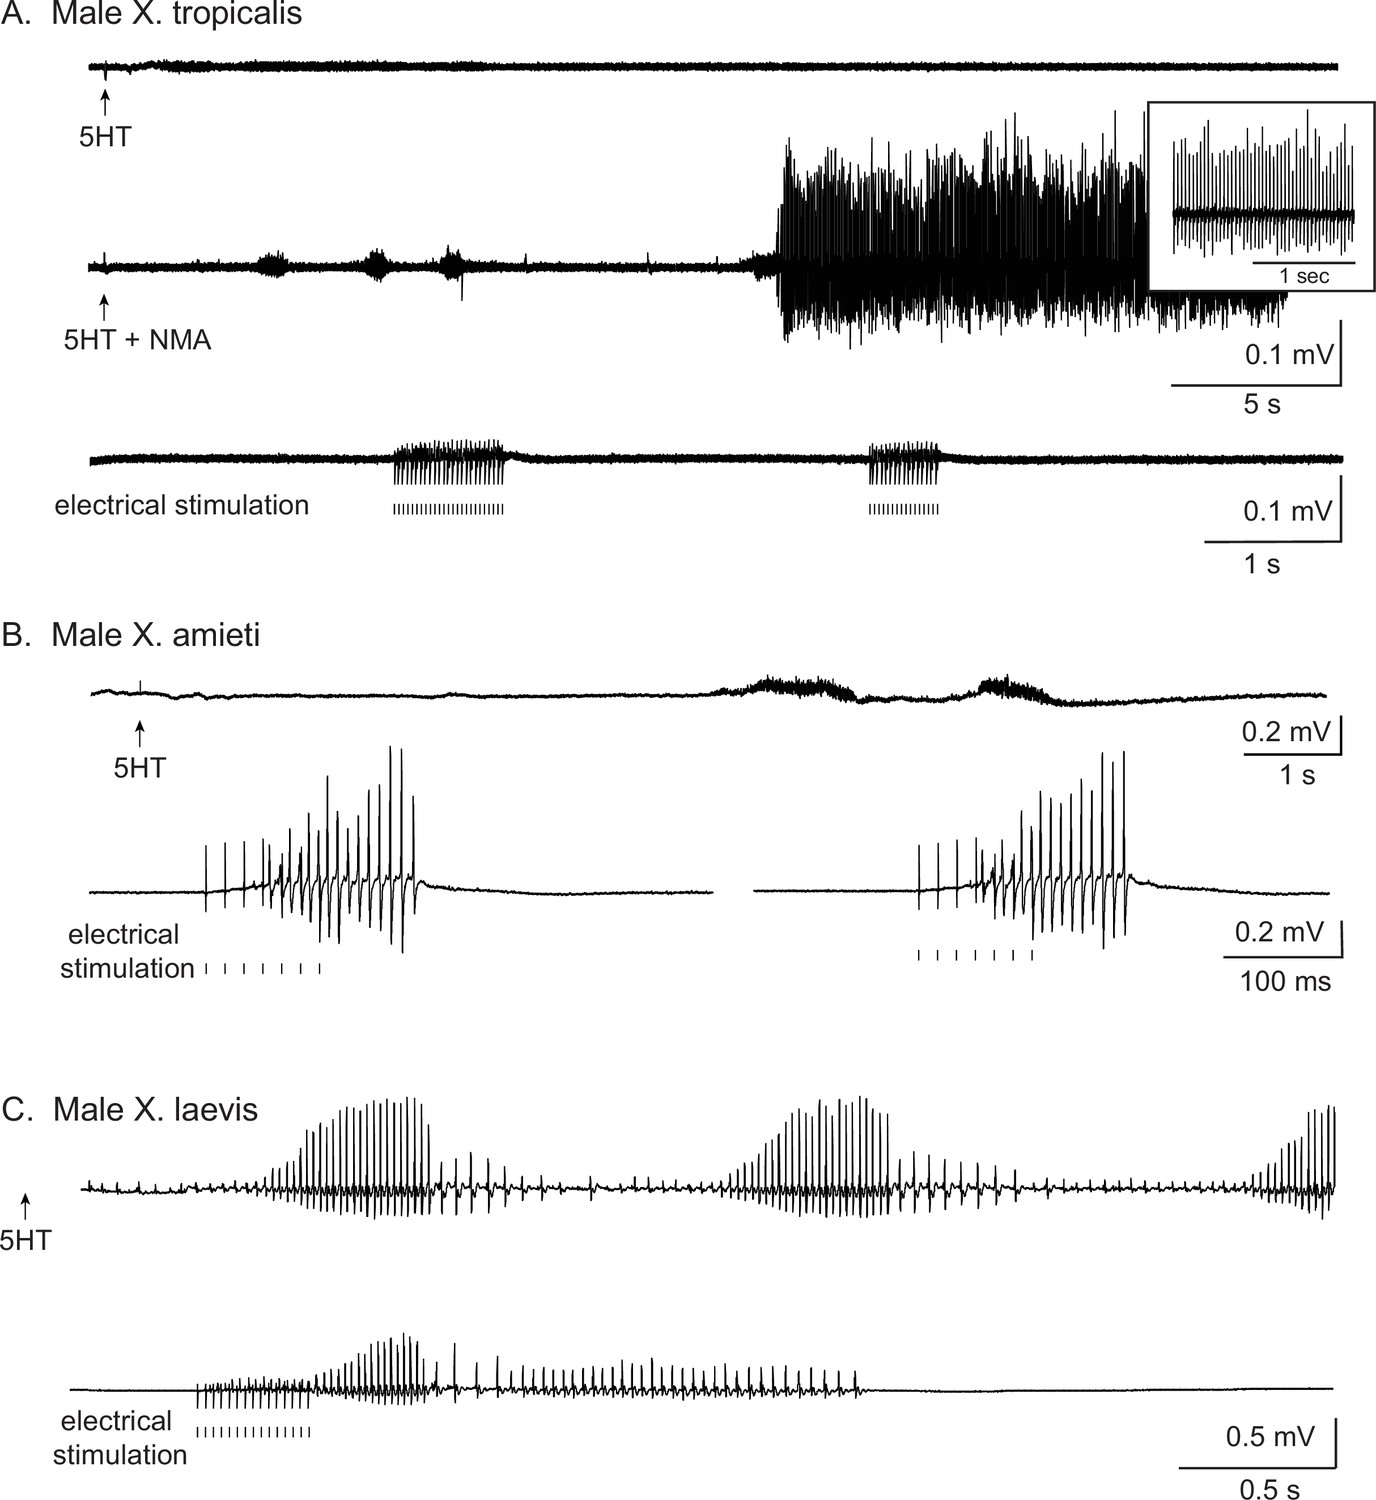
Types of stimuli used to elicit fictive advertisement calls.
All traces are laryngeal nerve recordings from isolated brain preparations. For all the figures, the upward arrows under the traces indicate the time at which 5HT or 5HT and NMA are applied, and the vertical lines indicate the time at which electrical pulses were delivered to the rostral lateral cerebellum (RLCB, Figure 1D). (A). The application of 5HT and NMA, but not 5HT alone nor electrical stimuli delivered to the RLCB elicit fictive advertisement calls from the brains of X. tropicalis. Top two traces are obtained from the brain of the same individual, and the bottom trace was obtained from another individual. (B). The electrical stimuli delivered to RLCB, but not the application of 5HT elicit fictive advertisement calls from the brains of X. amieti. All the recordings were obtained from the brain of the same individual. (C). Both the application of 5HT and the electrical stimulation delivered to the RLCB elicit fictive advertisement calls from the brains of male X. laevis. Both recordings were obtained from the brain of the same individual. The left-pointing arrow indicates that 5HT was applied to the brain two minutes before the beginning of the trace.
Figure 2
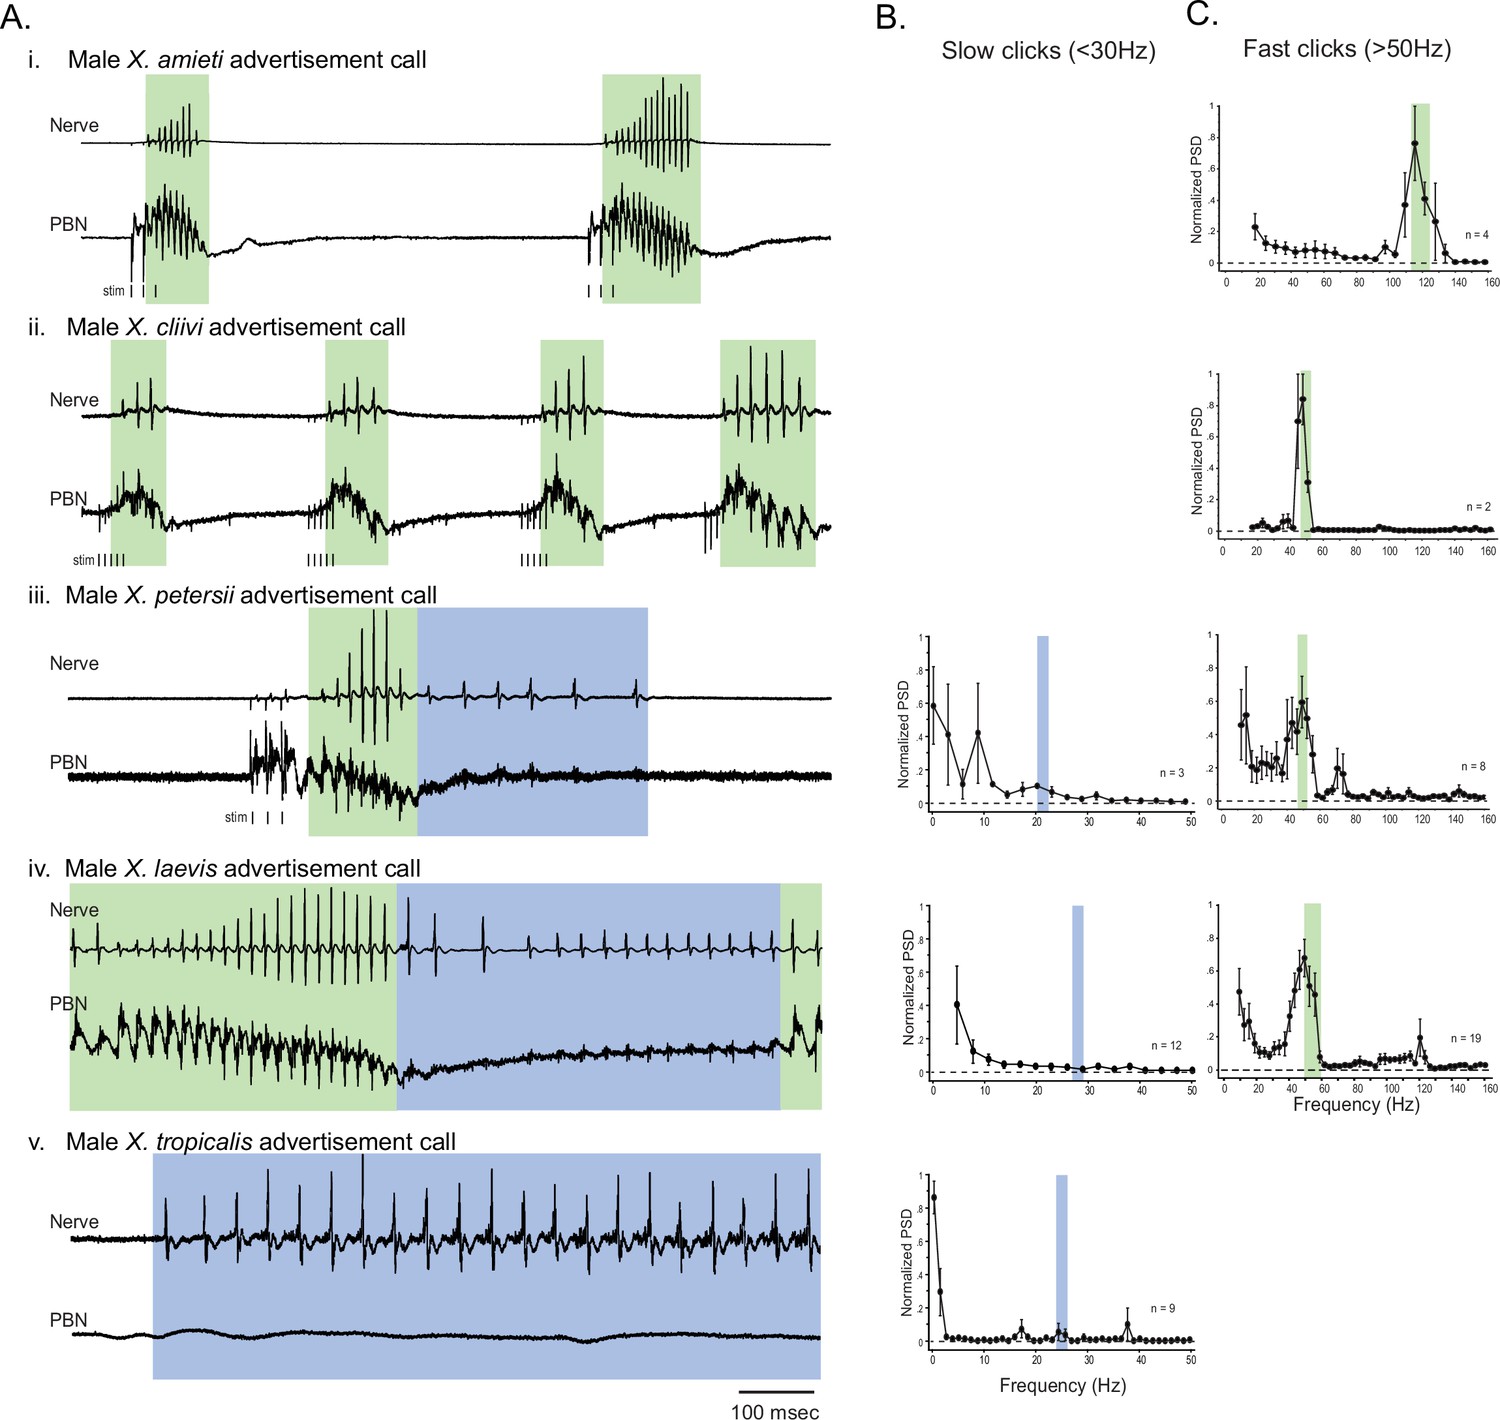
The activity of the parabrachial nucleus during fictive advertisement calls.
(A). Local field potential (LFP) recordings obtained from the parabrachial nucleus (PBN) during fictive advertisement calling in male X. amieti (i), male X. cliivi (ii), male X. peterii (iii), male X. laevis (iv), and male X. tropicalis (v). Top traces; laryngeal nerve recording, bottom traces: PBN LFP recordings. The green and blue backgrounds indicate fast (>50 Hz) and slow (<35 Hz) compound action potentials (CAPs), respectively. Vertical lines below the traces labeled with ‘stim’ indicate the timing of electrical pulses delivered to the RLCB (Figure 1D) to elicit fictive advertisement calls in some cases. (B). mean power spectral density (PSD) of PBN LFP recordings during fictive slow clicks seen in A. Blue frames show the mean ± std of the CAP rates for slow clicks. (C). Mean PSD of PBN LFP recordings during fictive fast clicks seen in A. Green frames show the mean ± std of the CAP rates for fast clicks.
Figure 3
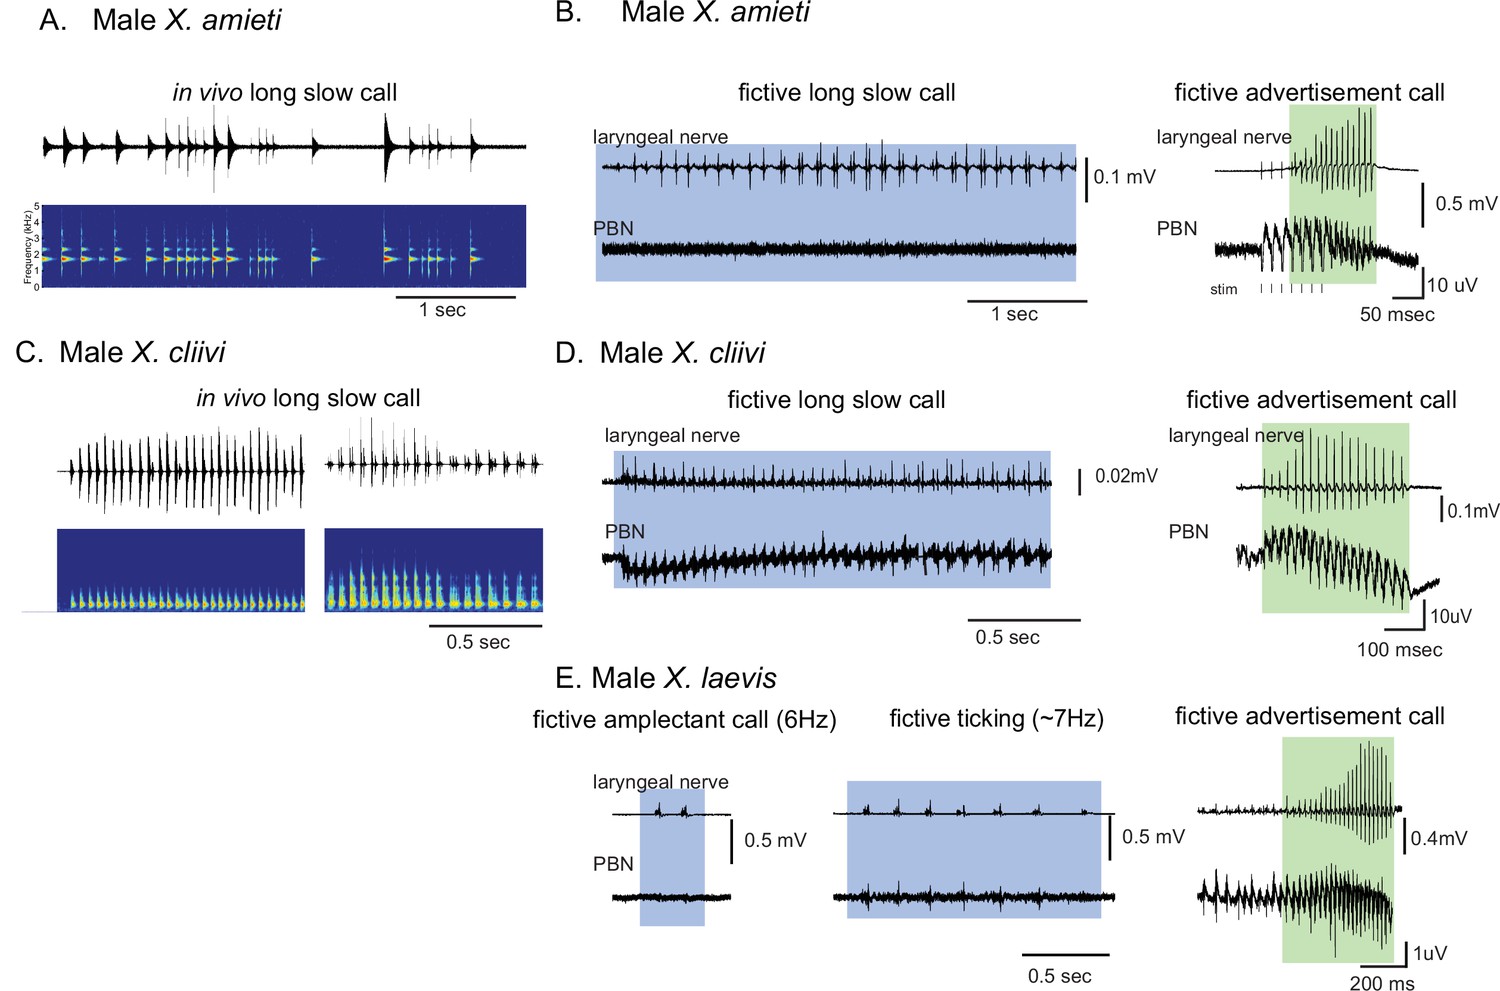
Calls produced by fast clickers containing slow (<35 Hz) clicks are not accompanied by salient parabrachial nucleus activity.
(A, C), Amplitude envelope (top) and the sound spectrogram (bottom) of a ‘long slow call’ produced by male X. amieti (A) and male X. cliivi (C) in vivo. (B, D), Presumed fictive long slow call(left with blue background) and fictive advertisement call (right with green background) obtained from the same brain of a male X. amieti (B) and male X. cliivi (D). Top; Laryngeal motor nerve recordings, bottom; parabrachial nucleus (PBN) local field potential (LFP) recordings. The same Y scale for the PBN LFP (but with an extended X scale) is used for both fictive calls for ease of amplitude comparison. (E). A fictive amplectant call (left), fictive ticking (middle), and fictive advertisement call (right) recorded from a brain of the same male X. laevis. Top; laryngeal nerve recording, bottom; PBN LFP recording. The Y scale for the PB LFP recordings (but not the X scale) is the same for all three recordings for ease of amplitude comparison.
Figure 4
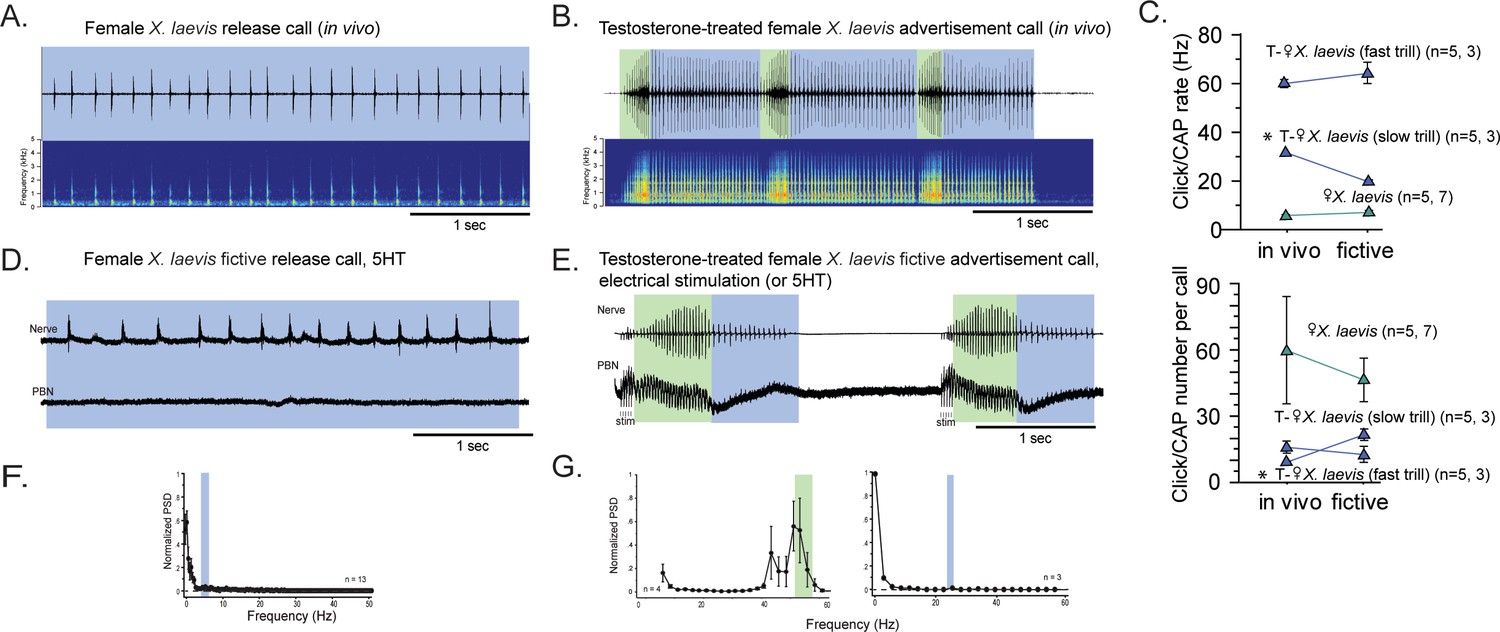
The parabrachial nucleus that is silent during release calling in female X. laevis becomes active after testosterone-induced vocal masculinization.
(A, B) Amplitude envelope (top) and sound spectrogram (bottom) of a release call (A) and advertisement call (B) recorded in vivo from female X. laevis and testosterone-treated female X. laevis. The blue and green background behind the amplitude envelope indicates slow (<35 Hz) and fast (>50 Hz) clicks, respectively. (C) Click repetition rates and click number per call recorded in vivo and ex vivo from female X. laevis and testosterone-treated female X. laevis. Each triangle with an error bar indicates the mean ± s.e. of click repetition rate (top) and click number per call (bottom). The names of the animal preceded by an asterisk indicate a significant difference between the in vivo and fictive calls. The sample sizes following species name refer to in vivo and fictive data, respectively. (D, E) Fictive release call and advertisement calls recorded from an isolated brain of a female X. laevis and testosterone-treated female X. laevis. Top trace; laryngeal nerve recordings, bottom trace; local field potential (LFP) recordings obtained from the parabrachial nucleus (PBN). The blue and green background behind the amplitude envelope indicates slow (<35 Hz) and fast (>50 Hz) clicks, respectively. The type of stimulus following the species name indicates what was used to elicit the fictive calls shown, and that in parenthesis is another stimulus type that is also effective in eliciting fictive calls. Compare the PBN activity during fast trills to those recorded from the intact female during fictive release calling. (F, G) Mean power spectral density (PSD) of PBN LFP recordings during fictive release calling in female X. laevis (F) and fictive advertisement calling in testosterone-treated female X. laevis (G). Blue and green frames show the mean + std of the CAP rates for fictive release calls, slow trills, and fast trills.
Figure 5
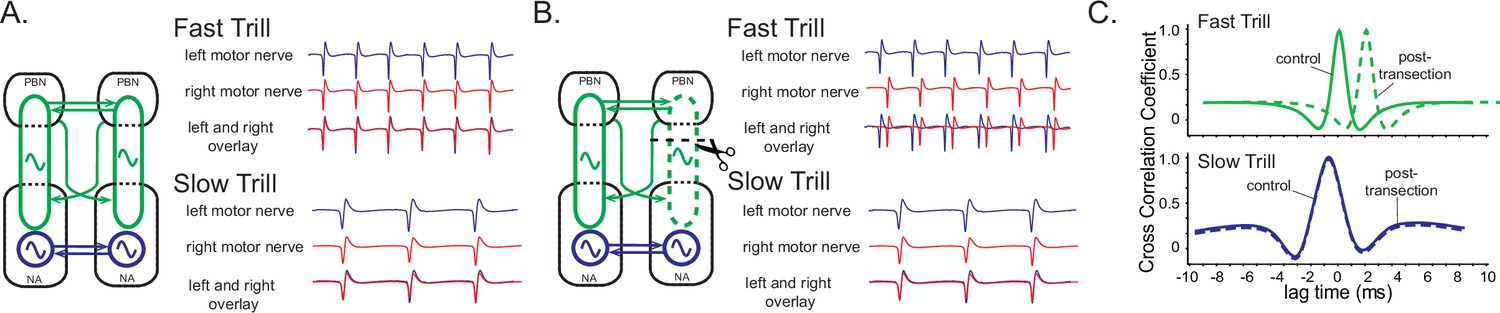
A model of fast trill and slow trill central pattern generators (CPGs) in male Xenopus laevis based on a previous study (Yamaguchi et al., 2017).
(A). Left and right fast trill CPGs (green) span across the parabrachial nucleus (PBN) and the nucleus ambiguus (NA) whereas the slow trill CPGs (blue) are contained in the NA. The left and right CPGs coordinate their activity via reciprocal projection (shown as double-headed horizontal arrows). During fast and slow trills of a fictive advertisement call, compound action potentials (CAPs) produced by the left (blue) and right (red) laryngeal nerves are synchronous. (B). When a right PBN and right NA are transected (scissors with dotted line), the right fast trill CPGs become dysfunctional while the left fast trill CPGs and both slow trill CPGs remain functional. When a fictive advertisement call is elicited from the transected brain, the CAPs produced by the nerve on the transected side (right) were delayed compared to those produced by the nerve on the intact side (left) during fast trill, but not during slow trills. This delay is likely caused by the fact that the laryngeal motoneurons on the transected side (right) are driven by the fast trill CPGs on the intact (left) side during the fast trill. However, during slow trill, slow trill CPGs on both sides remain functional even after the transection, and therefore, there is no delay between the two nerves. (C). Cross-correlation coefficient as a function of lag time between left and right laryngeal nerve recording. In the control brain, the maximum cross-correlation coefficient is zero, and the activity of the two nerves is synchronous. The lag time of the maximum cross-correlation coefficient becomes positive during fast, but not during slow trills after the transection.
Figure 6
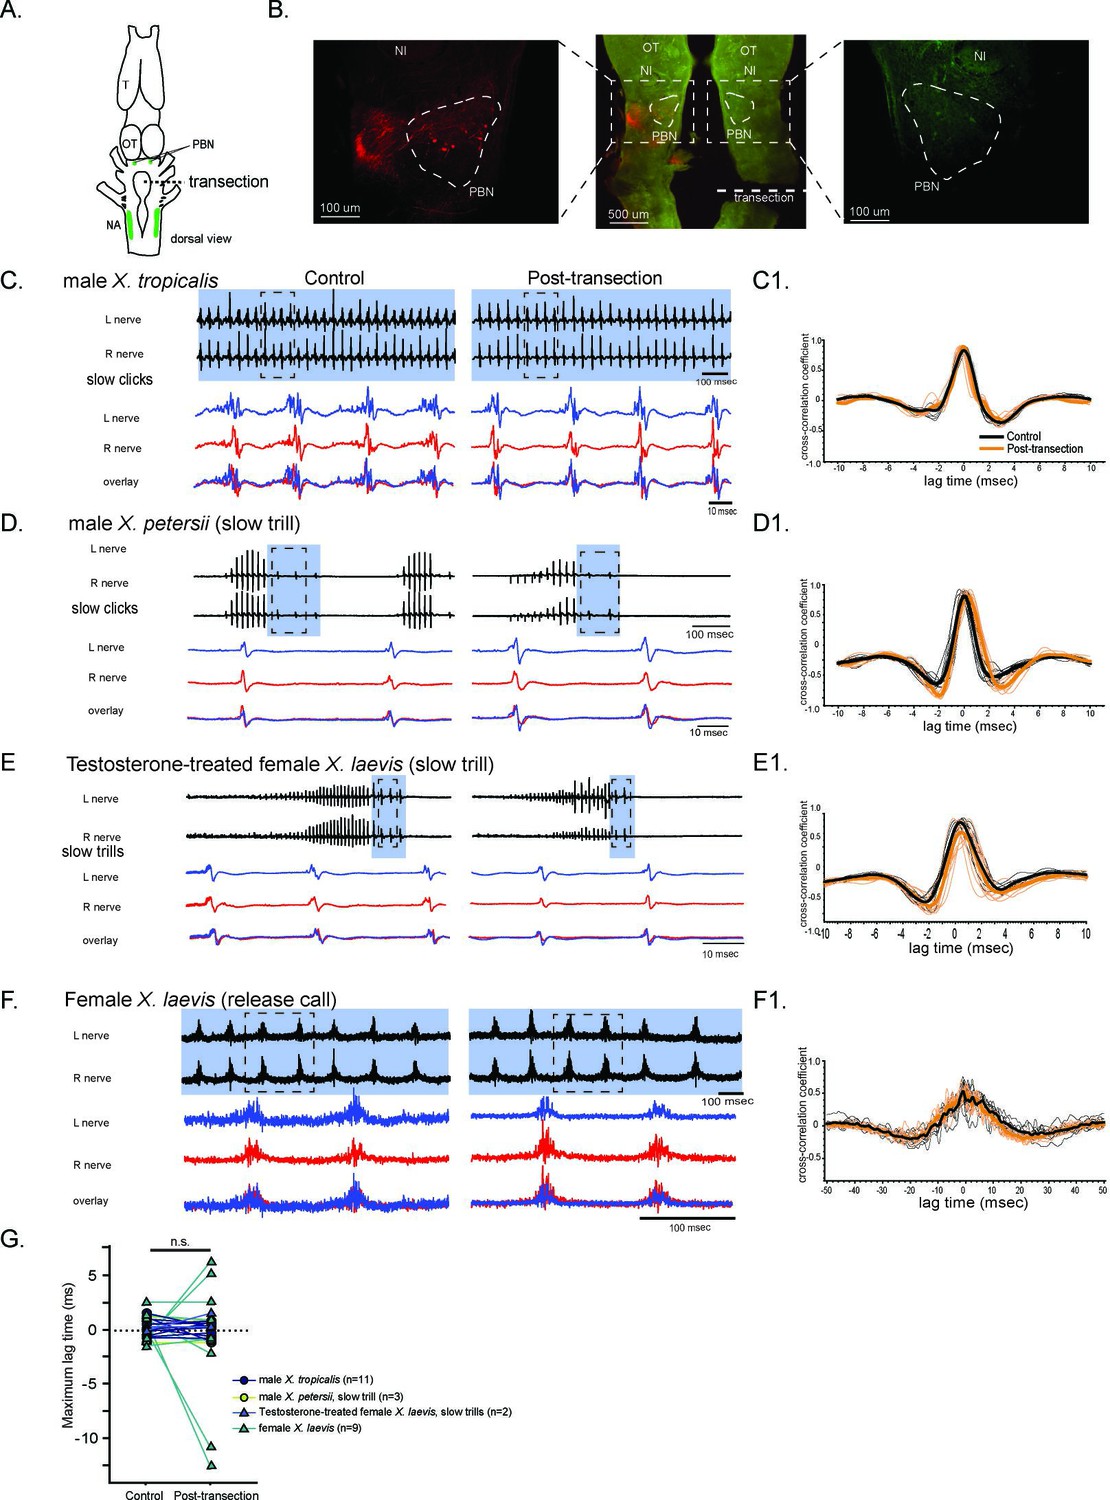
The unilateral transection between the parabrachial nucleus (PBN) and the nucleus ambiguus (NA) did not change the synchrony of the compound action potentials (CAPs) during fictive slow clicks.
(A). A cartoon showing the dorsal view of an isolated Xenopus brain, showing the location of the transection that was made between the PBN and NA on the right side with dotted black line. (B). Histological sections of the transected brain. After the electrophysiological experiments, Texas red dextran and fluorescein dextran were deposited into the left and right NA, respectively, to verify that the transection had been completed successfully. The middle panel shows the low-magnification view of the horizontal section of the rostral brainstem showing PBNs on both sides in dotted triangles. Left and right images show magnified view of the PBN with labeled soma and axons on the intact side on the left, and no labeled cells or processes on the transected side on the right. (C - F). Fictive advertisement calls produced by male X. tropicalis (C), male X. petersii(D), testosterone-treated female X. laevis (E), and fictive release calls produced by female X. laevis (F) before (left column) and after (right column) the unilateral transection. Top two traces; left and right laryngeal nerve recordings. The blue background indicates slow CAPs. Areas in dotted rectangles are enlarged in the bottom three traces, the left nerve in blue, the right nerve in red, and both traces are overlayed in the bottom. C1 – F1. Cross-correlation coefficients as a function of the lag between the intact and the transected nerves during fictive advertisement calls produced by male X. tropicalis (C1), slow clicks of advertisement call produced by male X. petersii(D1), testosterone-treated female X. laevis (E1), and fictive release calls produced by female X. laevis (F1). Thick lines indicate the mean of control (black) and post-transection (orange) conditions, and thin lines indicate individual data. Note that the timing of the maximum crosscorrelation coefficient is centered around zero both before and after the unilateral transection. (G). Mean maximum lag time after the transection during fictive slow clicks produced by male X. tropicalis (n=11), male X. petersii (n=3), testosterone-treated female X. laevis (n=2), and female X. laevis (n=9) did not differ significantly from that before the transection.
Figure 7

The unilateral transection between the parabrachial nucleus (PBN) and the nucleus ambiguus (NA) resulted in delayed compound action potentials (CAPs) during fictive fast clicks.
(A – D), Fictive advertisement calls recorded from male X. amieti (A), male X. cliivi (B), male X. petersii (C), and testosterone-treated female X. laevis (D) before (left) and after (right) the unilateral transection. The top two traces are the laryngeal nerve recordings obtained from the left and right nerves. Green background indicates fictive fast clicks. Areas in dotted rectangles are enlarged in the third, fourth, and fifth traces. In these enlarged traces, the left nerve is shown in blue, the right nerve is shown in red, and both traces are overlayed at the bottom. A1 through D1 shows the cross-correlation coefficients as a function of the lag between the intact and the transected nerves during fictive advertisement calls produced by male X. amieti (A), male X. cliivi (B), fast trills of male X. petersii (C), and testosterone-treated female X. laevis (D) before (black lines) and after (orange lines) the transection. Thick lines indicate the mean and thin lines indicate individual data. (E). Mean maximum lag time for the fast clickers. After the transection, the maximum lag time significantly increased during fast clicks in the fast clickers. (F). A cartoon showing the dorsal view of the brain showing the stimulation of the intact parabrachial nucleus (PBN) before and after the transection was made between the right PBN and the right nucleus ambiguus (NA) while recordings are obtained from both nerves. (G). CAP latency, defined as the time between the stimulus onset and the time of the CAP peak, recorded from the nerve on the intact side and on the transected side before and after the transection. The latency was measured after the 15th stimulus pulse after it reached a plateau (See Figure 8E). The CAP latency on the intact side did not change, but those on the transected side increased significantly after the transection. (H). The box plot showing the increase in the CAP lag after the transection during fictive fast clicks (CAP lag during fictive fast clicks) and the PBN-evoked CAP latency increase after the transection (PBNevoked CAP lag). They did not differ significantly.
Figure 8
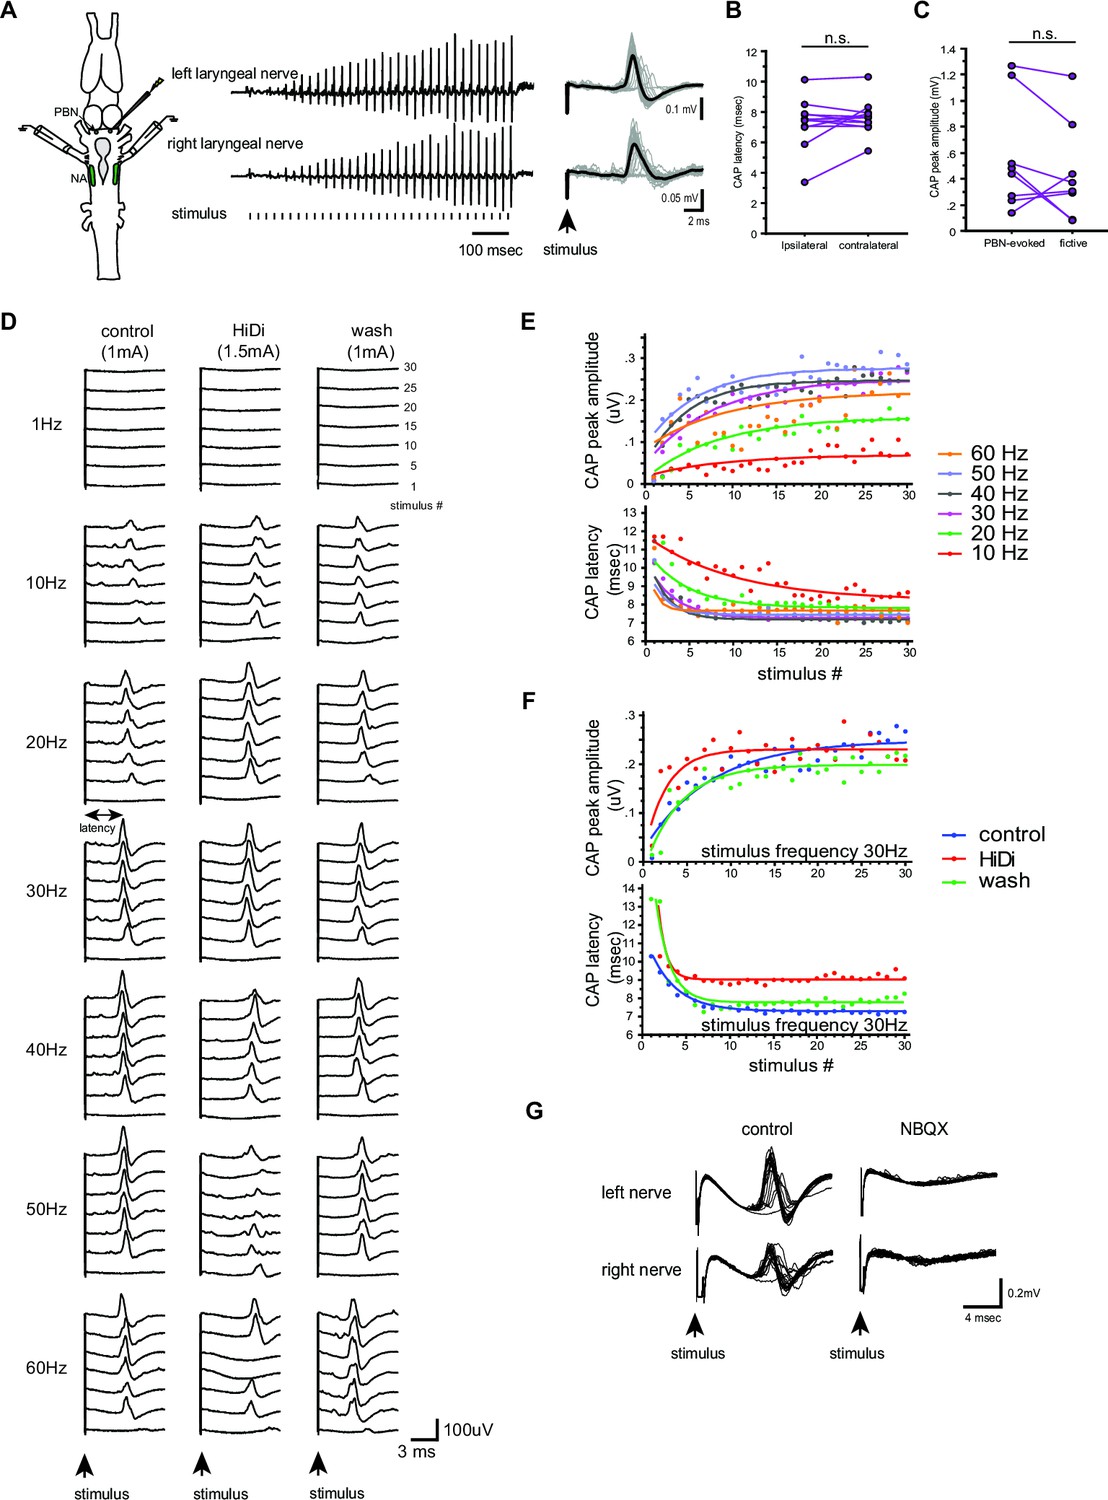
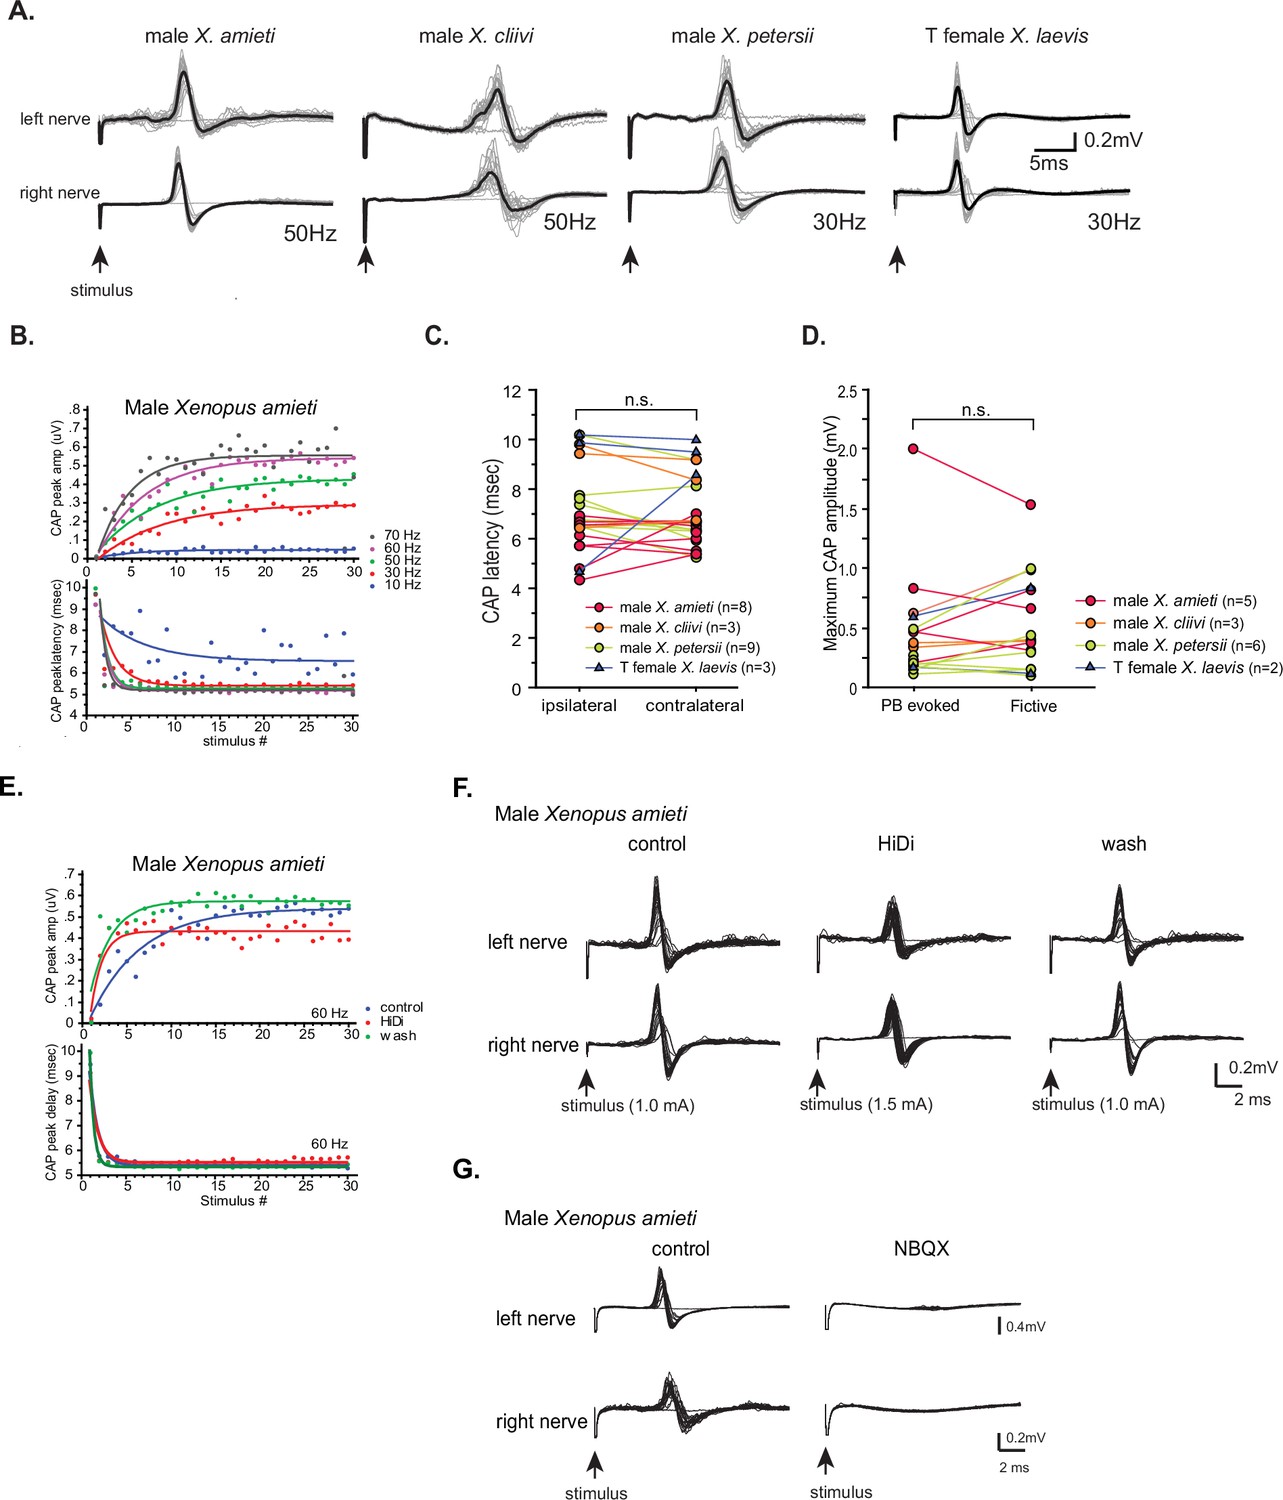
Properties of the synapses between the parabrachial nucleus (PBN) and laryngeal motoneurons in male X. laevis.
(A). Left; A cartoon showing the dorsal view of the Xenopus brain showing the location of the stimulation and recordings. PBN; parabrachial nucleus, NA; nucleus ambiguus. Middle; recordings obtained from the left (top panel) and right (bottom panel) laryngeal nerves in response to the stimulus delivered to the right parabrachial nucleus (PBN). Tick marks in the bottom labeled as ‘stimulus’ indicate the timing of the stimulus pulse delivered to the PBN. Right, stimulus-evoked compound action potentials (CAPs) of the left (top panel) and right (bottom panel) laryngeal motor nerves shown as sweeps. Gray traces are raw data, and the thick black lines represent the mean response across 30 stimulus pulses. Arrow indicates the timing of stimulus pulse onset. (B). The latency between the stimulus onset and the time of the compound action potential (CAP) peak recorded from the ipsilateral and contralateral nerves. There is no significant difference in the CAP latency recorded from the two nerves, indicating the presence of bilateral projections from the PBN to the right and left laryngeal motoneurons. (C). The maximum amplitude of the CAPs evoked in response to the unilateral PBN stimulation and those observed during fictive advertisement calling. There was no significant difference in the maximum CAP amplitude recorded under these two conditions. (D). Frequency-dependence of the PBN-evoked CAPs in control (left), high-divalent cation saline (HiDi, middle), and after wash (right). Sweeps of laryngeal nerve response to the 1st, 5th, 10th, 15th, 20th, 25th, and 30th stimulus pulses delivered to the PBN (from bottom to top traces) distributed by 100uV for ease of visualization. Stimulus frequency ranged from 1 to 60 Hz. Note that consistent CAPs, except in response to the first pulse, were elicited when the stimulus frequency is above 10 Hz in control and after wash condition, but in the presence of HiDi saline, some CAPs are skipped. (E). The CAP peak amplitude (top) and the CAP latency (bottom) as a function of the stimulus pulse order when stimulus frequency ranged from 10 to 60 Hz. The progressive potentiation of the CAP amplitude and attenuation of CAP latency in response to each frequency were successfully fitted with exponential curves. (F). The CAP amplitude (top) and the CAP latency (bottom) as a function of stimulus pulse order in the presence and absence of HiDi saline. Stimulus trains at 30 Hz were delivered in control, in HiDi saline, and after wash. Even in HiDi saline, CAPs potentiated in amplitude and decreased in latency as in control and washout conditions, indicating that the synapses are monosynaptic. (G). Sweeps of left and right laryngeal nerve response to the unilateral PBN stimulation in control (left) and in the presence of NBQX (right).
Figure 9
Properties of the synapses between the parabrachial nucleus (PBN) and laryngeal motoneurons in all fast clickers resemble those of male X.laevis.
(A). PBN-evoked responses of the left (top panel) and right (bottom panel) laryngeal motor nerves shown as sweeps. Gray traces are raw data, and the thick black lines represent the mean response across 30 stimulus pulses. Arrows indicate the timing of stimulus onset, and the stimulus frequencies are shown below the traces. (B). PBN-evoked CAP amplitude (top graph) and the CAP latency (bottom graph) as a function of stimulus pulse order in response to stimulus trains (10–70 Hz) delivered to a PBN of a male X. amieti brain. Progressive increase in CAP amplitude and attenuation in CAP latency can be successfully fitted with exponential curves, as in male X. laevis. (C). PBN-evoked CAP latency recorded from the ipsilateral and contralateral nerve of all fast clickers. There was no significant difference in the latency between the two nerves. (D). Maximum CAP amplitude evoked in response to the unilateral PBN stimulation and those recorded during fictive advertisement calls. There was no significant difference in the maximum amplitude recorded under these two conditions. (E). Maximum CAP amplitude and the CAP latency as a function of the stimulus pulse number in control, HiDi saline, and washout in a male X. amieti brain. The progressive increase in CAP amplitude and the decrease in CAP latency were observed under all three conditions, indicating that they are monosynaptic. (F). Sweeps of left and right laryngeal nerves in response to the unilateral PBN stimulation in control (left), in the presence of HiDi saline (middle), and after wash. The arrows at the bottom show the timing of stimulus pulse delivery, with the stimulus frequency of 60 Hz in all three conditions. The amplitude used is shown in parenthesis. (G). Sweeps of left and right laryngeal nerves in response to the unilateral PBN stimulation at 60 Hz of male X. amieti in control (left), and in the presence of NBQX (right). The arrows at the bottom show the timing of stimulus pulse delivery.
Figure 10
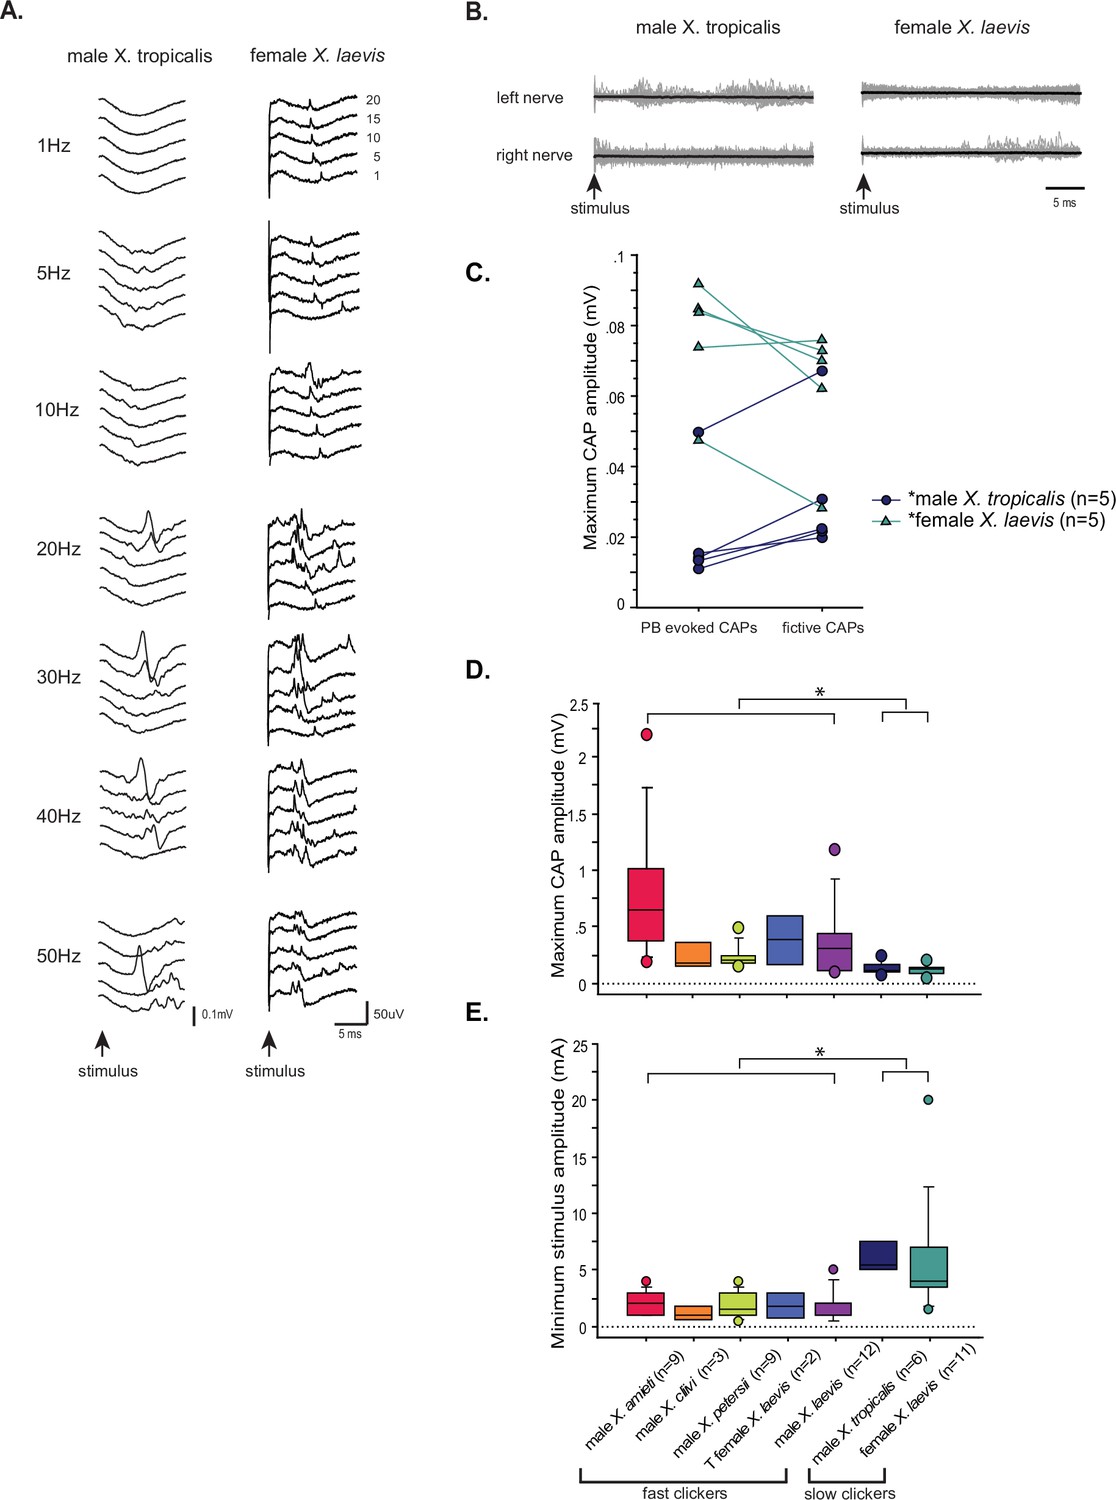
The synapses between the parabrachial nucleus (PBN) and laryngeal motoneurons of slow clickers are weaker and unreliable compared to those of fast clickers.
(A). Example of slow clickers that showed compound action potentials in response to the unilateral stimulation of the PBN. Sweeps of laryngeal nerve responses to the 1st, 5th, 10th, 15th, and 20th stimulus pulses delivered to the PBN (from bottom to top traces) distributed by 50uV for ease of visualization. Stimulus frequency ranged from 1 through 50 Hz. (B). Example of slow clickers that showed no compound action potentials in response to the unilateral PBN stimulation. Sweeps of left (top) and right (bottom) laryngeal nerve recordings in response to stimulus pulses. Gray traces are raw data, and the thick black lines are mean responses. (C). Maximum CAP amplitude recorded in response to the unilateral PBN stimulation (PBN-evoked CAPs) and those observed during fictive calling (fictive CAPs) in male X. tropicalis (left), and in female X. laevis. In male X. tropicalis PBN-evoked CAPs were significantly smaller than those recorded during fictive advertisement calls, and in female X. laevis, PBN-evoked CAPs were significantly larger than those recorded during fictive release calls, as indicated by asterisks preceding the species name. (D). Box plot showing the maximum peak amplitude of PBN-evoked CAPs all species and sexes. The maximum peak amplitude of CAPs of the slow clickers was significantly smaller than those recorded from the fast clickers. (E). Minimum stimulus amplitude required to evoke CAPs in response to the unilateral PBN stimulation in all species and sexes. The slow clickers required a significantly higher amplitude of stimulus to evoke CAPs.
Figure 11
Summary of the two types of vocal central pattern generators with a conserved anatomical organization found in five species of genus Xenopus.
Left column: chronogram based on mitochondrial DNA (Modified from Evans et al., 2015) of studied species. Middle column: fictive advertisement calls recorded ex vivo from the isolated brain. The green and blue background of traces indicate fast (>50 Hz) and slow (<35 Hz) clicks, respectively. Right column: schematics showing the types of central pattern generators (CPGs) thought to be contained in the brainstem of each species. A pair of parabrachial (PBN) and nucleus ambiguus (NA) are shown for each species, and the presence of slow CPGs (blue) and fast CPGs (green) are shown in each species, and in two sexes in the case of X. laevis. Dotted slow CPGs in X. amieti and X. cliivi indicate that their presence is yet to be tested in these species.
Tables
Table 1
Parabrachial nucleus-evoked compound action potential amplitude and latency time constant τ in all fast clickers.
TF X. laevis stands for testosterone-treated female X. laevis. In response to a train of stimuli applied to a parabrachial nucleus (PBN) resulted in potentiation of the amplitude and the shortening of the latency of the nerve compound action potential (CAPs) that were successfully fitted by exponential curves for each species (the second and third column). These τ values did not differ depending on the stimulus frequency based on the regression analysis in each species (the fourth and fifth column) with τ as dependent and stimulus frequency as independent variables.
| Sex/species | CAP amplitude τ by stimulus order (mean ±standard error, n) | CAP latency τ by stimulus order (mean ±standard error, n) | CAP amplitude τ by stimulus frequency regression | CAP latency τ by stimulus frequency regression | ||
|---|---|---|---|---|---|---|
| F statistic | p-value | F statistic | p-value | |||
| Male X. laevis | 6.90±0.995, 11 | 3.64±515, 10 | F1,24 = 0.113 | 0.739 | F1,29 = 2.855 | 0.102 |
| Male X. amieti | 5.12±0.568, 6 | 3.48±0.708, 6 | F1,25 = 3.152 | 0.088 | F1,26 = 3.063 | 0.092 |
| Male X. cliivi | 5.01±1.61, 2 | 4.06±1.38, 2 | F1,10 = 0.538 | 0.480 | F1,10 = 0.377 | 0.553 |
| Male X. petersii | 3.84±0.700, 9 | 1.66±0.272, 7 | F1,42 = 1.043 | 0.313 | F1,29 = 0.185 | 0.185 |
| TF X. laevis | 8.23±3.20, 4 | 2.66±0.270, 4 | F1,16 = 0.182 | 0.676 | F1,18 = 0.2.37 | 0.141 |
Additional files
Download links
A two-part list of links to download the article, or parts of the article, in various formats.
Downloads (link to download the article as PDF)
Open citations (links to open the citations from this article in various online reference manager services)
Cite this article (links to download the citations from this article in formats compatible with various reference manager tools)
Two conserved vocal central pattern generators broadly tuned for fast and slow rates generate species-specific vocalizations in Xenopus clawed frogs
eLife 12:e86299.
https://doi.org/10.7554/eLife.86299


