Transposons are important contributors to gene expression variability under selection in rice populations
- Centre for Research in Agricultural Genomics, CRAG (CSIC-IRTA-UAB-UB), Campus UAB, Cerdanyola del Vallès, Spain
- Center for Genomics and Systems Biology, New York University, United States
- Center for Genomics and Systems Biology, New York University Abu Dhabi, Saadiyat Island, United Arab Emirates
Figures
Figure 1 with 1 supplement
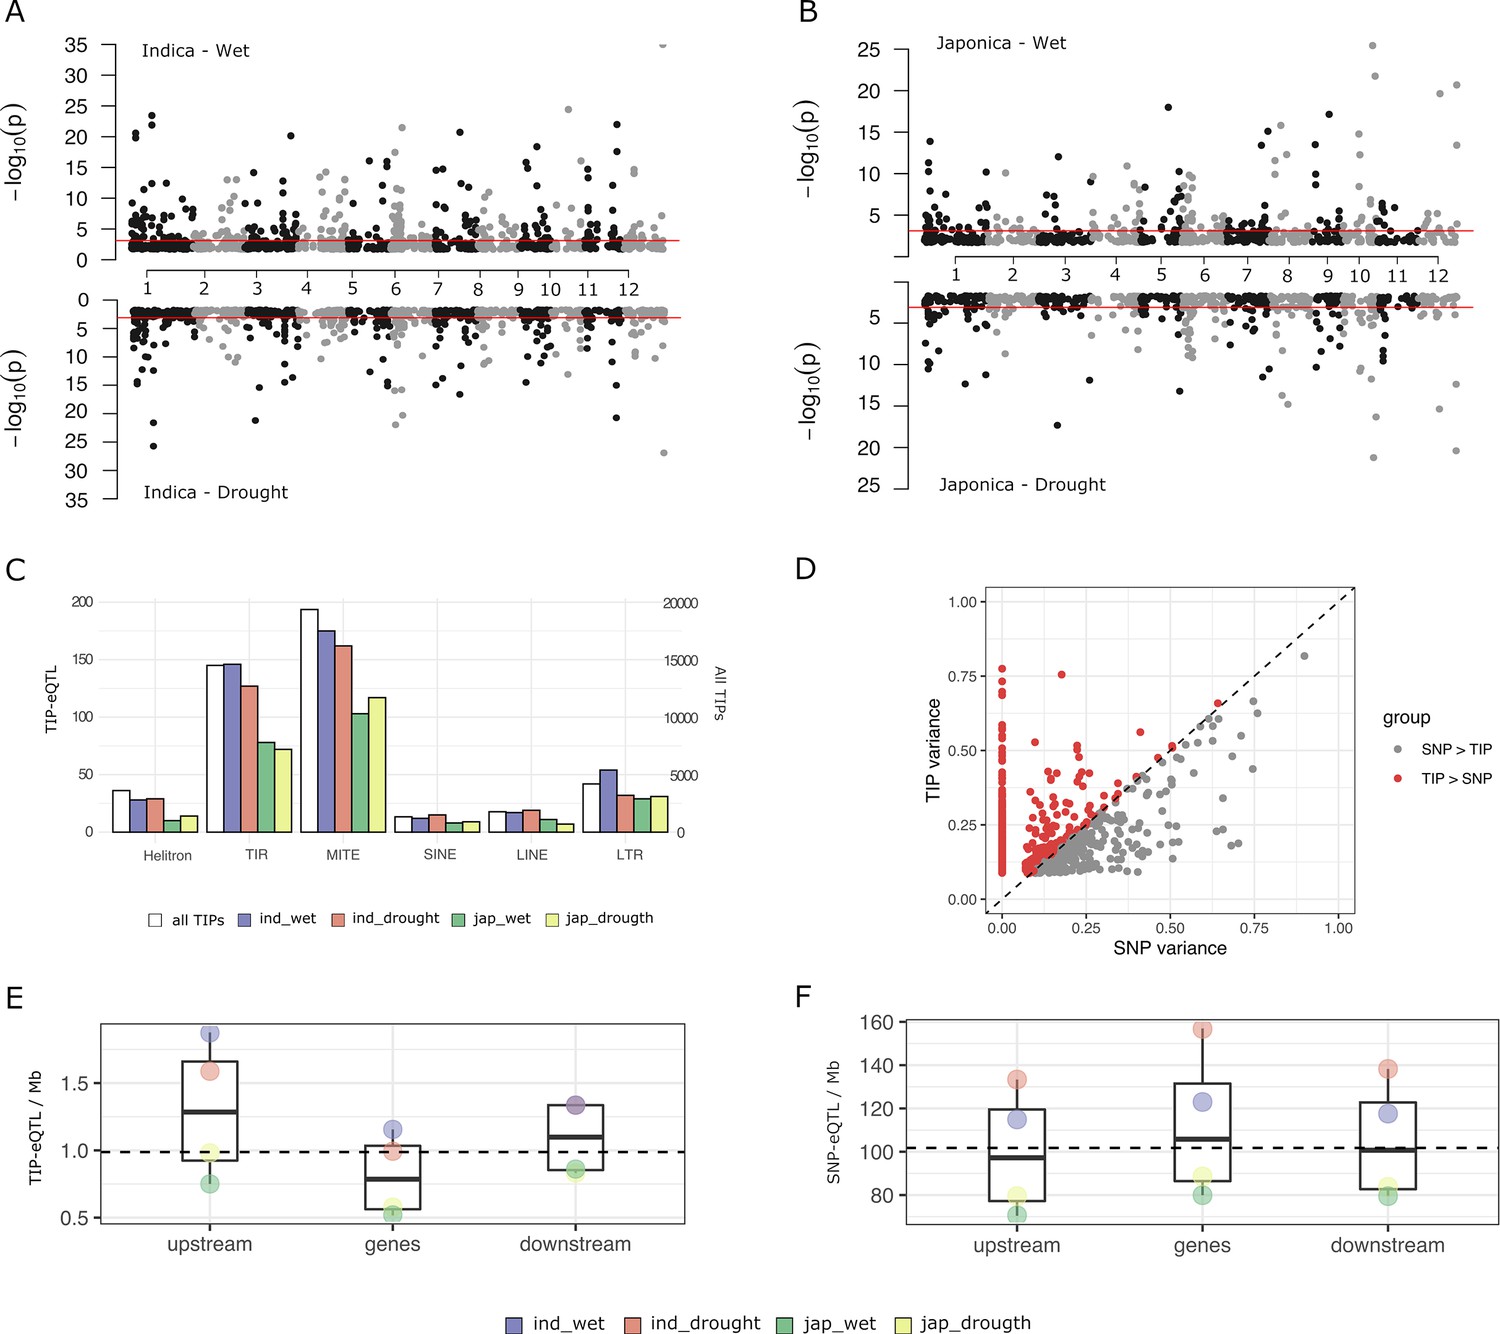
Characterization of rice transposon insertion polymorphism (TIP)-expression quantitative trait loci (eQTLs).
(A, B) Association between TIPs and gene expression levels in cis (TIP-eQTLs) found in indica and japonica population along the 12 rice chromosomes. Horizontal lines represent 5% significance thresholds corrected for multiple testing using false discovery rate (FDR) method. (C) Number of TIP-eQTLs found in each condition classified at the order transposable element (TE) level. White bars represent the number of total TIPs (secondary axis). (D) Expression variance explained by leading TIP-eQTL and SNP-eQTL. Each point represents a gene. Indica and japonica TIP-eQTLs are combined into a single plot. Number of TIP-eQTLs (E) or SNP-eQTL (F) per Mb of gene feature. Upstream and downstream regions are 1 kb long. Gene region includes 5′ and 3′ UTRs. All the TIPs and SNPs with a significant association (FDR <5%) were used in this analysis.
Figure 1—figure supplement 1
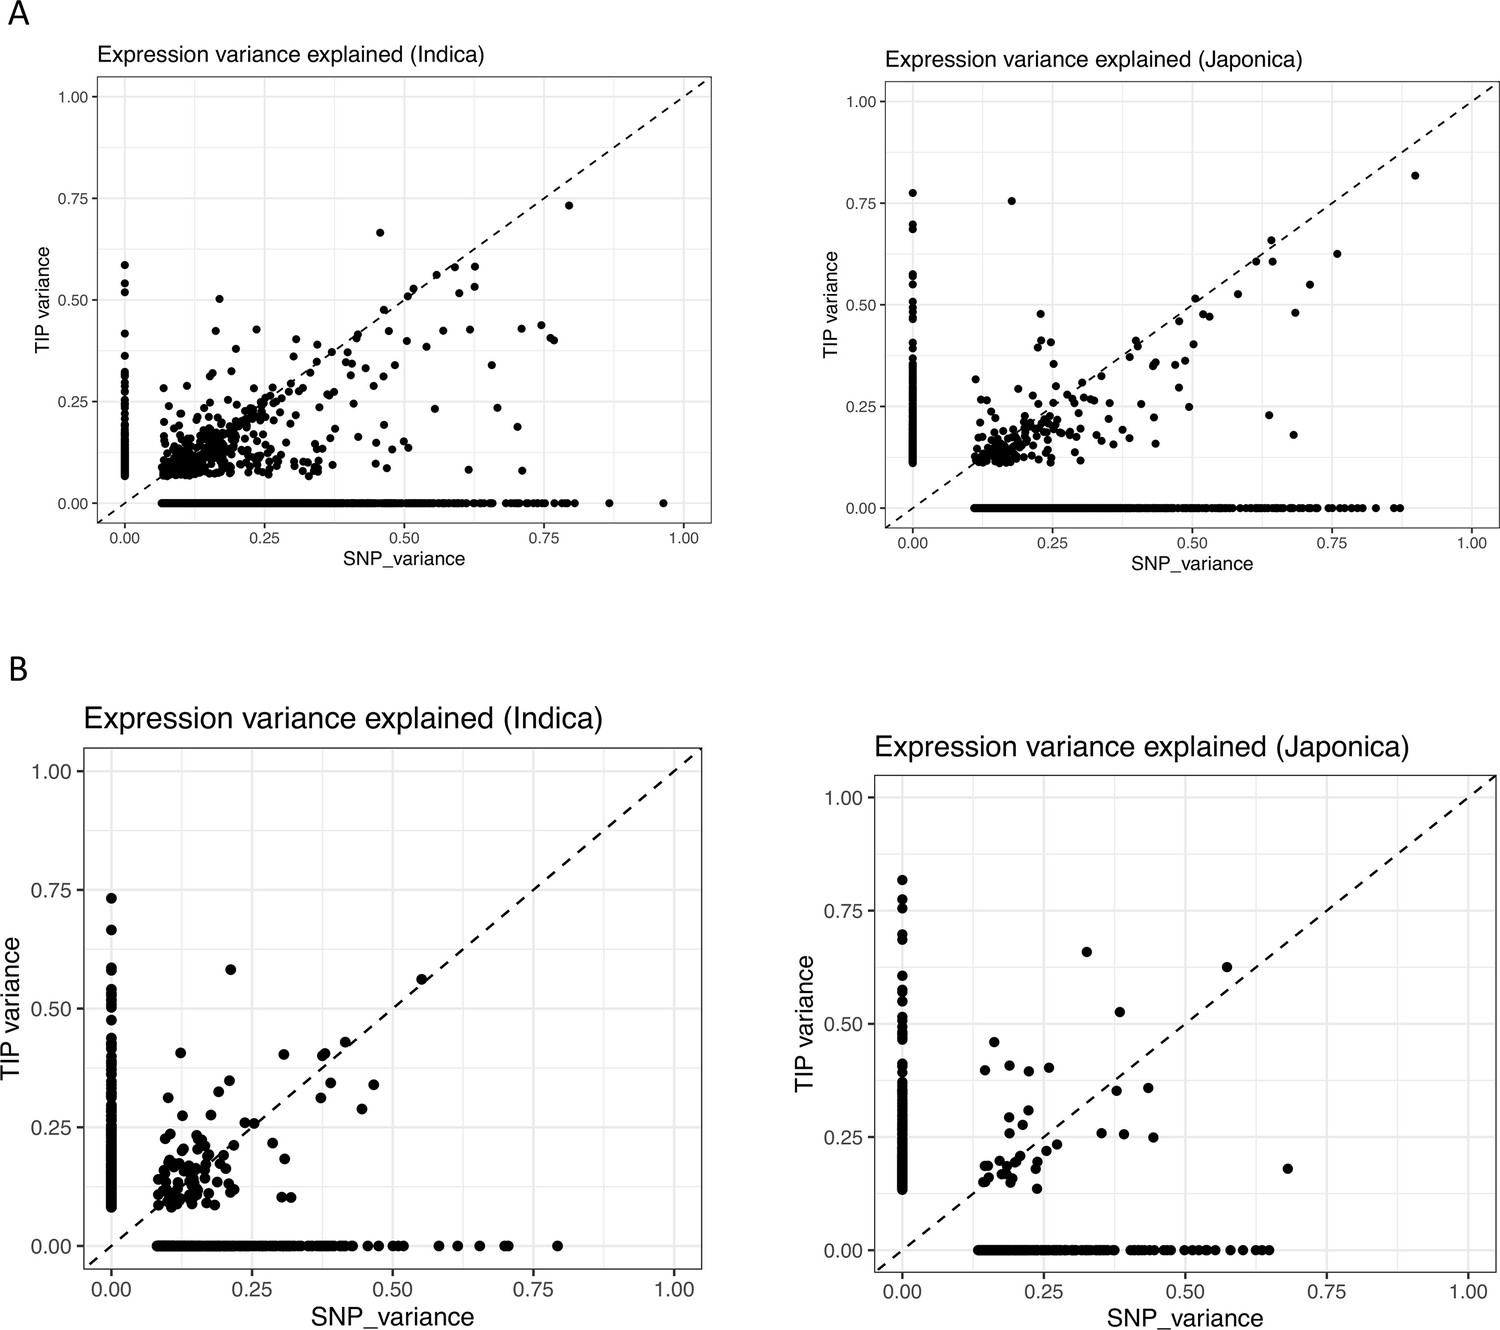
Expression variance explained by leading transposon insertion polymorphism (TIP)-expression quantitative trait locus (eQTL) and SNP-eQTL in the associations detected for each gene (dot).
Panels in (A) represent the analysis performed using a combined genotype matrix including all SNPs and TIPs. Panels in (B) represent the analysis performed using a combined genotype matrix including TIPs and a subsampled number of SNPs matching the exact number of TIPs.
Figure 2 with 2 supplements
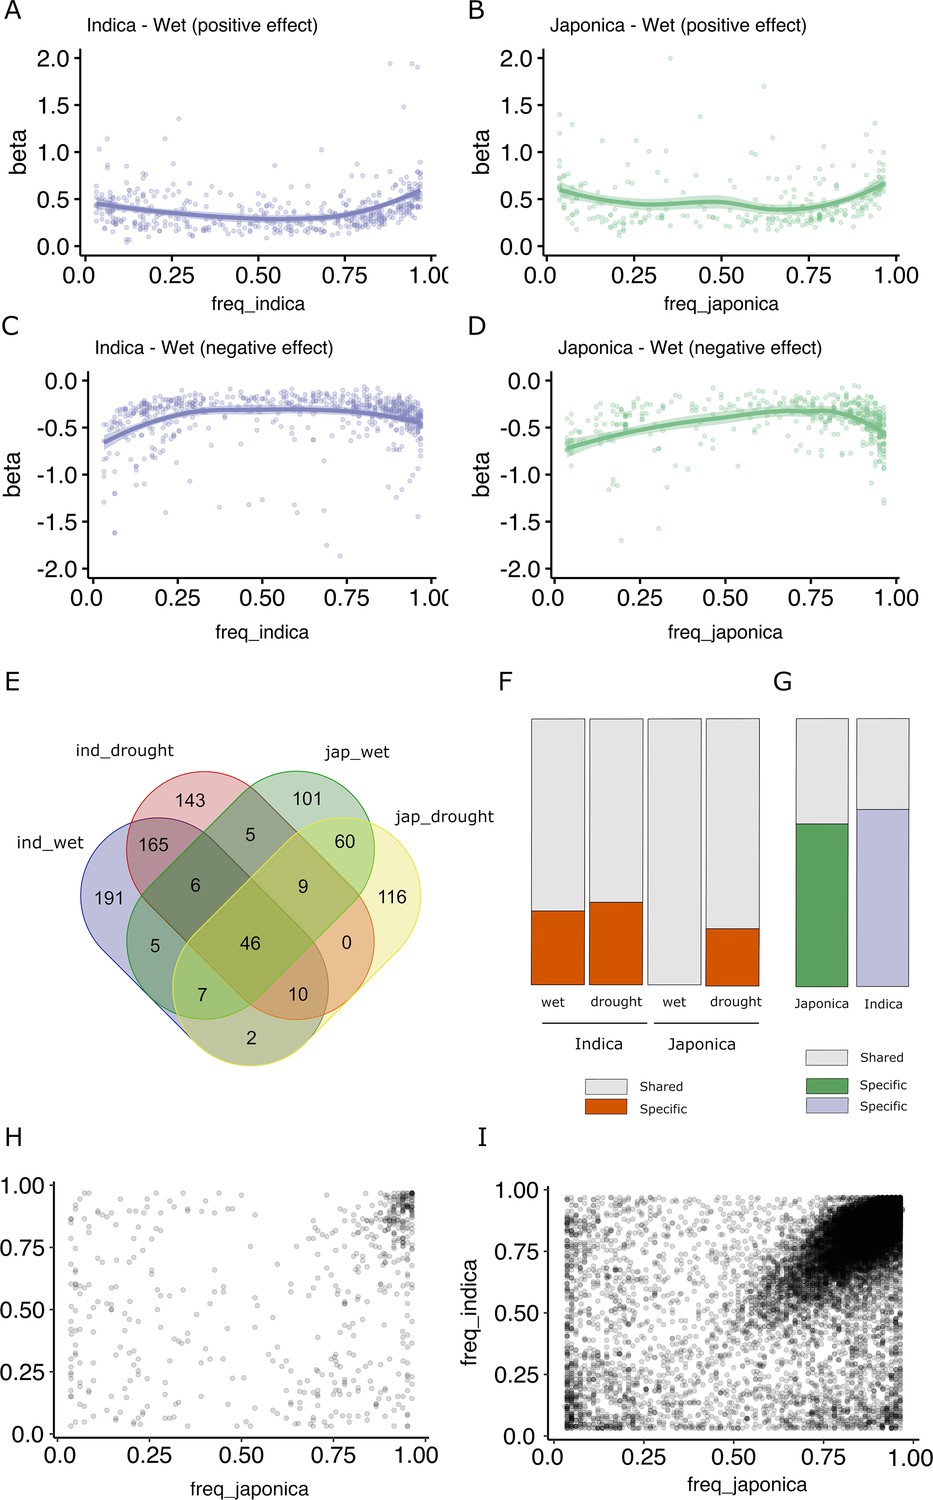
Effect size and population frequencies of wet and drought-stress transposon insertion polymorphism (TIP)-expression quantitative trait loci (eQTLs).
Representation of the effect size (beta) of the TIP-eQTLs with respect to their population frequency in indica (A, C) and japonica (B, D) for positive (A, B) and negative (C, D) effects. Venn diagram illustrating the intersection between TIP-eQTLs detected in each condition of the two subspecies analyzed, indica (ind) and japonica (jap) (E). Percentage of condition-specific (F) and species-specific (G) TIP-eQTLs. Shared TIPs are those falling in the intersection between the false discovery rate (FDR)-corrected TIP-eQTLs found in a given population/condition and all the associations of the other population/condition using a relaxed cutoff (p < 0.05, no FDR correction). Relationship between the frequencies in indica and japonica populations of the and 829 TIP-eQTLs (H) and the 33,389 non-eQTL-TIPs (I).
Figure 2—figure supplement 1

Effect size of transposon insertion polymorphism (TIP)-expression quantitative trait loci (eQTLs) based on their population frequency on the drought condition.
Figure 2—figure supplement 2
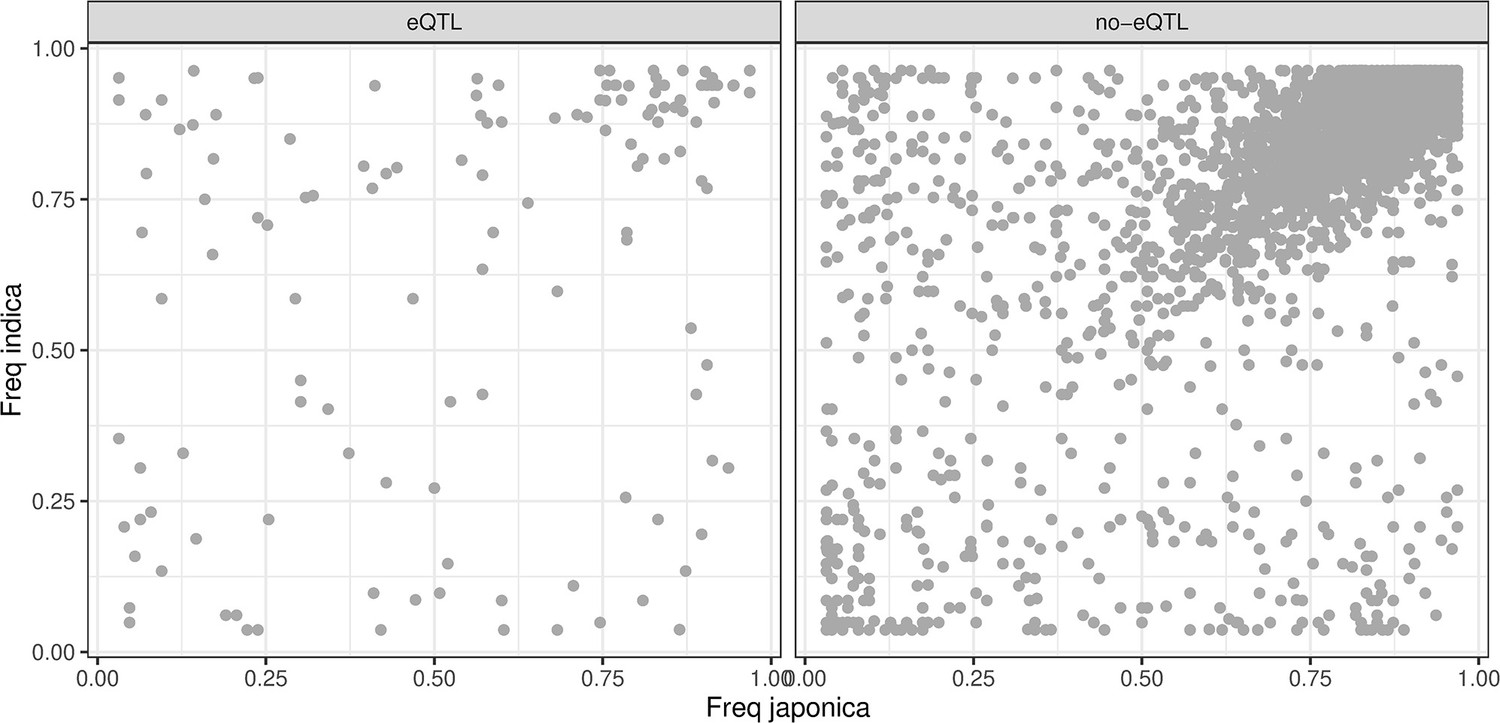
Population frequencies of transposon insertion polymorphism (TIP)-expression quantitative trait loci (eQTLs) and TIP-no-eQTLs present at 1 kb upstream genes.
Figure 3
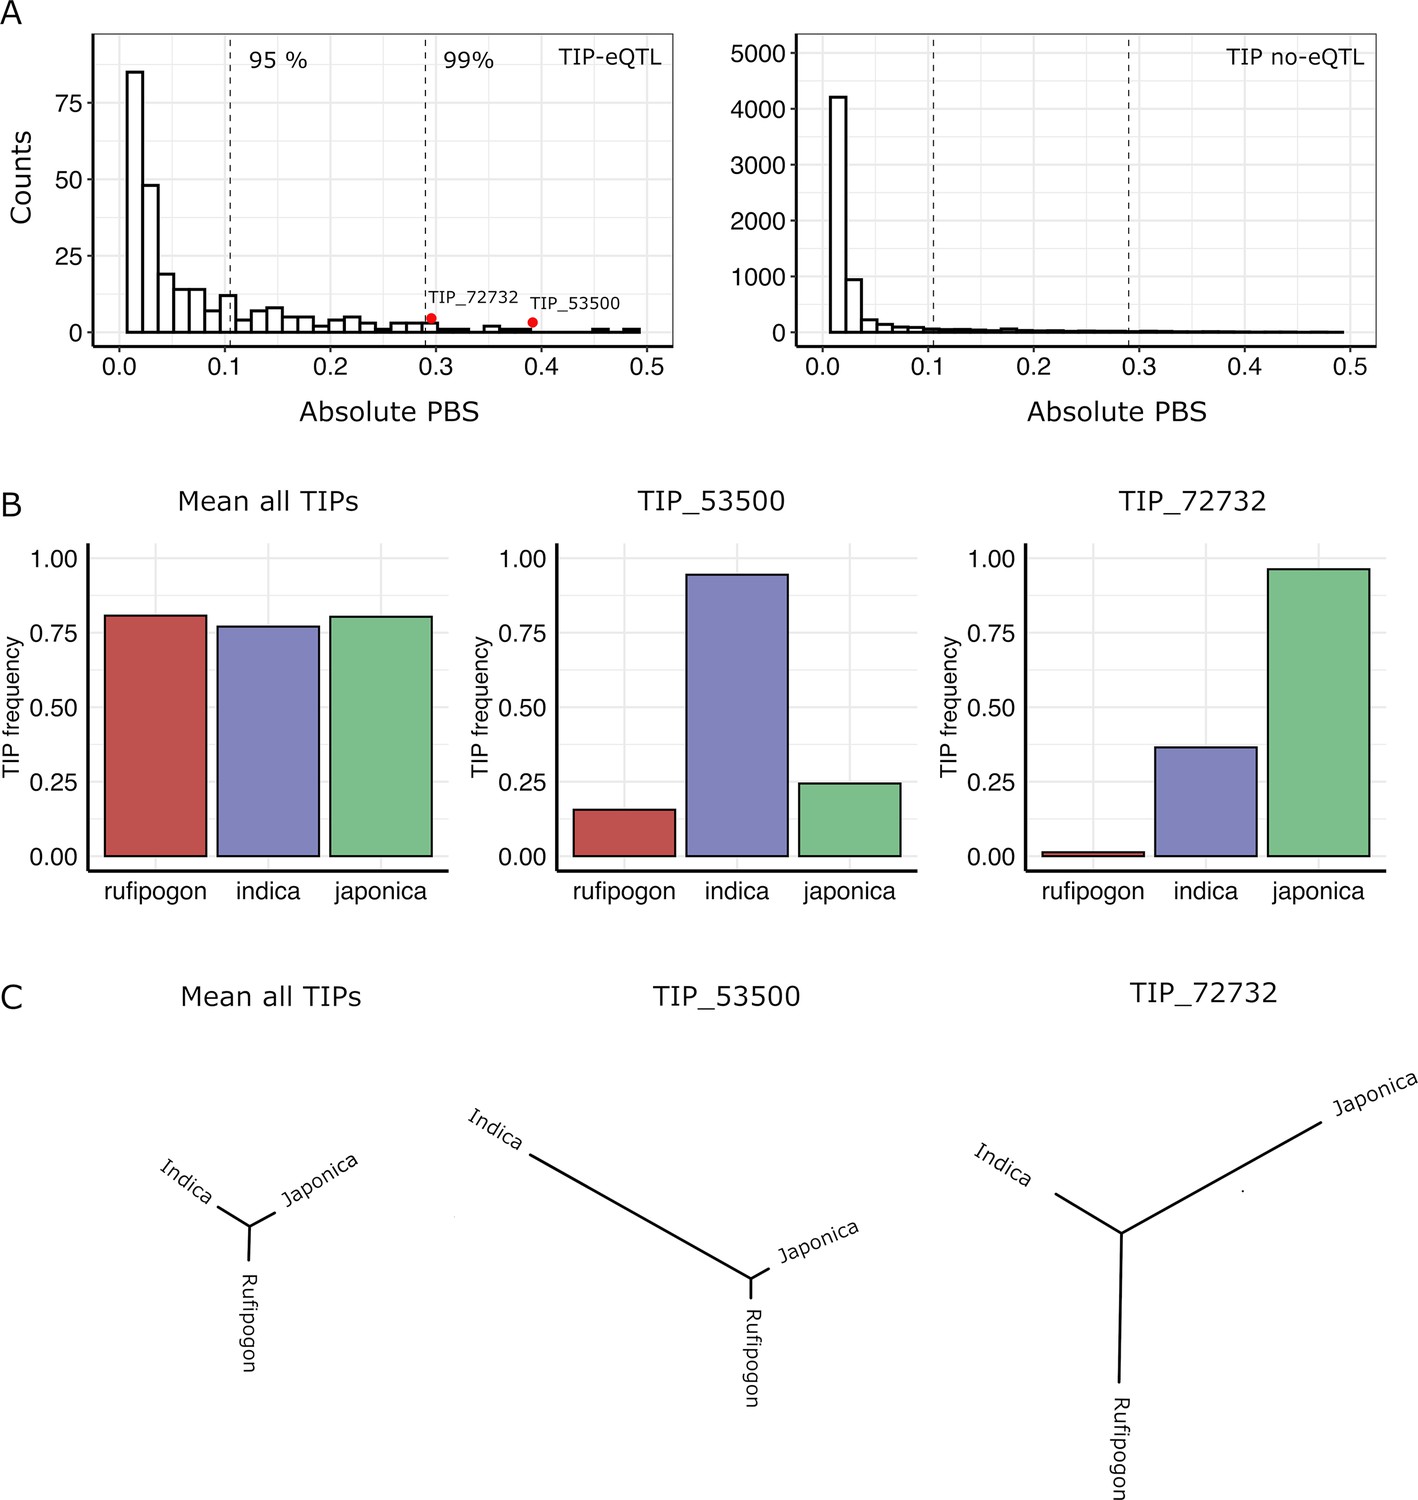
Signatures of positive selection on transposon insertion polymorphism (TIP)-expression quantitative trait loci (eQTLs).
(A) Absolute Population Branch Statistic (PBS) of 354 TIP-eQTLs (left) and 11,344 TIPs (no-eQTL, right) present in indica, japonica, and rufipogon populations. Dotted vertical lines represent the 95th and 99th percentiles of the PBS values of the whole dataset (11,698 TIPs). Red dots represent two examples of TIP-eQTLs with extreme PBS values. (B) Population frequency of the two TIPs with extreme PBS values, marked as red dots in the left panel (A), as well as of the whole TIP dataset. (C) Fst-based tree of the two TIPs with extreme PBS values, as well as of the whole TIP dataset (average Fst).
Figure 4 with 1 supplement
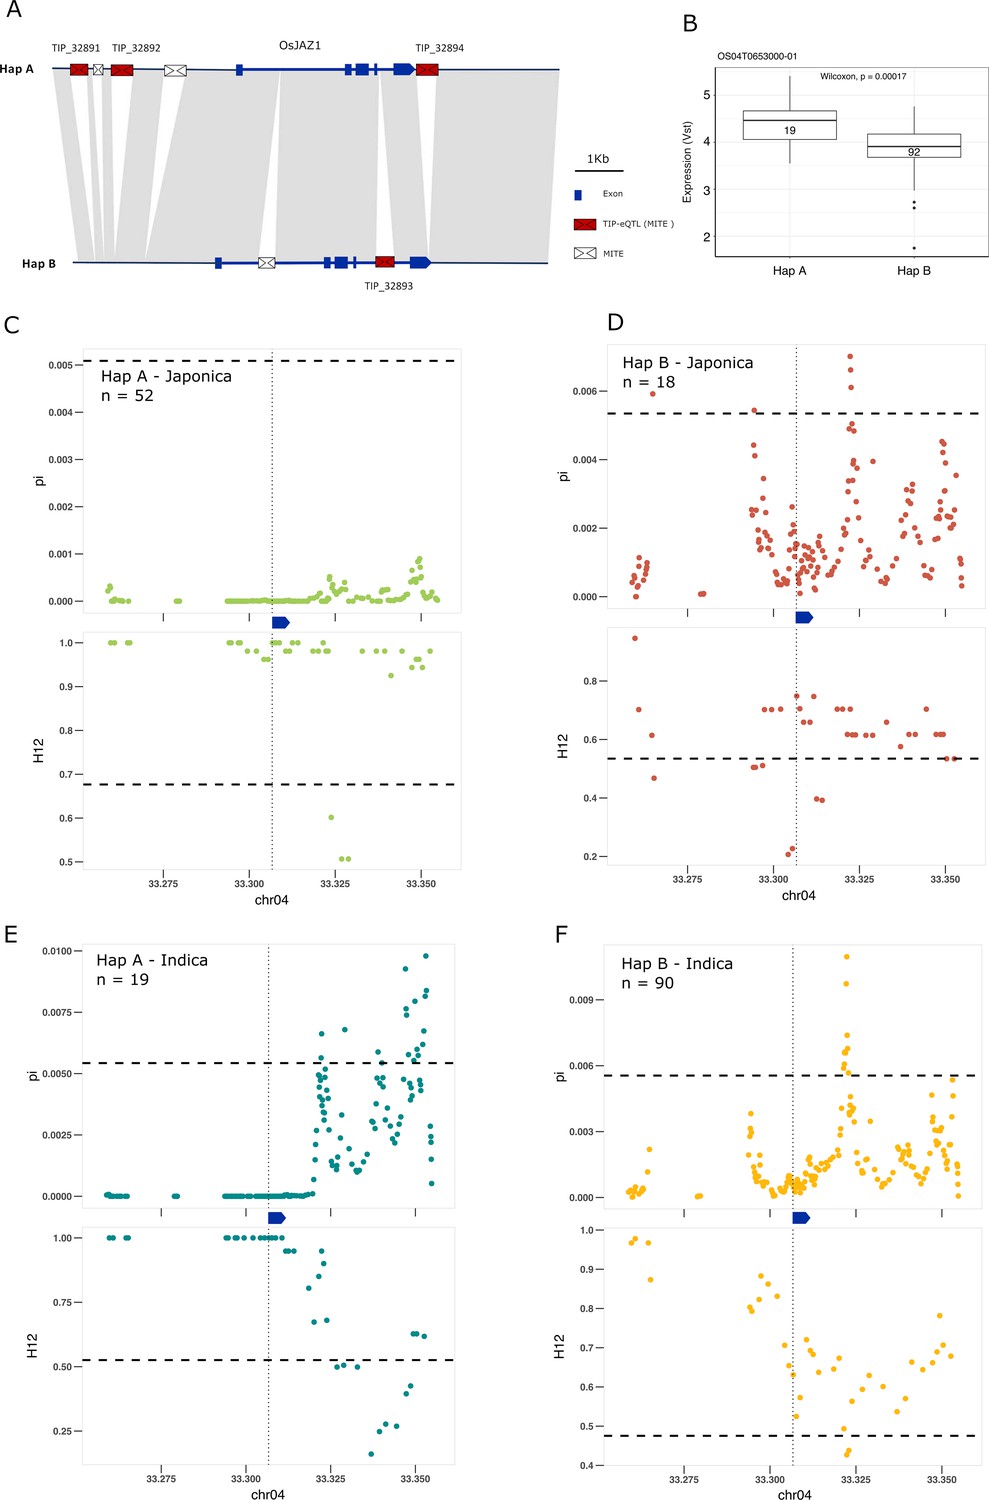
Selection on transposon insertion polymorphism (TIP)-expression quantitative trait loci (eQTLs) associated with EG2 expression.
(A) Representation of the two main EG2 haplotypes present in rice and rufipogon/nivara populations identified in the rice super-pangenome. Conserved nucleotide regions are connected by gray marks. Structural variants longer than 50 bp are shown as white spaces. TIP-eQTLs are shown as red boxes. Additional TIPs are shown as white boxes. (B) Boxplot representation of the expression of the two EG2 haplotypes in the indica population. Numbers inside boxplots represent the number of accessions in each group. Analysis of nucleotide diversity (π) and diversity in haplotypes homozygosity tracts (H12) for Hap A (C, E) and Hap B (D, F) in japonica (C, D) and indica (E, F) populations. The vertical dotted black line shows the position of the TIP insertion. The EG2 gene is schematically shown in blue. The horizontal dashed black line represents the mean of 1000 random permutation pulls (for p-value see Supplementary file 6).
Figure 4—figure supplement 1
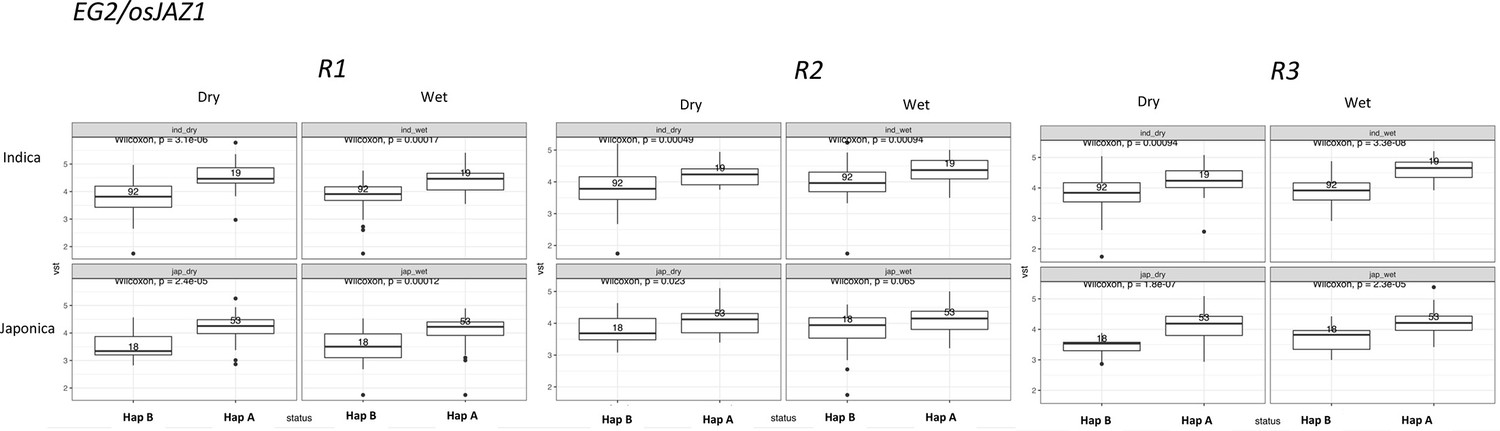
Boxplots representing the expression differences between haplotypes in OsJAZ1.
Three independent experimental replicates are shown separately.
Figure 5 with 1 supplement
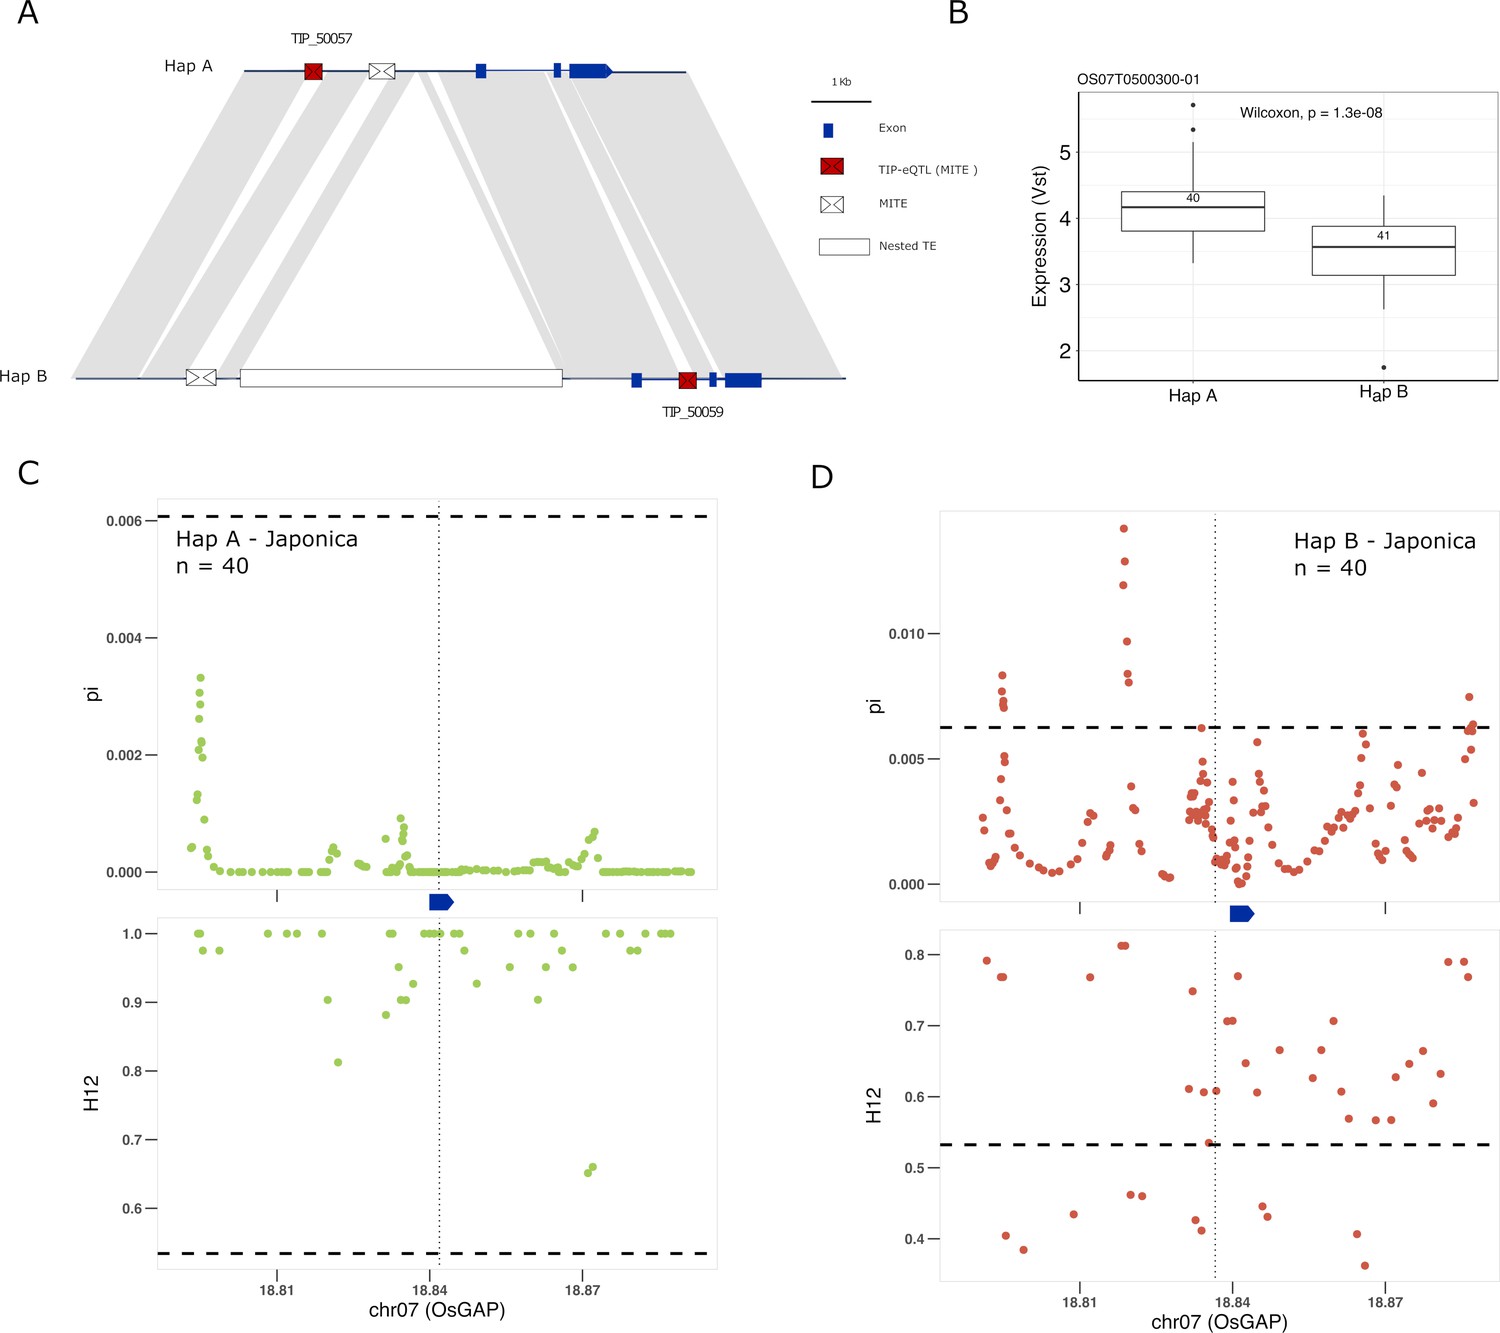
Selection on transposon insertion polymorphism (TIP)-expression quantitative trait loci (eQTLs) associated with OsGAP expression.
(A) Representation of the two main OsGAP haplotypes present in rice and rufipogon/nivara populations identified in the rice super-pangenome. Conserved nucleotide regions are connected by gray marks. Structural variants longer than 50 bp are shown as white spaces. TIP-eQTLs are shown as red boxes. Additional TIPs are shown as white boxes. (B) Boxplot representation of the expression of the two OsGAP haplotypes in the japonica population. Numbers inside boxplots represent the number of accessions in each group. Analysis of nucleotide diversity (π) and diversity in haplotypes homozygosity tracts (H12) for Hap A (C) and Hap B (D) in japonica population. The vertical dotted black line shows the position of the TIP insertion. The OsGAP gene is schematically shown in blue. The horizontal dashed black line represents the mean of 1000 random permutation pulls (for p-value see Supplementary file 6).
Figure 5—figure supplement 1
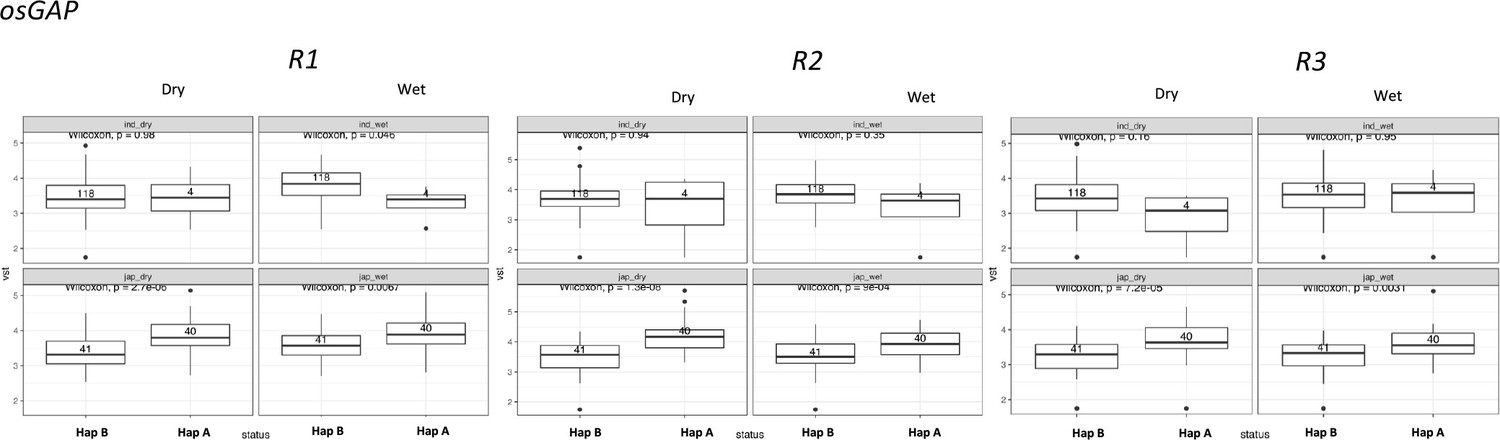
Boxplots representing the expression differences between haplotypes in OsGAP.
Three independent experimental replicates are shown separately.
Figure 6 with 1 supplement
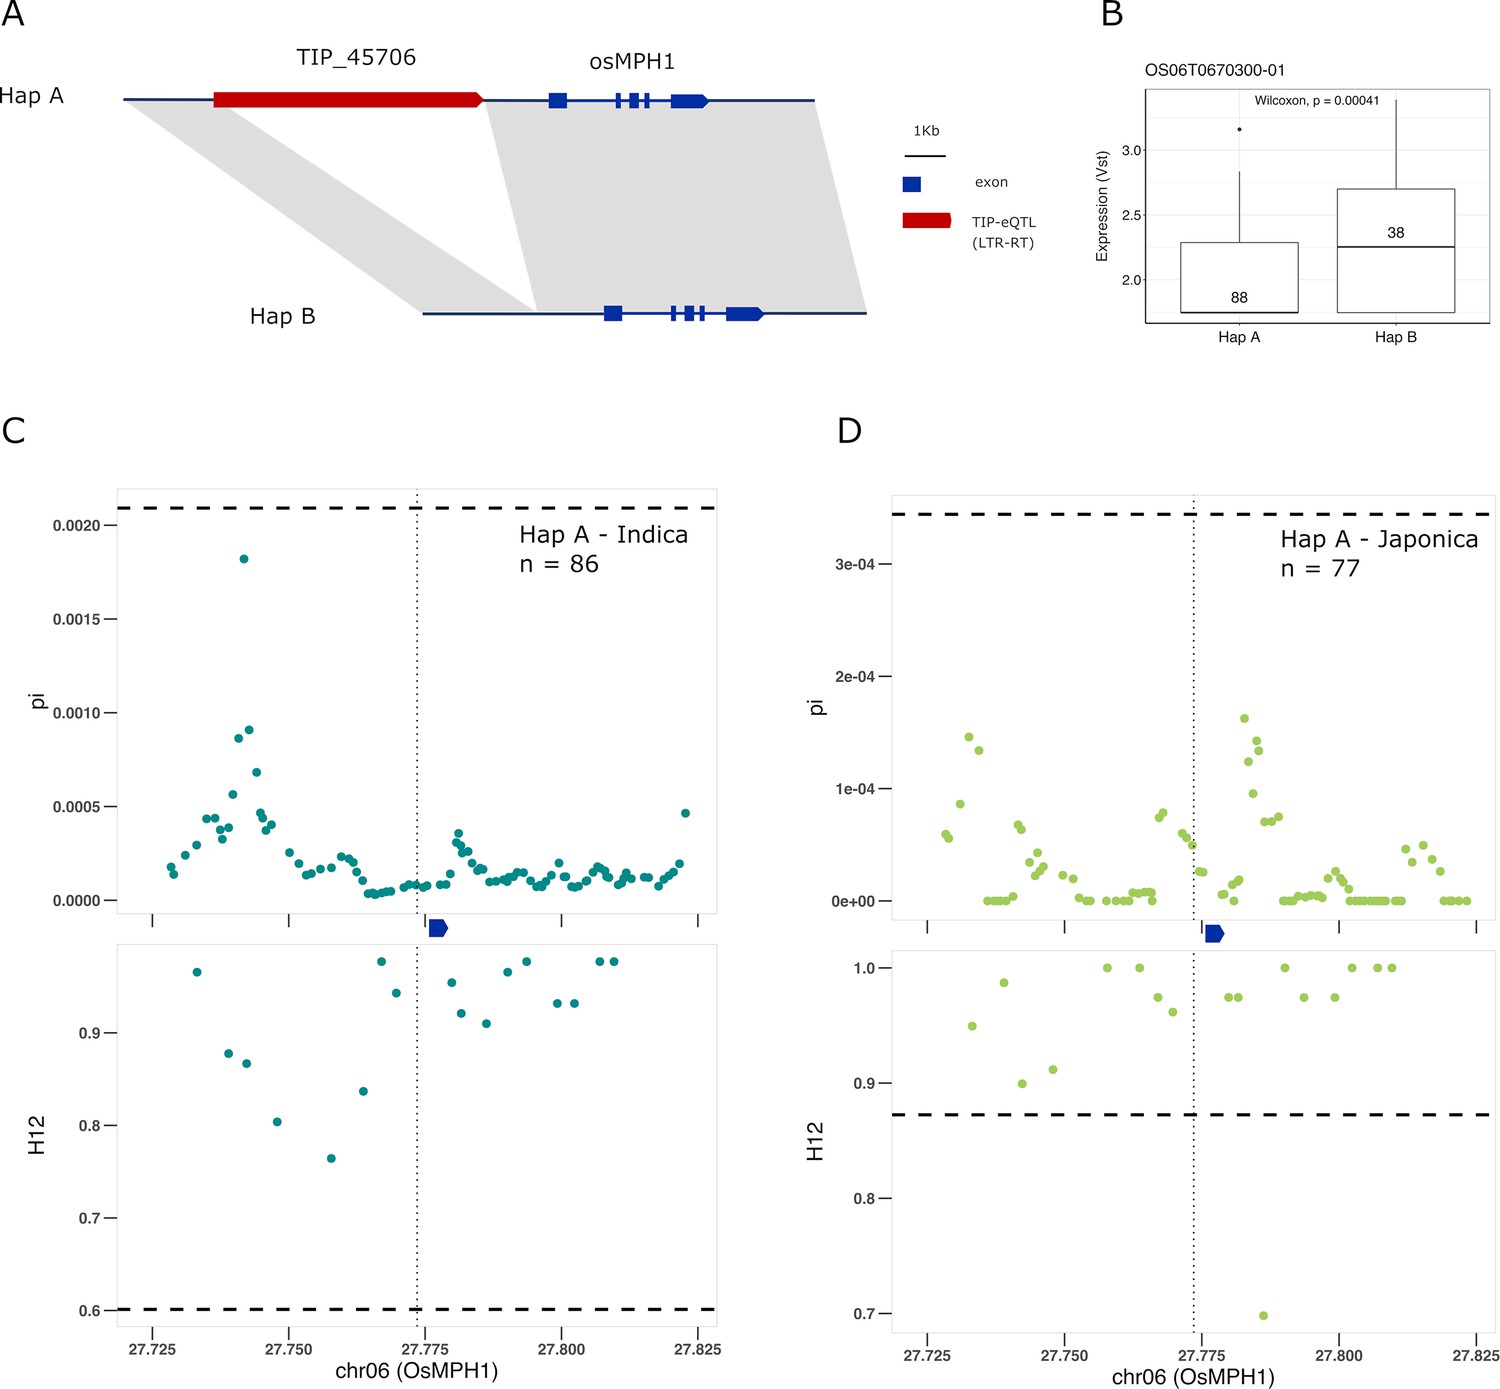
Selection on transposon insertion polymorphism (TIP)-expression quantitative trait loci (eQTLs) associated with OsMPH1 expression.
Representation of the two main OsMPH1 haplotypes present in rice and rufipogon/nivara populations identified in the rice super-pangenome. Conserved nucleotide regions are connected by gray marks. Structural variants longer than 50 bp are shown as white spaces. TIP-eQTLs are shown as red boxes. (B) Boxplot representation of the expression of the two OsMPH1 haplotypes in the japonica population. Numbers inside boxplots represent the number of accessions in each group. Analysis of nucleotide diversity (π) and diversity in haplotypes homozygosity tracts (H12) for Hap A in indica population (C) and in japonica population (D). The vertical dotted black line shows the position of the TIP insertion. The OsMPH1 gene, which is schematically shown in blue. The horizontal dashed black line represents the mean of 1000 random permutation pulls (for p-value see Supplementary file 6).
Figure 6—figure supplement 1
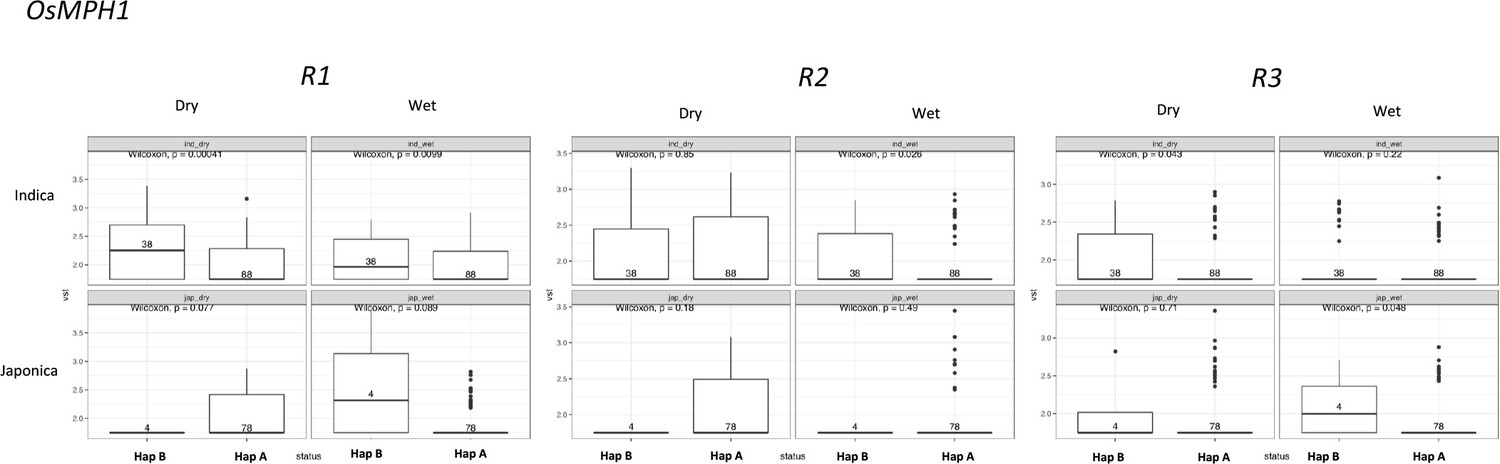
Boxplots representing the expression differences between haplotypes in OsMPH1.
Three independent experimental replicates are shown separately.
Additional files
-
Supplementary file 1
Extended information on significant transposon insertion polymorphism (TIP)-expression quantitative trait loci (eQTLs).
- https://cdn.elifesciences.org/articles/86324/elife-86324-supp1-v1.xlsx
-
Supplementary file 2
Transposon insertion polymorphism (TIP)-expression quantitative trait locus (eQTL) effect on gene expression levels up, for increased gene expression when tansposable element (TE) is present, down for decreased gene expression when TE is present according to TE superfamily classification.
- https://cdn.elifesciences.org/articles/86324/elife-86324-supp2-v1.xlsx
-
Supplementary file 3
Extended information on indica- and japonica-specific transposon insertion polymorphisms (TIPs) associated with expression changes.
- https://cdn.elifesciences.org/articles/86324/elife-86324-supp3-v1.xlsx
-
Supplementary file 4
NCBI-SRA accession numbers for O. rufipogon and O. nivara accessions used in this study.
- https://cdn.elifesciences.org/articles/86324/elife-86324-supp4-v1.xlsx
-
Supplementary file 5
Population Branch Statistic (PBS) results and transposon insertion polymorphism (TIP) information for TIP-expression quantitative trait loci (eQTLs) present in indica, japonica, and rufipogon/nivara populations.
- https://cdn.elifesciences.org/articles/86324/elife-86324-supp5-v1.xlsx
-
Supplementary file 6
Statistical significance of the permutation test performed to identify selection on OsJAZ1, OsGAP, and OsMPH1.
Only the haplotypes that cleared the p-value cutoff of 0.01 were reported to be under selection.
- https://cdn.elifesciences.org/articles/86324/elife-86324-supp6-v1.xlsx
-
MDAR checklist
- https://cdn.elifesciences.org/articles/86324/elife-86324-mdarchecklist1-v1.pdf
Download links
A two-part list of links to download the article, or parts of the article, in various formats.
Downloads (link to download the article as PDF)
Open citations (links to open the citations from this article in various online reference manager services)
Cite this article (links to download the citations from this article in formats compatible with various reference manager tools)
Transposons are important contributors to gene expression variability under selection in rice populations
eLife 12:RP86324.
https://doi.org/10.7554/eLife.86324.3


