Transposons are important contributors to gene expression variability under selection in rice populations
- Centre for Research in Agricultural Genomics, CRAG (CSIC-IRTA-UAB-UB), Campus UAB, Cerdanyola del Vallès, Spain
- Center for Genomics and Systems Biology, New York University, United States
- Center for Genomics and Systems Biology, New York University Abu Dhabi, Saadiyat Island, United Arab Emirates
eLife assessment
This valuable study reports on the role of transposable elements in gene expression variation in rice and how TE-associated expression changes could have been selected during domestication. The combination of evidence from linkage studies and selection scans for a subset of insertions is convincing, although it is difficult to know in how many cases linkage of TE insertions to other regulatory variants is responsible for altered gene expression and in how many cases the TE insertions themselves are the bona fide cause of altered gene expression. The work will be of interest to colleagues working on the role of transposable elements in adaptation and to biologists working on domestication.
https://doi.org/10.7554/eLife.86324.3.sa0Significance of the findings:
Valuable: Findings that have theoretical or practical implications for a subfield
- Landmark
- Fundamental
- Important
- Valuable
- Useful
Strength of evidence:
Convincing: Appropriate and validated methodology in line with current state-of-the-art
- Exceptional
- Compelling
- Convincing
- Solid
- Incomplete
- Inadequate
During the peer-review process the editor and reviewers write an eLife Assessment that summarises the significance of the findings reported in the article (on a scale ranging from landmark to useful) and the strength of the evidence (on a scale ranging from exceptional to inadequate). Learn more about eLife Assessments
Abstract
Transposable elements (TEs) are an important source of genome variability. Here, we analyze their contribution to gene expression variability in rice by performing a TE insertion polymorphism expression quantitative trait locus mapping using expression data from 208 varieties from the Oryza sativa ssp. indica and O. sativa ssp. japonica subspecies. Our data show that TE insertions are associated with changes of expression of many genes known to be targets of rice domestication and breeding. An important fraction of these insertions were already present in the rice wild ancestors, and have been differentially selected in indica and japonica rice populations. Taken together, our results show that small changes of expression in signal transduction genes induced by TE insertions accompany the domestication and adaptation of rice populations.
Introduction
Transposable elements (TEs) are a major component of eukaryotic genomes, particularly in plants (Wendel et al., 2016). Their ability to move, creating mutations by insertion/excision, and amplify in genomes – thus generating new copies that provide opportunities for recombination – make them a major source of genetic variability (Tenaillon et al., 2010). For this reason, TEs are considered a major driver of plant genome evolution, both in the wild and under human selection (Lisch, 2013). TE insertions and other structural variants, however, have been frequently overlooked when using genome-wide association studies (GWAS) to look for genetic variants linked to interesting phenotypes (Voichek and Weigel, 2020). The recent development of efficient tools to identify transposon insertion polymorphisms (TIPs) (Vendrell-Mir et al., 2019) has allowed the incorporation of TIPs in these analyses, and several GWAS reports have shown that TIPs uncover additional variability linked to phenotypic traits (Akakpo et al., 2020; Domínguez et al., 2020; Castanera et al., 2021). Interestingly, TIPs often explain more phenotypic variance compared to single nucleotide polymorphisms (SNPs), and can be used for genomic prediction (Vourlaki et al., 2022). The reason for this could be that, as compared with SNPs, TE insertions are more frequently the causal mutation.
A major fraction of the mutations linked to crop domestication and breeding are associated with changes of the expression of genes involved in signal transduction (Swinnen et al., 2016; Meyer and Purugganan, 2013). TEs can alter gene transcription, activating or repressing them, by different means. On the one hand, insertion of TEs within a promoter can interfere with transcription, and the silencing of TEs inserted close to genes can result in repression of gene expression (Wang et al., 2020; Martin et al., 2009; Quadrana, 2020). Alternatively, TE insertions can also result in gene overexpression (Tian et al., 2022; Studer et al., 2011), as TEs bring their own transcriptional promoters that can induce expression of neighboring genes. This is particularly clear for LTR retrotransposons which contain promoters in their 5′ and 3′ LTRs, and may provide nearby genes with alternative promoters. In addition, TEs can also contain transcription factor-binding sites (TFBS) that can alter the expression of host genes (Rebollo et al., 2012); it has been shown, for example, that miniature inverted-repeat transposable elements (MITEs) have frequently amplified and redistributed TFBS in plant genomes (Morata et al., 2018).
Here, we explore the impact of the movement of TEs during the recent evolution of rice on the variability of gene expression in this species. Rice is one of the most important food crops in the world, and varieties are generally found in two subspecies – Oryza sativa ssp. japonica and ssp. indica. Other minor variety groups include aus varieties, which appear closely related to indica, and basmati rice varieties that appear to be a hybrid between ssp. japonica and aus. We took advantage of a recently published transcriptional analysis of 208 rice varieties belonging to the major rice variety groups grown under wet paddy and intermittent drought conditions (Groen et al., 2020) to perform an expression quantitative trait locus (eQTL) GWAS using TIPs as genetic markers. We show that TIPs are frequently associated with changes of expression of rice genes and that many TIPs altering the expression of regulatory genes have been positively selected in indica and japonica rice subspecies.
Results
TIPs are associated with gene expression variation in rice
We used a recently published dataset containing genome resequencing and transcription data for rice (O. sativa) varieties to perform TIP-eQTL mapping analyses. The data we analyzed consist of an ‘indica’ dataset for 126 O. sativa ssp. indica and some circum-aus accessions, and 82 ‘japonica’ accessions comprising of O. sativa ssp. japonica and some circum-basmati varieties, described in Groen et al., 2020. We predicted TIPs using PopoolationTE2 (Kofler et al., 2016), and identified 45,050 TIPs. Using the Minghui MH63 short-read data and assembled genome (Zhang et al., 2016), we estimated the performance of the TIP genotyping on this dataset to have 97.1% sensitivity and 92.2% precision (see methods). Most of the TIPs detected are DNA transposons (84%), especially MITEs belonging to the Stowaway (24%) and Tourist (20%) superfamilies; LTR retrotransposons make up a minor fraction (9 %).
The 45,050 TIPs are distributed along the 12 chromosomes and 81.3% of them are less than 5 kb away from an annotated gene (IRGSP RAP-DB gene models). This results in up to 81.4% of rice genes having a TIP less than 5 kb distant. In order to analyze the potential of TIPs to generate gene expression variability in rice, we used the 3′ mRNA-seq expression data from leaves of adult plants grown in normally watered soil (‘wet’ condition) and under intermittent drought stress (‘drought stress’ condition) (Groen et al., 2020). We selected data from 15,549 genes showing expression in more than 10% of the samples. Due to the strong population structure present in rice we separately analyzed data in the indica (126 varieties) and japonica (82 varieties) datasets. We found a total of 563 significant associations between TIPs and gene expression levels in the indica population and 356 in the japonica population (TIP-eQTLs with minor allele frequency (MAF) >3%, false discovery rate [FDR] adjusted p-value <0.05 in at least one replicate) (Figure 1A, B, Supplementary file 1). These involve 477 and 317 genes, in indica and japonica, respectively, representing 3.1% and 2% of the expressed genes. The TIP-eQTLs were related to the different TE types (orders Wicker et al., 2007), and the proportion of TE orders found in the significant TIPs did not differ significantly from their representation across the genome (Figure 1C).
Figure 1 with 1 supplement see all
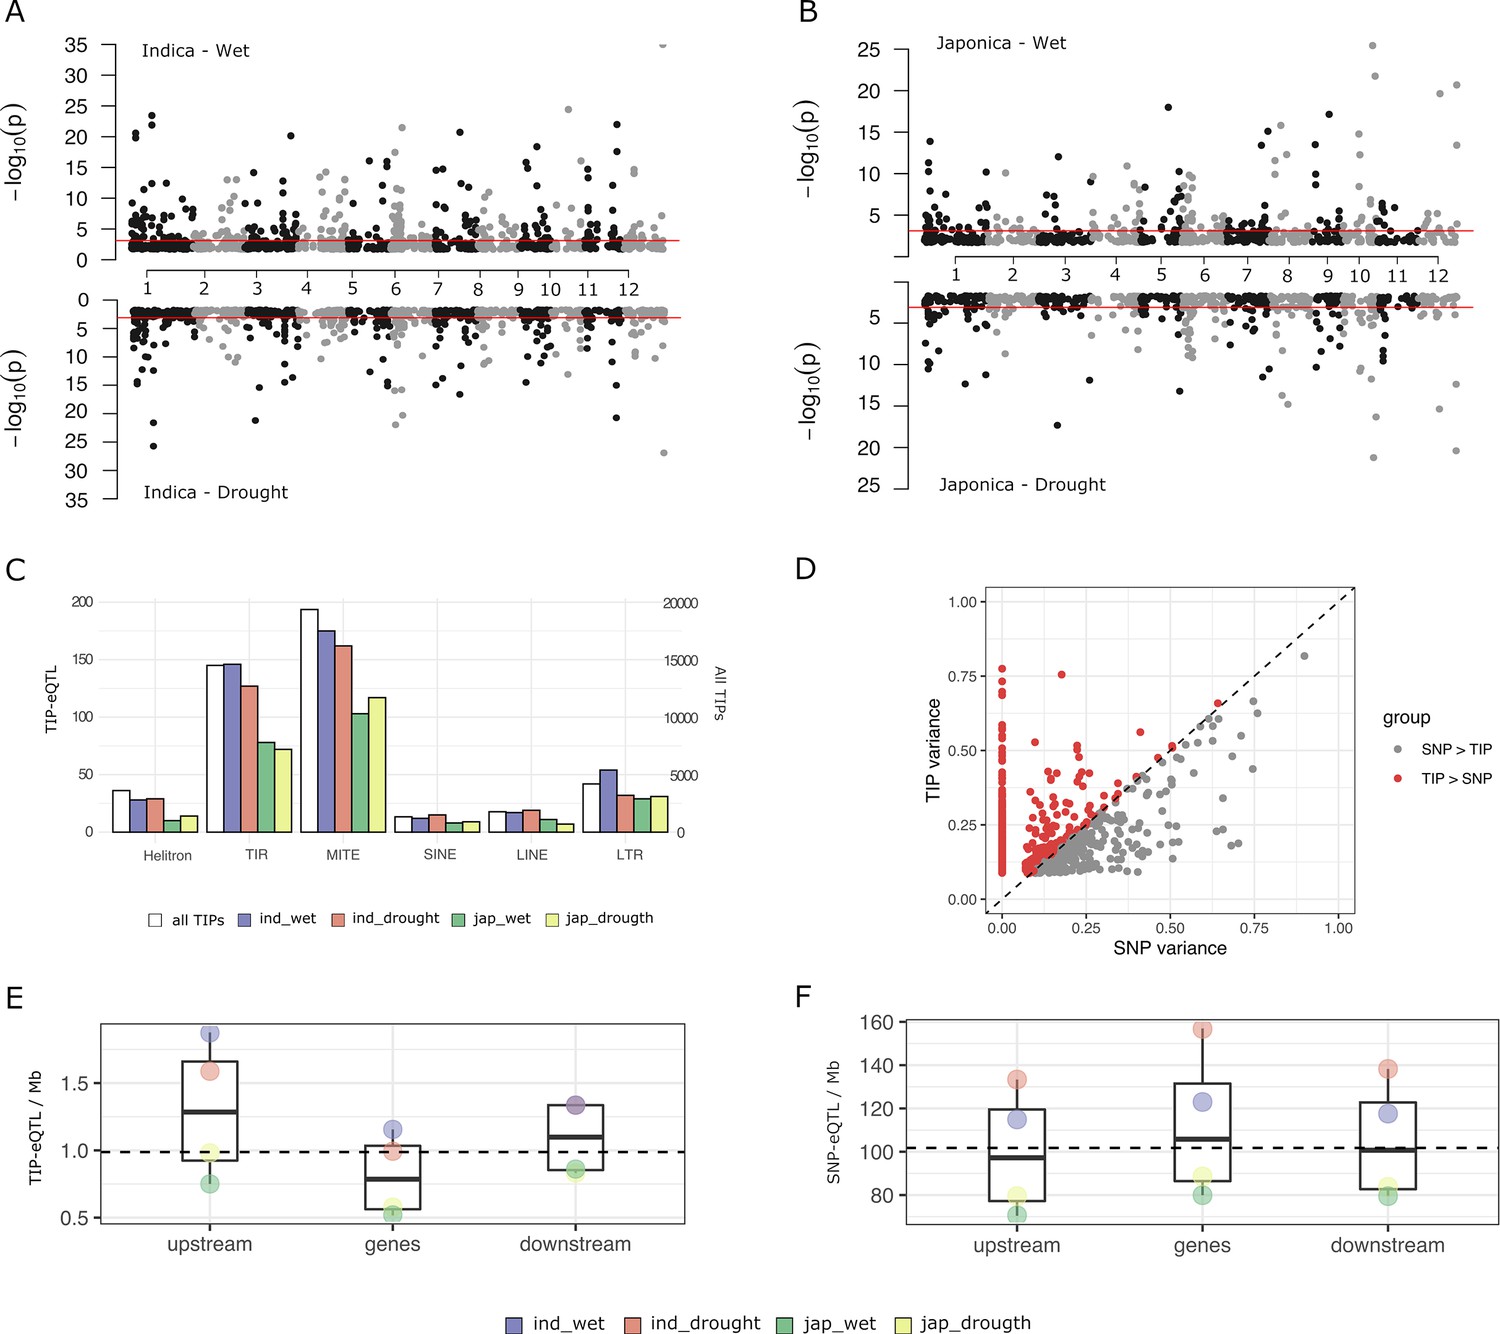
Characterization of rice transposon insertion polymorphism (TIP)-expression quantitative trait loci (eQTLs).
(A, B) Association between TIPs and gene expression levels in cis (TIP-eQTLs) found in indica and japonica population along the 12 rice chromosomes. Horizontal lines represent 5% significance thresholds corrected for multiple testing using false discovery rate (FDR) method. (C) Number of TIP-eQTLs found in each condition classified at the order transposable element (TE) level. White bars represent the number of total TIPs (secondary axis). (D) Expression variance explained by leading TIP-eQTL and SNP-eQTL. Each point represents a gene. Indica and japonica TIP-eQTLs are combined into a single plot. Number of TIP-eQTLs (E) or SNP-eQTL (F) per Mb of gene feature. Upstream and downstream regions are 1 kb long. Gene region includes 5′ and 3′ UTRs. All the TIPs and SNPs with a significant association (FDR <5%) were used in this analysis.
In order to estimate the relative contribution of TIPs and SNPs to gene expression changes, we also performed eQTL mapping analyses using a high density genotype matrix consisting of 824,311 SNPs for indica and 706,542 SNPs for japonica (Groen et al., 2020). We obtained 4913 SNP-eQTLs in indica and 3308 SNP-eQTLs in japonica associated with SNPs located less than 5 kb from the gene (were each SNP-eQTL represents the leading SNP–gene association). This corresponds to ~31.6% of the genes in indica and ~21.3% in japonica. For each gene with a significant TIP-eQTL association, we compared the proportion of variance (R2) explained by the most significantly associated TIPs and/or SNPs. For most genes that have an associated TIP, either there is no associated SNP or the TIP explains more expression variance than the associated SNP (~62% of the indica TIP-eQTLs and ~73% of the japonica TIP-eQTLs) (Figure 1D). This result could be reproduced by running the association using SNPs and TIPs together (Figure 1—figure supplement 1A), and also by subsampling SNPs to the same number of TIPs (Figure 1—figure supplement 1B). This demonstrates that TIPs uncover genetic associations with changes of expression that are not observed when using SNPs as molecular markers.
The SNP-eQTLs found in our study are associated to both positive (47%) and negative (53%) effects on gene expression levels, very close to an even distribution. In contrast, TIPs more frequently have a negative effect (59%). The proportion varies among TE superfamilies, with TIR/MULEs being close to 50%, and LTR/Gypsy having the most frequently negative impact on gene expression (67%, Supplementary file 2). This suggests that, as compared with SNP-eQTLs, TIP-eQTLs are more frequently the likely causal mutation responsible for the change in expression, and that the effect of the insertion is more generally negative, in line with recent analyses done in Capsella (Uzunović et al., 2019), especially for long elements such as LTR retrotransposons.
An analysis of the TIP- and SNP-eQTL location with respect to the associated genes shows that while SNP-eQTLs are more evenly distributed across the genic region (Figure 1F), TIP-eQTLs are over-represented in the 1 kb region upstream of the gene (Figure 1E), which is the region that most frequently contains promoter elements regulating transcription. This suggests that although some TIP-eQTLs could be in linkage disequilibrium with the causal mutation for the change of expression, an important fraction of TIP-eQTLs could be the actual causal mutation inducing expression variation.
It has been proposed that an important fraction of gene expression variation is deleterious, and therefore, alleles associated with major expression effects should be maintained at lower frequencies (Josephs et al., 2015; Lye et al., 2022). An analysis of the effect size of the different TIP-eQTLs taking into account their frequency in the population shows that, indeed, low- and high-frequency TIPs (corresponding to rare alleles) show the highest positive or negative effect on the expression of the associated gene (Figure 2A–D, Figure 2—figure supplement 1). This is consistent with what is described as the rare variant effect (Lye et al., 2022) where rare (and likely deleterious) mutations in a population are associated with greater effects on gene expression in a population.
Figure 2 with 2 supplements see all
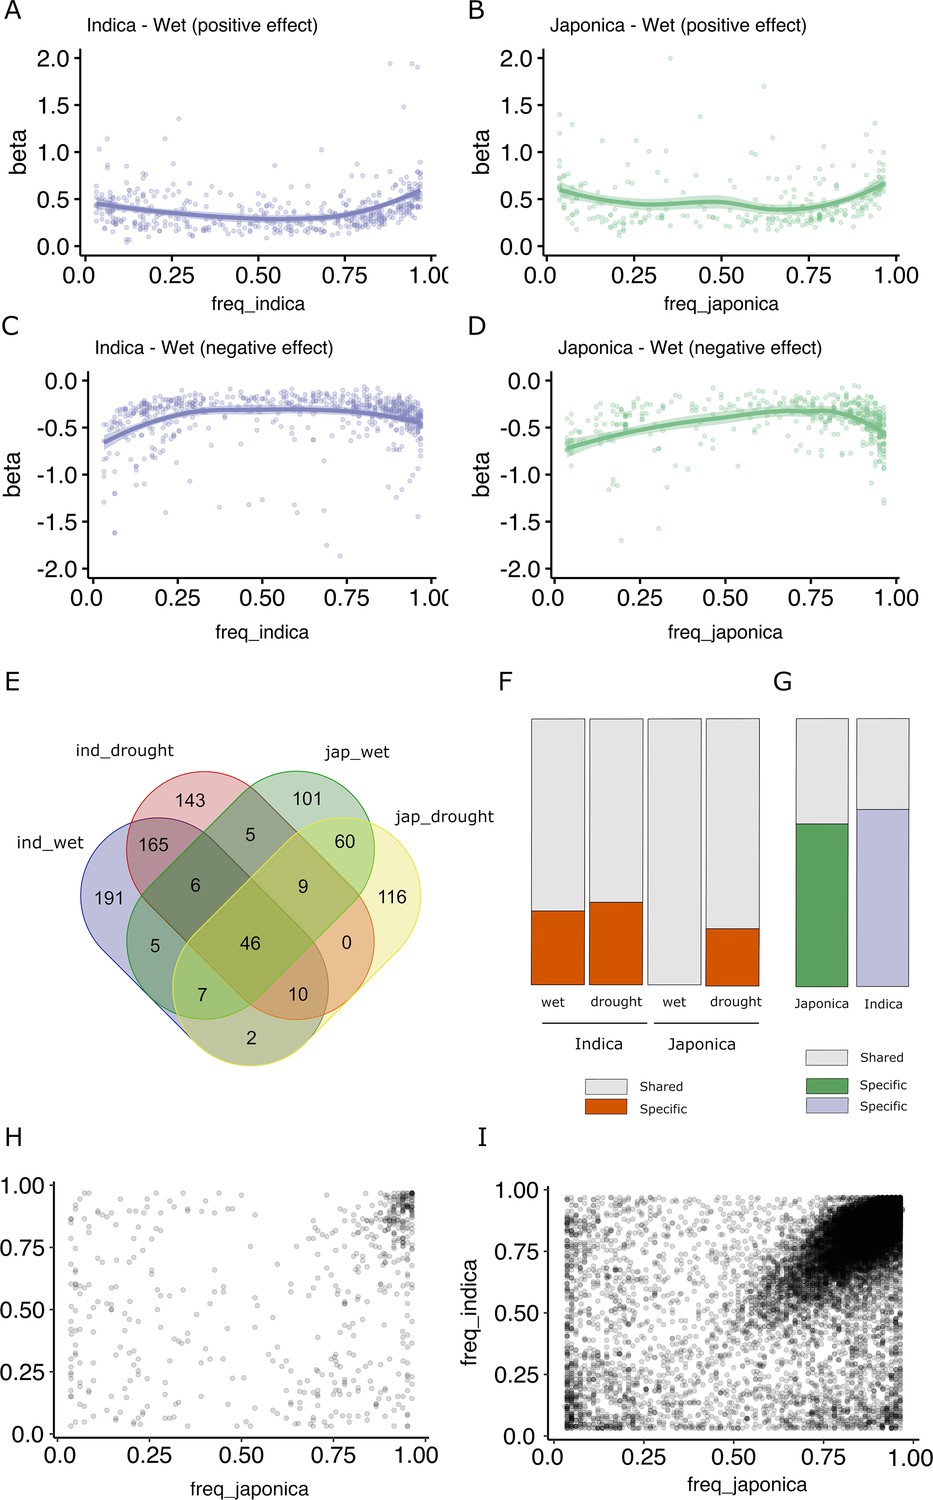
Effect size and population frequencies of wet and drought-stress transposon insertion polymorphism (TIP)-expression quantitative trait loci (eQTLs).
Representation of the effect size (beta) of the TIP-eQTLs with respect to their population frequency in indica (A, C) and japonica (B, D) for positive (A, B) and negative (C, D) effects. Venn diagram illustrating the intersection between TIP-eQTLs detected in each condition of the two subspecies analyzed, indica (ind) and japonica (jap) (E). Percentage of condition-specific (F) and species-specific (G) TIP-eQTLs. Shared TIPs are those falling in the intersection between the false discovery rate (FDR)-corrected TIP-eQTLs found in a given population/condition and all the associations of the other population/condition using a relaxed cutoff (p < 0.05, no FDR correction). Relationship between the frequencies in indica and japonica populations of the and 829 TIP-eQTLs (H) and the 33,389 non-eQTL-TIPs (I).
A comparison of TIP-eQTLs associated with changes of expression in the two different growth conditions (wet and drought stress) shows that there is an important overlap of eQTLs between the two environments (38.5% for indica TIP-eQTLs and 33.2% for japonica TIP-eQTLs) (Figure 2E). Such overlap increases to 90% (average of indica and japonica, wet) and 71% (average of indica and japonica, drought stress) when we compare TIP-eQTLs of one condition with non-FDR-corrected TIP-eQTLs in the other environment (Figure 2F). All the associations shared in the two environments had the same effect type on expression (positive or negative). This result suggests that the majority of TIP-eQTLs are general associations with changes of expression in both growth conditions, and that only a small number of TIP-eQTLs (81 in indica and 78 in japonica) are associated with stress-specific changes of expression. Nevertheless, among the TIP-eQTLs associated with changes of gene expression in both wet and drought stress, there are TIP associated with genes known to be involved in drought tolerance (Supplementary file 1). As an example, TIP_49046 is associated with a reduction of the expression of the gene synaptotagmin-5 (OsSYT-5). OsSYT-5 encodes a Ca2+ sensing protein with a C2 domain, is expressed in both stressed and non-stressed plants, and it has been recently shown that its silencing enhances drought tolerance in rice (Shanmugam et al., 2021). Other examples are TIP_23764 and TIP_52367, associated with an increased expression of the gene encoding the OsSAPK10 ABA-activated protein kinase and the S-type euonymus-related lectin gene OsEULS2 in, respectively, two genes known to mediate drought stress in rice (Gao et al., 2022; Lambin et al., 2020).
TIP-eQTLs are present at different population frequencies in indica and japonica
Although the overlap of TIPs associated with changes in expression under wet and drought stress conditions is very high, the overlap between indica and japonica TIP-eQTLs is low, and only 90 TIP-eQTLs out of the 563 from indica and 356 from japonica are significantly associated with variation of gene expression in both subspecies (Figure 2E). Even when we make the less-stringent comparison of the TIP-eQTLs of one subspecies with the non-FDR-corrected TIP-eQTLs of the other, as much as ~69% of indica and ~60% of japonica TIP-eQTLs appear as subspecies specific (Figure 2F). Regarding the common associations between subspecies, all of them have the same effect type on expression (positive or negative). This result may suggest differences in the transcriptional networks in indica and japonica or, alternatively, that different alleles showing expression level differences may be differentially represented in the two subspecies. An analysis of the frequencies in indica and japonica of all the TIP-eQTLs described here shows that approximately one-third of the TIPs are only found in one of the two subspecies at MAF >3%, although only 59 (indica) and 21 (japonica) associations correspond to truly species-specific TIPs (completely absent in one of the two subspecies). We looked for these TIPs in 82 Oryza rufipogon and Oryza nivara varieties and found that 56% of the indica-specific and 24% of the japonica-specific TIPs were present in such population. This suggests that TEs have been actively inserting (or have been excised or eliminated from the population) very recently during rice evolution, likely post-domestication and during the crop diversification phase, as has already been proposed for some rice TE families (Lu et al., 2017; Carpentier et al., 2019). Here, we show that some of these recent TIPs are associated with changes in gene expression and may therefore have phenotypic consequences. Some of these insertions are found at high frequencies in its corresponding subspecies, which suggest that they may have been under positive selection (Supplementary file 3).
However, the vast majority of TIP-eQTLs found in this study (90%) correspond to TIPs present in both subspecies, which suggests that these insertions are relatively old and were already present in the ancestor of indica and japonica rice. Remarkably, in most cases they are found at very different frequencies in the two subspecies (Figure 2H). This suggests that these insertions were already present in the ancestor of indica and japonica rice and have been differentially retained in the two subspecies. Interestingly, an analysis of all non-eQTL-TIPs shows that an important fraction is found at the same frequency in both genomes (Figure 2I). This differential pattern between eQTL and non-eQTL-TIPs is also found when we consider only the upstream gene regions (1 kb, Figure 2—figure supplement 2), suggesting that the preferential retention of TIP-eQTLs in indica or japonica may be a specific phenomenon potentially linked to their impact on the expression of the associated genes.
We examined whether TIP-eQTLs present in both indica and japonica varieties are also found in either Oryza rufipogon and Oryza nivara, the wild rice relatives believed to be the ancestors of domesticated rice (Choi et al., 2017). We looked for the presence of the TIPs identified in rice in a set of 72 accessions of O. rufigogon and 10 accessions of O. nivara (collectively called rufipogon/nivara from now on) (Supplementary file 4). Up to 552 of the 829 TIP-eQTLs present in indica and/or japonica (66%), can be found in rufipogon/nivara varieties, confirming that an important fraction of TIP-eQTLs found in indica and japonica may be relatively old insertions already present in the wild ancestors of domesticated rice. Not surprisingly, in most cases the TIP frequencies in rufipogon/nivara are different from the frequencies of these insertions in indica and/or japonica (Supplementary file 5); these may have arisen either due to selection or genetic drift accompanying the bottleneck associated with crop evolution.
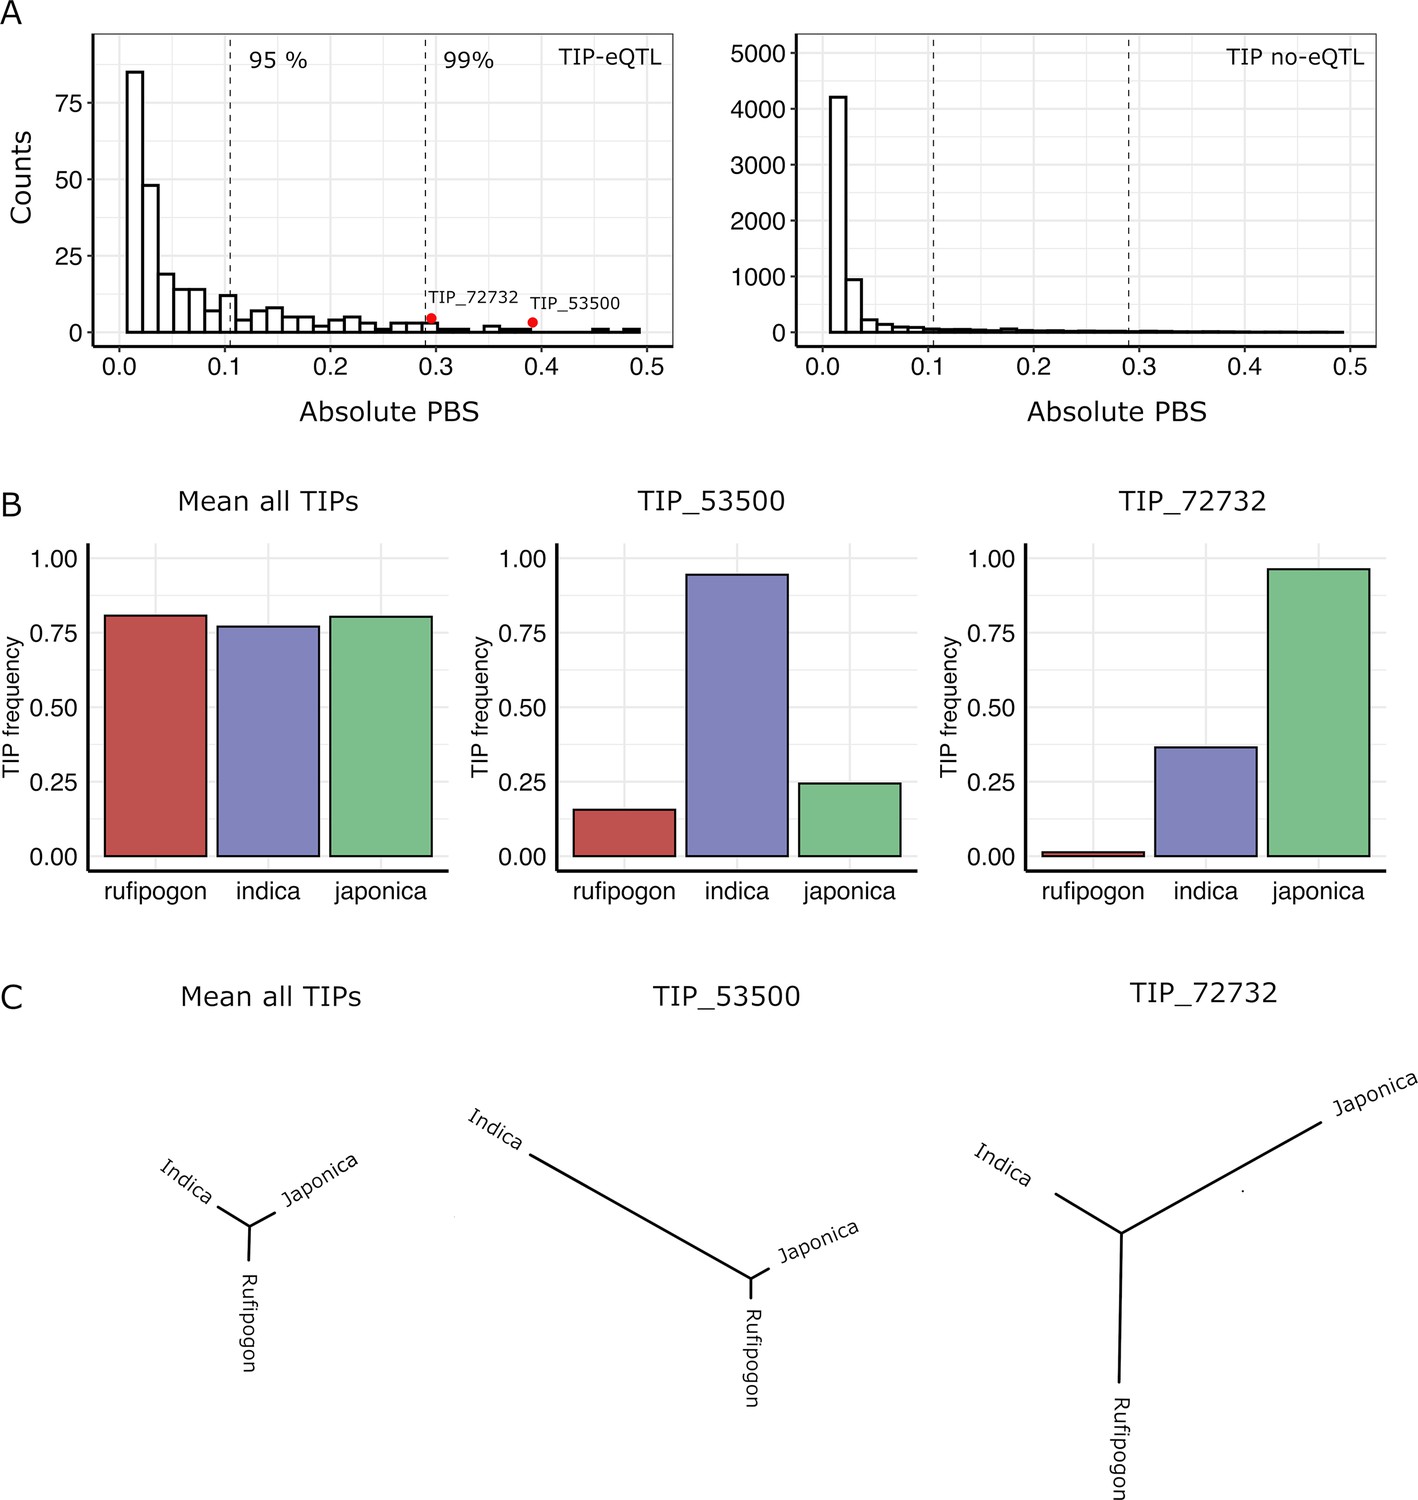
In order to identify possible selection of TIPs in indica and japonica populations, we used the Population Branch Statistic (PBS) method (Yi et al., 2010) which examines strong differentiation in frequencies between populations. This approach consists in comparing the three pairwise FST values between indica, japonica, and rufipogon/nivara to estimate the frequency change in TIPs that occurred since the divergence of the two rice subspecies from its wild ancestor. We calculated PBS values for a total of 11,698 TIPs present in the japonica, indica, and rufipogon/nivara populations, which included 354 TIPs that are eQTLs in in indica and/or japonica populations. TIP-eQTLs showed much higher PBS values in comparison to those not identified as eQTLs (Figure 3A) (mean absolute PBS of 0.06 vs 0.02, respectively, p < 0.01, Wilcoxon test). Furthermore, TIPs with the most extreme PBS values (above 95 percentile) are enriched for TIP-eQTLs (Fisher’s exact test odds ratio = 4.87, p < 0.01), suggesting that a high fraction of TIP-eQTLs have been positively selected in indica or japonica. Note that some of the TIPs not identified as eQTLs in this particular dataset may actually be linked to variation of gene expression in organs, developmental stages or environmental conditions different from the ones analyzed here. Interestingly, up to 35% of the TIP-eQTLs identified here, associated with 119 genes, fell within the top 10% of absolute PBS values for all TIPs (Figure 3A), suggesting that TIPs associated with gene expression variation have likely been under differential selection during rice evolution.
Figure 3
Signatures of positive selection on transposon insertion polymorphism (TIP)-expression quantitative trait loci (eQTLs).
(A) Absolute Population Branch Statistic (PBS) of 354 TIP-eQTLs (left) and 11,344 TIPs (no-eQTL, right) present in indica, japonica, and rufipogon populations. Dotted vertical lines represent the 95th and 99th percentiles of the PBS values of the whole dataset (11,698 TIPs). Red dots represent two examples of TIP-eQTLs with extreme PBS values. (B) Population frequency of the two TIPs with extreme PBS values, marked as red dots in the left panel (A), as well as of the whole TIP dataset. (C) Fst-based tree of the two TIPs with extreme PBS values, as well as of the whole TIP dataset (average Fst).
We observe that TIPs can show evidence of selection in japonica, indica or both subspecies. As examples, Figure 3B, C shows the representation of the PBS analysis, and the frequency in the populations, of two TIP-eQTL whose frequency has greatly increased in indica (TIP_53500) or japonica (TIP_72732), compared with the mean PBS for all TIPs.
Gene variants selected during rice evolution: some examples
Genes linked with TIP-eQTLs showing extreme indica or japonica PBS metrics are good candidates for genes underlying adaptation between different rice subspecies. Among the genes with TIP-eQTLs that have extreme PBS values in indica or japonica we can find several examples that are known to regulate plant architecture, plant and grain development or abiotic stress responses.
Some of the most extreme PBS values are for TIPs associated with changes of expression of genes involved in the signal transduction of hormones, including brassinosteroids, ABA, ethylene, jasmonic acid (JA) and auxin (Supplementary file 5). We found four different TIP-eQTLs with high PBS values associated with the EG2/OsJAZ1 gene (Os04g0653000), a locus encoding a JA signaling repressor (Cai et al., 2014); the four insertions are related to MITEs of the Tourist transposon superfamily. Three of the insertions (TIP_32891, TIP_32892, and TIP_32894), located upstream (3.4 and 2.7 kb) and downstream (150 bp) of the gene, are associated with an increase of expression of EG2, and are physically linked to one another (mean r2 value = 0.88). In contrast, the fourth insertion (TIP_32893), which is not linked to them, is present within the first intron of the gene and is associated with expression reduction.
The recent advances in characterizing the pangenome of rice and the super-pangenome that includes its wild ancestors (Qin et al., 2021; Zhou et al., 2020; Shang et al., 2022) has allowed us to characterize the locus in indica, japonica, and rufipogon/nivara. This analysis showed that EG2 is primarily found in two different haplotypes (Figure 4A). One haplotype, Hap A, contains the three MITE insertions associated with higher expression of EG2 (Figure 4A, B, and Figure 4—figure supplement 1), while the second haplotype, Hap B, contains the fourth MITE insertion and is associated with reduced EG2 expression (Figure 4A, B and Figure 4—figure supplement 1). Hap A was identified to be at high frequency in rufipogon/nivara (48%), whereas Hap B is at lower frequency (16%). The frequency of both Hap A and Hap B is slightly increased in japonica (65% and 28%, respectively). In indica, however, there is a clear reduction in the frequency of Hap A and a concomitant strong frequency increase of Hap B, associated with reduced expression in indica (16% and 83%, respectively). Interestingly, EG2/OsJAZ1 is a repressor of spikelet development (Cai et al., 2014) and the number of differentiated spikelets per panicle tends to be lower in japonica as compared with indica (Ansari et al., 2003).
Figure 4 with 1 supplement see all
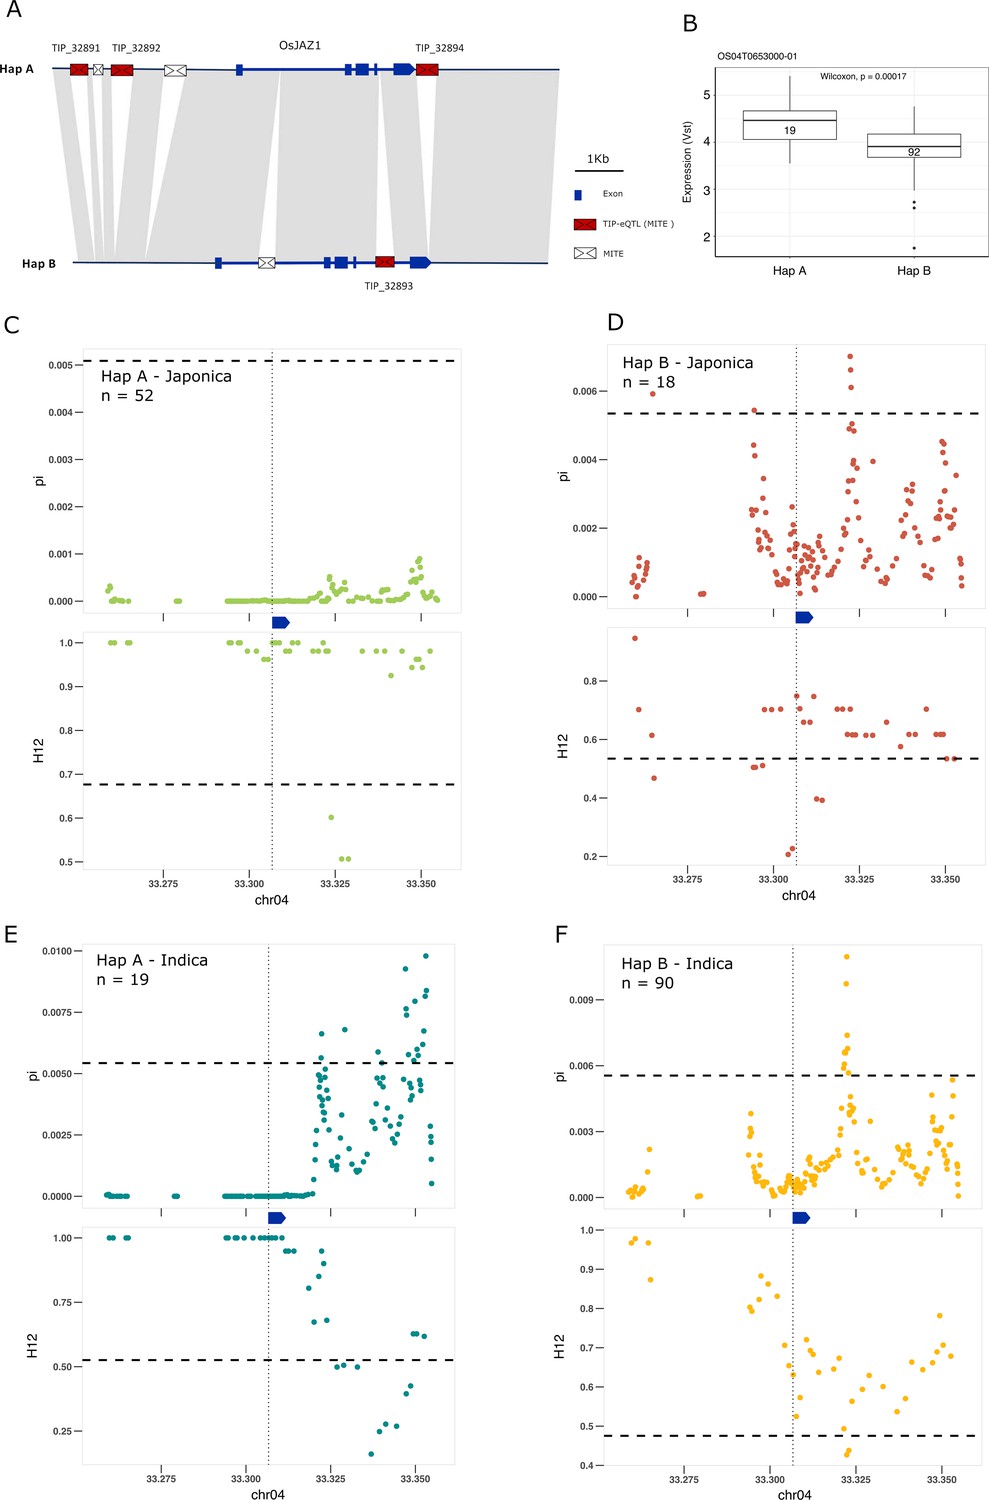
Selection on transposon insertion polymorphism (TIP)-expression quantitative trait loci (eQTLs) associated with EG2 expression.
(A) Representation of the two main EG2 haplotypes present in rice and rufipogon/nivara populations identified in the rice super-pangenome. Conserved nucleotide regions are connected by gray marks. Structural variants longer than 50 bp are shown as white spaces. TIP-eQTLs are shown as red boxes. Additional TIPs are shown as white boxes. (B) Boxplot representation of the expression of the two EG2 haplotypes in the indica population. Numbers inside boxplots represent the number of accessions in each group. Analysis of nucleotide diversity (π) and diversity in haplotypes homozygosity tracts (H12) for Hap A (C, E) and Hap B (D, F) in japonica (C, D) and indica (E, F) populations. The vertical dotted black line shows the position of the TIP insertion. The EG2 gene is schematically shown in blue. The horizontal dashed black line represents the mean of 1000 random permutation pulls (for p-value see Supplementary file 6).
We looked more closely for signs of selection at this specific locus, by examining levels of nucleotide diversity (π; Nei and Li, 1979) and diversity in haplotypes homozygosity tracts (H12; Garud and Rosenberg, 2015). Consistent with the expression (and possible spikelet phenotypic differences), we found that in japonica the haplotype associated with increased EG2 expression (Hap A) was under positive selection, whereas the haplotype associated with decreased expression of EG2 (Hap B) did not show any sign of selection; this indicates that positive selection acts on individuals carrying the haplotype for high expression of EG2 in japonica (Figure 4C, D). Specifically, we observe significantly lower π and higher H12 in Hap A, associated with increased EG2 expression, while this pattern was not significant for Hap B (Supplementary file 6). However, in indica the opposite pattern appears to prevail, wherein there is a stronger evidence of selection for Hap B, but less so for Hap A (Figure 4E, F). This suggests positive selection toward higher expression of EG2 in japonica, and lower expression of EG2 in indica, which could potentially explain the higher number of spikelets per panicle observed in the latter (Ansari et al., 2003).
Another good candidate for genes underlying adaptation of rice is the OsGAP gene. There are two different TIP-eQTLs with high PBS values associated with changes of expression of the OsGAP gene (Os07g0500300) in japonica, whereas they do not correlate with changes in expression in indica (Figure 5—figure supplement 1). OsGAP encodes a putative GTPase activating protein, similar to CAR proteins (C2-domain abscisic acid-related proteins), that play an important role in ABA signal transduction in Arabidopsis (Xu et al., 2019). The first TIP (TIP_50057) is located ~4 kb upstream of the OsGAP gene and is associated with an increase of expression of the gene in japonica whereas the second insertion (TIP_50059) is located within the first intron and is associated with a decrease in expression in japonica (Figure 5A, B). The analysis of the locus using the super-pangenome data shows that OsGAP is found in two different haplotypes, one containing TIP_50057 (Hap A) and the other containing TIP_50059, together with some additional structural differences (Hap B; Figure 5A). The two TIPs defining the two haplotypes are present in the rufipogon/nivara population at complementary frequencies (73% and 19%, respectively). Interestingly, the proportion of the two haplotypes in cultivated rice seem to be very different, with an increased frequency of the haplotype associated with a reduced expression of OsGAP (Hap B) in both japonica (~50%) and indica (~95%) were it reaches near fixation.
Figure 5 with 1 supplement see all
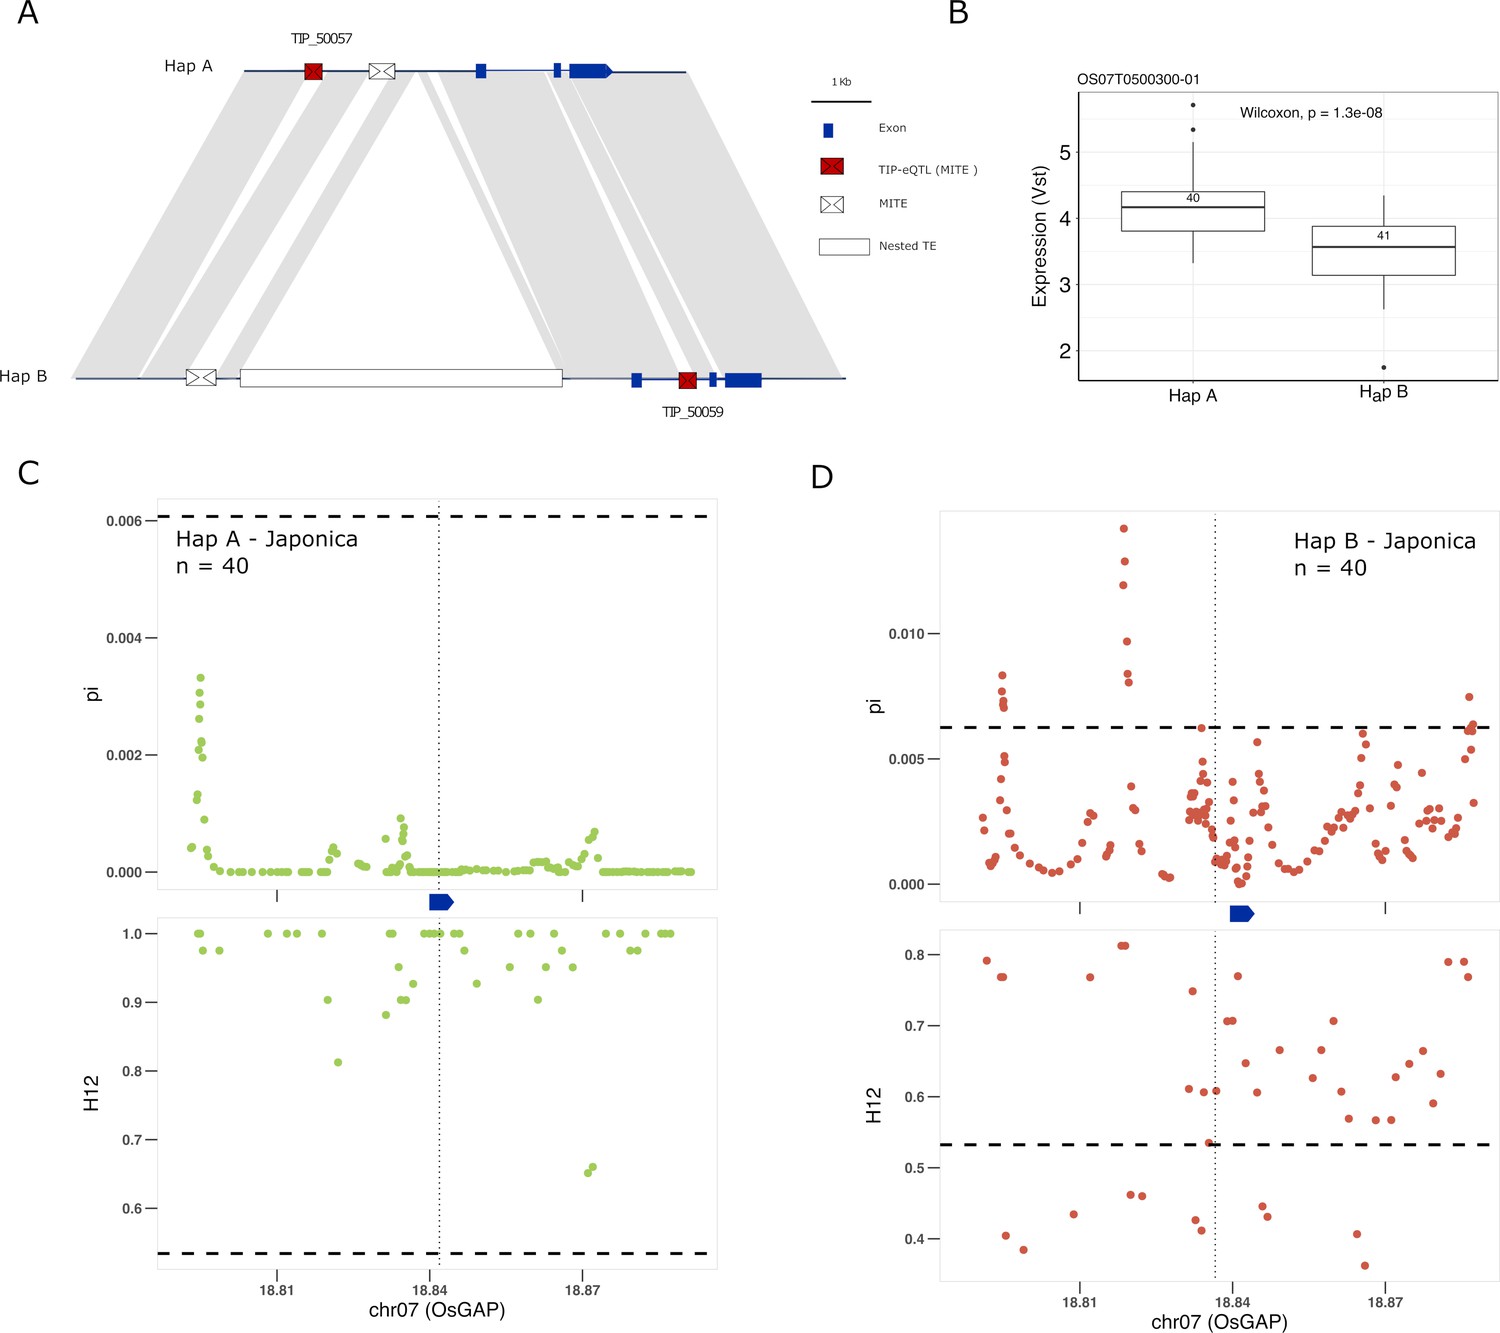
Selection on transposon insertion polymorphism (TIP)-expression quantitative trait loci (eQTLs) associated with OsGAP expression.
(A) Representation of the two main OsGAP haplotypes present in rice and rufipogon/nivara populations identified in the rice super-pangenome. Conserved nucleotide regions are connected by gray marks. Structural variants longer than 50 bp are shown as white spaces. TIP-eQTLs are shown as red boxes. Additional TIPs are shown as white boxes. (B) Boxplot representation of the expression of the two OsGAP haplotypes in the japonica population. Numbers inside boxplots represent the number of accessions in each group. Analysis of nucleotide diversity (π) and diversity in haplotypes homozygosity tracts (H12) for Hap A (C) and Hap B (D) in japonica population. The vertical dotted black line shows the position of the TIP insertion. The OsGAP gene is schematically shown in blue. The horizontal dashed black line represents the mean of 1000 random permutation pulls (for p-value see Supplementary file 6).
It has been proposed that OsGAP is a negative regulator of ABA signaling in seed germination and dormancy, and that reduced expression of OsGAP may prevent rice pre-harvest sprouting (PHS) (Xu et al., 2019). Reduced seed dormancy is a common target for selection of cultivated varieties, but this trait may come at a cost of a higher PHS risk, which may be a problem, especially in regions where heavy rain is common during the harvest season. Therefore, the appropriate degree of dormancy may depend on the agroecological conditions in which a particular variety is grown. We see here that two independent TIPs are associated with changes of OsGAP expression in japonica but not in indica (Figure 5A, Figure 5—figure supplement 1). Interestingly, there are clear and strong signs of selection for increased expression of OsGAP in japonica, wherein Hap A was under positive selection, and Hap B was selectively neutral, indicating positive selection acts on only those individuals carrying haplotype for high expression of OsGAP in japonica (Figure 5C, D; Supplementary file 6). In contrast, there is no evidence for selection in indica varieties despite the near fixation of one haplotype. This suggests that an increased level of OsGAP may be relevant for the control of dormancy in japonica but not in indica (despite its near-fixation in the latter), which would be in line with recent data suggesting that seed dormancy is regulated by different genes/alleles in indica and japonica (Magwa et al., 2016).
Finally, we find a TIP-eQTL whose frequency has greatly increased in cultivated rice with respect to rufipogon/nivara. TIP_45706, corresponding to an insertion of a gypsy-like LTR-RT at ~1 kb upstream of the OsMPH1 gene (Figure 6A). This insertion is associated with a decrease in the expression of OsMPH1 in indica and possibly japonica varieties (Figure 6B, Figure 6—figure supplement 1), and is found at low frequency in rufipogon/nivara (~11%) but at high frequency in both indica (70%) and japonica (95%). OsMPH1 encodes an MYB-like transcription factor that has been shown to regulate plant height, its reduced expression resulting in shorter plants (Zhang et al., 2017). A reduction in plant height due to a mutation in the SD1 gene, which encodes the gibberellin biosynthesis gene GA-20ox, was at the origin of the Green Revolution in the 1960s, but it has been shown that alleles of SD1 resulting in shorter culm length were also selected during the domestication of japonica rice (Asano et al., 2011). Our results suggest possible parallel selection of alleles in other genes that may lead to similar phenotypes. This is further reinforced by strong selection acting on the haplotype containing the TIP_45706 insertion in both indica and japonica (Figure 6C, D, Supplementary file 6), leading to reduced expression of OsMPH1 and thus shorter plants.
Figure 6 with 1 supplement see all
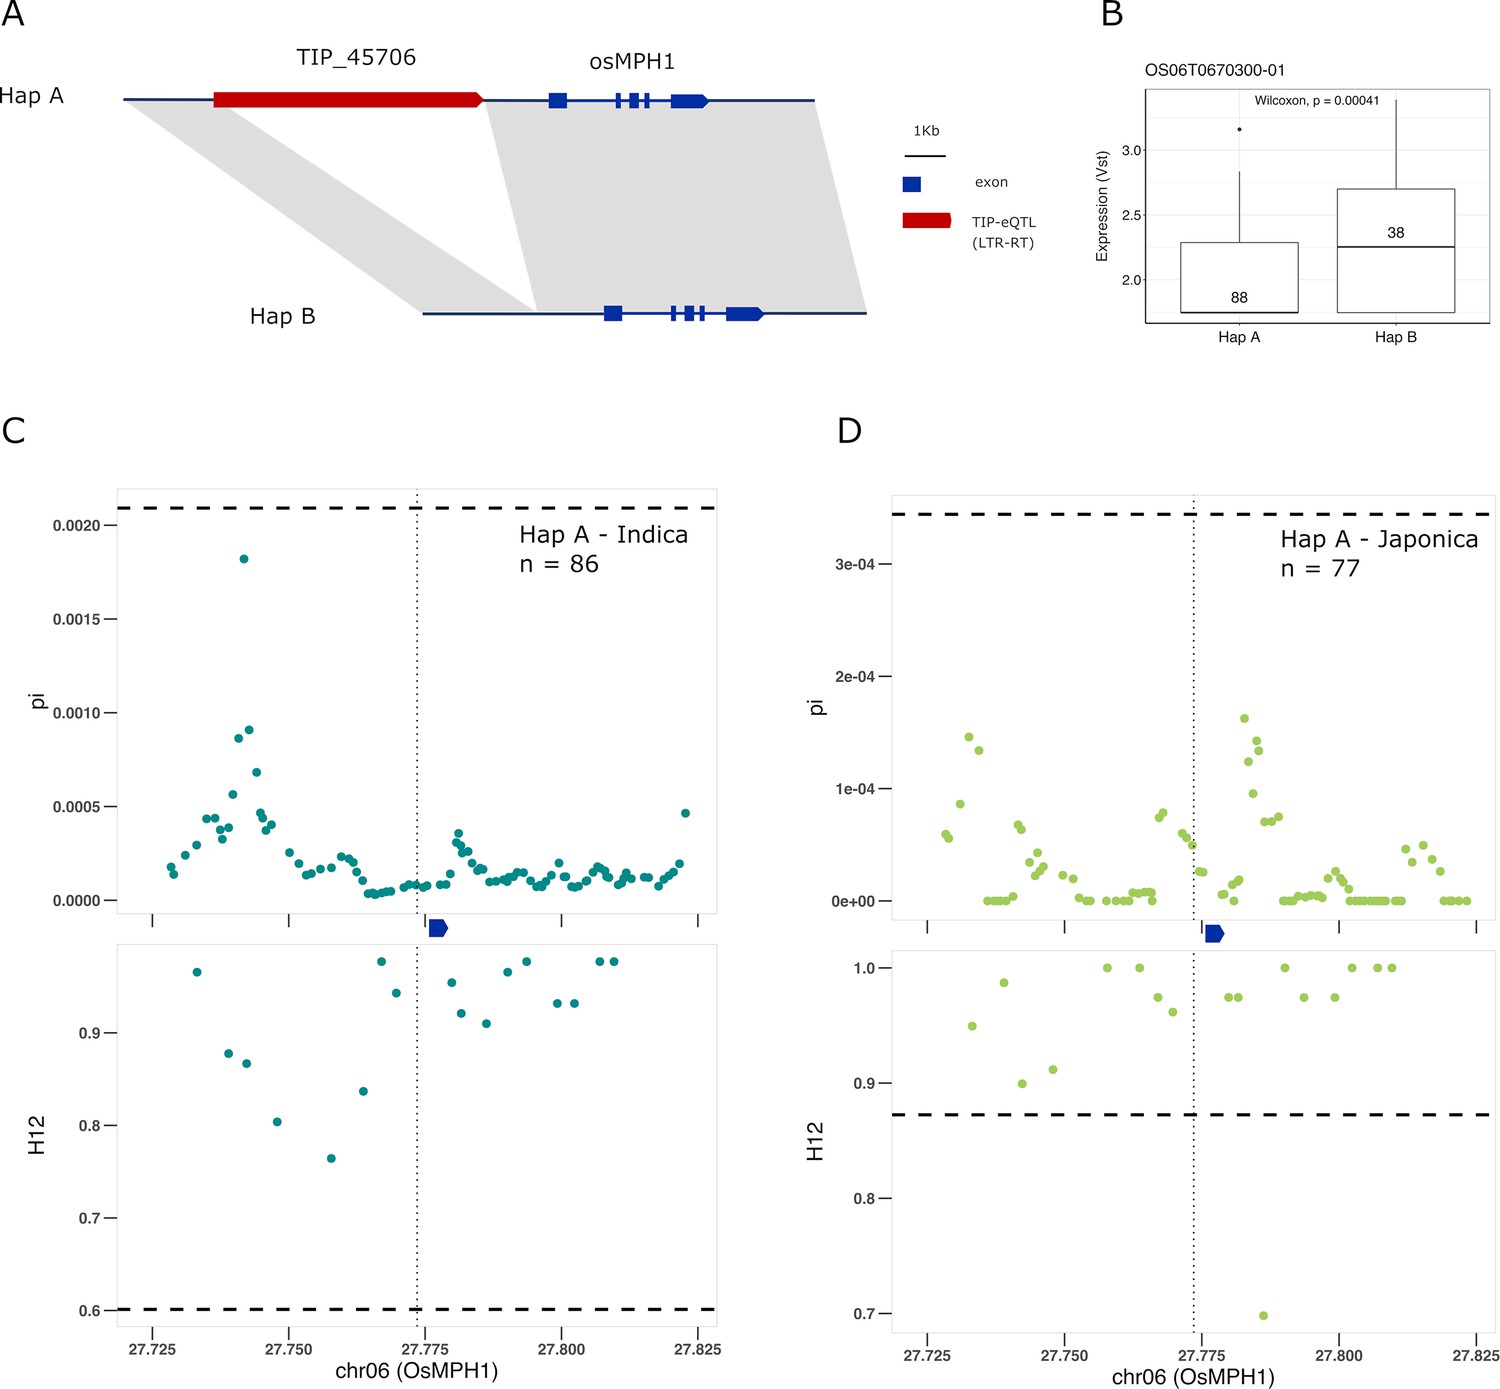
Selection on transposon insertion polymorphism (TIP)-expression quantitative trait loci (eQTLs) associated with OsMPH1 expression.
Representation of the two main OsMPH1 haplotypes present in rice and rufipogon/nivara populations identified in the rice super-pangenome. Conserved nucleotide regions are connected by gray marks. Structural variants longer than 50 bp are shown as white spaces. TIP-eQTLs are shown as red boxes. (B) Boxplot representation of the expression of the two OsMPH1 haplotypes in the japonica population. Numbers inside boxplots represent the number of accessions in each group. Analysis of nucleotide diversity (π) and diversity in haplotypes homozygosity tracts (H12) for Hap A in indica population (C) and in japonica population (D). The vertical dotted black line shows the position of the TIP insertion. The OsMPH1 gene, which is schematically shown in blue. The horizontal dashed black line represents the mean of 1000 random permutation pulls (for p-value see Supplementary file 6).
Discussion
Transposons are a major source of genome variability, and are known to affect gene expression in numerous ways. The importance of rare variants and unfixed TE insertions for gene expression variation in humans (Goubert et al., 2020) and plants (Uzunović et al., 2019) has already been recently described. A recent pangenome analysis in tomato has shown that the phenotypic variation of important crop traits is linked to structural variants present in the species, which are associated to subtle changes of transcription of genes involved in signal transduction. Many of these SV-eQTLs are likely TIPs, and some lead to phenotypic consequences such as the jointless trait caused by a transposon insertion, which allows complete separation of fruits from other floral parts (Alonge et al., 2020). In the present study we evaluated the importance of TIP-related expression variability in the recent evolution of rice. To this end we performed a TIP-eQTL mapping using expression data from rice varieties from the O. sativa ssp. indica and O. sativa ssp. japonica subspecies. We show here that using TIPs in addition to SNPs as genetic information allows the uncovering of additional genomic associations to changes in gene expression, and that when both TIPs and SNPs are both associated, TIPs often explain more of the variance in expression. This is in line with recent reports that have also used TIPs for GWAS with different phenotypes in tomato and rice (Domínguez et al., 2020; Castanera et al., 2021), and suggests that, even if some of the TIPs described here are probably just linked to the causal mutation of the phenotype (i.e., an SNP or a different type of SV), they may be more frequently the causal mutation themselves as compared with SNPs. The concentration of TIP-eQTLs in upstream regions of genes, where most transcriptional regulatory elements usually reside, also suggest that a high fraction of the TIP-eQTLs here described are the actual mutation underlying gene expression variation.
The close association of some TEs with genes could also partially explain the frequent association of more than one TIP with changes of expression of particular genes. Indeed, among the 718 genes with TIP-eQTLs described here, 18% have two or more TIPs associated with changes of expression. Interestingly, among the 30 genes with TIPs in indica and japonica that have the highest PBS – an indicator of strong differential selection – 43% have more than one TIP-eQTL. This suggests that TIPs are an important source of gene expression variability in rice, in particular in genes that may have been strongly selected during its recent evolution. In some cases, the different TIPs linked to a gene are associated with opposite effects on its expression and are present in different haplotypes. In these instances, as shown for the OsJAZ1 and OsGAP genes, the two haplotypes have strong signs of selection, although one positively and the other negatively, which suggests that both TE insertions may have played a role in the diversification of rice subspecies.
The results presented here show that most TIPs associated with variation of gene expression in indica and/or japonica are relatively old insertions that are also present in rufipogon/nivara, the wild ancestors of rice. This is in line with recent data showing that a high number of the structural variants associated with changes of expression in tomato were already present in its wild ancestor (Alonge et al., 2020) and highlights the importance of the standing variation, already present in the wild ancestors, for crop adaptation. It is assumed that most TE insertions are selectively neutral or slightly deleterious (Arkhipova, 2018), and the presence of TIPs associated with expression variation of genes in the wild ancestors of rice, suggests that this variation can be well tolerated in wild rice. Interestingly, we show here that many of these TIPs have been positive or negative selected in rice populations, which shows that they translate into selectable phenotypic differences in the agroecological conditions of cultivated rice. Indeed, we show examples of selected variants with modified expression of genes known to be linked to important traits that were targets of selection. It has been already proposed that a major fraction of the mutations linked to crop domestication and breeding are associated with changes of gene expression involved in signal transduction (Swinnen et al., 2016; Meyer and Purugganan, 2013). Here, we show that specific expression variants of genes involved in signal transduction have been differentially selected in indica and japonica rice populations. In addition, our results also point to TEs as a major driver of gene expression variation selected during crop adaptation and breeding.
Methods
TIP detection
Resequencing data for 126 indica and 82 japonica rice accessions were obtained from Groen et al., 2020 (Bioproject accessions PRJNA557122, PRJNA422249, and PRJEB6180). BBDuK (https://sourceforge.net/projects/bbmap/) was used for adaptor and quality trimming. Clean reads were aligned to the Nipponbare reference genome (Matsumoto et al., 2005) using BWA (Li and Durbin, 2010). PoPoolationTE2 (Kofler et al., 2016) was used to detect TIPs in the mode ‘joint’ using Nipponbare TE annotation described by Ou et al., 2019. TIPs with a zygosity lower than 0.25 in all samples were excluded to avoid false positives. TIPs were further filtered using the parameters –-min-count 5, --max-otherte-count 2, --max-structvar-count 2, and only those having MAF higher than 3% and no missing data were kept. Finally, the TIP matrix was transformed to binary form using zygosity cutoff of 0.05 to define an insertion as present.
Evaluation of TIP-calling performance in our dataset
Resequencing data from 48 indica rice accessions randomly sampled from our dataset were used to identify TIPs with the objective of evaluating the performance of TIP calling. MH63 was included among these accessions. This variety has a chromosome-level assembly as well as short-read resequencing data publicly available. MH63 sequencing short reads were obtained from NCBI SRA accession SRX1639978 and subsampled to 15× to match the mean coverage of the full dataset. TIP detection was carried out using Nipponbare genome as reference, and the ‘joint’ mode of PopoolationTE2, with the parameters described in the Methods section. We used RepeatMasker to annotate TEs in these MH63 assembled regions, and used the annotated TEs to benchmark precision and sensitivity of the TIP calls, according to the following formulas:
True positives (TP) were TIPs detected by PopoolationTE2 that could be detected in the MH63 orthologous region by RepeatMasker. False positives were TIPs detected by PopoolationTE2 that had no TE of the same family annotated by RepeatMasker in the corresponding region of MH63. False negatives (FN) were cases when the TIP prediction of MH63 was an absence, but the assembled region contained the TE detected by RepeatMasker.
TIP- and SNP-eQTL mapping
Transcriptome data for the 208 rice accessions (wet and drought stress conditions; three independent replicates per condition) were obtained from Groen et al., 2020 and separated into individual replicate matrices. Transcripts expressed in more than 10% of the samples on each replicate were extracted and counts were normalized using the vst function of DESeq2 (Love et al., 2014). TIP- and SNP-eQTL mapping were performed using Matrix eQTL software (Shabalin, 2012), applying the simple linear regression model and including subpopulation groups as covariates. We used a cutoff distance of 5000 bp to identify cis-eQTLs and a 5% FDR threshold for multiple testing corrections.
Selection analyses
For the PBS analysis, we looked for the presence of rice TIPs in the 82 accessions belonging to the rufipogon/nivara population (Supplementary file 4) and retained only those present in the three populations (indica, japonica, and rufipogon/nivara), resulting in a matrix of 13,622 TIPs and 288 accessions. The TIP matrix was filtered to remove TIPs with more than 5% missing data, or with MAF <5%. The remaining missing data (1.7%) were imputed using the ‘wright’ algorithm implemented in SNPready. The clean matrix (11,698) was used to calculate the individual PBS values per TIP, following the formulas described in Yi et al., 2010.
Along with PBS, to evaluate whether TIP-eQTLs show signs of selection, we estimated nucleotide diversity (π; Nei and Li, 1979), which is a site-frequency spectrum measure to test for the presence of selection. This was done using a custom script ( Gupta, 2023) in a window of 25 SNPs with a sliding window of 5. Further, we also estimated the H12 homozygosity statistic (Garud and Rosenberg, 2015) that can detect the presence of both hard and soft sweeps associated with selection. Since we expect long runs of homozygosity in the regions around the selected loci, H12 was calculated in windows of 50 SNPs, with a sliding window of 25. Both these statistics were estimated separately for indica and japonica, and for the samples with TIP insertions present and absent. This was for a range of 100 kb (50 kb up- and downstream the TIP insertion), using SNPs identified from Groen et al., 2020 but without the 1000 bp linkage thinning. To test for the significance of the statistics, we performed a permutation test (N = 1000) with random sampling with the same number of individuals that were used to estimate the selection statistics. The statistics were estimated for these 1000 random pulls in the same regions, and using the same window sizes as the original statistics.
Data availability
Resequencing data are available at SRA Bioproject accessions PRJNA557122, PRJNA422249 and PRJEB6180. Original expression dataset is available at Zenodo (doi: https://doi.org/10.5281/zenodo.3533431). Filtered expression dataset, TIP and SNP matrices and code to reproduce the analyses are available at Zenodo (doi:https://doi.org/10.5281/zenodo.7646220) and github (https://github.com/gsonal802/TIPeQTL_Selection_Osativa, Gupta, 2023).
-
ZenodoTransposons are a major contributor to gene expression variability under selection in rice populations.https://doi.org/10.5281/zenodo.7646220
-
ZenodoProcessed RNA expression count data from Groen et al.: The strength and pattern of natural selection on rice gene expression.https://doi.org/10.5281/zenodo.3533431
-
NCBI BioProjectID PRJNA557122. Population genome sequencing of Asian rice Oryza sativa varities.
-
NCBI BioProjectID PRJNA422249. Oryza sativa (Asian cultivated rice).
References
-
Cultivar differences in the number of differentiated Spikelets and percentage of degenerated Spikelets as determinants of the Spikelet number per Panicle in relation to dry matter production and nitrogen absorptionSoil Science and Plant Nutrition 49:433–444.https://doi.org/10.1080/00380768.2003.10410029
-
Neutral theory, Transposable elements, and Eukaryotic genome evolutionMolecular Biology and Evolution 35:1332–1337.https://doi.org/10.1093/molbev/msy083
-
Jasmonic acid regulates Spikelet development in riceNature Communications 5:3476.https://doi.org/10.1038/ncomms4476
-
The amplification Dynamics of mites and their impact on rice trait variabilityThe Plant Journal: For Cell and Molecular Biology 107:118–135.https://doi.org/10.1111/tpj.15277
-
The rice paradox: multiple origins but single Domestication in Asian riceMolecular Biology and Evolution 34:969–979.https://doi.org/10.1093/molbev/msx049
-
The impact of Transposable elements on tomato diversityNature Communications 11:4058.https://doi.org/10.1038/s41467-020-17874-2
-
Enhancing the mathematical properties of new haplotype Homozygosity statistics for the detection of selective sweepsTheoretical Population Biology 102:94–101.https://doi.org/10.1016/j.tpb.2015.04.001
-
Contribution of unfixed Transposable element insertions to human regulatory variationPhilosophical Transactions of the Royal Society of London. Series B, Biological Sciences 375:20190331.https://doi.org/10.1098/rstb.2019.0331
-
SoftwareTipeqtl_Selection_Osativa, version swh:1:rev:39095ffca577715416adc077cba3e540d2f4aba0Software Heritage.
-
Popoolationte2: comparative population Genomics of Transposable elements using pool-SeqMolecular Biology and Evolution 33:2759–2764.https://doi.org/10.1093/molbev/msw137
-
How important are Transposons for plant evolution?Nature Reviews. Genetics 14:49–61.https://doi.org/10.1038/nrg3374
-
Deleterious mutations and the rare allele burden on rice gene expressionMolecular Biology and Evolution 39:msac193.https://doi.org/10.1093/molbev/msac193
-
Evolution of crop species: Genetics of Domestication and diversificationNature Reviews. Genetics 14:840–852.https://doi.org/10.1038/nrg3605
-
A super Pan-Genomic landscape of riceCell Research 32:878–896.https://doi.org/10.1038/s41422-022-00685-z
-
Lessons from Domestication: targeting cis-regulatory elements for crop improvementTrends in Plant Science 21:506–515.https://doi.org/10.1016/j.tplants.2016.01.014
-
A triptych of the evolution of plant Transposable elementsTrends in Plant Science 15:471–478.https://doi.org/10.1016/j.tplants.2010.05.003
-
Transposable elements are important contributors to standing variation in gene expression in Capsella GrandifloraMolecular Biology and Evolution 36:1734–1745.https://doi.org/10.1093/molbev/msz098
-
Transposable element Polymorphisms improve prediction of complex Agronomic traits in riceTAG. Theoretical and Applied Genetics. Theoretische Und Angewandte Genetik 135:3211–3222.https://doi.org/10.1007/s00122-022-04180-2
-
Transposon-induced methylation of the Rsmyb1 promoter Disturbs Anthocyanin accumulation in red-fleshed radishJournal of Experimental Botany 71:2537–2550.https://doi.org/10.1093/jxb/eraa010
-
Evolution of plant genome architectureGenome Biology 17:37.https://doi.org/10.1186/s13059-016-0908-1
-
A unified classification system for Eukaryotic Transposable elementsNature Reviews. Genetics 8:973–982.https://doi.org/10.1038/nrg2165
-
Control of rice pre-harvest sprouting by Glutaredoxin-mediated Abscisic acid signalingThe Plant Journal 100:1036–1051.https://doi.org/10.1111/tpj.14501
Article and author information
Author details
Funding
Ministerio de Ciencia e Innovación (PhD Student Fellowship. PRE2020-095111)
- Noemia Morales-Díaz
Ministerio de Ciencia e Innovación (Postdoctoral Fellowship. IJC2020-045949-I)
- Raúl Castanera
Ministerio de Ciencia e Innovación (PID2019-106374RB-I00)
- Josep M Casacuberta
Severo Ochoa Programme for Centres of Excellence in R&D (SEV-2015-0533)
- Josep M Casacuberta
Ministerio de Ciencia e Innovación and CERCA Program / Generalitat de Catalunya (CEX2019-000902-S)
- Josep M Casacuberta
National Science Foundation (IOS-1546218)
- Michael Purugganan
National Science Foundation (IOS-2204374)
- Michael Purugganan
Zegar Family Foundation
- Michael Purugganan
NYU Abu Dhabi Research Institute
- Michael Purugganan
The funders had no role in study design, data collection, and interpretation, or the decision to submit the work for publication.
Acknowledgements
We thank Jae Yong Choi, Simon C Groen, and Sebastián Ramos-Onsins for helpful discussions.
Version history
- Preprint posted:
- Received:
- Sent for peer review:
- Reviewed Preprint version 1:
- Reviewed Preprint version 2:
- Version of Record published:
Cite all versions
You can cite all versions using the DOI https://doi.org/10.7554/eLife.86324. This DOI represents all versions, and will always resolve to the latest one.
Copyright
© 2023, Castanera et al.
This article is distributed under the terms of the Creative Commons Attribution License, which permits unrestricted use and redistribution provided that the original author and source are credited.
Metrics
-
- 2,975
- views
-
- 288
- downloads
-
- 40
- citations
Views, downloads and citations are aggregated across all versions of this paper published by eLife.
Citations by DOI
-
- 10
- citations for umbrella DOI https://doi.org/10.7554/eLife.86324
-
- 30
- citations for Version of Record https://doi.org/10.7554/eLife.86324.3
Download links
A two-part list of links to download the article, or parts of the article, in various formats.
Downloads (link to download the article as PDF)
Open citations (links to open the citations from this article in various online reference manager services)
Cite this article (links to download the citations from this article in formats compatible with various reference manager tools)
Transposons are important contributors to gene expression variability under selection in rice populations
eLife 12:RP86324.
https://doi.org/10.7554/eLife.86324.3


