Nicotinic acetylcholine receptor signaling maintains epithelial barrier integrity
- Regenerative Medicine, Genentech, United States
- Human Genetics, Genentech, United States
- Center for Molecular Medicine, Cell Biology, University Medical Center Utrecht, Netherlands
- Huffington Center on Aging, Baylor College of Medicine, United States
- Department of Molecular and Human Genetics, Baylor College of Medicine, United States
- Drug Metabolism and Pharmacokinetics, Genentech, United States
Figures
Figure 1
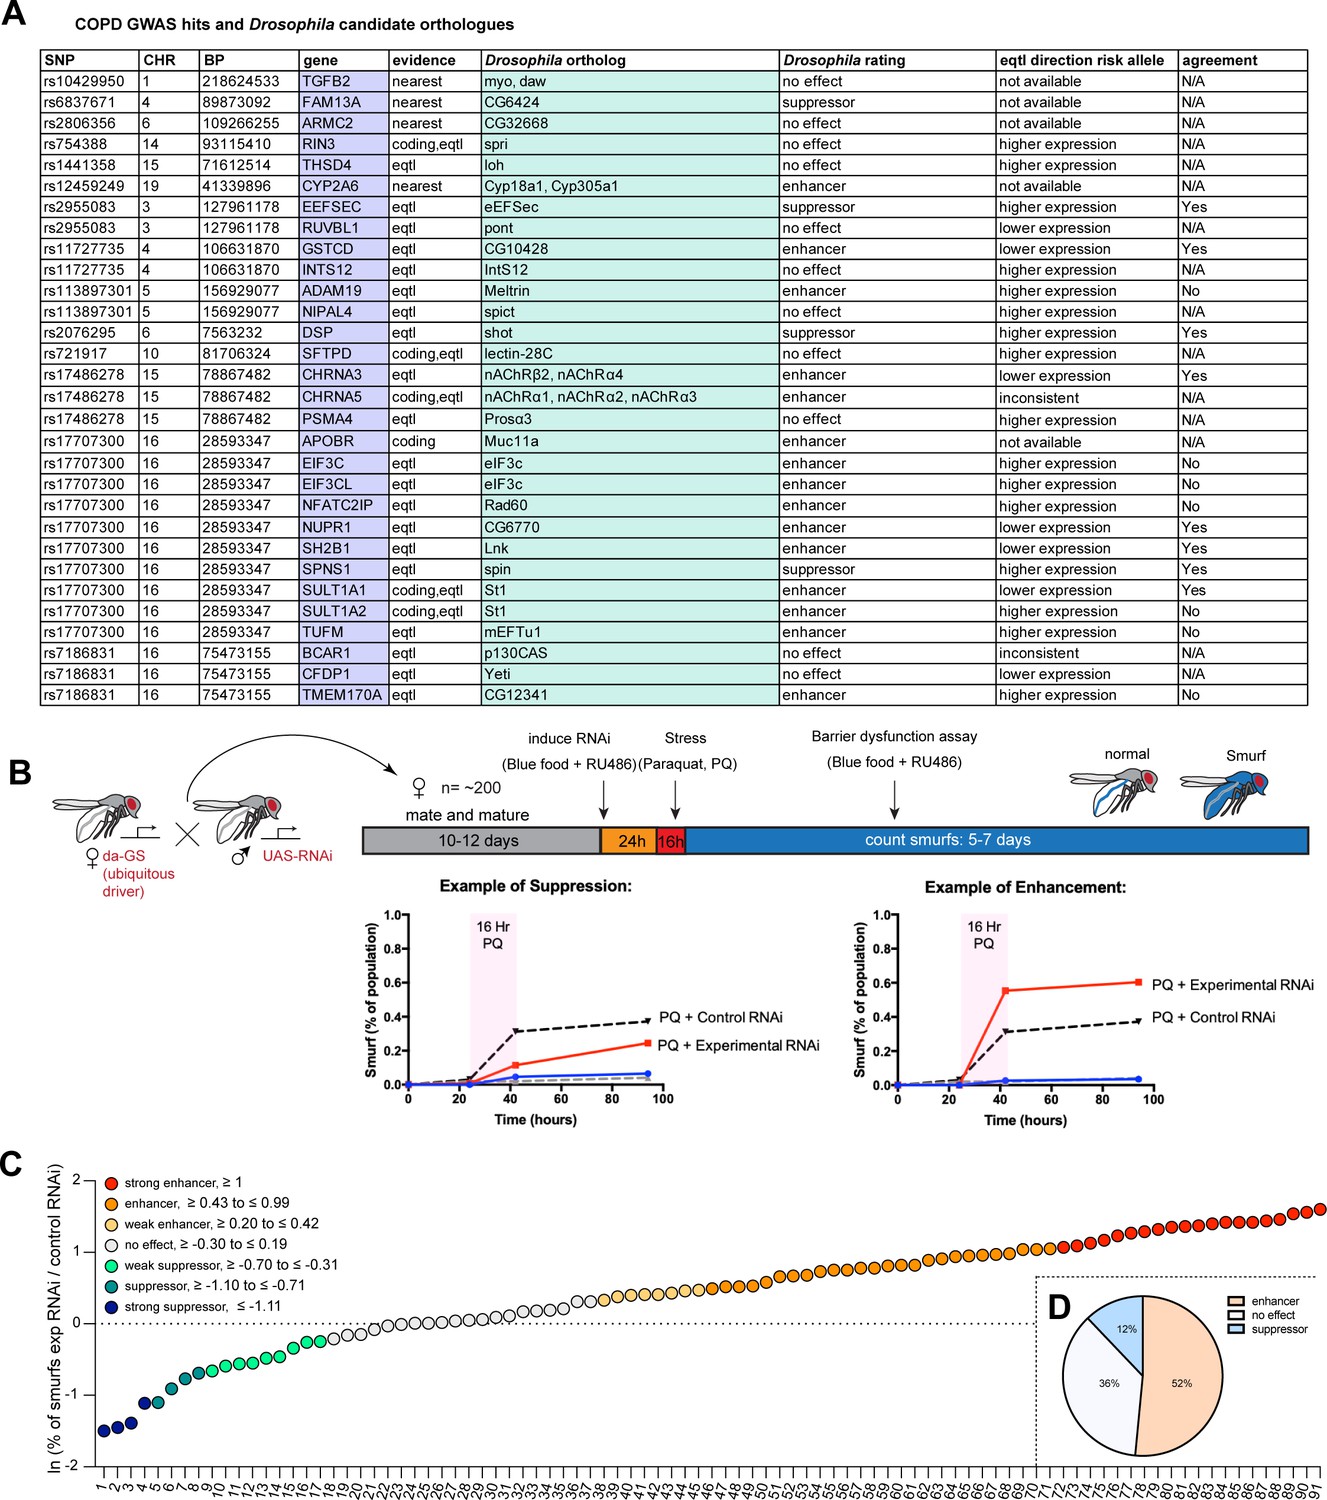
A Drosophila screen for chronic obstructive pulmonary disease (COPD)-associated candidate genes.
(A) List of human candidate genes for genetic loci associated with COPD risk and their Drosophila orthologs. An overall rating was assigned to the Drosophila genes based on the detailed results of the individual RNA interference (RNAi) lines included in the screen: Genes exacerbating barrier dysfunction upon depletion were categorized as enhancers, while genes whose depletion improved barrier function were rated as suppressors of barrier dysfunction (Supplementary file 2). When available, the human risk allele expression data is compared to the results of the Drosophila screen (agreement column) (SNP, single nucleotide polymorphism; CHR, chromosome; BP, base pair number; eQTL, expression quantitative trait loci). (B) Experimental design of intestinal barrier function screen. Flies carrying the ubiquitous driver da-GeneSwitch (da-GS) were crossed to RNAi lines targeting candidate genes. The female offspring were aged for 10–12 days before induction of RNAi expression by RU486 for 24 hr on blue food. Flies were challenged with sucrose alone (mock) or 25 mM Paraquat (PQ) for 16 hr overnight and then placed back on blue food with RU486. Blue flies with a defective intestinal barrier (‘smurfs’) were counted daily for 5–7 days. (C) Ranking of screened RNAi lines based on the natural logarithm (ln) of the ratio between the proportion of smurfs after candidate gene knockdown and Luciferase RNAi control. Each number corresponds to an RNAi line listed in Supplementary file 2. Cutoffs for the different categories are indicated. (D) Summary of screen results based on broad categorization as enhancer, suppressor, or no effect. If several RNAi lines targeting the same gene unanimously had no effect, the gene was rated ‘no effect, conclusive’, while inconsistent results were rated ‘no effect, inconclusive’. For details, see Supplementary file 2.
-
Figure 1—source data 1
Editable table of Figure 1A.
- https://cdn.elifesciences.org/articles/86381/elife-86381-fig1-data1-v2.xlsx
Figure 2 with 2 supplements
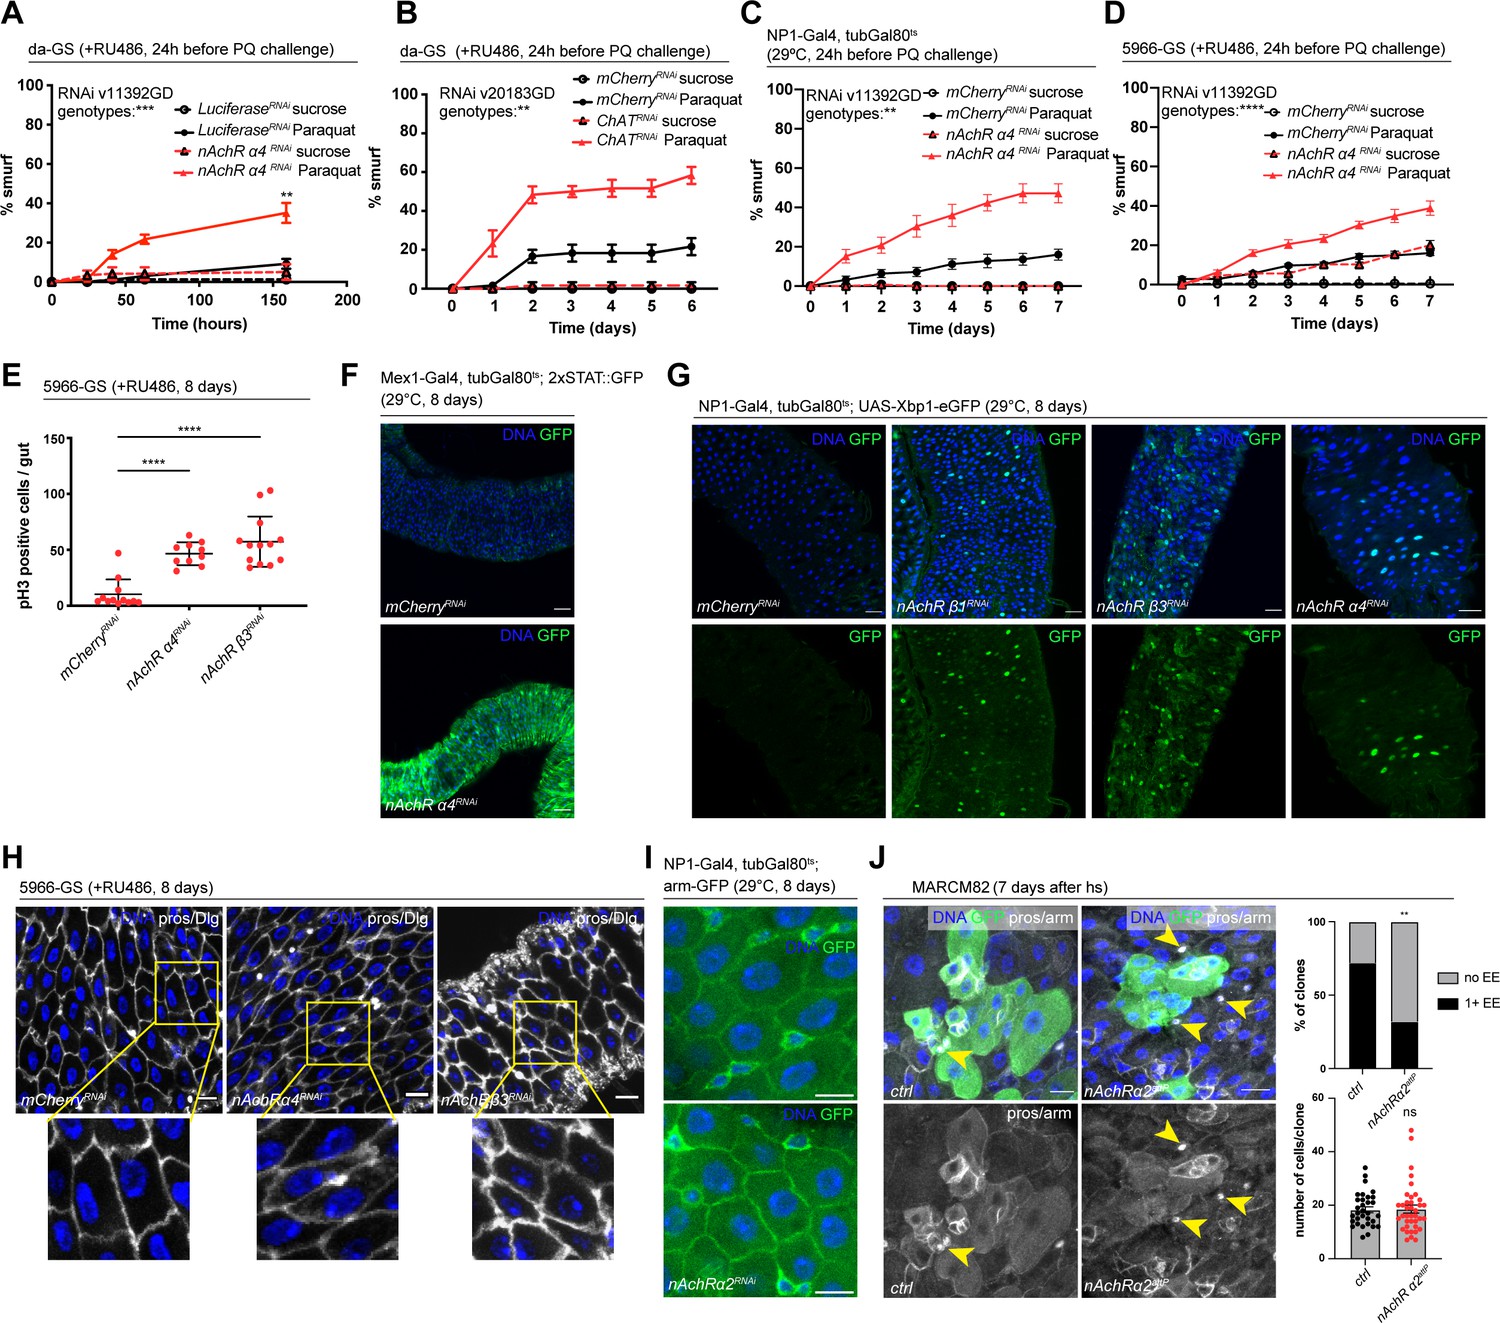
Nicotinic acetylcholine receptor (nAchR) genes are required for barrier function in enterocytes (ECs) and enteroendocrine (EEs) cell differentiation.
(A) Barrier dysfunction assay after Luciferase (control) or nAchR α4 subunit depletion for 24 hr with ubiquitous driver da-GeneSwitch (da-GS). nAchR α4: n=100 for Luciferase RNAi (control) on sucrose; n=125 animals for Luciferase RNAi on sucrose + Paraquat; n=150 for nAchR α4 RNAi on sucrose; n=175 animals for nAchR α4 on sucrose + Paraquat. Paraquat concentration 25 mM. N=1. Two-way repeated measures (RM) ANOVA (significance stated next to ‘genotypes’). (B) Barrier dysfunction assay after mCherry (control) or choline acetyltransferase (ChAT) depletion for 24 hr with ubiquitous driver da-GS. n=75 animals per genotype and condition; N=3. Paraquat concentration 15 mM. Two-way RM ANOVA. (C) Barrier dysfunction assay after mCherry (control) or nAchR α4 depletion for 24 hr with EC-specific driver NP1-Gal4, tubGal80ts (NP1ts). n=125 animals per genotype and condition; N=3. Two-way RM ANOVA. (D) Barrier dysfunction assay after mCherry (control) or nAchR α4 depletion for 24 hr with EC and enteroblast-specific driver 5966-GS. n=175 animals per genotype and condition; N=3. Two-way RM ANOVA. (E) Quantification of intestinal stem cell (ISC) mitoses in guts depleted of nAchR β3 and α4 subunits in ECs for 8 days. Mitotically active ISCs are labeled with anti-pH3 antibody; n=12;10;13 guts for mCherry (control), nAchR α4 RNAi and nAchR β1 RNAi, respectively. N=3. Ordinary one-way ANOVA followed by Dunnett’s multiple comparisons test. (F) Confocal microscopy images of guts expressing a 2xSTAT::GFP reporter (green) depleted of mCherry (control) or nAchR α4 for 8 days in ECs with Mex-Gal4, tubGal80ts. n=10 guts per genotype. N=3. Scale bar 50 μm. (G) Confocal immunofluorescence image of posterior midguts expressing the UPR-reporter UAS-Xbp1-eGFP (green) after 8 days of nAchR subunit knockdown by RNAi. The EGFP tag is only in frame with the Xbp1(s) coding sequence after splicing using the unconventional splice site, which occurs under stress conditions. DNA (blue) is labeled with Hoechst. n=8 guts per genotype. N=3. Scale bar 25 μm. (H) Confocal immunofluorescence images examining epithelial organization of septate junctions stained with anti-Dlg antibody (white), DNA (blue) is labeled with Hoechst. Yellow boxed insets are shown enlarged in bottom row. n=8 guts per genotype. N=3. Scale bars 10 μm. (I) Confocal microscopy images of guts expressing GFP-tagged armadillo (arm-GFP, green) depleted of mCherry (control) or nAchR α4 for 8 days in ECs with NP1-Gal4, tubGal80ts. n=8 guts per genotype. N=3. Scale bar 10 μm. (J) Confocal immunofluorescence images of wildtype and nAchR α2 MARCM clones (green) 7 days after heat shock. Stem cells and enteroblasts are stained with anti-armadillo antibody (white); EEs are labeled with anti-prospero antibody (white, nuclear signal highlighted with yellow arrowheads) and DNA (blue) is labeled with Hoechst. Scale bars 15 μm. Quantification of EE numbers within clones: n=32;38 clones for wildtype or nAchR α2, respectively, from three pooled experiments. Fisher’s exact test. Quantification of cell numbers/clone: n=32;38 clones for wildtype or nAchR α2, respectively, from three pooled experiments. Unpaired two-tailed t-test. Data presented as mean ± SEM. ns, not significant, p>0.05; *p≤0.05; **p≤0.01; ***p≤0.001; ****p≤0.0001. n: number of animals or midguts analyzed; N: number of independent experiments performed with similar results and a similar n.
Figure 2—figure supplement 1

Ubiquitous nicotinic acetylcholine receptor (nAchR) signaling is required for barrier function.
(A) Barrier dysfunction assay using various RNAi background control lines or nicotinic acetylcholine receptor (nAchR) α4 (positive control) depletion for 24 hr with enterocyte-specific driver NP1-Gal4, tubGal80ts (NP1ts) before 15 mM Paraquat (PQ) exposure. n=75 animals per genotype and condition; N=2. Gray background panel highlights the Paraquat exposed controls. Analysis: comparing all control lines exposed to Paraquat to each other (not including nAchR α4). Two-way repeated measures (RM) ANOVA. Details for control lines: BL35785: Expresses dsRNA for RNAi of mCherry under UAS control in the VALIUM20 vector; attP2. BL31603: Expresses dsRNA for RNAi of Ppyr\LUC (FBgn0014448) under UAS control in the VALIUM1 vector; attP2. BL35789: Expresses firefly Luciferase under the control of UAS in the VALIUM1 vector; attP2. BL35788: Expresses firefly Luciferase under the control of UAS in the VALIUM10 vector. Can be used as a control for VALIUM10 or VALIUM20; attP2. BL35786: Expresses GFP under the control of UAS in the VALIUM10 vector. Can be used as a control for VALIUM10 or VALIUM20; attP2. BL36304: second chromosome attP docking site for phiC31 integrase-mediated transformation. Note that the attP40 docking site is located within Msp300 and it may disrupt gene function. BL36303: third chromosome attP docking site for phiC31 integrase-mediated transformation. (B) Barrier dysfunction assay after mCherry (control) or indicated nAchR subunit depletion for 24 hr with ubiquitous driver da-GeneSwitch (da-GS). N=1. Two-way RM ANOVA. nAchR α4 (v12441GD): n=100 for Luciferase RNAi (control) on sucrose; n=125 animals for Luciferase RNAi on sucrose + Paraquat; n=125 for nAchR α4 RNAi on sucrose; n=150 animals for nAchR α4 RNAi on sucrose + Paraquat. nAchR β2(v1200GD): n=100 for Luciferase RNAi (control) on sucrose; n=125 animals for Luciferase RNAi on sucrose + Paraquat; n=75 for nAchR β2 RNAi on sucrose; n=150 animals for nAchR β2 RNAi on sucrose + Paraquat. nAchR β2(v109450KK): n=100 for Luciferase RNAi (control) on sucrose; n=125 animals for Luciferase RNAi on sucrose + Paraquat; n=125 for nAchR β2 RNAi on sucrose; n=150 animals for nAchR β2 RNAi on sucrose + Paraquat. nAchR α2 (v1194GD): n=100 for Luciferase RNAi (control) on sucrose; n=125 animals for Luciferase RNAi on sucrose + Paraquat; n=125 for nAchR α2 RNAi on sucrose; n=150 animals for nAchR α2 RNAi on sucrose + Paraquat. nAchR α2 (v1195GD): n=100 for Luciferase RNAi (control) on sucrose; n=125 animals for Luciferase RNAi on sucrose + Paraquat; n=125 for nAchR α2 RNAi on sucrose; n=150 animals for nAchR α2 RNAi on sucrose + Paraquat. nAchR α2 (BL27493): n=100 for Luciferase RNAi (control) on sucrose; n=125 animals for Luciferase RNAi on sucrose + Paraquat; n=125 for nAchR α2 RNAi on sucrose; n=125 animals for nAchR α2 RNAi on sucrose + Paraquat. nAchR α1 (v1189GD): n=175 for Luciferase RNAi (control) on sucrose; n=175 animals for Luciferase RNAi on sucrose + Paraquat; n=175 for nAchR α1 RNAi on sucrose; n=175 animals for nAchR α1 RNAi on sucrose + Paraquat. nAchR α1 (v48159GD): n=150 for Luciferase RNAi (control) on sucrose; n=150 animals for Luciferase RNAi on sucrose + Paraquat; n=125 for nAchR α1 RNAi on sucrose; n=150 animals for nAchR α1 RNAi on sucrose + Paraquat. nAchR α1 (v48162GD): n=1075 for Luciferase RNAi (control) on sucrose; n=175 animals for Luciferase RNAi on sucrose + Paraquat; n=150 for nAchR α1 RNAi on sucrose; n=150 animals for nAchR α1 RNAi on sucrose + Paraquat. nAchR α3 (BL61225): n=100 for Luciferase RNAi (control) on sucrose; n=125 animals for Luciferase RNAi on sucrose + Paraquat; n=50 for nAchR α3 RNAi on sucrose; n=75 animals for nAchR α3 RNAi on sucrose + Paraquat. nAchR α3 (v101806KK): n=175 for Luciferase RNAi (control) on sucrose; n=175 animals for Luciferase RNAi on sucrose + Paraquat; n=175 for nAchR α3 RNAi on sucrose; n=175 animals for nAchR α3 RNAi on sucrose + Paraquat. nAchR β2: n=100 for Luciferase RNAi (control) on sucrose; n=125 animals for Luciferase RNAi on sucrose + Paraquat; n=75 for nAchR β2 RNAi on sucrose; n=100 animals for nAchR β2 RNAi on sucrose + Paraquat. (C) Barrier dysfunction assay after mCherry (control) or choline acetyltransferase (ChAT) depletion for 24 hr with ubiquitous driver da-GS. n=75 animals per genotype and condition; N=3. Two-way RM ANOVA. (D) Barrier dysfunction assay after mCherry (control) or nAchR β3 depletion for 24 hr with enterocyte-specific driver 5966-GS. Paraquat concentration 7.5 mM. nAchR β3: n=175 for mCherry RNAi (control) on sucrose; n=175 animals for mCherry RNAi on sucrose + Paraquat; n=150 for nAchR β3 RNAi on sucrose; n=150 animals for nAchR β3 RNAi on sucrose + Paraquat. N=3. Two-way ANOVA. (E) Barrier dysfunction assay after mCherry (control) or nAchR β3 depletion for 24 hr with enterocyte-specific driver NP1-Gal4, tubGal80ts (NP1ts). Paraquat concentration 7.5 mM. n=200 animals per genotype and condition; N=3. Two-way RM ANOVA.
Figure 2—figure supplement 2

nAchR signaling in ISCs and ECs promotes barrier function independently of junctional integrity.
(A) Confocal immunofluorescence images depicting side views of guts depleted of indicated nicotinic acetylcholine receptor (nAchR) subunits in enterocytes (ECs) for 8 days with 5966-GS. Septate junctions are stained with anti-Coracle or anti-Dlg antibody (white), DNA (blue) is labeled with Hoechst, cell outline is visualized with phalloidin staining of actin (red). Scale bars 5 μm. (B) Barrier dysfunction (smurf) assay after Paraquat challenge following depletion of nAchR subunits specifically in stem cells with esg-Gal4, UAS-2xEYFP; Su(H)GBE-Gal80, tubGal80ts (ISCts). n=75 animals per genotype and conditions, except for nAchR β1, where n=50 animals per condition. N=2. Two-way repeated measures (RM) ANOVA. (C) Survival after Pseudomonas entomophila (PE) infection following depletion of nAchR subunits in intestinal stem cells. n=75 animals per genotype and condition, N=2. Log rank (Mantel-Cox) test. (D) Quantification of ISC mitoses in guts depleted of nAchR subunits in ECs for 3 days before 16 hr of PE infection. Mitotically active ISCs are labeled with anti-pH3 antibody. n=8 guts per genotype, N=2. Ordinary one-way ANOVA followed by Dunnett’s multiple comparisons test. (E) Quantification of enteroendocrine cell (EE) number and total cell numbers in nAchR α1 MARCM clones 7 days after heat shock. EE numbers: n=22 clones for control and n=13 clones for nAchR α1; two independent pooled experiments are shown. Fischer’s exact test. Total cell numbers per clone: n=22 clones for control and n=13 clones for nAchR α1; two independent pooled experiments are shown. Unpaired two-tailed t-test. (F) Confocal immunofluorescence images of esg-Gal4, UAS-GFP, tubGal80ts; UAS-Flp, Actin>CD2>Gal4 (esgF/O) clones (green) after 8 days of mCherryRNAi, w1118 (controls) or nAchR α2RNAi at 29°C. Stem cells are stained with anti-Delta antibody (white); EEs are labeled with anti-prospero antibody (white) and DNA (blue) is labeled with Hoechst. Scale bars 5 μm. Quantification of EE numbers and total cell numbers within clones after 8 days at 29°C: n=26 clones for mCherryRNAi, n=17 clones for w1118; n=30 clones for nAchR α2RNAi, n=15 clones for nAchR β3RNAi, n=14 clones for nAchR α4RNAi from two independent pooled experiments. Chi square test for EE numbers, one-way ANOVA with Dunnett’s multiple comparisons test for total cell numbers. Data presented as mean ± SEM. ns, not significant, p>0.05; *p≤0.05; **p≤0.01; ***p≤0.001; ****p≤0.0001. n: number of animals or midguts analyzed; N: number of independent experiments performed with similar results and a similar n.
Figure 3 with 3 supplements
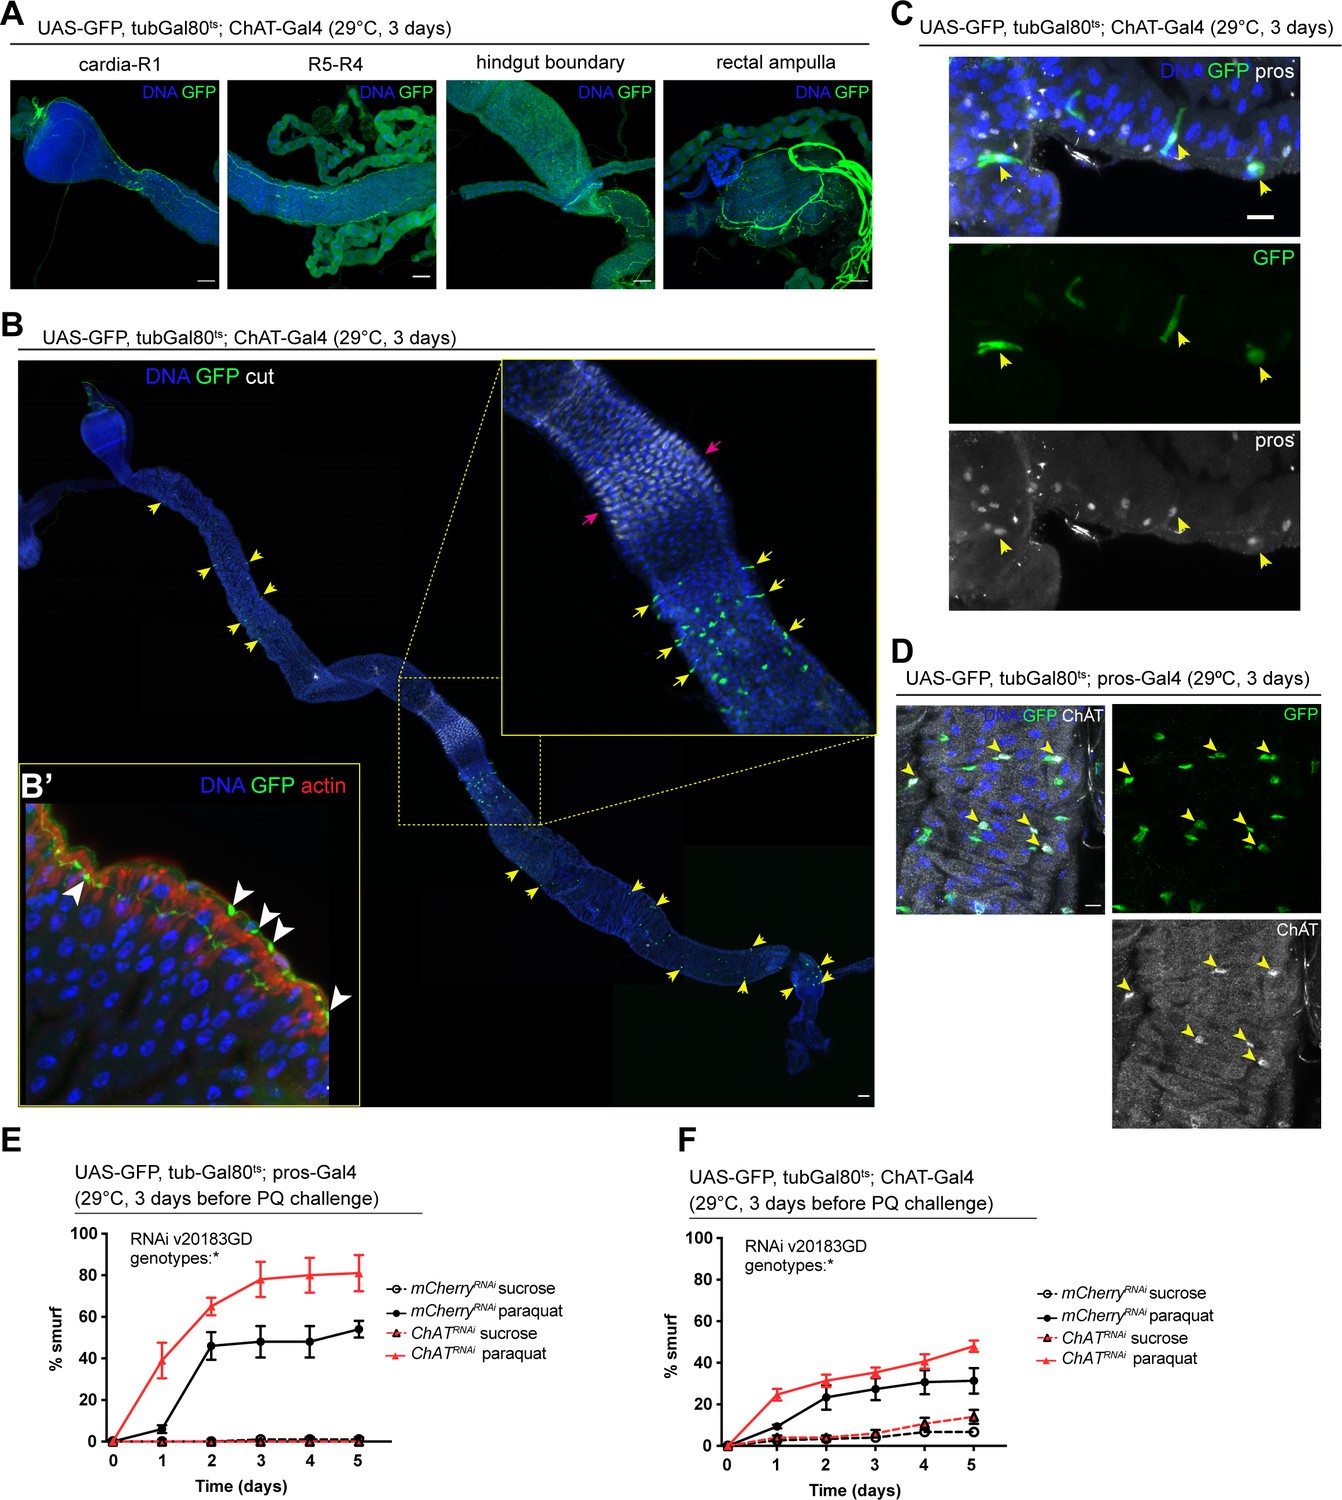
Acetylcholine produced in enteroendocrine cells (EEs) and/or neurons promotes barrier function.
(A) Confocal immunofluorescence image of cholinergic innervation of different intestinal compartments. GFP (green) expression is driven by Mi{Trojan-GAL4.0}ChAT[MI04508-TG4.0] CG7715[MI04508-TG4.0-X] and detected in the anterior (cardia/R1) as well as posterior midgut (R4–R5), at the hindgut boundary and rectal ampulla. DNA (blue) is labeled with Hoechst. n=5 guts. N=3. Scale bars 50 μm. (B) Stitched confocal immunofluorescence images of a gut expressing GFP (green) under control of Mi{Trojan-GAL4.0}ChAT[MI04508-TG4.0] CG7715[MI04508-TG4.0-X], stained with anti-cut antibody (white). Yellow arrows indicate GFP-positive cells. Enlarged insert shows GFP-positive cells adjacent to the gastric region labeled with cut (pink arrows). DNA (blue) is labeled with Hoechst. n=5 guts. N=3. Scale bar 50 μm. (B’) Confocal image of a gut expressing GFP (green) under control of Mi{Trojan-GAL4.0}ChAT[MI04508-TG4.0] CG7715[MI04508-TG4.0-X], stained with Phalloidin (red). Transverse section of the epithelium is shown revealing inter-epithelial axons from ChAT+ neurons. White arrowheads highlight axonal boutons. n=5 guts. N=3. (C) Fluorescent immunohistochemistry image of posterior midgut expressing GFP (green) under the control of Mi{Trojan-GAL4.0}ChAT[MI04508-TG4.0] CG7715[MI04508-TG4.0-X], stained with anti-prospero antibody (white). Arrows indicate GFP-positive cells that also label for pros. DNA (blue) is labeled with Hoechst. n=8 guts. N=3. Scale bar 10 μm. (D) Confocal immunofluorescence image of ChAT antibody staining of the posterior midgut. EEs are expressing GFP (green) driven by pros-Gal4, yellow arrows indicate the overlap between ChAT staining (white) and pros-positive cells. DNA (blue) is labeled with Hoechst. n=8 guts. N=3. Scale bar 10 μm. (E) Barrier dysfunction assay after mCherry (control) or ChAT knockdown in EEs for 3 days with prospero-Gal4. n=100 animals per genotype and condition; N=3. Two-way repeated measures (RM) ANOVA. (F) Barrier dysfunction assay after mCherry (control) or ChAT knockdown with Mi{Trojan-GAL4.0}ChAT[MI04508-TG4.0] CG7715[MI04508-TG4.0-X] for 3 days. n=120 animals per genotype and condition; N=3. Two-way RM ANOVA. Data presented as mean ± SEM. ns, not significant, p>0.05; *p≤0.05; **p≤0.01; ***p≤0.001; ****p≤0.0001. n: number of animals or midguts analyzed; N: number of independent experiments performed with similar results and a similar n.
Figure 3—figure supplement 1

ChAT is expressed in enteric neurons and a subset of EEs.
(A) Stitched confocal immunofluorescence overview as well as detail images of guts expressing GFP (green) under control of TI{2A-GAL4}ChAT[2A-GAL4]. GFP expression is detected a subset of pros-positive cells (yellow arrowheads, pink arrowheads indicate GFP-negative enteroendocrine cells [EEs]) in the anterior (R1–R2) and posterior midgut (R4-R5), as well as in enteric neurons innervating the cardia (yellow arrowheads). DNA (blue) is labeled with Hoechst. n=5 guts. N=3. Scale bar 100 μm (stitched overview) and 25 μm, respectively. (B) Confocal image of a gut expressing GFP (green) under control of Mi{Trojan-GAL4.0}ChAT[MI04508-TG4.0] CG7715[MI04508-TG4.0-X], stained with anti-ChAT antibody. Yellow arrowheads highlight GFP-positive cells positive for ChAT staining, while pink arrowheads highlight GFP-negative cells staining positive for ChAT antibody. DNA (blue) is labeled with Hoechst. n=5 guts. N=3. Scale bar 10 μm. (C) Quantification of EE numbers after depletion of nicotinic acetylcholine receptor (nAchR) subunits in enterocytes (ECs) with 5966-GS for 8 days. Two independent pooled experiments are shown. n=20 guts for mCherry RNAi, n=18 for w1118, n=14 for nAchR β1 RNAi, n=14 for nAchR α2 RNAi, n=20 for nAchR β3 RNAi, n=16 for nAchR α4 RNAi. One-way ANOVA followed by Dunnett’s multiple comparisons test. (D) Confocal immunofluorescence images of guts expressing GFP (green) under control of pros-Gal4. Yellow arrowheads highlight enteric innervation in different parts of the organ. DNA (blue) is labeled with Hoechst. n=5 guts. N=3. Scale bar 100 μm (stitched overview) and 25 μm, respectively. Data presented as mean ± SEM. ns, not significant, p>0.05; *p≤0.05; **p≤0.01; ***p≤0.001; ****p≤0.0001. n: number of animals or midguts analyzed; N: number of independent experiments performed with similar results and a similar n.
Figure 3—figure supplement 2

Testing of EE-specific drivers identified from scRNA data and literature.
(A) Identification of enteroendocrine cell (EE)-specific drivers without neuronal expression: First, we compiled top EE markers from FlyCellAtlas (FCA) data (Li et al., 2016, panel 1). We then compared their expression in EEs (Guo et al., 2019) and neurons (FCA body data set, panel 2) to identify candidate genes that had low neuronal, but high EE expression (panels 3, 4, 5). Orcokinin-Gal4 was the only candidate gene with an available Gal4 line, however, while neuronal expression is low (panel 6, yellow arrowheads), the driver is not entirely EE specific, but also sporadically labels enterocytes (ECs) (pink arrows). CG32547-Gal4, an EE-specific driver used by Guo et al., 2019, also drives enteric neuronal expression of GFP (panel 6, yellow arrowheads). DNA (blue) is labeled with Hoechst. n=5 guts. N=3.Scale bars 25 μm. (B) Drivers selected based on table from Chen et al., 2016, and additional literature (Beebe et al., 2015) as well as low expression in the adult brain (adult brain scRNAseq data; Davie et al., 2018), crossed to UAS-GFP. Dimm displays neuronal expression and is not EE specific, other drivers didn’t yield any expression in the epithelium. DNA (blue) is labeled with Hoechst, EEs are labeled with prospero staining (white). n=5 guts. N=2. Scale bars 25 μm.
-
Figure 3—figure supplement 2—source data 1
Editable table of Figure 3—figure supplement 2A1, showing genes highly enriched in EEs.
- https://cdn.elifesciences.org/articles/86381/elife-86381-fig3-figsupp2-data1-v2.xlsx
-
Figure 3—figure supplement 2—source data 2
Editable table of EE-specific drivers in Figure 3—figure supplement 2B, from Chen et al., 2016.
- https://cdn.elifesciences.org/articles/86381/elife-86381-fig3-figsupp2-data2-v2.xlsx
Figure 3—figure supplement 3
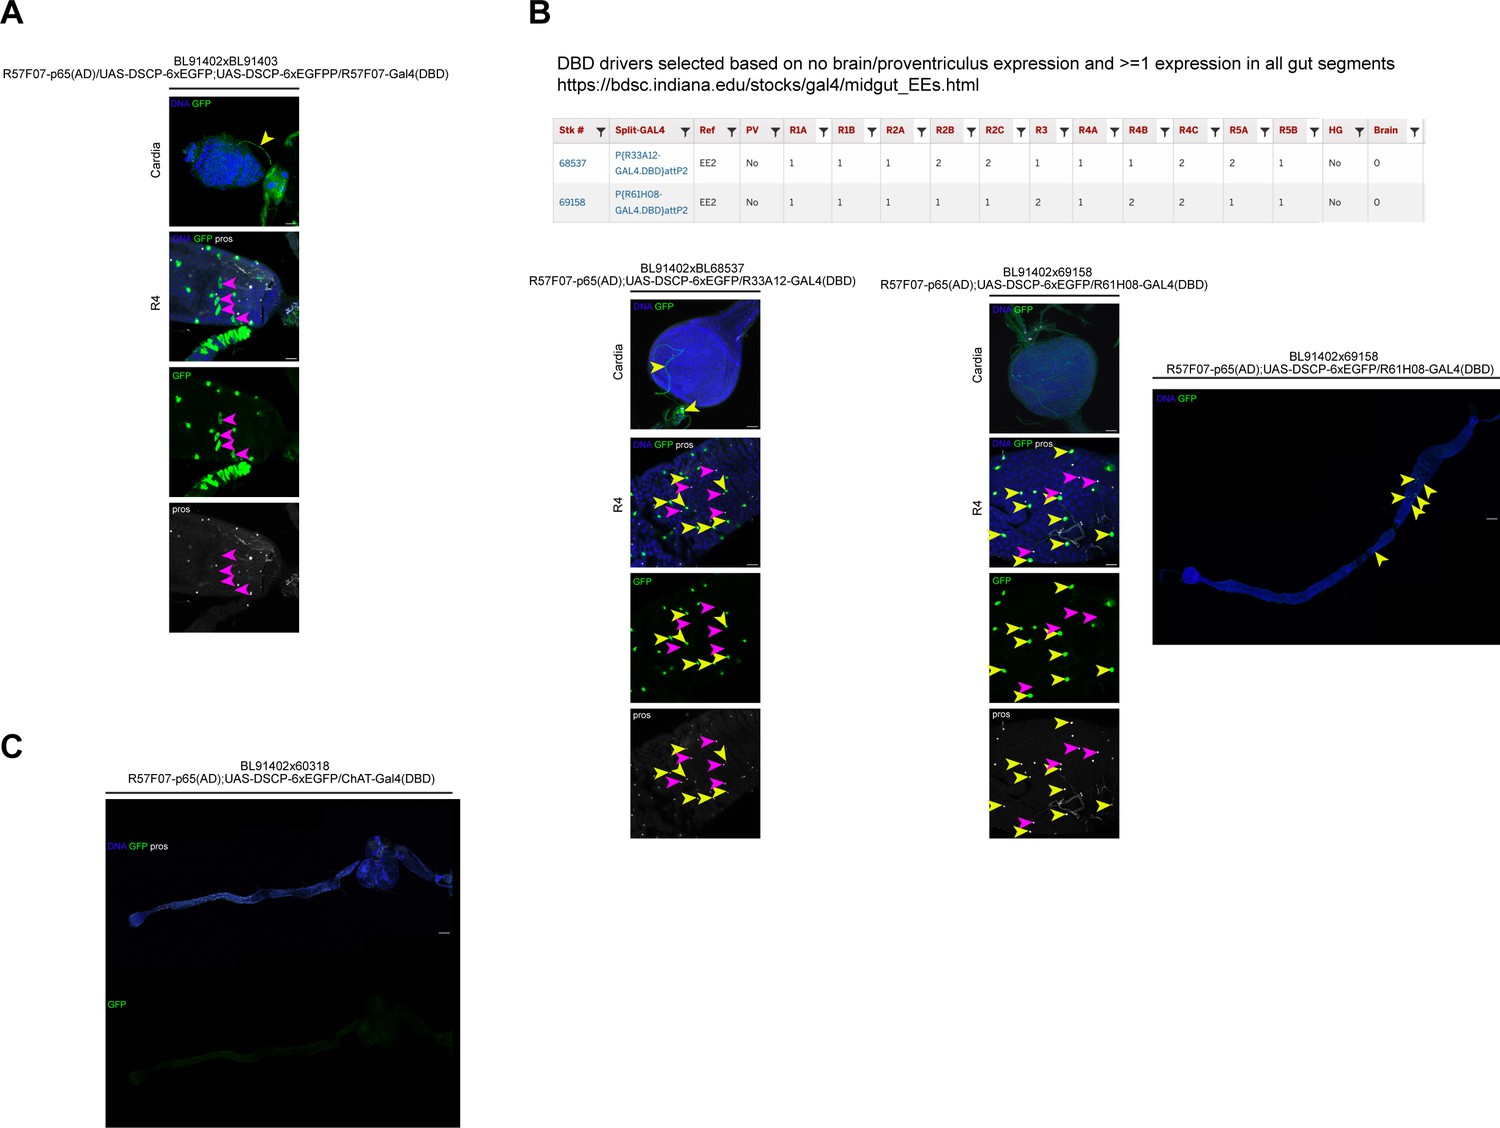
Testing of EE-specific split-Gal4 drivers without neuronal expression.
(A) Split Gal4 approach to identify enteroendocrine cell (EE)-specific drivers without neuronal expression: BL91402 is an EE reference stock expressing EGFP used by Holsopple et al., 2022; Hu et al., 2011, that expresses the p65 activation domain (AD) in EEs under control of sequences in/near Dh31. Crossed to its DBD counterpart, it labels pros-positive EEs with GFP (green), but also enterocytes (ECs) (pink arrowheads) and displays neuronal expression (yellow arrowheads). DNA (blue) is labeled with Hoechst, EEs are labeled with prospero staining (white). n=5 guts. N=2. Scale bars 25 μm. (B) We used the collection of EE-specific DNA-binding domain (DBD) drivers (https://bdsc.indiana.edu/stocks/gal4/midgut_EEs.html) to identify two drivers that were expressed in all regions of the gut, but did not display expression in the proventriculus or brain. The first driver combination (BL91402xBL68537) showed clear neuronal GFP expression in the cardia (yellow arrowheads) and did not label all pros-positive EEs (pink arrowheads: pros+, GFP-, yellow arrowheads: pros+, GFP+). The second pair (BL91402xBL69158) had low neuronal expression, but labeled only a small subset of EEs (pink arrowheads: pros+, GFP-, yellow arrowheads: pros+, GFP+, yellow arrowheads in stitched overview image). DNA (blue) is labeled with Hoechst, EEs are labeled with prospero staining (white). n=5 guts. N=2.Scale bars 25 μm and 100 μm, respectively (stiched image). (C) EE reference driver crossed to a ChAT-Gal4 (DBD) stock, which resulted in the absence of GFP expression in the gut epithelium. DNA (blue) is labeled with Hoechst, EEs are labeled with prospero staining (white). n=5 guts. N=2. Scale bar 100 μm.
Figure 4 with 2 supplements
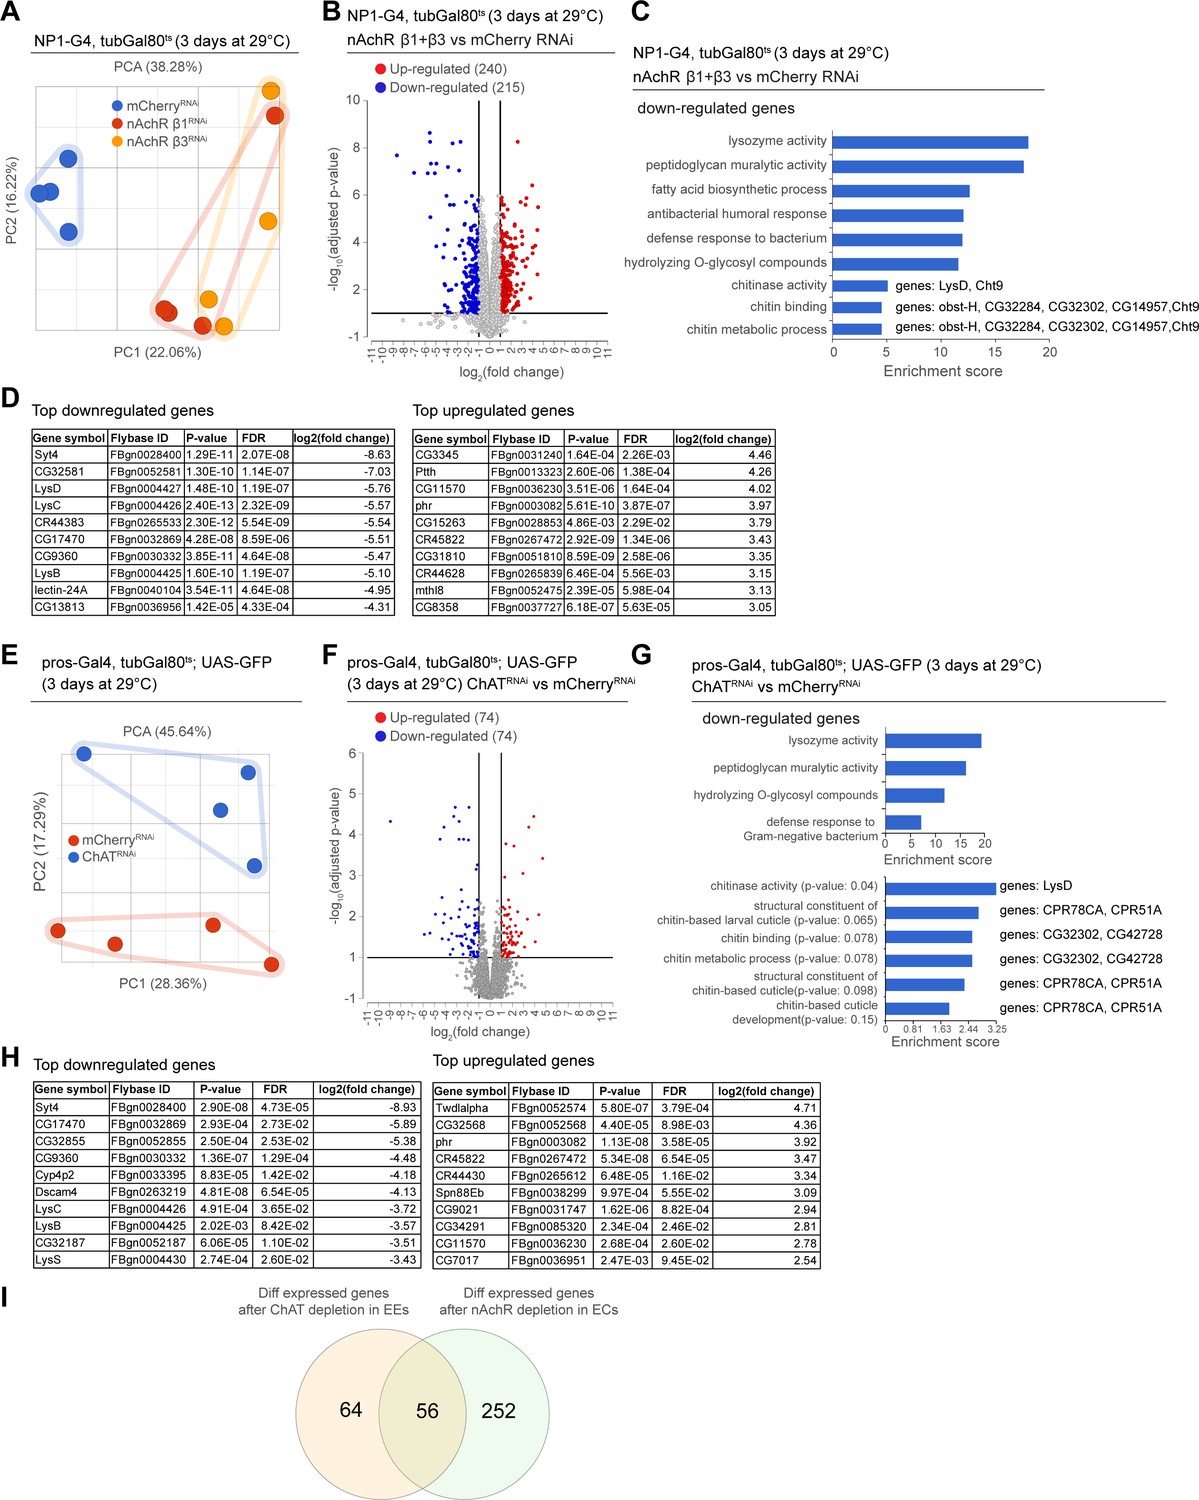
Transcriptional changes after disruption of acetylcholine (Ach) signaling in the intestinal epithelium.
(A) PCA plot of samples after 3 days of nicotinic acetylcholine receptor (nAchR) subunit depletion by RNAi in enterocytes (ECs) with NP1ts. n=4 samples. N=1. (B) Volcano plot showing significantly differentially regulated genes after short-term nAchR β1 or β3 knockdown in ECs (FDR ≤ 0.1; log2(fold change) <–1 or >1; 100% of samples have ≥1 reads). (C) Gene set enrichment analysis of significantly downregulated genes after nAchR β1 and β3 knockdown in ECs. Genes included in data set associated with chitinase activity, chitin binding, and chitin metabolic processes are listed to the right. (D) Top 10 most down- or upregulated genes after 3 days of nAchR subunit depletion by RNAi in ECs with NP1ts. (E) PCA after 3 days of choline acetyltransferase (ChAT) depletion with RNAi in enteroendocrine cells (EEs) under control of prosts. n=4 samples. N=1. (F) Volcano plot of significantly differently regulated genes after 3 days of ChAT knockdown in EEs (FDR ≤ 0.1; log2(fold change) <–1 or >1; 100% of samples have ≥1 reads). (G) Gene set enrichment analysis of significantly downregulated genes after ChAT depletion in EEs. Chitin-related terms show a trend toward enrichment. Genes associated with chitin-related terms are listed to the right. (H) Top 10 most down- or upregulated genes after 3 days of ChAT knockdown by RNAi in EEs with prosts. (I) Overlap between differentially regulated genes after 3 days knockdown of ChAT in EEs or nAchR β1 and β3 in ECs. n: number of samples included; N: number of independent experiments performed with similar results and a similar n.
-
Figure 4—source data 1
Editable table of up- and down-regulated genes shown in Figure 4D.
- https://cdn.elifesciences.org/articles/86381/elife-86381-fig4-data1-v2.xlsx
-
Figure 4—source data 2
Editable table of up- and down-regulated genes shown in Figure 4H.
- https://cdn.elifesciences.org/articles/86381/elife-86381-fig4-data2-v2.xlsx
Figure 4—figure supplement 1
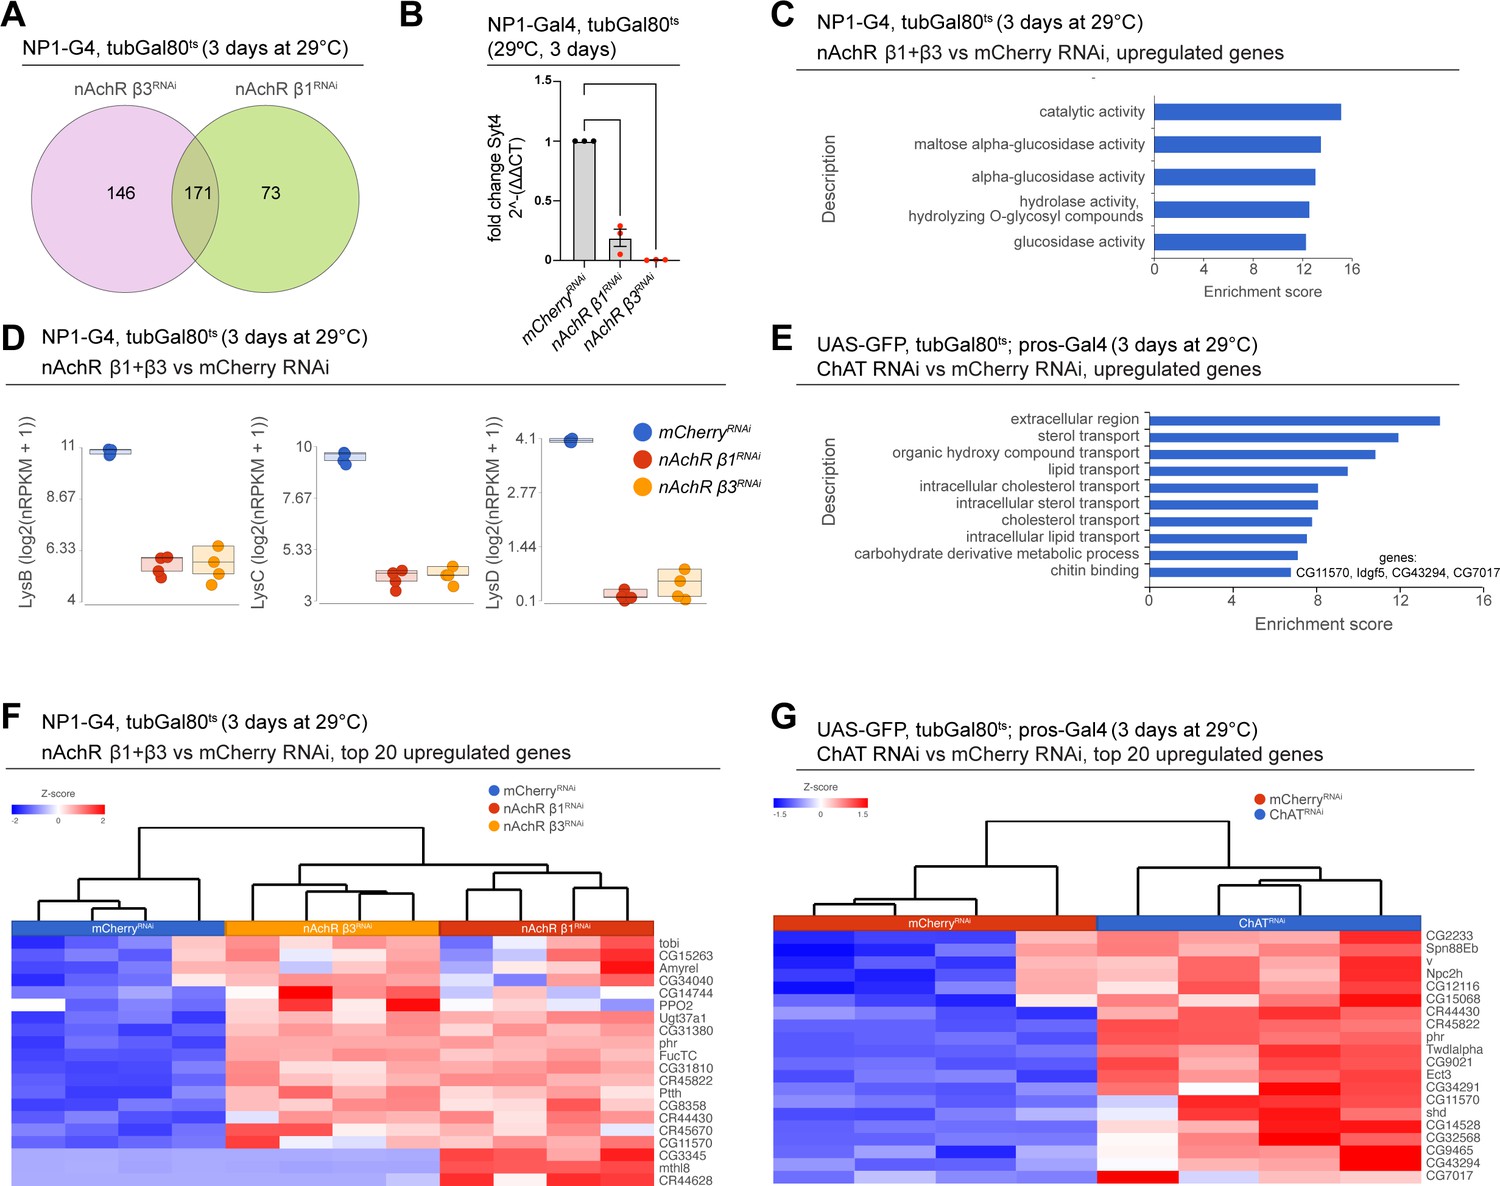
Transcriptional changes after nAchR depletin in ECs or ChAT depletion in EEs.
(A) Overlap between differentially regulated genes after 3 days of nicotinic acetylcholine receptor (nAchR) β1 or β3 depletion in enterocytes (ECs) with NP1ts. (B) RT-qPCR analysis of Syt4 expression after nAchR β1 or β3 depletion in ECs with NP1ts, normalized to GAPDH levels. n=25 pooled guts per genotype and experiment, N=3. (C) GO term enrichment of significantly upregulated genes after 3 days of nAchR β1 and β3 knockdown with NP1ts. (D) Transcript levels of lysozyme family members in bulk RNAseq data set after 3 days of mCherry (control) or nAchR β1 and β3 subunit depletion in ECs. (E) Gene set enrichment analysis of significantly upregulated genes after choline acetyltransferase (ChAT) depletion in enteroendocrine cells (EEs). Genes included in data set associated with chitin are listed to the right. (F) Heatmap of the top 20 upregulated differentially expressed genes after nAchR β1 and β3 knockdown in ECs for 3 days (FDR ≤ 0.1; log2(fold change)>2.5; 100% of samples have ≥1 reads). (G) Heatmap of top 20 upregulated differentially expressed genes after 3 days of ChAT depletion with RNAi in EEs under control of prosts (FDR ≤ 0.1; log2(fold change)>1.97; 100% of samples have ≥1 reads). Data presented as mean ± SEM. ns, not significant, p>0.05; *p≤0.05; **p≤0.01; ***p≤0.001; ****p≤0.0001. n: number of samples analyzed; N: number of independent experiments performed with similar results and a similar n.
Figure 4—figure supplement 2
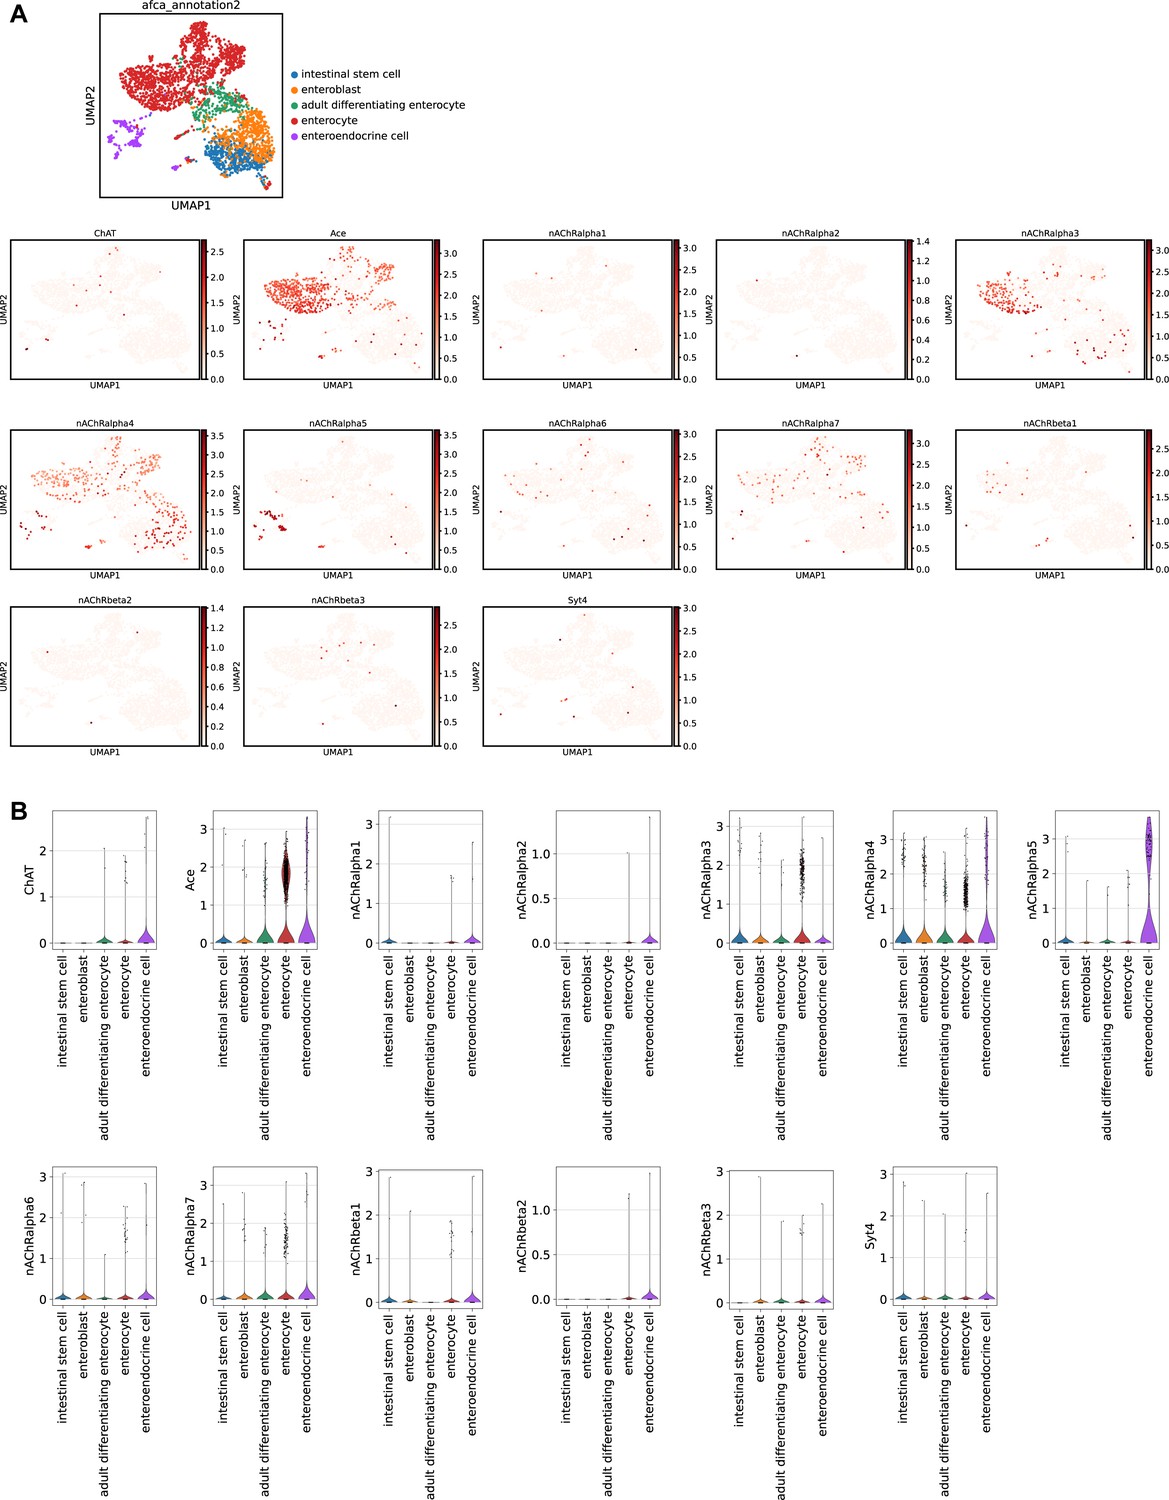
Expression of genes related to Ach-signaling in scRNAseq data.
(A) Uniform Manifold Approximation and Projection (UMAP) plots showing log-normalized expression of indicated genes using scRNAseq data from the Aging Fly Cell Atlas (Lu et al., 2022). (B) Violin plots of indicated genes showing log-normalized gene expression in intestinal epithelial cell types based on Aging Fly Cell Atlas data (Lu et al., 2023).
Figure 5 with 1 supplement
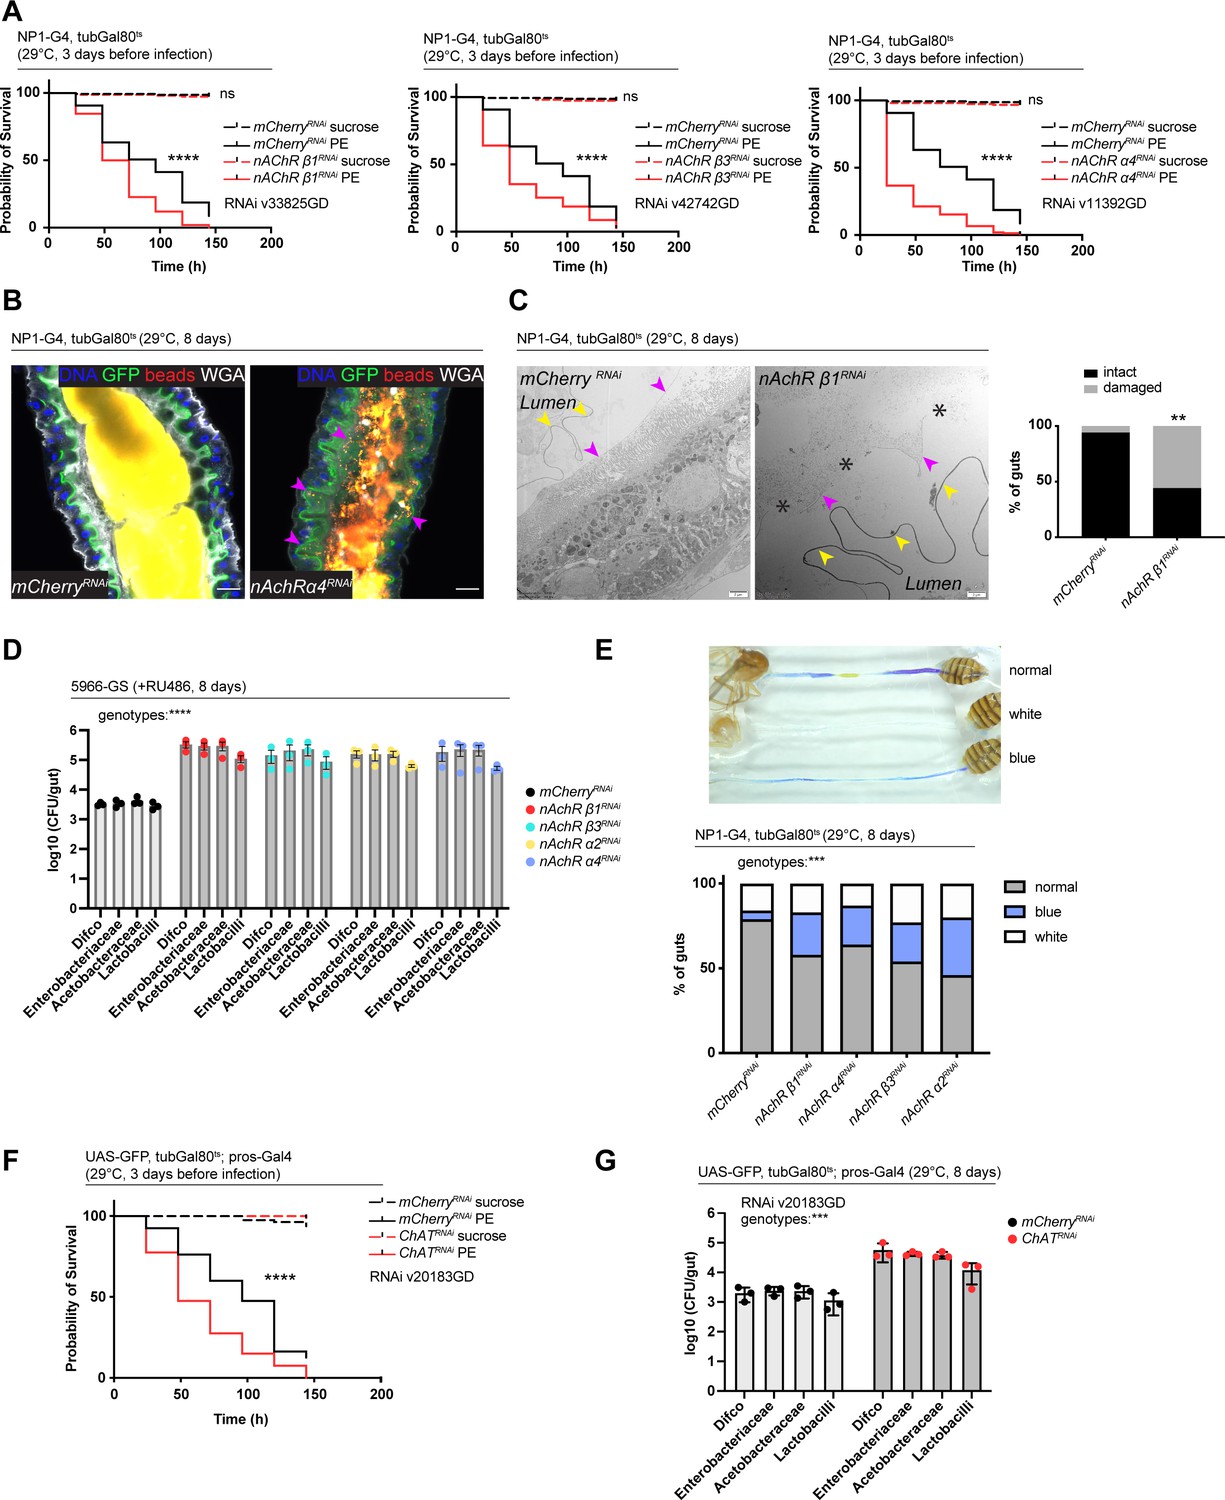
Nicotinic acetylcholine receptor (nAchR) depletion disturbs peritrophic matrix (PM) integrity, causes dysbiosis and inflammation.
(A) Survival of animals depleted for mCherry (control) or nAchR β1, β3, or α4 for 3 days with NP1ts before P. entomophila infection. n=150 animals per genotype and condition; N=3. Log rank (Mantel-Cox) test. (B) Confocal immunofluorescence image of posterior midguts depleted for either mCherry (control) or nAchR α4 for 8 days with NP1ts. Animals are expressing a GFP-brush border marker (green) and were fed red fluorescent beads to assess PM integrity (beads appear yellow/orange due to autofluorescence of beads in GFP channel). PM is labeled with wheat germ agglutinin (WGA) (white), DNA (blue) is labeled with Hoechst. Pink arrowheads highlight beads no longer contained by the PM sleeve. n=15 guts per genotype. N=3. Scale bar 20 μm. (C) Electron microscopy images and quantification of thin PM layer integrity. Thick (yellow arrows) and thin (pink arrows) PM layers are indicated. Asterisks highlight gaps in the thin layer after nAchR β1 depletion. n=16; 18 midguts. N=1. Fisher’s exact test. (D) Colony forming units (CFUs) of whole guts plated on selective growth media after 8 days of nAchR subunit depletion with 5966-GS. Three pooled independent experiments are shown. n=5 pooled animals per genotype and experiment. Two-way ANOVA. (E) Gut compartmentalization and acidity after mCherry (control) or nAchR β1, β3, or α4 depletion for 8 days with NP1ts. Healthy flies fed with Bromphenol blue pH indicator display an acidic patch (yellow), while loss of gut compartmentalization leads to all blue or white guts. n=87 guts for mCherry RNAi (control), n=93 guts for nAchR β1 RNAi, n=113 guts for nAchR α4 RNAi, n=87 guts for nAchR β3 RNAi and n=90 guts for nAchR α2 RNAi. Four independent pooled experiments are shown. Chi square test. (F) Survival after 3 days of mCherry (ctrl) or choline acetyltransferase (ChAT) depletion in enteroendocrine cells (EEs) followed by P. entomophila infection. n=80 animals per genotype and condition; N=3. Log rank (Mantel-Cox) test. (G) CFUs of whole guts plated on selective growth media after 8 days of ChAT depletion in EEs. Three pooled independent experiments are shown. n=5 pooled animals per genotype and experiment. Two-way ANOVA. Data presented as mean ± SEM. ns, not significant, p>0.05; *p≤0.05; **p≤0.01; ***p≤0.001; ****p≤0.0001. n: number of animals or midguts analyzed; N: number of independent experiments performed with similar results and a similar n.
Figure 5—figure supplement 1

Ach signaling modulates PM integrity and infection sensitivity.
(A) Transcript levels of CG32302, a putative peritrophic matrix (PM) component, in bulk RNAseq data set after 3 days of mCherry (control) or nicotinic acetylcholine receptor (nAchR) subunit depletion in ECs. (B) RT-qPCR of ChAT (choline acetyltransferase), Ace (acetylcholine esterase), and nAchR subunits using 5-day-old female wildtype flies after 16 hr of PE infection. Multiple unpaired two-tailed t-tests followed by multiple comparison correction with Holm-Šídák’s method. Separate graph for Ace for better visibility. Unpaired two-tailed t-test. n=25 pooled guts per condition, N=3 (nAchR α1 and nAchR α2), N=5 for all remaining genes. (C) Number of GFP+ cells in guts challenged with PE expressing UAS-GFP under control of Mi{Trojan-GAL4.0}ChAT[MI04508-TG4.0] CG7715[MI04508-TG4.0-X] for 3 days before infection. Three pooled independent experiments are shown. n=7 animals per condition; N=3. Unpaired two-tailed t-test. (D) Confocal immunofluorescence image of posterior midguts depleted for either mCherry (control), nAchR β1 or β3 for 8 days with NP1ts. Animals were fed green fluorescent beads to assess PM integrity. DNA (blue) is labeled with Hoechst. n=10 guts. N=3. Scale bar 25 μm. (E) Overview of PM layers in posterior midgut (R4) of control animals. (1) The PM lies as an intact ring (black arrowheads) loosely in the gut lumen surrounded by an additional thin layer ring (small arrows). The PM encloses food remnants and short segments of material with a similar ultrastructure as the PM (blue arrows). (2) Detail of the PM layers: Thick layer (black arrowheads) and thin layer ring (small arrows) on top of microvilli of the enterocytes. Septate junctions (SJ) seal the intercellular spaces between the enterocytes at their apical edges. (3) Detail of the PM ultrastructure. The luminal surface (white arrowhead) is lined by an electron-dense layer of constant thickness. The abluminal surface is less electron-dense and slightly rough (black arrowheads). (4) Detail of the thin layer ring (black arrows) L, gut lumen. EC, enterocyte. MV, microvilli. N, nucleus. Scale bars: 10 µm (1), 1 µm (2), 200 nm (3), 500 nm (4). (F) Example image of damaged thick PM layer, yellow arrowheads highlight PM fragments in the gut lumen. Quantification of thick PM layer integrity after 8 days of mCherry (control) or nAchR β1 knockdown in ECs. n=16; 18 midguts for mCherry or nAchR β1, respectively. N=1. Fisher’s exact test. (G) Survival after 3 days of GFP or ChAT overexpression in enteroendocrine cells (EEs) followed by P. entomophila infection. n=80 animals for UAS-GFP on sucrose or sucrose + PE; n=40 animals for UAS-ChAT on sucrose or sucrose + PE; N=3. Log rank (Mantel-Cox) test. Data presented as mean ± SEM. ns, not significant, p>0.05; *p≤0.05; **p≤0.01; ***p≤0.001; ****p≤0.0001. n: number of animals or midguts analyzed; N: number of independent experiments performed with similar results and a similar n.
Figure 6 with 1 supplement
Syt4 knockdown affects peritrophic matrix (PM) integrity and phenocopies nAchR depletion.
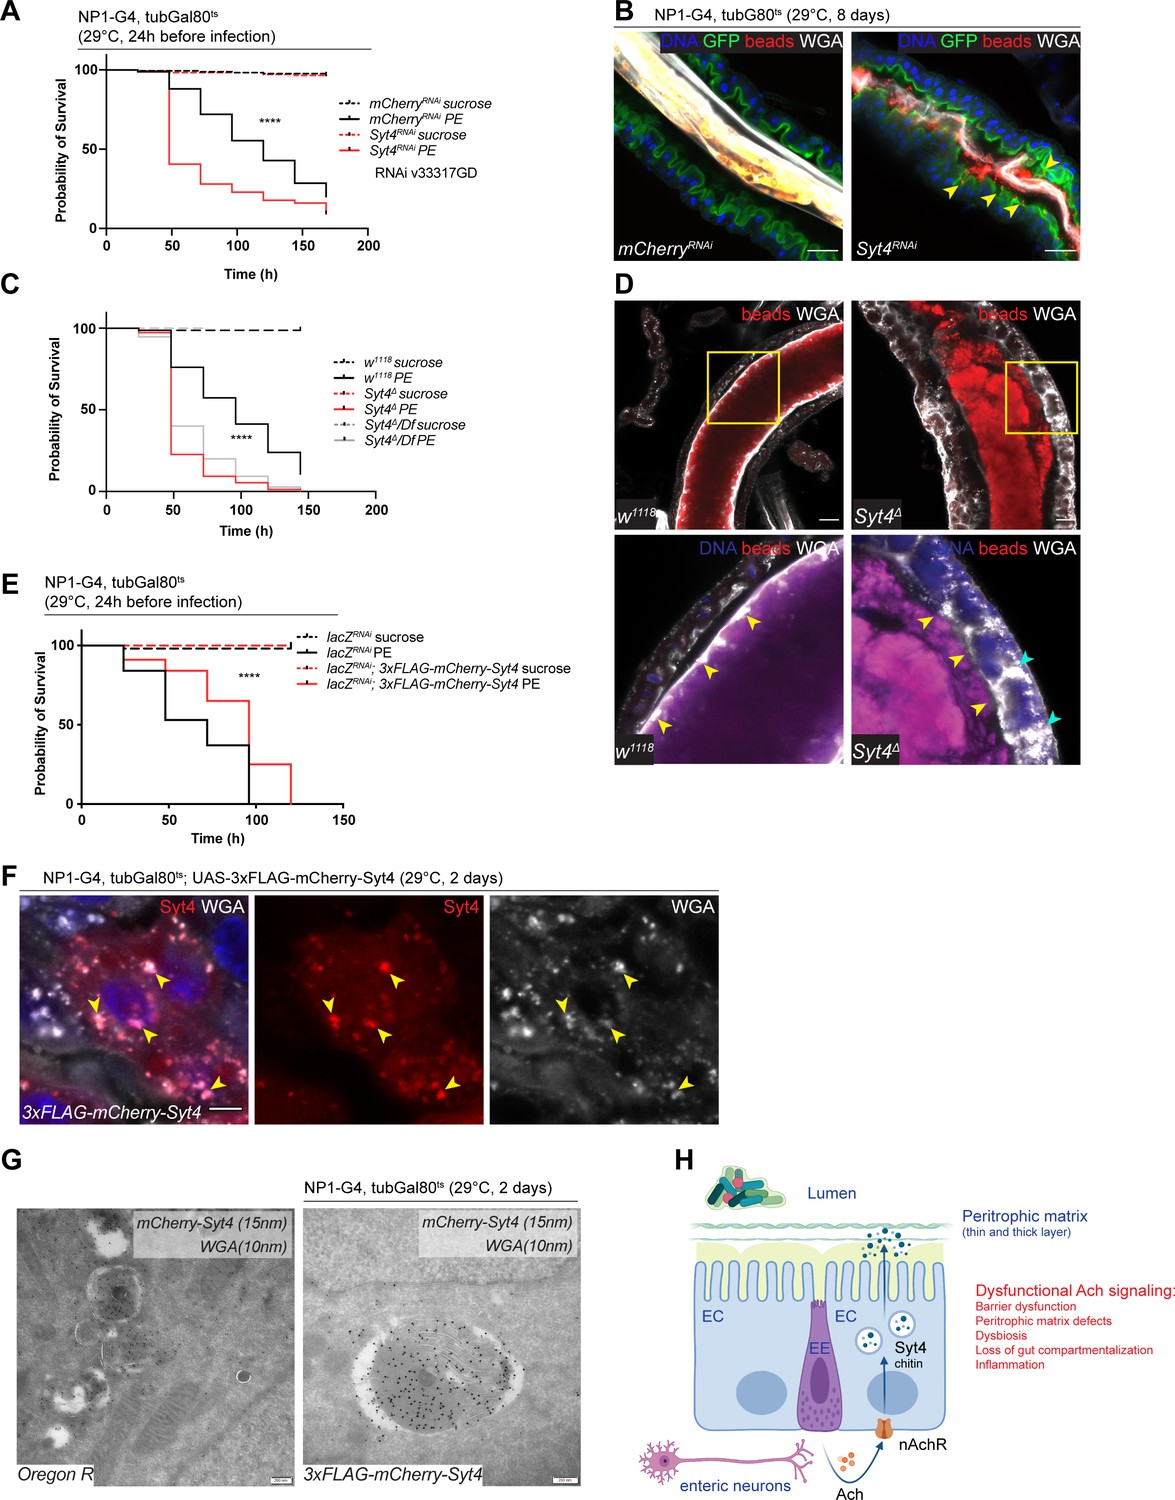
(A) Survival after 1 day of mCherry (ctrl) or Syt4 depletion in ECs followed by P. entomophila infection. n=175 animals per genotype and condition; N=3. Log rank (Mantel-Cox) test. (B) Confocal immunofluorescence image of posterior midguts depleted for either mCherry (control) or Syt4 for 8 days. Animals are expressing a GFP-brush border marker (green) and were fed red fluorescent beads to assess PM integrity (beads appear yellow/orange due to autofluorescence of beads in GFP channel). PM is labeled with wheat germ agglutinin (WGA) (white), DNA (blue) is labeled with Hoechst. Yellow arrowheads indicate beads that leaked out of the PM sleeve. n=10 guts per genotype. N=3. Scale bar 25 μm. (C) Survival of w1118 (control), Syt4Δ CRISPR null mutant flies or Syt4Δ flies crossed to a deficiency (BL24927) after P. entomophila infection. n=75 animals per genotype and condition; N=3. Log rank (Mantel-Cox) test. (D) Confocal immunofluorescence image of posterior midguts of w1118 (control) or Syt4Δ animals fed with red fluorescent beads to monitor PM integrity. PM is stained with WGA (white), DNA (blue) is labeled with Hoechst in bottom panels. Yellow insets are shown enlarged in bottom row. Yellow arrowheads indicate the presence (w1118) or absence of a clear PM boundary. Cyan arrowheads indicate accumulation of WGA signal within the epithelium. n=10 guts per genotype. N=3. Scale bar 25 μm. (E) Survival after overexpression of LacZ-RNAi (control) or LacZ-RNAi together with UAS-FLAG-mCherry-Syt4 for 1 day before P. entomophila infection. n=100 animals per genotype and condition; N=3. Log rank (Mantel-Cox) test. (F) Confocal immunofluorescence image of posterior midguts overexpressing UAS-FLAG-mCherry-Syt4 (red) in enterocytes stained with WGA (white). DNA (blue) is labeled with Hoechst in bottom panels. Yellow arrowheads indicate overlap between Syt4-positive vesicles and WGA staining. n=8 guts. N=3. Scale bar 25 μm. (G) Immunogold electron microscopy image of posterior midgut of an Oregon R wildtype animal or an animal overexpressing UAS-FLAG-mCherry-Syt4 in enterocytes with NP1ts. WGA-biotin (10 nm gold particles) is detected in multilamellar bodies carrying membranous and amorphous material. Syt4 (stained with anti-mCherry antibody, 15 nm gold particles) colocalizes with these structures in animals expressing the UAS-FLAG-mCherry-Syt4, while Oregon R samples are devoid of anti-mCherry antibody labeling. n=5. N=1. Scale bar 200 nm. (H) Model: Neuronal or EE-derived Ach maintains barrier function through Syt4-mediated secretion of PM components such as chitin from ECs. Disrupted Ach signaling leads to barrier dysfunction, PM defects, dysbiosis, as well as loss of gut compartmentalization and inflammation. Ach, acetylcholine; nAchR, nicotinic acetylcholine receptor; EC, enterocyte; EE, enteroendocrine cell; Syt4, Synaptotagmin 4. Data presented as mean ± SEM. ns, not significant, p>0.05; *p≤0.05; **p≤0.01; ***p≤0.001; ****p≤0.0001. n: number of animals or midguts analyzed; N: number of independent experiments performed with similar results and a similar n.
Figure 6—figure supplement 1
Syt4 promotes survival after infection, a healthy microbiome and gut compartmentalization but is not sufficient to rescue loss of nAchR in ECs.
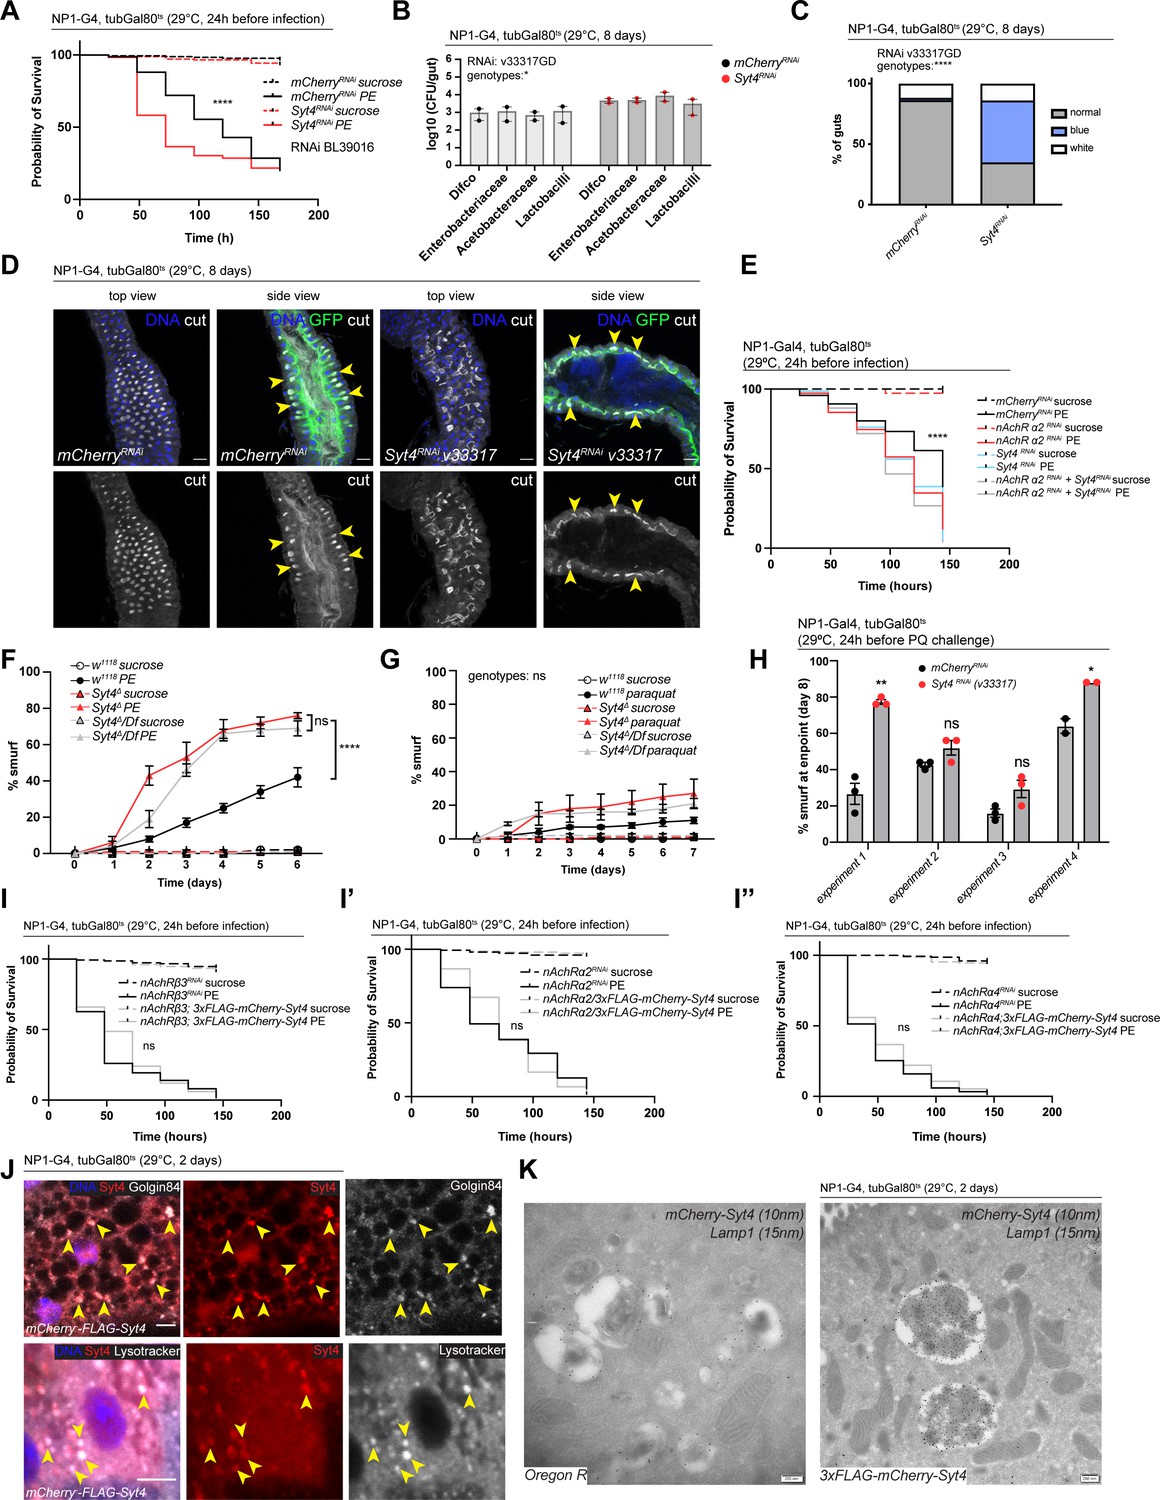
(A) Survival after 1 day of mCherry (ctrl) or Syt4 depletion in enterocytes (ECs) followed by P. entomophila infection. n=175 animals per genotype and condition; N=3. Log rank (Mantel-Cox) test. (B) Colony forming units (CFU) of whole guts plated on selective growth media after 8 days of Syt4 depletion in ECs. Two pooled independent experiments are shown. n=5 pooled animals per genotype and experiment. Two-way ANOVA. (C) Analysis of gut compartmentalization visualized by feeding Bromophenol blue pH indicator (see Figure 5E) after 8 days of Syt4 knockdown in ECs. n=51 guts for mCherry (control), n=43 guts for Syt4 RNAi. Three independent pooled experiments are shown. Chi square test. (D) Confocal immunofluorescence images of posterior midguts depleted of either mCherry (control) or Syt4 in ECs for 8 days, stained with anti-cut antibody (white). Guts are expressing a GFP-brush border marker (green). DNA (blue) is labeled with Hoechst. Yellow arrowheads in side view panels highlight healthy, pocket-like (mCherry) and disrupted gastric units (Syt4-RNAi). n=10 guts. N=3. Scale bar 25 μm. (E) Survival after 24 hr of combined knockdown of Syt4 and nicotinic acetylcholine receptor (nAchR) α2 before P. entomophila infection. n=75 animals per genotype and condition for both assays; N=3. Log rank test (Mantel-Cox). (F) Barrier dysfunction assay after P. entomophila infection of w1118 (control), Syt4Δ CRISPR null mutant flies, or Syt4Δ flies crossed to a deficiency (BL24927). n=100 animals per genotype and condition; N=2. Two-way repeated measures (RM) ANOVA. Both types of Syt4-deficient animals display enhanced barrier dysfunction compared to the control, while not being significantly different from each other (see indicated comparisons). (G) Barrier dysfunction assay after Paraquat challenge of w1118 (control), Syt4Δ CRISPR null mutant flies or Syt4Δ flies crossed to a deficiency (BL24927). Paraquat concentration 17.5 mM. n=100 animals per genotype and condition; N=3. Two-way RM ANOVA. (H) Barrier dysfunction assay with Paraquat displaying percentage of smurfs at experimental endpoint (8 days chase). Four individual experiments are shown. n=75 animals per genotype and condition (experiments 1–3), n=50 animals per genotype and condition (experiment 4). Unpaired two-tailed t-test for each experiment. (I, I’, I’’) Survival after PE infection upon concomitant overexpression of 3xFLAG-mCherry-Syt4 and nAchR knockdown. n=150 animals per genotype and condition, N=1. Log rank test (Mantel-Cox). (J) Confocal immunofluorescence image of posterior midguts overexpressing UAS-FLAG-mCherry-Syt4 (red) in ECs stained with anti-Golgin84 antibody or Lysotracker (white). DNA (blue) is labeled with Hoechst. Yellow arrowheads indicate overlap between Syt4-positive vesicles and Golgin84 or Lysotracker staining. n=10 guts. N=3. Scale bar 5 μm. (K) Immunogold electron microscopy image of Syt4 and Lamp1 co-staining in ECs of posterior midguts of either wildtype Oregon R flies or animals expressing UAS-FLAG-mCherry-Syt4 under control of NP1ts. Syt4 (detected with mCherry antibody 10 nm gold particles) and Lamp1 (15 nm gold particles) are colocalizing on multilamellar bodies in animals expressing the Syt4 construct. Oregon R samples are devoid of anti-mCherry antibody staining. n=5 guts. N=1. Scale bar 200 nm. Data presented as mean ± SEM. ns, not significant, p>0.05; *p≤0.05; **p≤0.01; ***p≤0.001; ****p≤0.0001. n: number of animals or midguts analyzed; N: number of independent experiments performed with similar results and a similar n.
Additional files
-
MDAR checklist
- https://cdn.elifesciences.org/articles/86381/elife-86381-mdarchecklist1-v2.pdf
-
Supplementary file 1
List of candidate genes for genetic variants (human) associated with COPD (Hobbs et al., 2017).
Genes highlighted in blue had a clear Drosophila ortholog and were included in the screen. Abbreviations used: SNP, single nucleotide polymorphism; CHR, chromosome; BP, base pair (GRCh37); eQTL, expression quantitative trait loci; risk allele, allele associated with increased COPD risk; Alt allele, alternative allele; OR stage1, odds ratio of risk allele in stage 1 of P.stage1, p-value in stage 1 of Hobbs et al.; P.meta, meta-analysis p-value in Hobbs et al.; Evidence.Sakornsakolpat, evidence (if available) from Sakornsakolpat et al., 2019 (GREx-genetically regulated expression, mQTL-methylation quantitative trait loci, Cod-coding association, Hi-C-chromatin interaction in human lung or IMR90 cell line, DHS-DNase hypersensitivity sites, GSet-genes identified by DEPICT, further details are available in the original publication); colocalization, probability shared causal variant between eQTL (GTEx) and COPD risk association (tissue: probability), only colocalization probability > 0.6 are listed.
- https://cdn.elifesciences.org/articles/86381/elife-86381-supp1-v2.xlsx
-
Supplementary file 2
List of Drosophila genes and RNAi lines included in the screen.
RNAi lines were ranked according to the natural logarithm of the ratio between the proportion of smurfs after candidate gene knockdown and Luciferase RNAi control. Cutoff scale shown in Figure 1C was used to determine the effect of each RNAi. Based on this fine-grained ranking of individual RNAi lines, an overall rating was assigned to each gene and compared to human eQTL data (see also Figure 1A). Temperature column refers to the temperature the subsets of RNAi lines were screened at.
- https://cdn.elifesciences.org/articles/86381/elife-86381-supp2-v2.xlsx
Download links
A two-part list of links to download the article, or parts of the article, in various formats.
Downloads (link to download the article as PDF)
Open citations (links to open the citations from this article in various online reference manager services)
Cite this article (links to download the citations from this article in formats compatible with various reference manager tools)
Nicotinic acetylcholine receptor signaling maintains epithelial barrier integrity
eLife 12:e86381.
https://doi.org/10.7554/eLife.86381


