A billion years arms-race between viruses, virophages, and eukaryotes
- Department of Biology, University of Oxford, United Kingdom
Figures
Figure 1

The two main hypotheses for the origin of virophages and NCLDVs.
In the virophage first hypothesis, NCLDVs diverge early with its sister lineage evolving into protovirophages. In the nuclear escape hypothesis, NCLDVs descend from endogenous elements (encoding an integrase) that became exogenous; virophages then evolved to become their parasites.
Figure 2 with 6 supplements
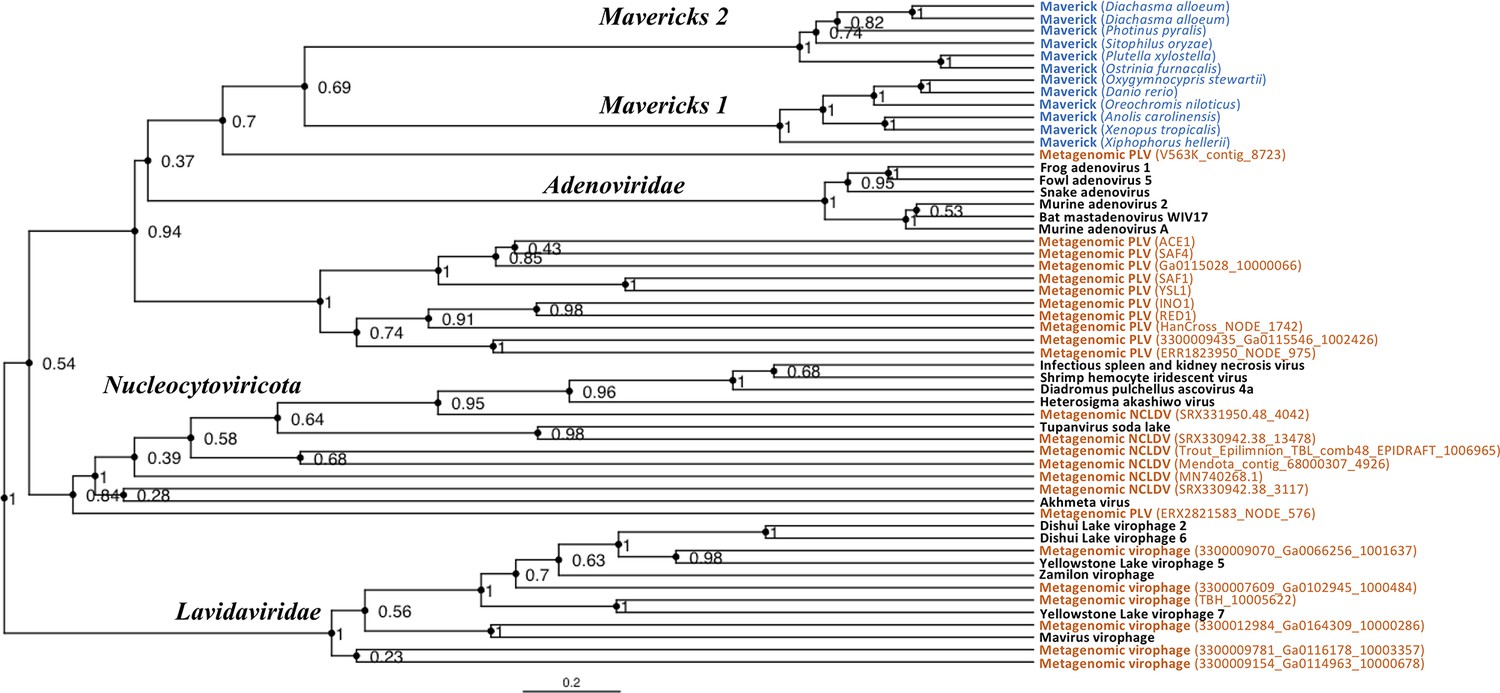
Rooted Bayesian maximum clade credibility tree of the major lineages of eukaryotic viruses in the kingdom Bamfordvirae.
The tree is based on the concatenated alignment of 4 core proteins involved in virion morphogenesis (major and minor capsid proteins, ATPase and protease). Tree computed in BEAST 2 (Bouckaert et al., 2019) using a relaxed molecular clock and 140 million generations (relative burn-in of 25%). Black: reference viral genomes, Blue: endogenous elements, Orange: metagenomic sequences.
Figure 2—figure supplement 1
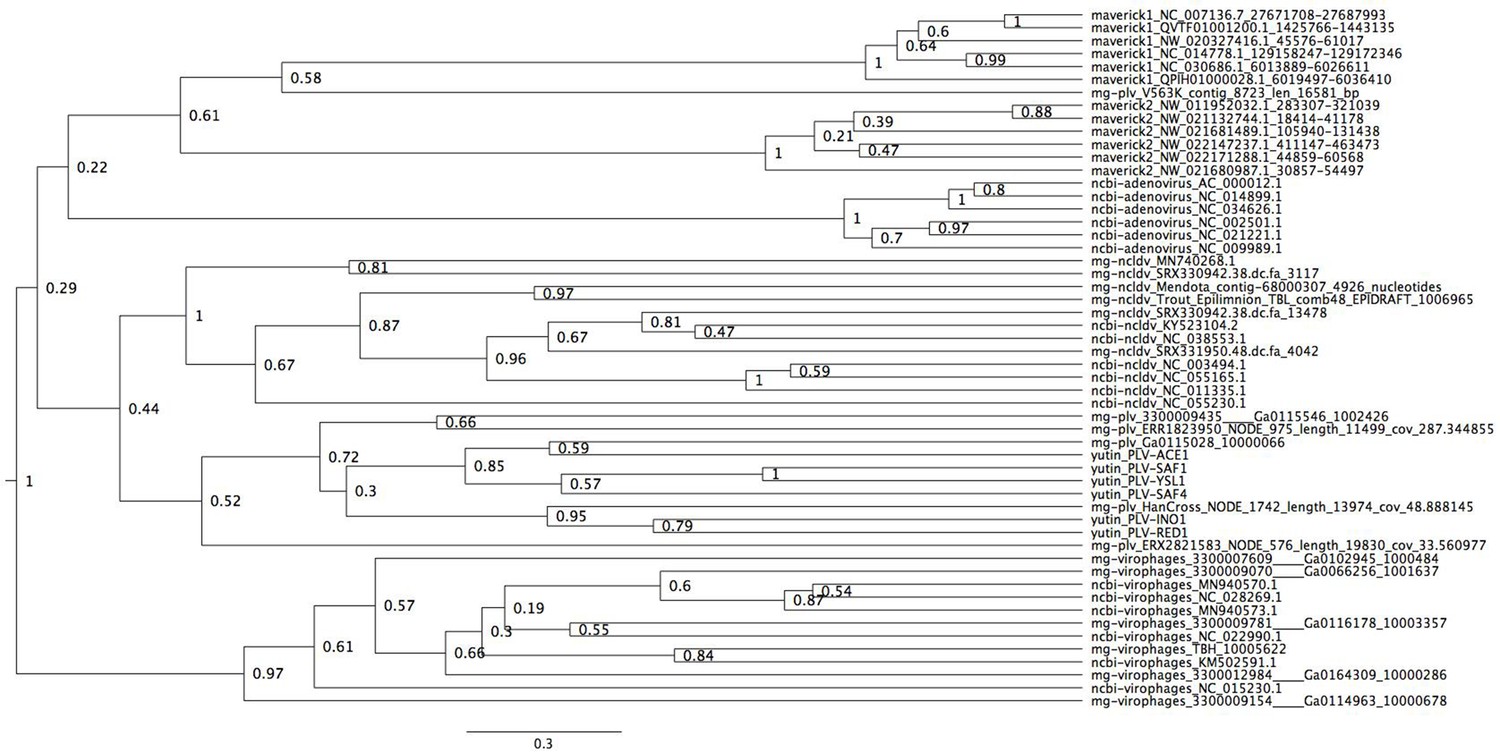
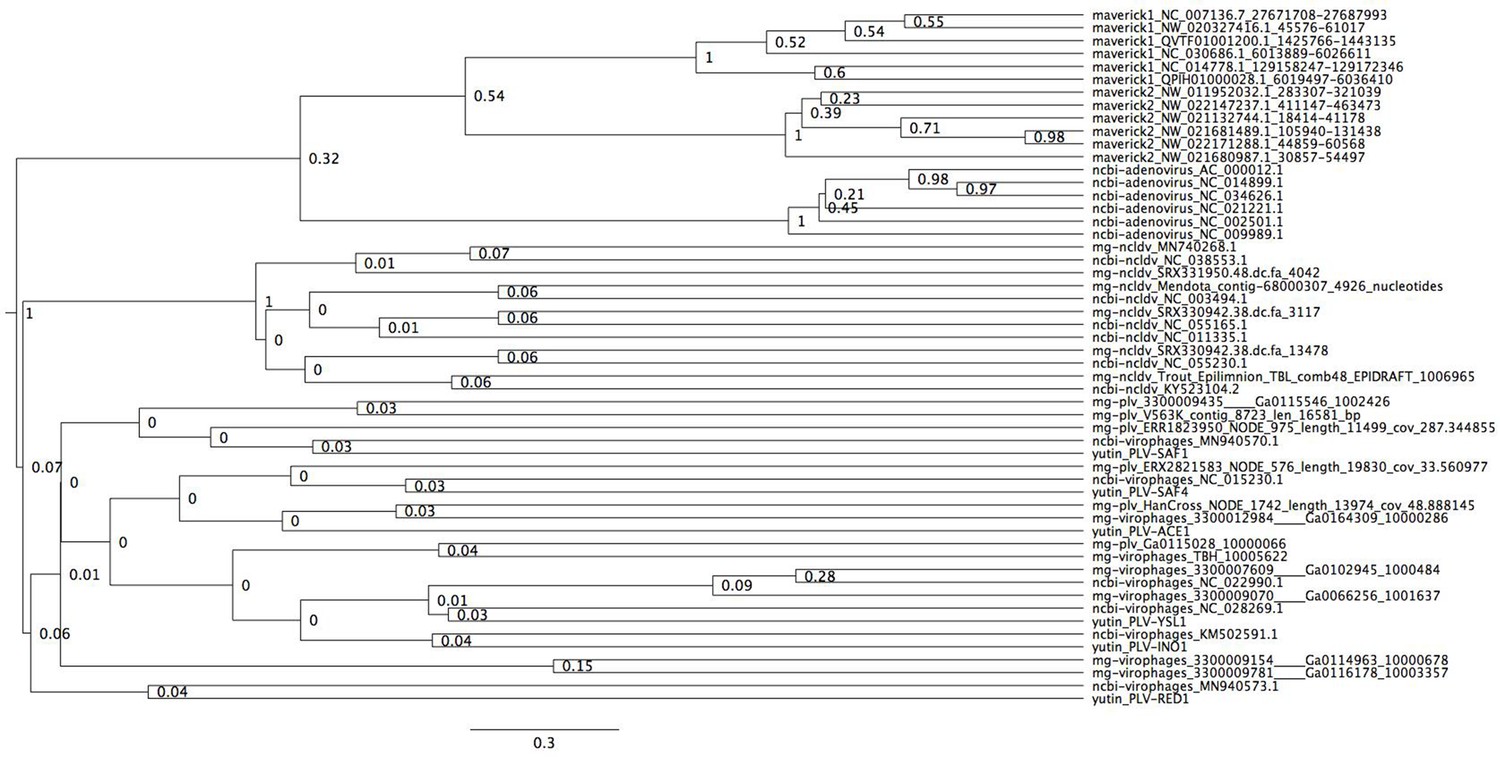
Bayesian maximum credibility tree of the major capsid protein inferred with a relaxed molecular clock.
Virophages are monophyletic with a high posterior support (0.97). The root falls between virophages and all other elements. Tree estimated from 200 million MCMC generations and a 25% relative burn-in.
Figure 2—figure supplement 2
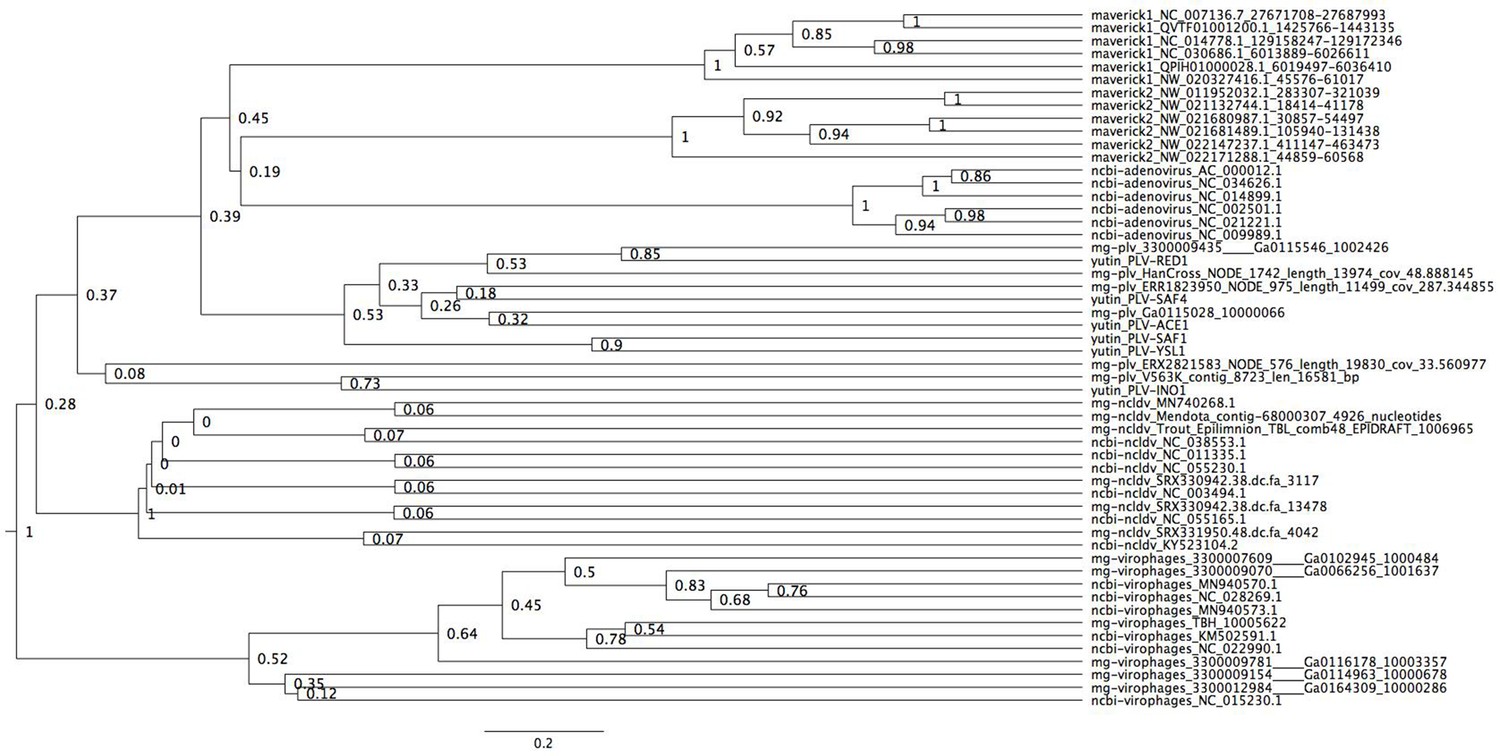
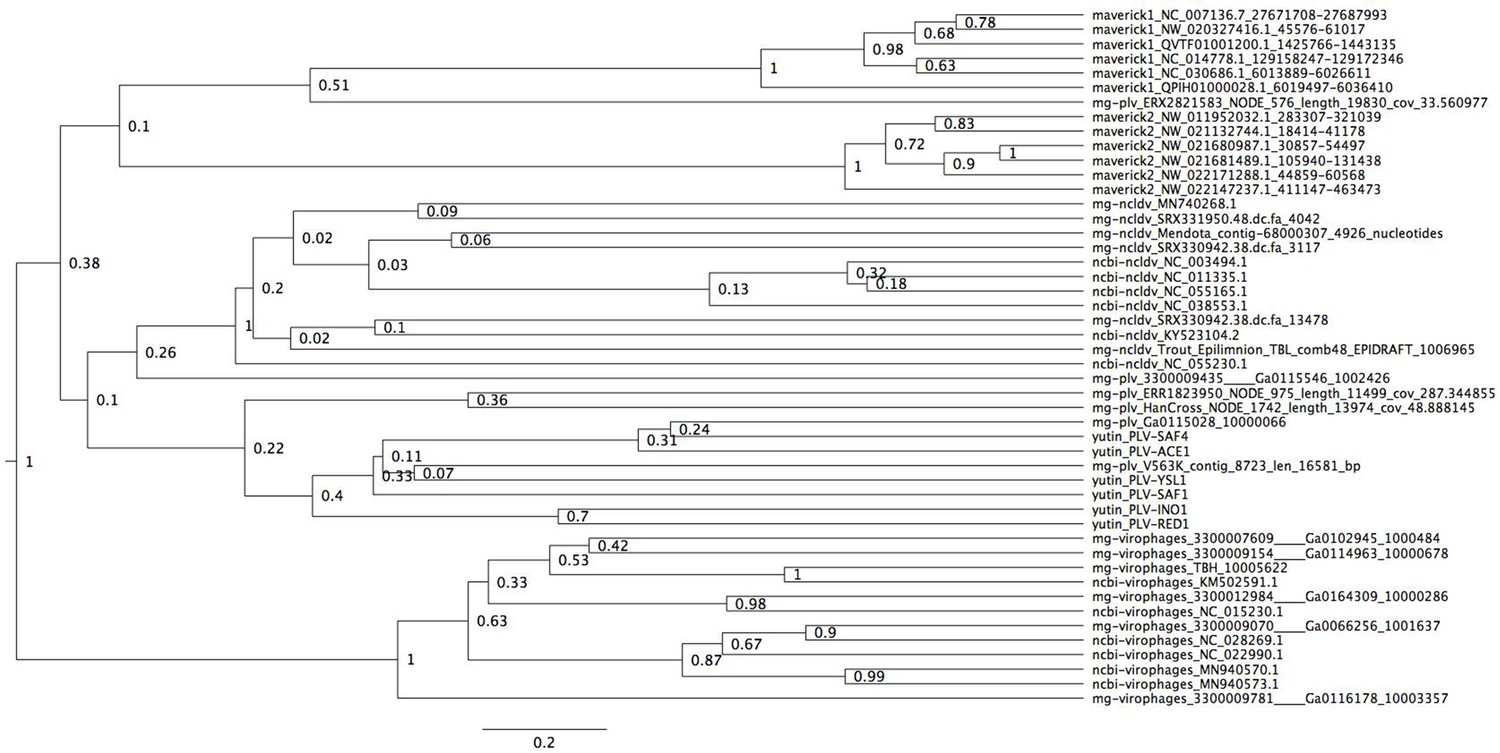
Bayesian maximum credibility tree of the minor capsid protein inferred with a relaxed molecular clock.
Virophages are monophyletic with a moderate posterior support (0.52). The root falls between virophages and all other elements. Tree estimated from 200 million MCMC generations and a 25% relative burn-in.
Figure 2—figure supplement 3
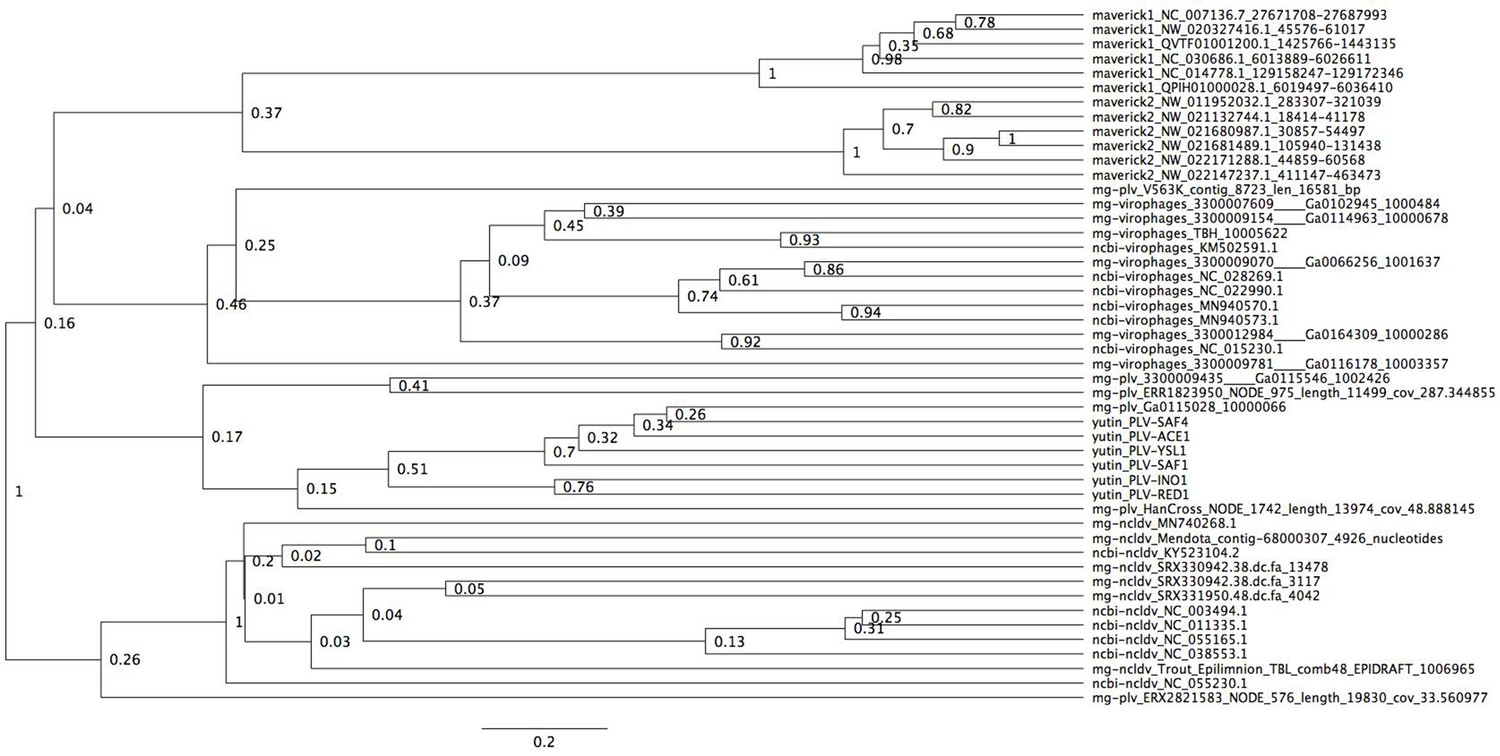
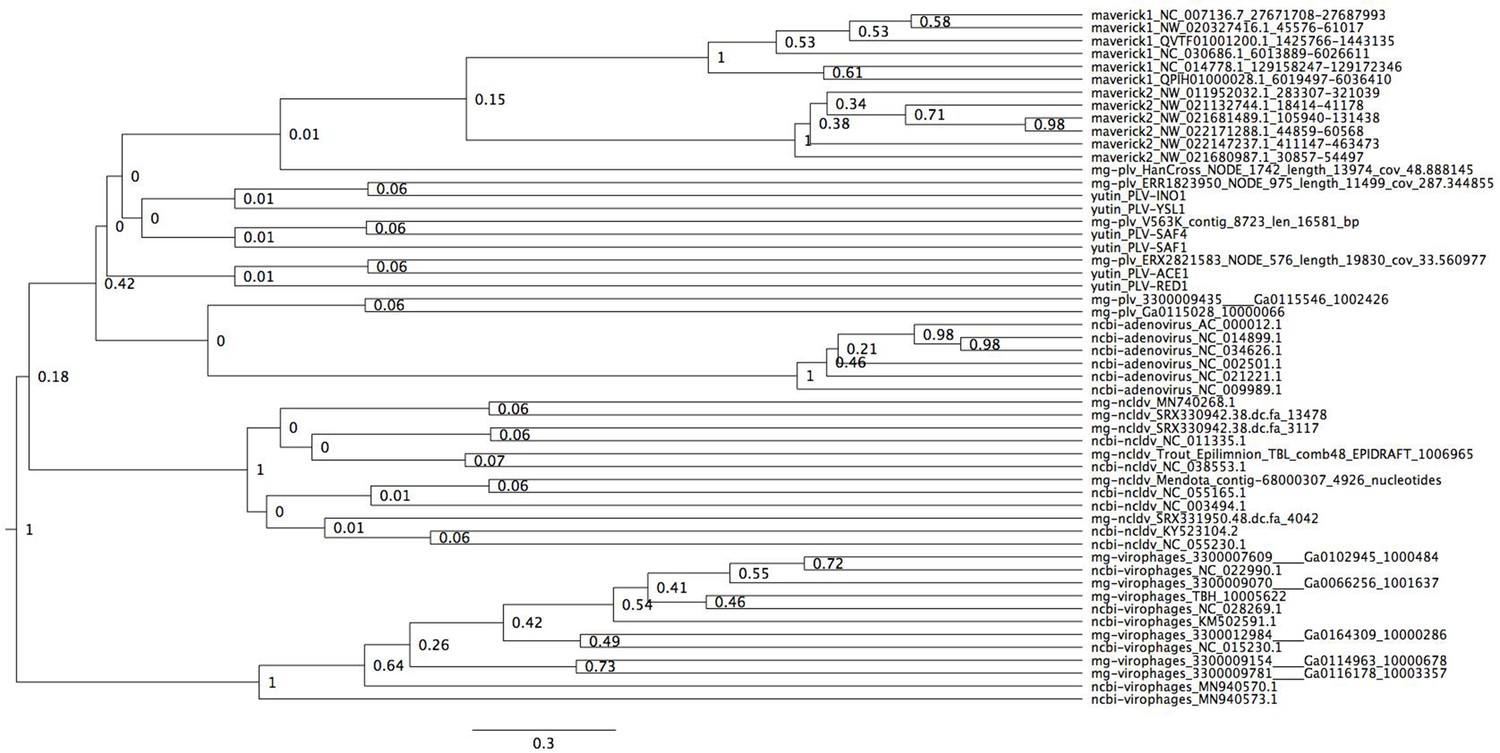
Bayesian maximum credibility tree of the ATPase inferred with a relaxed molecular clock.
We did not use a monophyletic constraint on virophages in this tree. The root falls between a clade formed by NCLDVs plus a metagenomic PLV (0.26 posterior probability), and all other elements. According to this tree, virophages are not monophyletic. Tree estimated from 200 million MCMC generations and a 25% relative burn-in. Adenoviruses are not included in this tree since they encode a non-homologous ATPase of the ABC superfamily (Burroughs et al., 2007).
Figure 2—figure supplement 4
Bayesian maximum credibility tree of the protease inferred with a relaxed molecular clock.
We did not use a monophyletic constraint on virophages in this tree. The root falls between a clade formed by adenoviruses and Mavericks and all other elements. However, notice how virophages do not form a monophyletic group. Tree estimated from 200 million MCMC generations and a 25% relative burn-in.
Figure 2—figure supplement 5
Bayesian maximum credibility tree of the ATPase inferred with a relaxed molecular clock, and using a monophyletic constraint on virophages.
The root of this tree falls between virophages and all other elements. Tree estimated from 200 million MCMC generations and a 25% relative burn-in. Adenoviruses are not included in this tree since they encode a non-homologous ATPase of the ABC superfamily (Burroughs et al., 2007).
Figure 2—figure supplement 6
Bayesian maximum credibility tree of the protease inferred with a relaxed molecular clock, and using a monophyletic constraint on virophages.
The root falls between virophages and all other elements. Tree estimated from 200 million MCMC generations and a 25% relative burn-in.
Figure 3 with 1 supplement
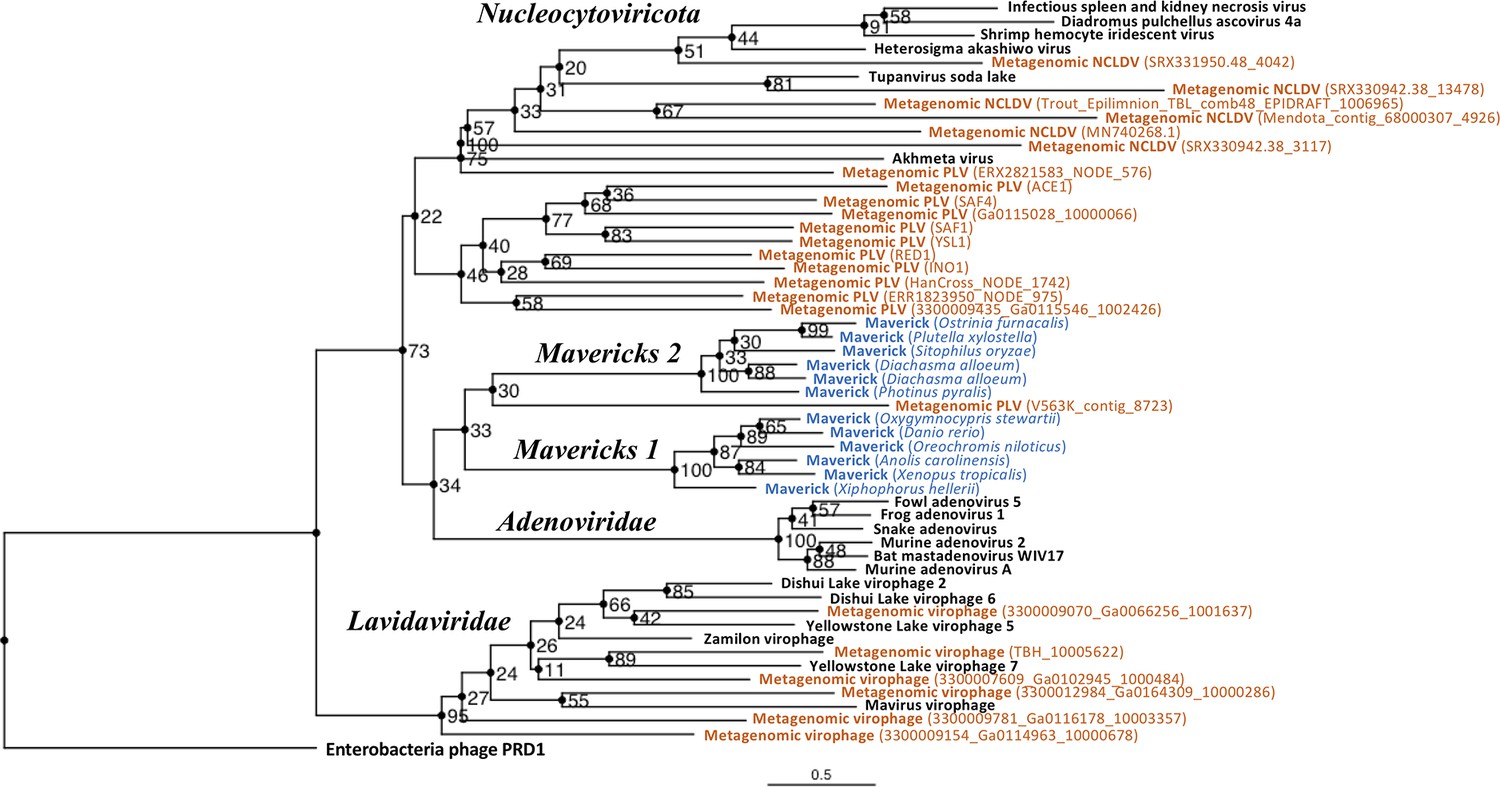
Outgroup-rooted maximum likelihood tree of the major lineages of eukaryotic viruses in the kingdom Bamfordvirae.
The tree is based on the concatenated alignment of 4 core proteins involved in virion morphogenesis (major and minor capsid proteins, ATPase and protease). Enterobacteria phage PRD1 (Tectiviridae) was used as the outgroup for rooting. Tree computed in RAxML-NG with 200 random starting trees and 2200 bootstraps (Kozlov et al., 2019). Black: reference viral genomes, Blue: endogenous elements, Orange: metagenomic sequences.
Figure 3—figure supplement 1
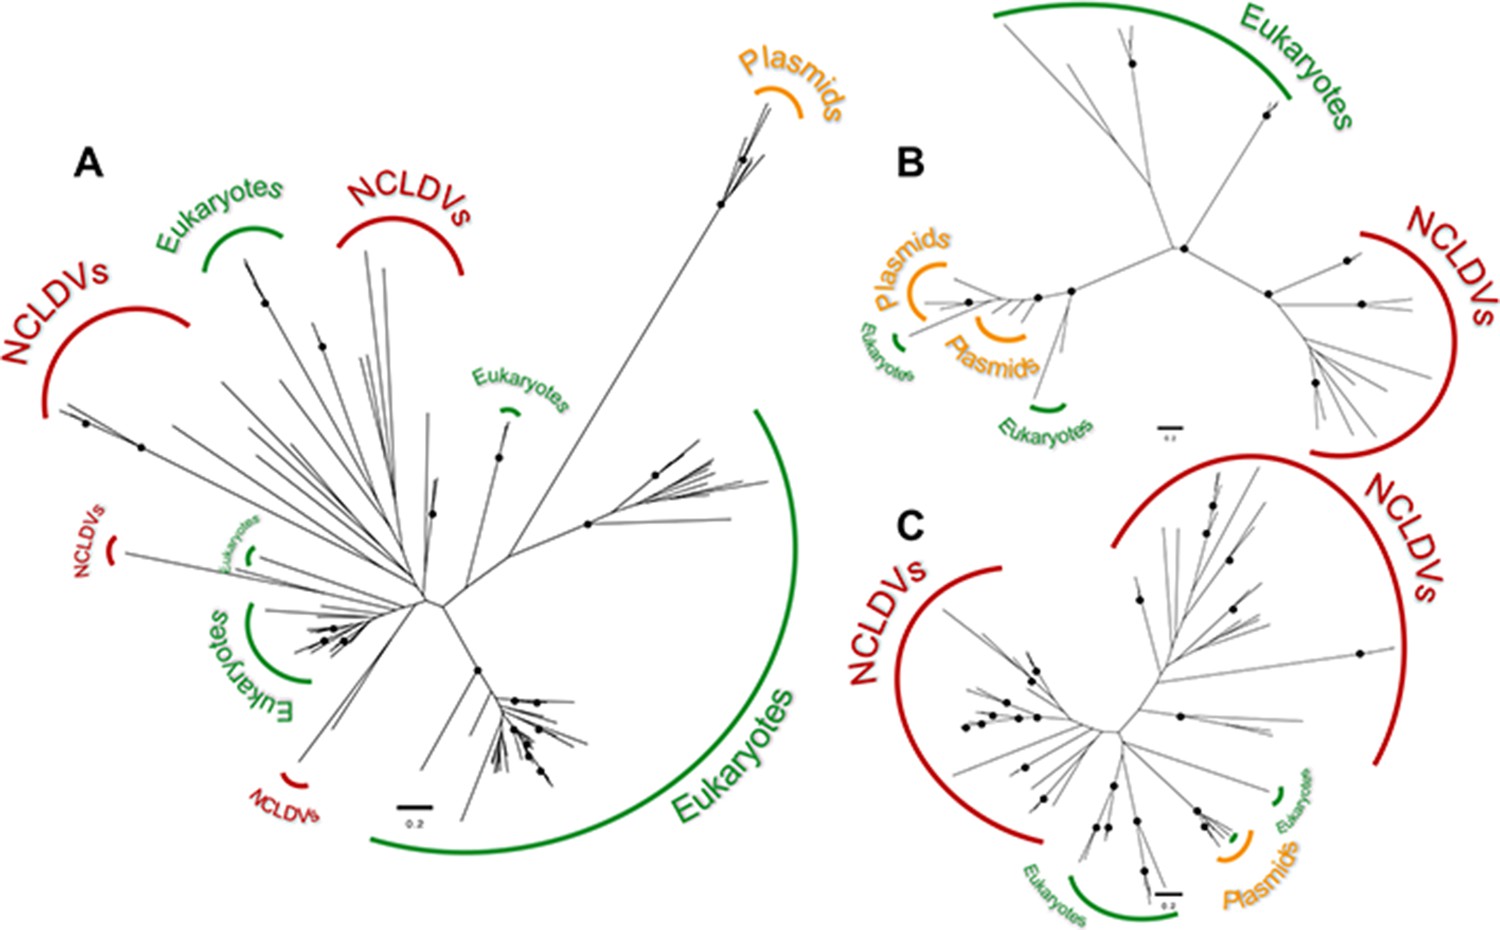
Maximum-likelihood unrooted phylogenetic trees of the transcriptional homologues encoded in cytoplasmic linear plasmids.
(A) Trees for the DNA-directed RNA polymerase II, subunit Rpb2, (B) mRNA capping enzyme, and (C) helicase. In all cases, the topologies rule out a sister grouping of the NCLDV and cytoplasmic linear plasmid homologues, suggesting they were acquired independently. Black circles indicate bootstrap support ≥94% after 1000 replicates.
Figure 4

Evolutionary model for the origin of the major lineages of eukaryotic viruses in the kingdom Bamfordvirae.
The viral ancestor is inferred to have been an exogenous virus, while the rve-integrase was captured independently by the clade of Mavericks + Polinton like virus BS_13 and Mavirus, possibly by horizontal gene transfer. Virophages evolved from an autonomous virus that became specialised to parasitise the ancestor of NCLDVs. The vertical cross-hatching indicates that the trait is found in some but not all members of the group. Acronyms refer to genes and genomic features present in the viral genomes: (pPOLB) (protein-primed DNA polymerase B) , (MCP) (major capsid protein), (mCP) (minor capsid protein), (int) (rve-type integrase), (pro) (adenoviral-like protease), (atp) (FtsK/HerA DNA packaging ATPase), (TIRs) (terminal inverted repeats).
Tables
Table 1
Comparison between the nuclear-escape and alternative maximum-likelihood models based on the Akaike information criterion (AIC).
The log-likelihoods for the models were obtained from the best maximum-likelihood tree consistent with each hypothesis found in RAxML-NG (Kozlov et al., 2019). Results are shown for the concatenated data set of four core proteins (ATPase, protease, major capsid, and minor capsid) and for the protease, major and minor capsid proteins, respectively. The AIC was size-corrected given that the alignment (sample) size was small relative to the number of free parameters, that is n/k<40 (Posada and Buckley, 2004; Symonds and Moussalli, 2011). The best model is highlighted in boldface. The ‘alternatives’ refer to non ‘nuclear-escape’ scenarios, that is, models which are not consistent with the predictions made by the nuclear-escape.
| Model | Characters | Log-likelihood | AIC* | AICc† | ΔAICc‡ | Weight§ |
|---|---|---|---|---|---|---|
| Nuclear-escape (M0) | Concatenated | –41,618.19 | 83,616.37 | 83,864.09 | 11.41 | 0.003 |
| Alternatives (M1) | Concatenated | –41,612.48 | 83,604.96 | 83,852.68 | 0.00 | 0.997 |
| Nuclear-escape (M0) | Protease | –6,323.233 | 12,898.47 | 10,898.22 | 11.37 | 0.003 |
| Alternatives (M1) | Protease | –6,317.550 | 12,887.10 | 10,886.85 | 0.00 | 0.997 |
| Nuclear-escape (M0) | Major capsid | –16,305.52 | 32,861.04 | 34,173.54 | 1.90 | 0.279 |
| Alternatives (M1) | Major capsid | –16,304.57 | 32,859.14 | 34,171.64 | 0.00 | 0.721 |
| Nuclear-escape (M0) | Minor capsid | –10,234.56 | 20,719.11 | 17,855.48 | 5.62 | 0.057 |
| Alternatives (M1) | Minor capsid | –10,231.75 | 20,713.50 | 17,849.86 | 0.00 | 0.943 |
-
*
.
-
†
.
-
‡
.
-
§
.
Table 2
Posterior model odds of the nuclear-escape and alternative hypotheses using concatenated and single-protein data sets.
Tree topologies consistent with each hypothesis were filtered and counted from a Bayesian MCMC following the method of Bergsten et al., 2013. All ratios favour the alternative scenarios to the nuclear-escape hypothesis. The best model is highlighted in boldface. The ‘alternatives’ refer to non-’nuclear-escape’ scenarios, that is, models which are not consistent with the predictions made by the nuclear-escape.
| Model | Characters | MCMC tree frequency | Posterior model oddsP(M0 | X)/P(M1 | X) |
|---|---|---|---|
| Nuclear-escape (M0) | Concatenated | 15/28,001 (0.0536%) | 5.36 ⋅ 10–4 < 1 |
| Alternatives (M1) | Concatenated | 27,986/28,001 (99.946%) | |
| Nuclear-escape (M0) | Protease | 333/200,001 (0.166%) | 1.66 ⋅ 10–3 < 1 |
| Alternatives (M1) | Protease | 199,668/200,001 (99.998%) | |
| Nuclear-escape (M0) | Major capsid | 20,605/200,001 (10.302%) | 1.15 ⋅ 10–1 < 1 |
| Alternatives (M1) | Major capsid | 179,396/200,001 (89.697%) | |
| Nuclear-escape (M0) | Minor capsid | 128/200,001 (0.0639%) | 6.39 ⋅ 10–4 < 1 |
| Alternatives (M1) | Minor capsid | 199,873/200,001 (99.936%) |
Table 3
Bayesian stepping-stone analysis of the nuclear-escape and alternative hypotheses.
Each scenario was run on the concatenated data set in MrBayes 3 (Ronquist and Huelsenbeck, 2003) for 20 million generations (average standard deviation of split frequencies <0.01). The Bayes factor strongly rejects a sister relationship between adenoviruses and NCLDVs (nuclear-escape hypothesis). The best model is highlighted in boldface. The ‘alternatives’ refer to non ‘nuclear-escape’ scenarios, that is, models which are not consistent with the predictions made by the nuclear-escape.
| Model | Likelihood of best state (cold chain) | Log-Marginal-likelihood (ln) | Mean Log-marginal-likelihood (ln) | Bayes factorP(X | M0)/P(X | M1) |
|---|---|---|---|---|
| Nuclear-escape (M0) | Run 1: –36,318.81 | Run 1: –36,376.42 | –36,353.44 | 3.5×10–94 << 1* |
| Run 2: –36,318.81 | Run 2: –36,352.75 | |||
| Alternatives (M1) | Run 1: –35,965.90 | Run 1: –36,137.56 | –36,138.25 | |
| Run 2: –35,981.46 | Run 2: –36,450.19 |
-
*
Strong support against M0.
Additional files
-
Supplementary file 1
Viral species included in the final multiple sequence alignments (54 taxa) with their accession numbers and source reference.
- https://cdn.elifesciences.org/articles/86617/elife-86617-supp1-v2.docx
-
Supplementary file 2
Distribution of root positions calculated from the MCMC posterior tree sample.
The best supported position of the root was on the branch leading to virophages (53.9%), followed by NCLDVs and metagenomic PLV BS539 (27.4%). Other root positions received <6% support. The frequencies of trees with a certain position of the root were estimated by filtering different topologies in PAUP. Number of generations = 140 million.
- https://cdn.elifesciences.org/articles/86617/elife-86617-supp2-v2.docx
-
Supplementary file 3
Cytoplasmic linear plasmids used for querying the databases in search for protein homologues.
- https://cdn.elifesciences.org/articles/86617/elife-86617-supp3-v2.docx
-
MDAR checklist
- https://cdn.elifesciences.org/articles/86617/elife-86617-mdarchecklist1-v2.pdf
Download links
A two-part list of links to download the article, or parts of the article, in various formats.
Downloads (link to download the article as PDF)
Open citations (links to open the citations from this article in various online reference manager services)
Cite this article (links to download the citations from this article in formats compatible with various reference manager tools)
A billion years arms-race between viruses, virophages, and eukaryotes
eLife 12:RP86617.
https://doi.org/10.7554/eLife.86617.3


