Nova proteins direct synaptic integration of somatostatin interneurons through activity-dependent alternative splicing
- Department of Neurobiology, Harvard Medical School, United States
- Biological and Environmental Sciences and Engineering Division (BESE), King Abdullah University of Science and Technology (KAUST), Saudi Arabia
- Stanley Center at the Broad, United States
- NYU Neuroscience Institute and the Department of Neuroscience and Physiology, Smilow Research Center, New York University School of Medicine, United States
- Center for Genomics & Systems Biology, New York University, United Arab Emirates
- Genome Technology Center, Applied Bioinformatics Laboratories, NYU Langone Medical Center, United States
- Laboratory of Molecular Neuro-Oncology, The Rockefeller University, United States
Figures
Figure 1
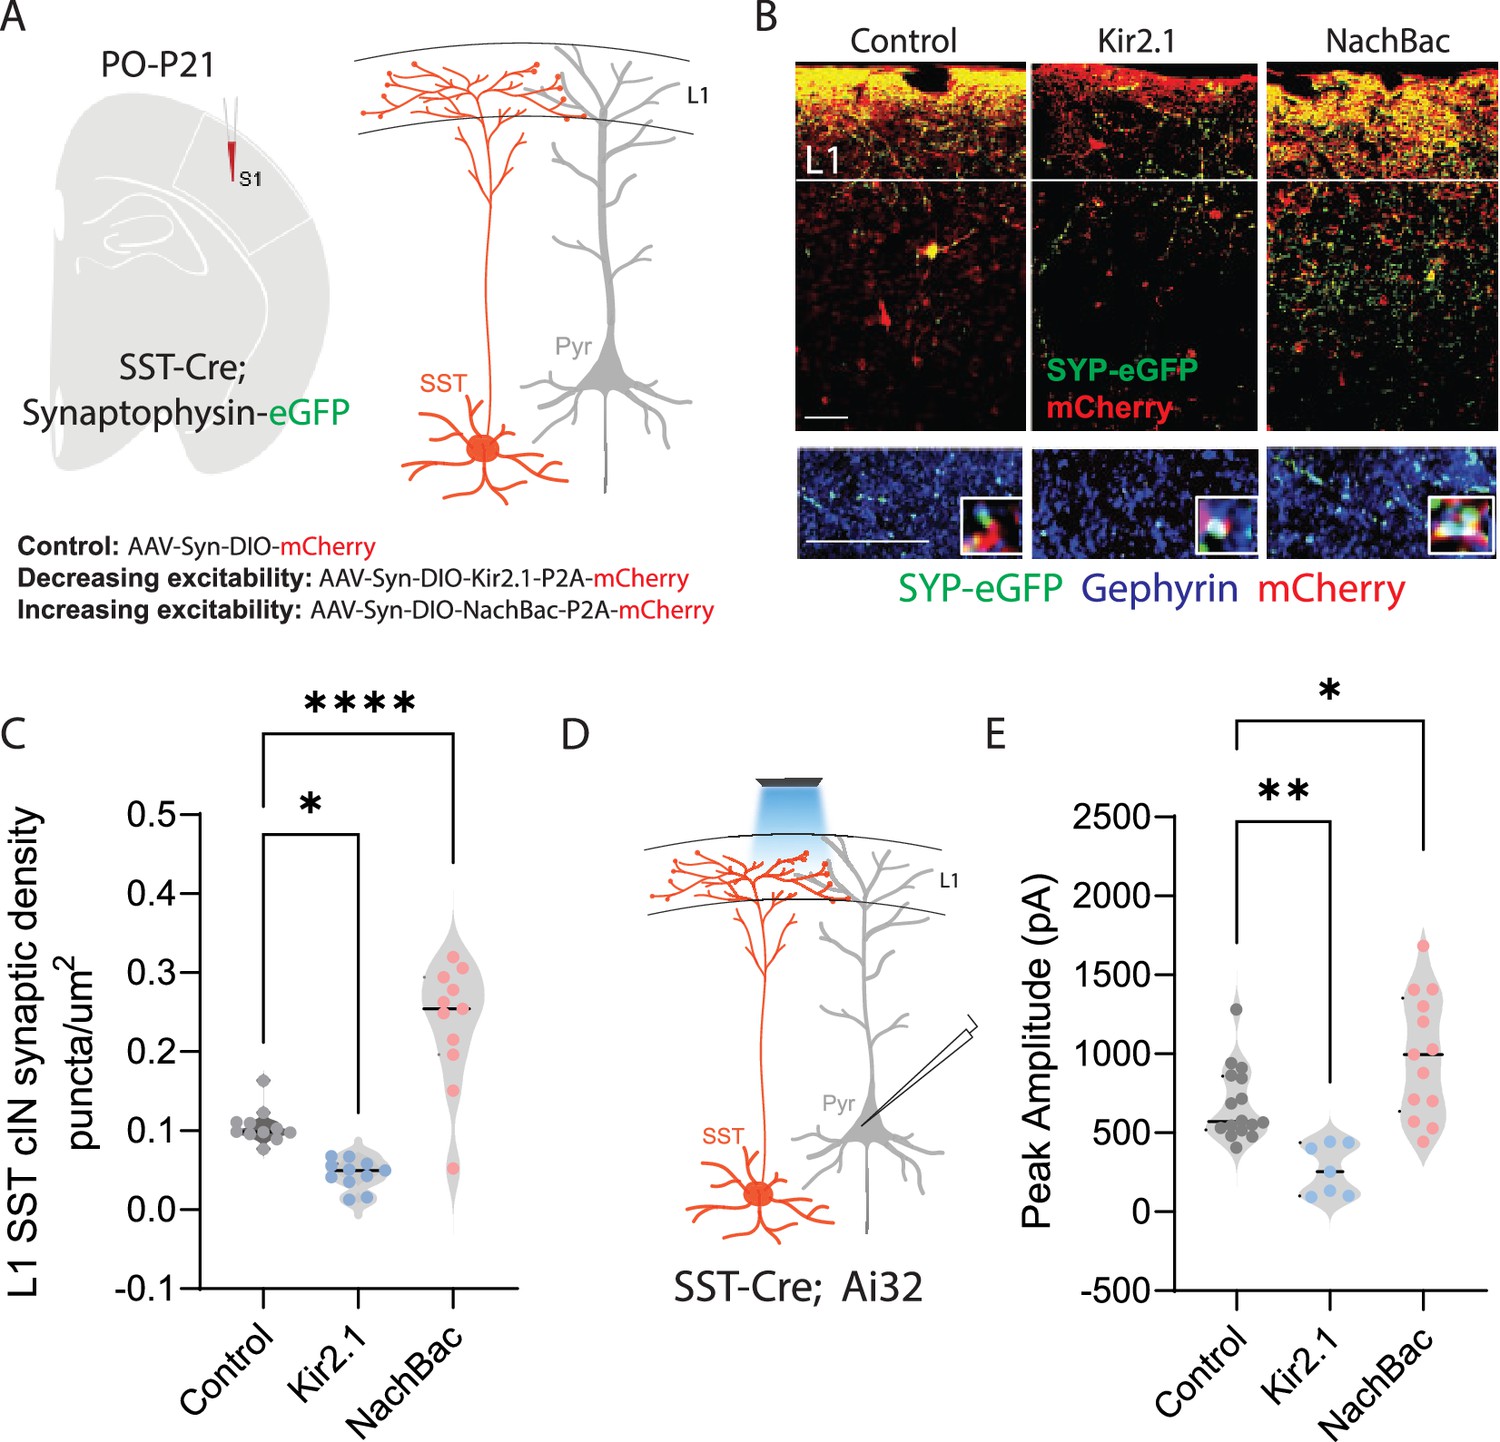
Neuronal activity affects the synaptic development of SST cINs.
(A) Schematic ( (A) has been adapted from the Research Article Summary Schematic from Bernard et al., 2022) of genetic alleles (left) and experimental approach (middle), SstCre;Syp-eGFP pups were injected with a conditional virus; either AAV2/1-Flex-Kir2.1-P2A-mCherry, AAV2/1-Flex-NaChBac-P2A-mCherry, or Control AAV2/1-Flex-mCherry within the S1 cortex at postnatal day 0 (P0). Schematic of the efferent connectivity of SST +Martinotti cells (right). (B) Upper panels: Immunostaining (IHC) of SstCre;Syp-eGFP in layer 1 (L1) of S1 cortex at P21 showing Syp-eGFP (green, anti-GFP) and axons (red, anti-RFP) from control, Kir2.1, or NaChBac injected SST +Marintonotti cINs (scale bar 50 um). Lower panels: visualization of Syp-eGFP (green, anti-GFP) and Gephyrin +puncta (blue, anti-Gephyrin) in L1 SST +cINs (scale bar 20 um). Inset shows a higher magnification image of the puncta overap (Red, mCherry axons). (C) Quantification of synaptic puncta (RFP+/GFP+/Gephyrin +overlap) of control, Kir2.1, and NaChBac expressing SST +cINs within L1 (n=3–4 mice each, 9 sections each; pVal**=0.008, ***=0.0001). (D) Left, schematic of optogenetic activation of SST neurons using SSTCre::Ai32 mice injected with either AAV2/1-Flex-Kir2.1-P2A-mCherry, AAV2/1-Flex-NaChBac-P2A-mCherry, or Control AAV2/1-Flex-mCherry within the S1 cortex at postnatal day 0 (P0) and recording from Pyramidal neurons (clamped at 0 mV) in Layer 5 of Primary Somatosensory cortex (S1) at P21. (E) Quantification of SST output onto Pyramidal neurons, Peak amplitude of the Inhibitory post synaptic current (IPSC) (Control Peak Amplitude: 663.47±18.7 pA, Kir2.1: 185±19.78 pA, NachBac: 927.7±28.5 pA).
Figure 2 with 2 supplements

Neuronal activity influences alternative splicing and Nova expression within SST cINs.
(A) Schematic of experimental approach: Postnatal day 8 (P8) SstCre; Rosa26LSL-tdTomato (Ai9) pups were subjected to electroconvulsive shock (ECS) (left). Following 2–3 hours the S1 cortex was isolated and SST + cINs were FACS purified (middle). SST + cINs were then prepared for RNAseq to assess changes in gene expression and alternative splicing. Splicing changes are divided into the major alternative structural motifs: single exon, SE, retained intron, RI, mutually exclusive exons, MXE, alternative 5’ splice site, A5, alternative 3’ splice site, A3 (right). (B) Histogram of the magnitude of activity-dependent splicing changes within SST + cINs subjected to ECS compared to sham SST + cINs (FDR <0.5, fold <0.1> ), depicting 139 differential spliced SE (82 SE included, 57 SE excluded), 66 differential spliced RI (53 RI included, 13 RI excluded), 55 differential spliced MXE (26 included, 29 excluded), 13 differential spliced A5 (12 included, 1 excluded), 39 differential spliced A3 (16 included, 23 excluded). (C) Gene Ontology (GO) analysis of differentially alternatively spliced (AS) genes (Orange color) under synaptic categories. (D) Gene Ontology (GO) analysis of differentially expressed genes (GE) (Teal color) under synaptic categories. (E) Overlap of all differentially expressed (teal) and differentially spliced (orange) genes under ECS vs control conditions. Below: overlap for synaptic gene only. (F) Comparison of activity level of the overlapped synaptic genes (genes that have both AS and GE changes). Activity level is calculated by considering both FC and pvalue. (G) Sashimi plot illustrating Nxrn1 exon 10 exclusion in activity-induced SST cINs in green (bottom) compared to sham SST cINs in grey (top). Reads per kilobase of transcripts (RPKM) gives the count of the number of transcripts for a specfic isoform. (H) Histogram of the average motif enrichment score of known activity-regulated splicing factors KHDRBS1 (Sam68), KHDRBS2 (SLM2), Rbfox1 and Nova1/2 (right). Green dots represent -log10 adjusted p value (right Y-axis) for motif enrichment scores, only significant enrichment shown.
Figure 2—figure supplement 1
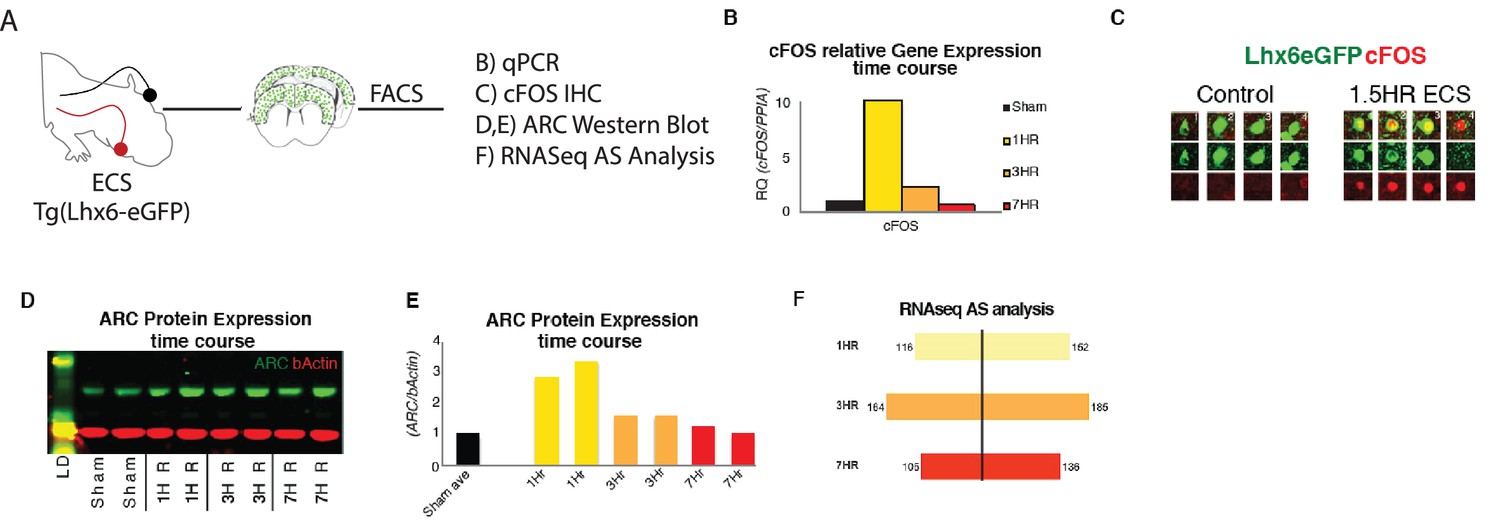
Acute increases in neuronal activity induces immediate early gene expression and differential splicing within SST + cINs in vivo.
(A) Schematic of experimental approach: P8 tgLhx6eGFP animals were subjected to ECS (left)’ then following a time course of 1 Hr, 3 hr, or 7 hr the S1 cortex was dissected (middle) and GFP +cINs were isolated by FACS for qPCR, Western blot, and RNAseq analysis and IHC (right). (B) Quantification of relative mRNA expression (RQ) of cFOS (normalized to housekeeping gene PPIA) in ctl/sham animals (black), 1 hr (yellow), 3 hr (orange), and 7 hr (red) following ECS within cINs. (C) Immunostaining of cFOS in sham (red) and eGFP vs ECS-treated animals, showing the expression of cFOS 1.5 hr post ECS activity induction. (D) Representative western blot of ARC protein expression within sham treated (two replicates), 1 hr (two replicates), 3 hr (two replicates), and 7 hr (two replicates) following ECS within cINs (Source Data not available due to loss of data file during lab move). (E) Fold of ARC protein expression (normalized to b-actin) in ctl/sham treated (black), 1 hr (yellow), 3 hr (orange), and 7 hr (red) following ECS within cINs. (F) Magnitude of differential alternative splicing events from the comparison of sham cINs to cINs 1 hr (yellow, 268 events), 3 hr (orange, 349 events), and 7 hr (red, 241 events) following ECS.
Figure 2—figure supplement 2
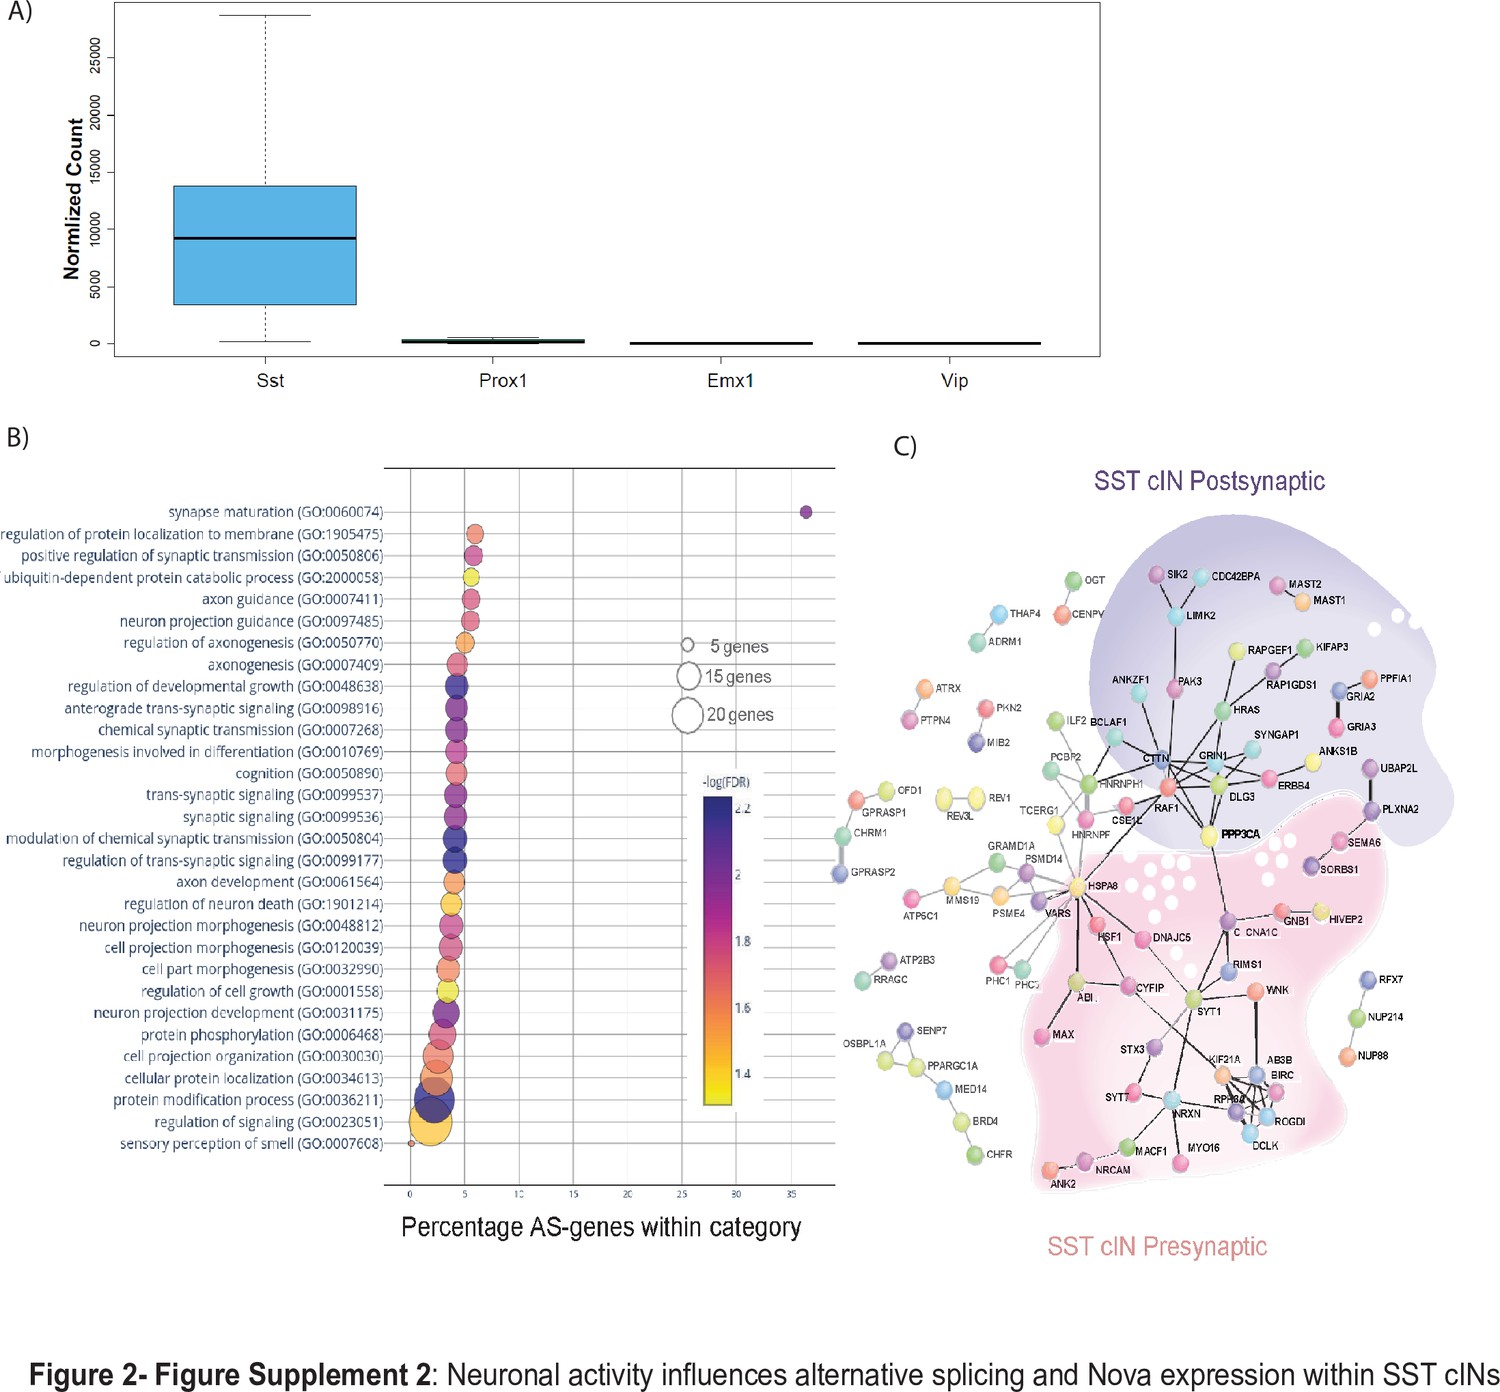
Neuronal activity influences alternative splicing and Nova expression within SST cINs.
(A) Normalized counts of SST, Prox1, Emx1 and Vip gene expression from the RNA sequencing analysis from control tissue indicating the purity of our sample preparation to be specific for SST + cINs. (B) Bubble dot plot of gene ontology (GO) most significant terms for the genes subjected to activity-dependent alternative splicing within SST + cINs (false discovery rate (FDR)<0.05), x-axis is the enrichment of the activity-dependent AS genes in the GO category (# of genes in GO category from SST transcriptome/ # of genes activity-dependent AS in category). Color of dot indicates magnitude of significance (-log10 transform FDR, none shown above FDR <0.05) and size corresponds to number of genes in category. (C) Protein-protein interaction (PPI) network formed from 312 activity-dependent spliced genes in SST cINs with Disease Association Protein-Protein Link Evaluator (DAPPLE; Rossin et al., 2011) and performed over 10,000 permutations (pVal <0.00009). Green shading- post-synaptic gene network, pink shading- pre-synaptic gene network.
Figure 3 with 1 supplement
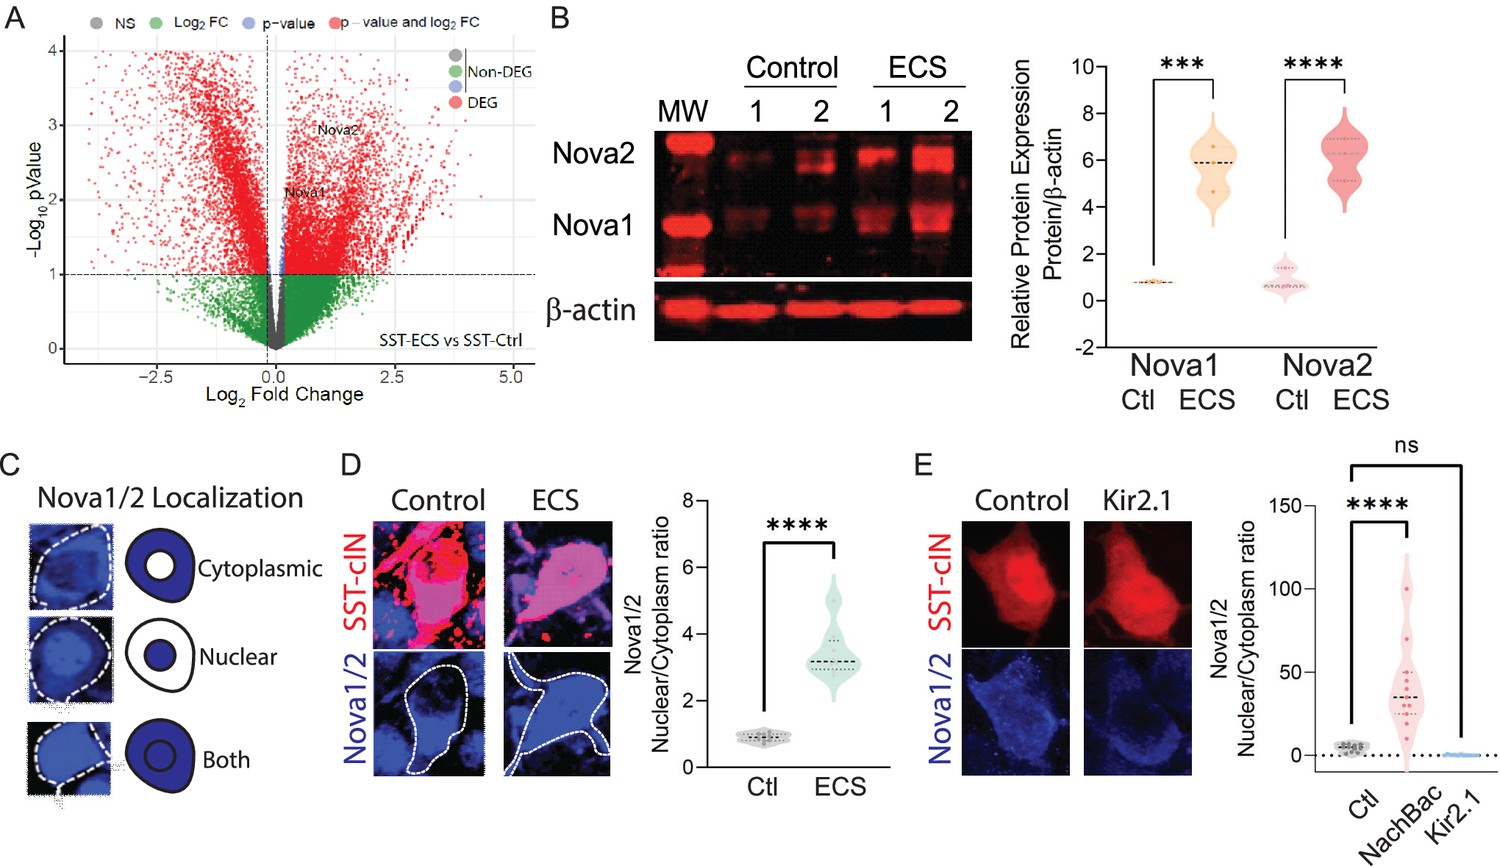
Neuronal activity during cortical development influences the expression and localization of Nova proteins in SST cINs.
(A) Volcano plot of RNA seq data showing Nova1 and Nova2 upregulation in SST-cINs in ECS vs control. (B) Upper panel, western blot showing Nova1 and Nova2 protein expression in control (lanes 2 and 3) versus ECS induced SST cINs (lanes 4 and 5). Lower panel, same western blot showing expression of b-actin across lanes. Right, Quantification of the western blot data. Nova1 and Nova2 protein expression relative to β-actin in control versus ECS induced SST cINs (n=3 mice, S1 cortex only; *pVal = 0.038, Nova1; *pVal = 0.022, Nova2; Source Data not available due to loss of data file during lab move). (C) Representative scoring criteria for Nova1/2 localization within SST cINs: IHC of Nova1/2 (blue, anti-Nova1/2) in selective SST + cINS exemplifying the Nova1/2 expression in: cytoplasm only (top), nucleus only (middle) and in both cytoplasm and nucleus (bottom). (D) Left, representative images of Nova1/2 expression (blue) in SST cINs (red) under normal versus ECS. Right, Quantification of the ratio of nuclear to cytoplasmic localization of Nova1/2 in SST + cINs of control animals (grey) and ECS animals (green) (n=3 mice, S1 cortex; **pVal = 0.001). (E) Left, representative images of Nova1/2 expression (blue) in SST cINs (red) using control mCherry versus Kir2.1-mCherry virus injection. Right, Quantification of the ratio of nuclear to cytoplasmic localization of Nova1/2 in SST + cINs of control AAV2/1-Syn-DIO-mCherry (grey) versus AAV2/1-Syn-DIO-NaChBac-P2A-mCherry (pink) versus AAV2/1-Syn-DIO-Kir2.1- P2A-mCherry (blue) injected animals. (n=11 mice, S1 cortex,~30 cells each; ***pVal = 0.0004, NachBac; ***pVal = 0.0001, KIR2.1).
Figure 3—figure supplement 1
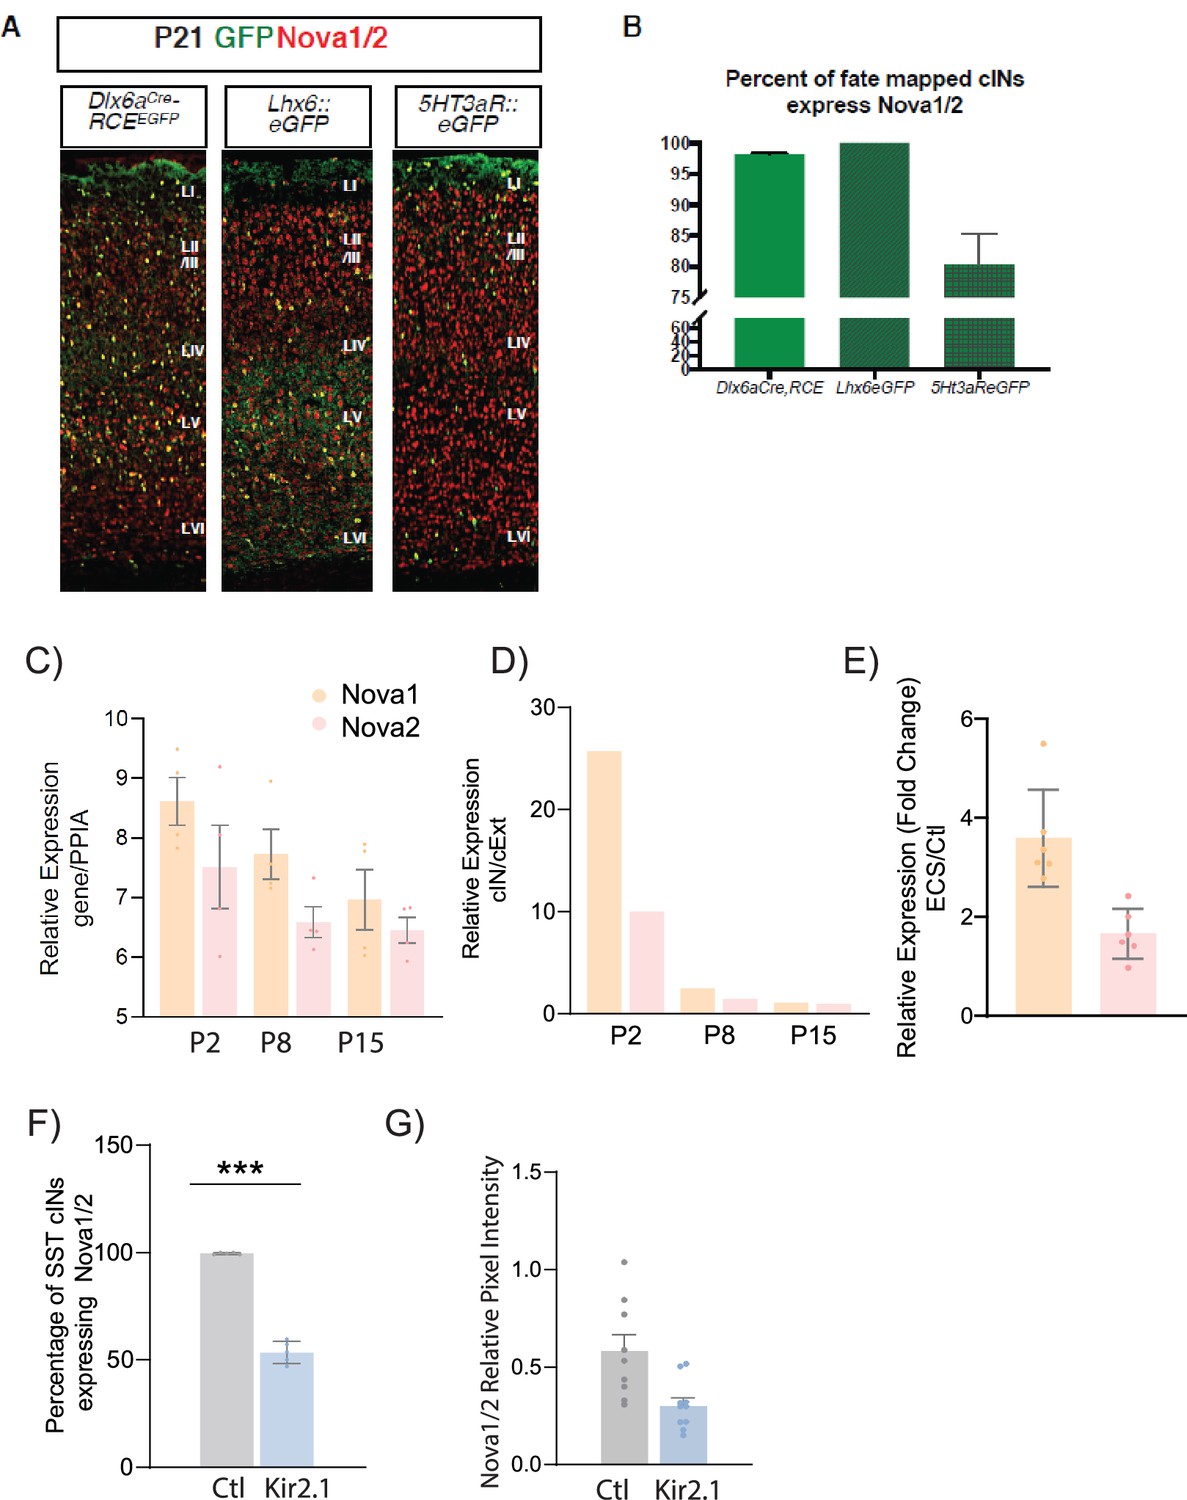
Nova 1 and 2 alternative splicing factors expression within cortical interneurons (cINs).
(A) Representative IHC image of brain section at P21 from Dlx6aCre;RCEeGFP, Lhx6::eGFP and 5HT3aR::eGFP. Anti-Nova1/2 (red); GFP (green). (B) Quantification of eGFP cells expressing Nova1/2. 100% of Lhx6::eGFP cells express Nova1/2. (C) Relative gene expression of Nova1 (orange) and Nova2 (pink), normalized to house-keeping gene Peptidyl prolyl isomerase A (PPIA) using qPCR from Lhx6-eGFP sorted cINs at Postnatal age (P) P2, P8, and P15 (n=4 mice each, S1 cortex only). (D) Fold change of the relative expression of Nova1 and Nova2 between cINs and excitatory neurons (cExt) showing an enrichment of Nova expression in cINs at early developmental ages (n=4 mice each, S1 cortex only). (E) Relative expression of Nova1 and Nova2 genes (using qPCR) of ECS induced SST cINs relative to controls (n=4–6 mice, S1 cortex only; **pVal = 0.002, Nova1; **pVal = 0.005, Nova2). (F) Quantification of the number of Nova1/2-expressing SST +cINs of control AAV2/1-Flex-mCherry (grey) and AAV2/1-Flex-Kir2.1- P2A-mCherry (blue) injected animals. (n=7, S1 cortex,~27 cells each; ***pVal = 0.0001). (G) Representative images of Nova1/2 expression, Left: control SST cIN (injected with mCherry), Right: KIR2.1+SSt cIN at P21. Right, Quantification of Nova1/2 protein pixel intensity (normalized to area) from ctl SST cINs (grey) and KIR2.1+SST cINs (blue) (n=10; **pVal = 0.006).
Figure 4 with 2 supplements
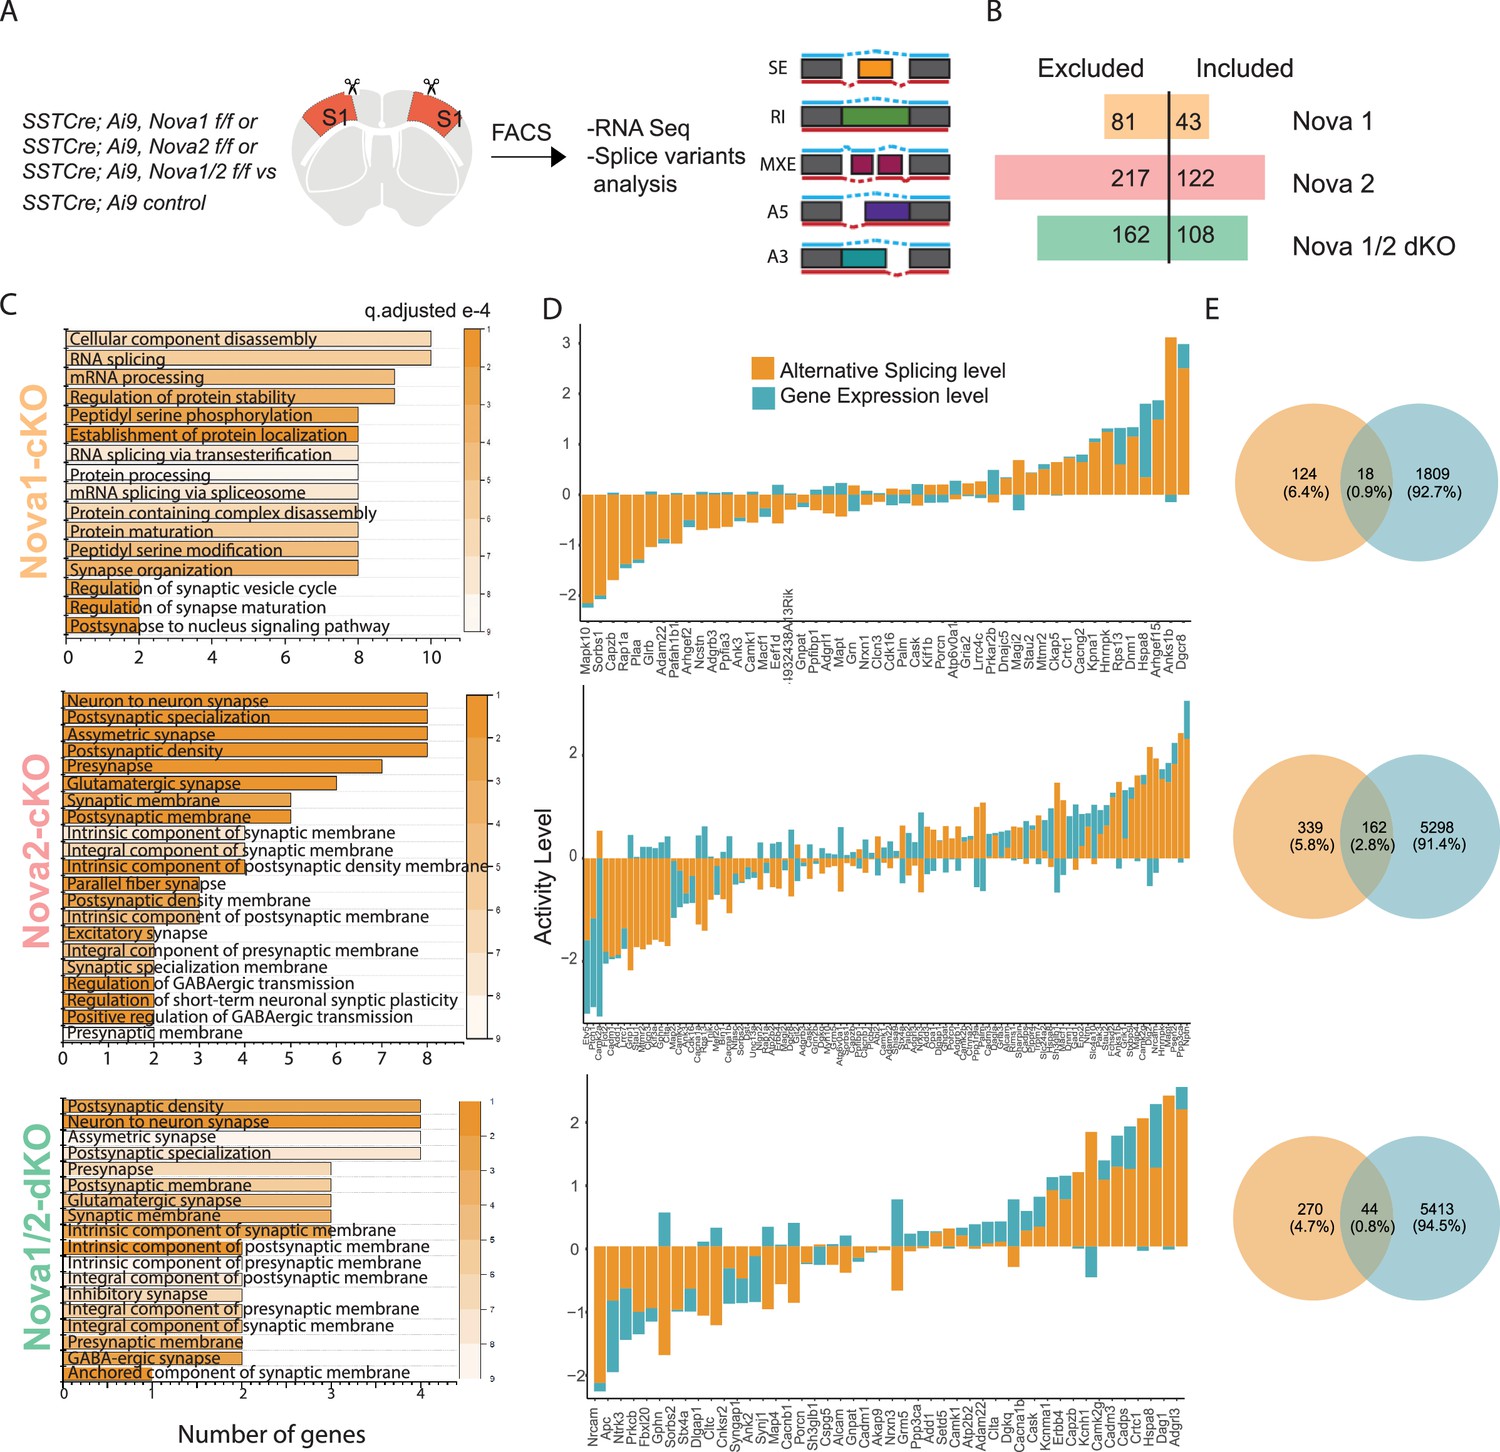
Nova1 and Nova2 control distinct alternative splicing (AS) networks within SST cINs.
(A) Schematic demonstrating the mouselines used for FACS sorting and subsequent RNA sequencing and splice variant analysis: SST cINs from Sst-Cre;Nova1F/F (Sst-Nova1-cKO) or Sst-Cre;Nova2F/F (Sst-Nova2-cKO) or Sst-Cre;Nova1F/F/Nova2F/F (Sst-Nova1/2-dKO) mice on an Ai9 reporter background (referred to henceforth at Sst-Nova1-cKO, Sst-Nova2-cKO and Sst-Nova1/2-dKO, respectively). (B) Plot showing the number of alternative splicing (AS) events in Sst-Nova1-cKO, Sst-Nova2-cKO or Sst-Nova1/2-dKOs. Nova1 loss resulted in 124 altered AS events (81 excluded and 43 included), Nova2 loss led to 339 altered AS events (217 excluded and 122 included) and double mutants exhibited 270 altered AS events (162 excluded and 108 included; FDR <0.05). (C) Gene Ontology (GO) analysis of differentially alternatively spliced (AS) genes under synaptic categories for SST-Nova1-cKO (orange label, top panel); Sst-Nova2-cKO (pink label, middle panel) and for Sst-Nova1/2-dKO (green label, bottom panel). Color bar indicated q-adjusted values for splice variant expression. (D) Comparison of the level of alternative splicing activity vs gene expression for the overlapped synaptic genes (i.e., genes that show both AS and GE changes) for Sst-Nova1-cKO (top panel), Sst-Nova2-cKO (middle panel) and for Sst-Nova1/2-dKO (bottom panel). Activity level is calculated by considering both Fold change and pValue for each gene. (E) Percentage of genes that overlap between gene expression and alternative splicing changes FC >0.5 for Sst-Nova1-cKO (top), Sst-Nova2-cKO (middle) and Sst-Nova1/2-dKO (bottom panels).
Figure 4—figure supplement 1
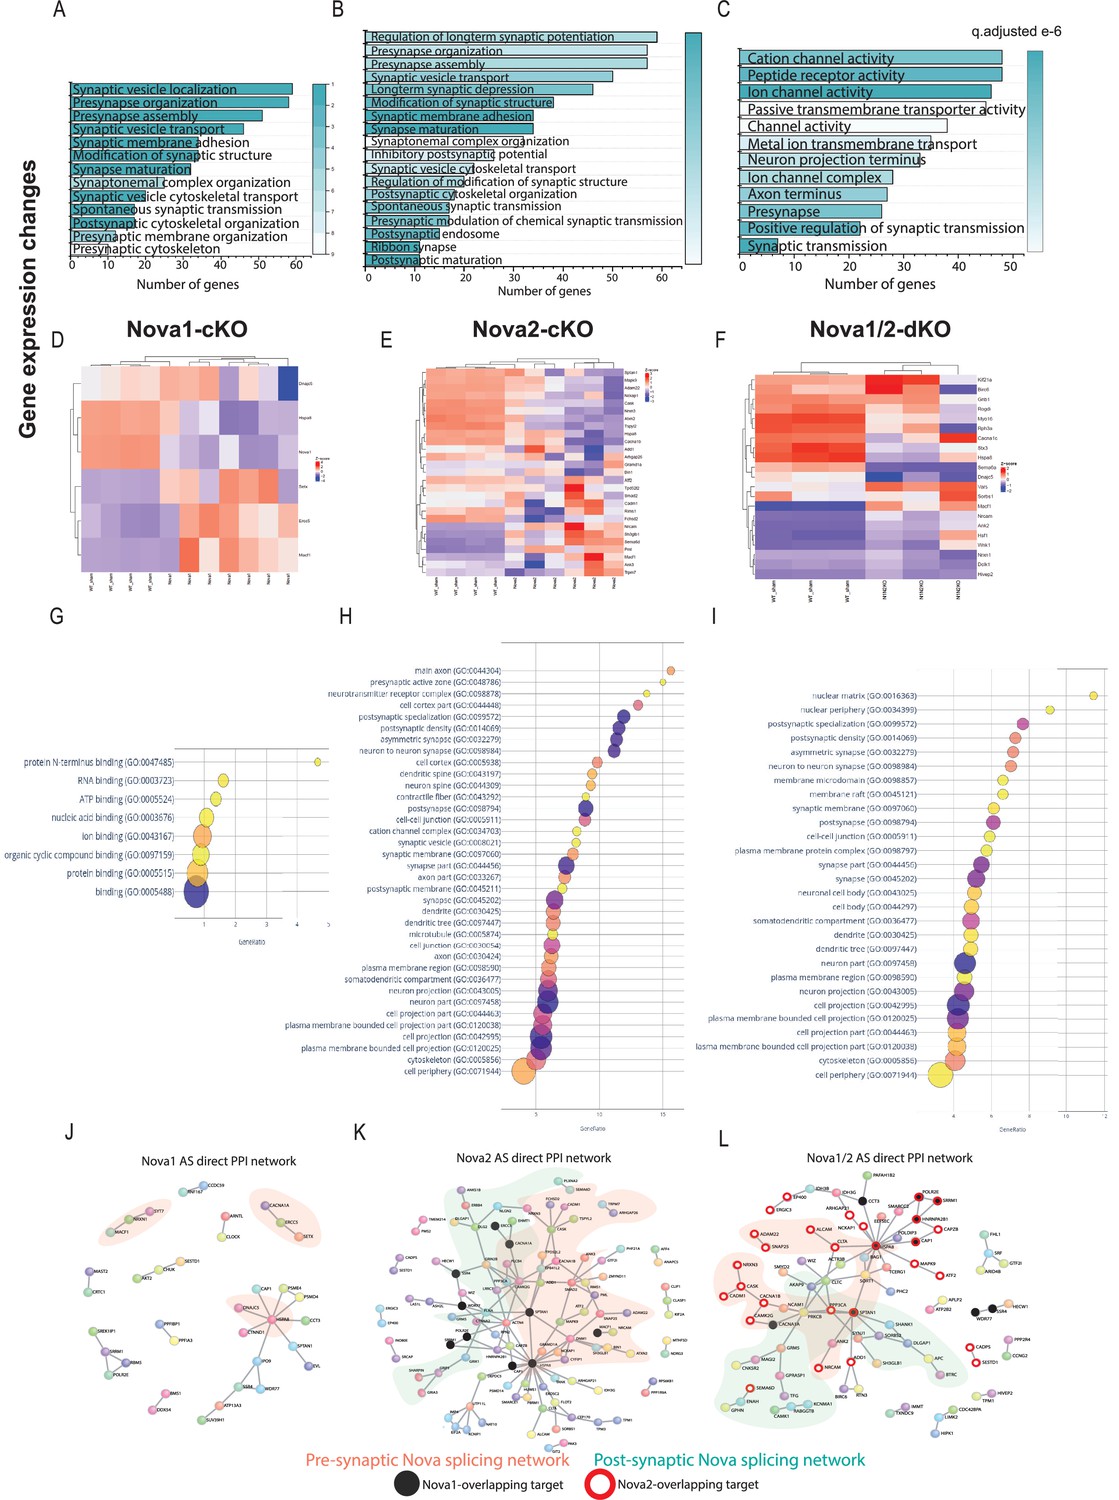
Nova2 controls most of the gene expression and splicing events of the Nova1/2 family within SST + cINs and these events coalesce into GO categories and PPI networks related to pre- and post-synaptic development of SST cINs.
(A–C) Gene ontology analysis of differentially expressed synaptic genes in Nova1-cKO (A), Nova2-cKO (B), and Nova1/2-dKO (C) Color bar indicates adjusted q-value. (D–F) Examples of some upregulated and downregulated genes in Nova1-cKO (D), Nova2-cKO (E) and Nova1/2-dKO (F). (G) Bubble dot plot of most significant GO terms for the genes subjected to AS within SST-Nova1-cKO, x-axis is the percent enrichment of the AS genes in the GO category (#genes SST-Nova1 AS in category divided by #genes in GO category from SST transcriptome). Color of dot indicates magnitude of significance (-log10 FDR, none shown above FDR <0.05) and size corresponds to number of genes in category. (H) Bubble plot of most significant GO terms of SST-Nova2-cKO genes subjected to AS illustrating the substantial enrichment of Nova2-dependent events to synaptic development. (I) Same as G-H but for Nova1/2-dKO (J) Protein-protein interaction (PPI) network formed from 124 Nova1-cKO spliced genes in SST cINs with DAPPLE (10,000 permutations, pVal <0.09), pink shading labels genes that belong in synapse related GO categories. (K) PPI network formed from 339 Nova2-cKO spliced genes in SST-cINs with DAPPLE (10,000 permutations, pVal <0.00009). Black dots indicate shared genes with Nova1-cKO, green shading labels postsynaptic genes that belong in synapse-related GO categories, pink shading labels pre-synaptic genes in synapse GO categories. (L) PPI network in Nova1/2-dKO. 270 Nova1/2-dKO splice genes in SST cINs with DAPPLE (pVal <0.00009) Red dots indicate overlap with Nova2, whereas black dots indicate overlap with Nova1-cKO.
Figure 4—figure supplement 2
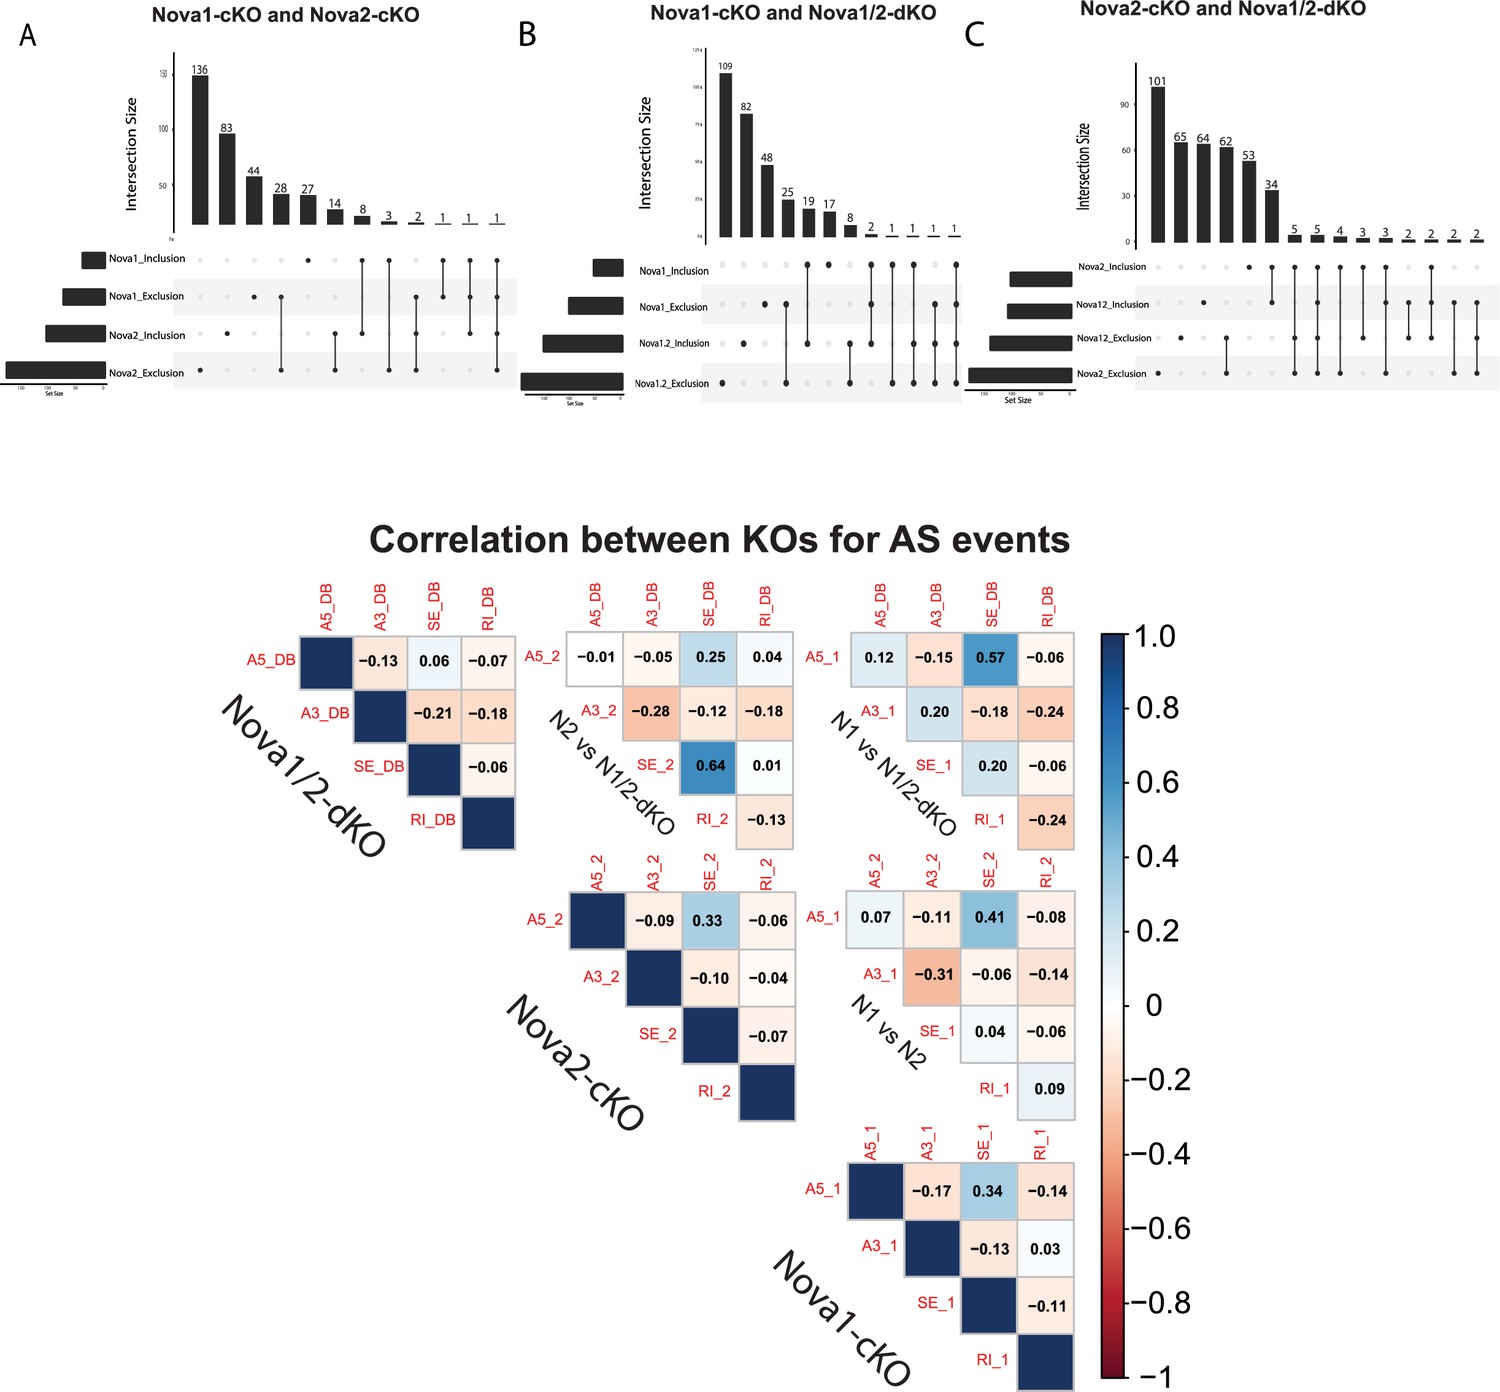
Overlap in Alternative Splice events between SST-Nova 1, SST-Nova 2 and SST-Nova1/2 dKO.
(A) Quantification of the overlap of SST-Nova1-cKO and SST-Nova2-cKO splicing events. Bottom left horizontal bars indicate the number of genes subjected to AS events for each data set: Nova1_inclusion splice events (43), Nova1_exclusion splicing events (81), Nova2_inclusion splicing events (122), Nova2_exclusion splicing events (217). Top histogram bars indicate the magnitude of overlap between the data sets indicated by a filled black circle below (i.e. 136 of Nova2_exclusion events overlap with other sets, 28 of Nova1_exclusion events overlap with Nova2_exclusion etc.) (B) Similar to A, but Nova1-cKO and Nova1/2-dKO overlap. Bottom left horizontal bars indicate number of genes subjected to AS events in each dataset. Nova1_inlcusion splicing events (43), Nova1_exclusion (81). Nova1/2_inclusion (108), Nova1/2_exclusion (162). Top histogram bars indicate the magnitude of overlap between the two datasets. Twenty-five of Nova1_exclusion events overlap with Nova1/2_exclusion; 19 of Nova1_inclusion overlaps with Nova1/2_inclusion etc. (C) Similar to B, but Nova2-cKO and Nova1/2-dKO overlap. 62 of Nova2_exclusion events overlap with Nova1/2; 34 of Nova2_inclusion events overlap with Nova1/2. (D) Overall correlation between Nova1, Nova2, and Nova1/2-dKO for each type of splice event.
Figure 5 with 1 supplement
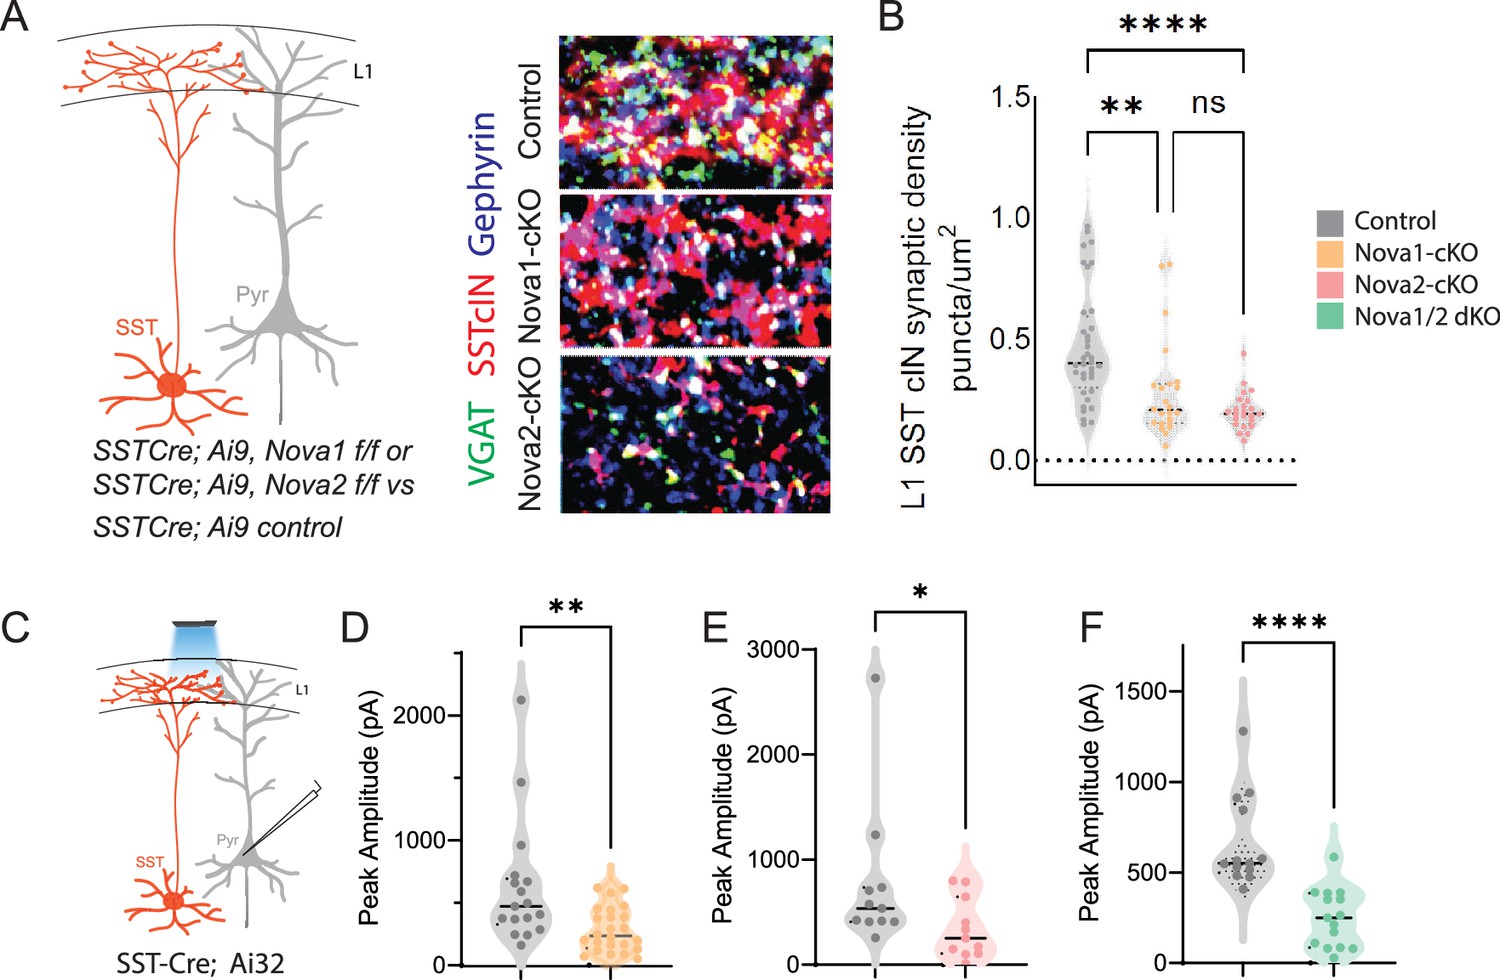
SST-Nova1 and SST-Nova2 mutants have impaired afferent and efferent connectivity.
(A) SST +cINs efferent structure: IHC of anti-RFP (red), anti-VGAT (green), and anti-Gephyrin (blue) to label the SST +cIN axonal synaptic puncta (RFP+/VGAT+/Gephyrin +puncta, white) in L1 S1 cortex of Sst-Ctl, Sst-Nova1-cKO, and Sst-Nova2-cKO mutant animals. (B) Quantification of the density of SST +cIN efferent synaptic puncta (RFP+/VGAT+/Gephyrin+) in L1 S1 cortex of Sst-Ctl (n=26, S1 cortex from 3 mice), Sst-Nova1-cKO (n=26, S1 cortex, from 3 mice) and Sst-Nova2-cKO (n=15, S1 cortex from 3 mice) mutant animals. **pVal = 0.003, Sst-Nova1-cKO; ***pVal <0.0001, Sst-Nova2-cKO. (C) Schematic of channelrhodopsin (ChR2) experimental approach: SstCre control, Sst-Nova1-cKO, Sst-Nova2-cKO or Sst-Nova1/2-dKO mutant mice were crossed with the Ai32 reporter line that expresses ChR2 in a Cre-dependent manner. Blue light was delivered through the objective to record inhibitory response (IPSC) in neighboring excitatory neuron (grey). (D–F) Quantification of the peak IPSC amplitudes recorded in excitatory neurons following SST stimulation in Sst-Nova1-cKO (D), Sst-Nova2-cKO (E) and Nova1/2-dKO (F) (n=20 cells from 3 mice each; **pVal = 0.0037, Sst-Nova1-cKO; **pVal = 0.0021, Sst-Nova2-cKO, ***pVal <0.001).
Figure 5—figure supplement 1

Conditional loss of Nova1/2 within SST +cINs impacts animal survival and disrupts their afferent synaptic connectivity.
(A) Survival plot of conditional knockouts within SstCre; Rosa26LSL-tdTomato (Ai9) animals (WT SstCre; Ai9 animals black line, double heterozygous (het) SstCre; Rosa26LSL-tdTomato (Ai9); Nova1f/+, Nova2f/+ slashed purple line (Dbl,cHet), SstCre; Rosa26LSL-tdTomato (Ai9), Nova1f/f black line, SstCre; Rosa26LSL-tdTomato (Ai9), Nova2f/f black line, double knockout SstCre; Rosa26LSL-tdTomato (Ai9) Nova1f/f Nova2f/f turquoise line) at P8 50% of double conditional SstCre; Rosa26LSL-tdTomato (Ai9), Nova1f/f Nova2f/f (dKO) animals have deceased by P50 90% of double conditional animals have deceased. Whereas at P30 40% of Dbl, cHet animals and by P60 50% have deceased. WT and singular conditional mutants do not exhibit decreased survival. (B) SST +afferents: IHC of representative SST +cIN dendrite of anti-RFP (red), anti-VGLUT1 (green), and anti-Homer1c (blue) to label excitatory synaptic puncta overlapping with SST +cINs dendrites (RFP+/VGLUT1+/Homer1c+puncta, white) in S1 cortex of SST-ctl, SST-Nova1-cKO and SST-Nova2-cKO mutant animals. (C) Quantification of the density of excitatory afferent synapses onto SST +cINs within L2/3 and L5/6 of S1 cortex of SST-ctl, Sst-Nova1-cKO and Sst-Nova2-cKO mutant animals. (n=23, 3 mice each; *pVal = 0.028, SST-Nova1-cKO; *pVal = 0.012, SST-Nova2-cKO). (D) Schematic of experimental approach recording mini-excitatory postsynaptic potentials (mEPSCs) in SST +cINs in the S1 cortex (red). (H) Quantification of mEPSCs frequencies from SST +cIN Ctl, Sst-Nova1-cKO and Sst-Nova2-cKO mutant animals (n=15 cells from 3 mice of each genotype) (E) Representative mEPSCs recordings from SST cINs from: Top to bottom: wt animals, grey traces (SstCre; Rosa26LSL-tdTomato (Ai9) or SstCre; Rosa26LSL-tdTomato (Ai9); Nova1f/+ or SstCre; Rosa26LSL-tdTomato (Ai9), Nova2f/+), Nova1-cKO animals, orange traces (SstCre; Rosa26LSL-tdTomato (Ai9), Nova1f/f), Nova2-cKO animals, pink traces (SstCre; Rosa26LSL-tdTomato (Ai9); Nova2f/f), and double Nova1/2-dKO, turquoise traces (SstCre; Rosa26LSL-tdTomato (Ai9), Nova1f/fNova2f/f). Scale bar: 20 pA and 2 s. (F) Quantification of mEPSC frequencies and amplitude recorded from SST cINs in control animals, grey dot (SstCre; Rosa26LSL-tdTomato (Ai9) or SstCre; Rosa26LSL-tdTomato (Ai9), Nova1f/+ or SstCre; Rosa26LSL-tdTomato (Ai9), Nova2f/+), Nova1-cKO animals, orange square (SstCre; Rosa26LSL-tdTomato (Ai9), Nova1f/f), Nova2-cKO animals, pink triange (SstCre; Rosa26LSL-tdTomato (Ai9), Nova2f/f), and double Nova1/2-dKO, turquoise upside-down triangle. **pVal=<0.005 for wt vs. Nova2-cKO and wt vs. Nova1/2-dKO. (G) Cumulative probablility distributions of mEPSC amplitudes from recordings of wt SST cINs, grey line, and Nova1-cKO SST cINs, orange line, exhibiting no difference. (H) Cumulative probability distributions of mEPSC amplitudes from recordings of wt SST cINs, grey line, and Nova2-cKO SST cINs, pink line, exhibiting a significant increase in the amplitude of mEPSCs in Nova2-cKO SST cINs. (I) Cumulative probability distributions of mEPSC amplitudes from recordings of wt SST cINs, grey line, and Nova1/2-cKO SST cINs, turquoise line, exhibiting no difference. (J) Nova2-cKO SST cINs output to L2/3 or L5 pyramidal neurons shows no significant difference. ns, pVal = 0.8 for L2/3 vs L5.
Figure 6 with 2 supplements

Nova RNA binding proteins control-activity-dependent AS in SST cINS during development.
(A) Schematic of experimental approach: Control and Sst-Nova1/2-dKO P8 animals were subjected to ECS then the S1 cortex was isolated to FACS purify SST + cINs followed by RNAseq and splicing analysis. (B) Magnitude of activity-dependent splicing changes within Sst-Nova1/2-dKO subjected to ECS compared to Ctr SST- cINs subjected to ECS (FDR <0.5, fold <0.1 > ), depicting 166 differential spliced SE (106 SE included, 60 SE excluded), 72 differential spliced RI (51 RI included, 21 RI excluded), 70 differential spliced MXE (37 included, 33 excluded), 9 differential spliced A5 (7 included, 2 excluded), 29 differential spliced A3 (9 included, 20 excluded). (C) Synaptic gene ontology (GO) for the differentially spliced genes between ECS control vs ECS Nova1/2-dKO conditions. Color bar indicates adjusted q-value. (D) Synaptic gene ontology (GO) for the differentially expressed synaptic gene categories in the ECS control vs ECS Nova1/2-dKO conditions. (E) Number and percentage of overlap between all differentially expressed genes (FC >0.5, pVal <0.05) and alternatively splice genes. (F) Comparison of the activity level (Fold Change) of alternative splicing (AS) and gene expression (GE) amongst the shared genes that are both differentially expressed and differentially spliced. Inset shows that in the Nrxn1 gene AS level is larger (FC = 2.16) compared to the change in GE level (FC = 0.359). (G) Example RT-PCR validation of alternative splicing (AS) events of activity- and Nova1/2- dependent alternative exon usage within the gene Nrxn1 (top), Gel image of RT-PCR product from the amplification of exon 3 to exon 5 within Sst-ctl cINs (Ctl) (left), ECS-treated Ctl (middle), and ECS- treated Sst-Nova1/2-dKO (right). (H) Quantification of RT-PCR AS events of Nrxn1. *pVal = 0.0194 Ctl vs Ctl + ECS; **pVal = 0.0087 Ctl + ECS vs SST-Nova1/2-dKO+ECS.
-
Figure 6—source data 1
Gel showing Nrxn1 Exon 4 expression in different conditions.
- https://cdn.elifesciences.org/articles/86842/elife-86842-fig6-data1-v2.zip
Figure 6—figure supplement 1
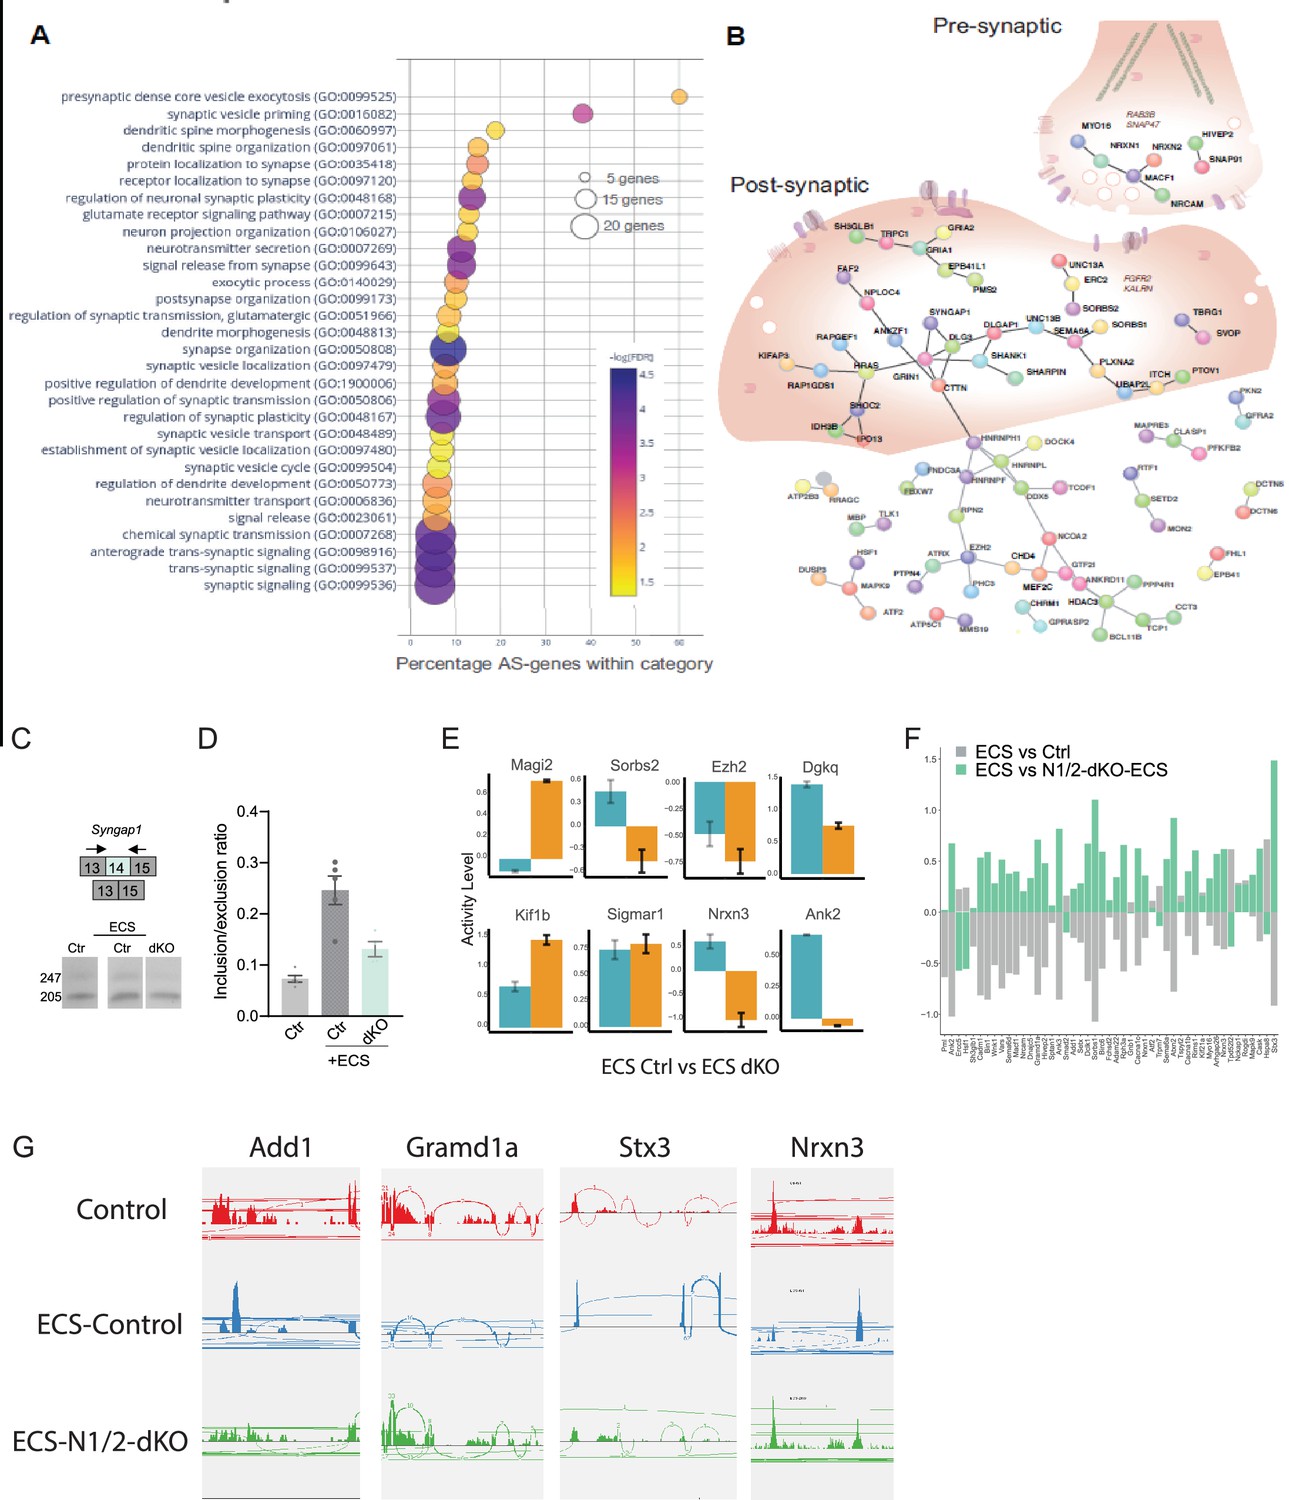
Nova RNA binding proteins control-activity-dependent AS in SST cINs during development.
(A) Bubble dot plot of the most significant GO terms for the genes undergoing Nova1/2 activity-dependent AS splicing within SST +cINs (all GO terms shown FDR <0.05). (B) Schematic of an SST +cIN presynaptic inhibitory axonal puncta (top right) and a SST +cIN excitatory post-synaptic density (middle) overlaid on top of the significant DAPPLE generated PPI direct network from the 356 genes undergoing Nova1/2-dependent activity induced AS (***pVal = 0.00009, 10,1000 permutations). (C) Example RT-PCR validation of alternative splicing (AS) events of activity- and Nova1/2-dependent alternative exon usage within the gene Syngap1 (top), bottom, Gel image of RT-PCR product from the amplification of exon13 to exon 15 within SST-ctl cINs (Ctl) (left), ECS-treated Ctl (middle), and ECS-treated SST-Nova1/2-dKO (right). (D) Quantification of RT-PCR AS events of Syngap1. **pVal = 0.0001 Ctl vs Ctl +ECS; **pVal = 0.004 Ctl +ECS vs SST-Nova1/2-dKO+ECS. (E) Examples of genes with both GE and AS changes. Y-axis represents activity level (FC and pValue) of either GE (teal) or AS (orange). (F) Gene expression changes observed in ECS vs control are partially abolished by Nova1/2-dKO (G) Alternative splicing changes due to activity induction (ECS) are significantly abolished in the Nova1/2-dKO (with ECS). A few example genes are presented showing the activity-dependent exclusion/inclusion of certain exons are no longer present in the Nova1/2-dKO Red: Control; Blue: ECS; Green: Nova1/2-dKO+ECS.
-
Figure 6—figure supplement 1—source data 1
Gel showing Syngap Exon 14 expression.
- https://cdn.elifesciences.org/articles/86842/elife-86842-fig6-figsupp1-data1-v2.zip
Figure 6—figure supplement 2
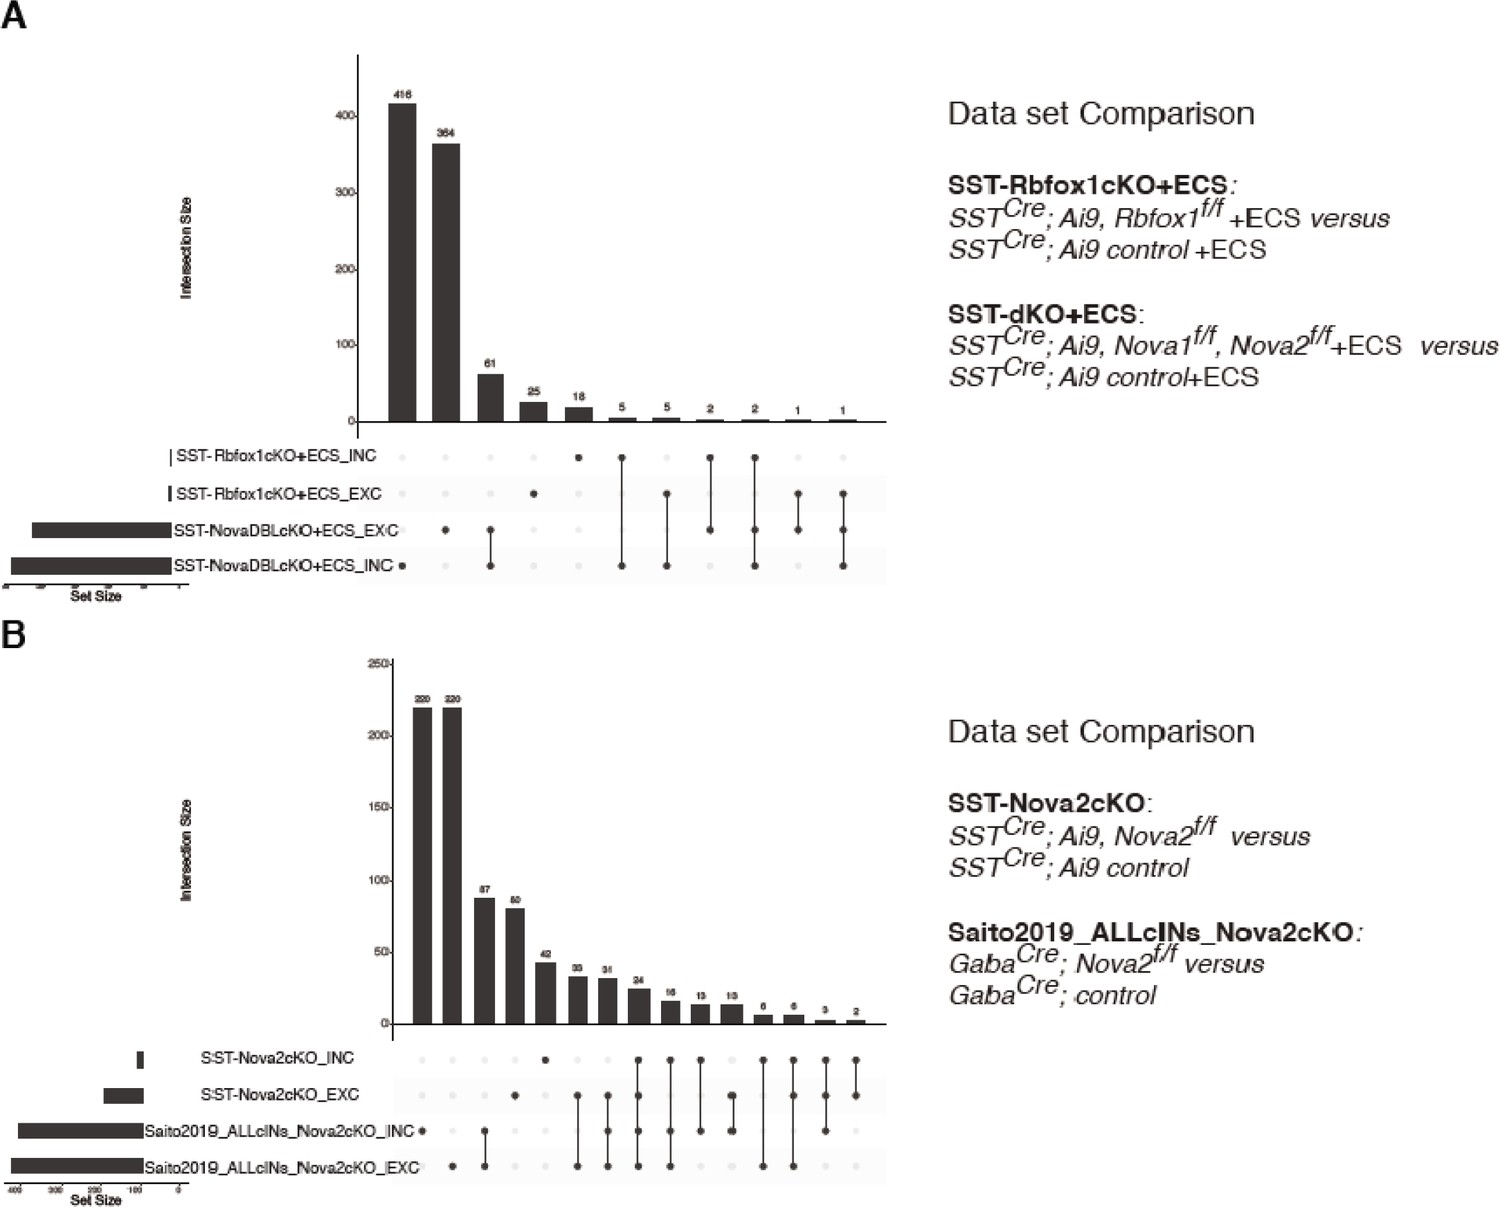
Nova1/2 controls the activity-dependent splicing of large and unique pool of mRNAs compared to Rbfox1 within SST cINs and SST-specific Nova2 AS genes overlap well with pan-cIN Nova2 AS genes.
(A) Quantification of the overlap of SST-Rbfox-cKO+ECS (differential splicing events from the comparison of SST-cIN +ECS to SST-Rbfox-cKO+ECS) and SST-Nova1/2-dKO (differential splicing events from the comparison of SST-cINS +ECS to SST-Nova1/2-dKO+ECS). Bottom left horizontal bars indicate the number of genes subjected to AS events for each data set. Top vertical bars indicate the number of overlapping genes corresponding to the black dot below indicating the data set identity. (B) Quantification of the overlap of SST-Nova2-cKO cIN splicing events (differential splicing events from the comparison of Ctrl SST cINs to SST-Nova2-cKO) with the dataset generated by Saito et al., 2019 utilizing a mouse cross Gad-Cre and Nova2f/f (differential splicing events from Ctrl cINs vs cINs-Nova2-cKO).
Figure 7
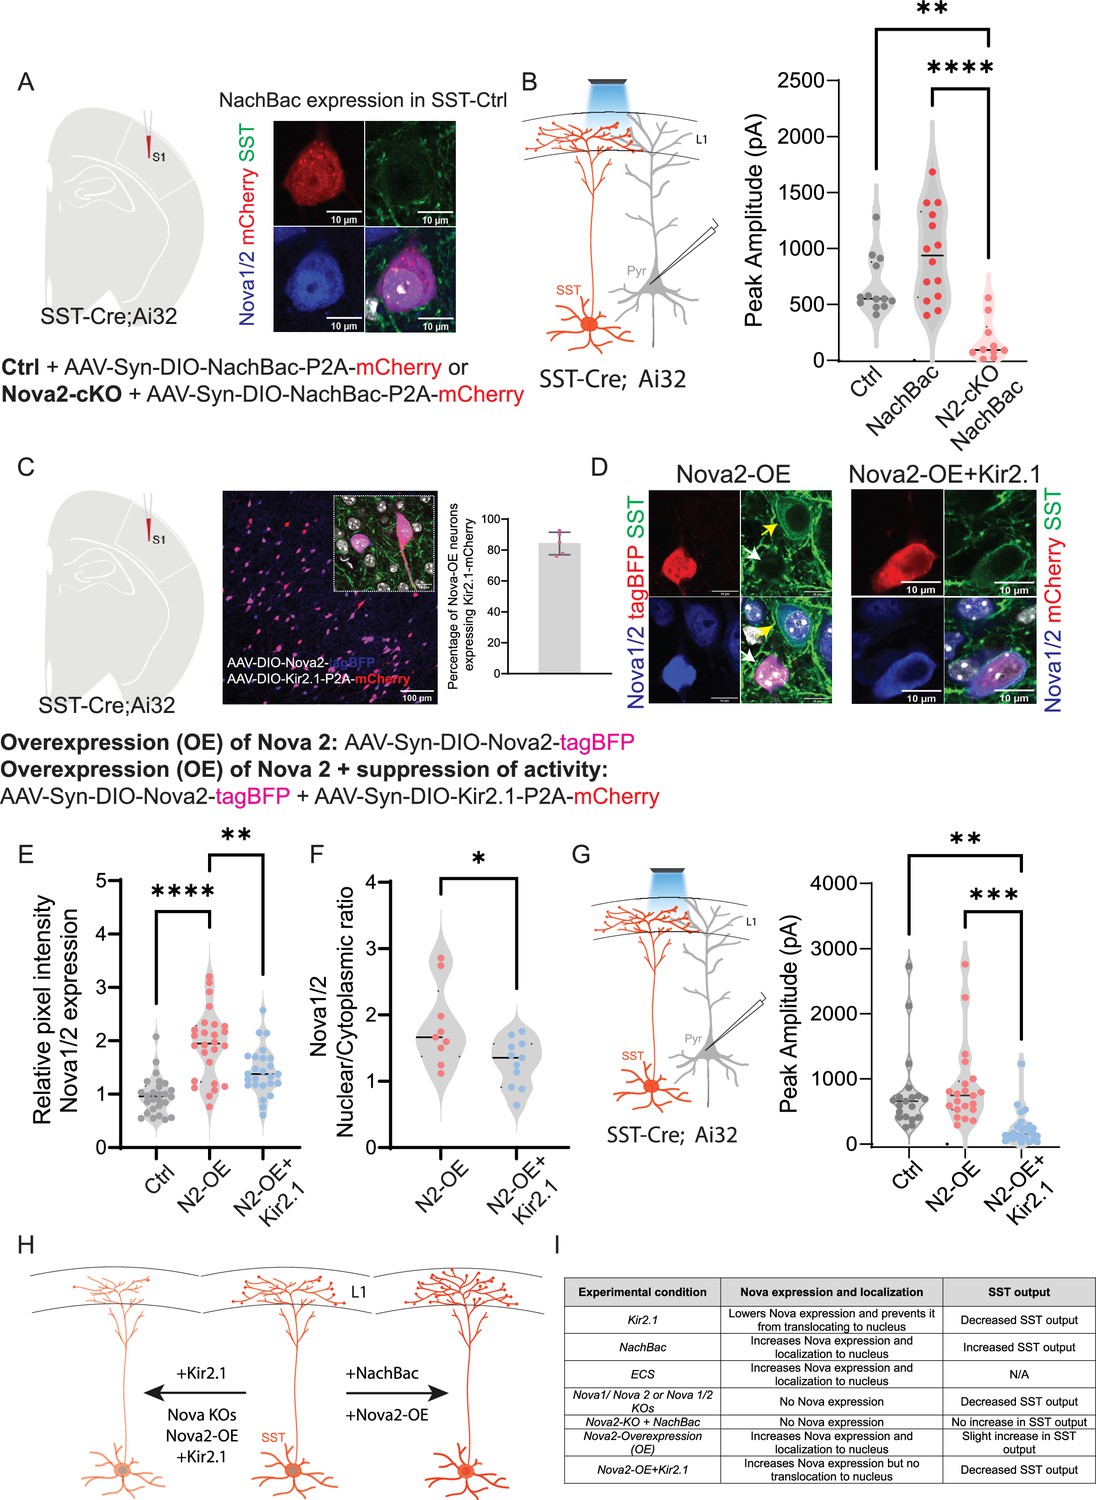
Augmenting activity in Nova2 KO fails to enhance SST inhibitory output.
(A) Left, experimental model: Injection of AAV-Syn-DIO-NachBac-P2A-mCherry (activating) in either control mice or Sst-Nova2-cKO mice at P0 (analysis at P21). Right, example images showing the impact of NachBac activation (red) on Nova1/2 expression in controls. Note the translocation of Nova proteins (blue) to the nucleus (grey) in SST-cINs (green). Scale bar = 10 µm. (B) Left, schematic of the recording scheme: SSTCre::Ai32 optogenetic activation and recording from L5 pyramidal neurons. Right, quantification of the peak IPSC amplitude recorded from pyramidal neurons under no NachBac control conditions (grey), NachBac injections in SST-Ctrl animals (red dots) or NachBac injections in Sst-Nova2-cKO animals (pink). (n=10–15 cells from each condition, N=3 mice; **≤0.01, ****≤0.001). (C) Left, experimental model: Overexpression (OE) of Nova2 using the AAV-Syn-DIO-Nova2-tagBFP virus was injected into SSTCre::Ai32 mice either alone or while suppressing activity using Kir2.1 AAV-Syn-DIO-Kir2.1-P2A-mCherry. Middle, an image showing the co-expression of Nova2-tagBFP (blue) and Kir2.1-mCherry (red). Inset shows co-localization of both proteins in SST neurons. Scale bar of inset = 10 µm. Right, percentage of overlap between the two viruses in SST neurons, quantified as percentage of Nova2-OE neurons that also express Kir2.1-mCherry (~85%). (D) Left panels, Representative images of IHC against tagBFP (red), and Nova1/2 (anti-Nova1/2, blue) in SST-Nova2-OE cells in SSTCre::Ai32 mice (green labels Ai32 expression). Right panels, SST-Nova2OE +KIR2.1 cell. Bottom right panels represent merged images. Note the exclusion of Nova proteins from the nucleus in Nova2-OE+Kir2.1 conditions. (E) Quantification of the relative pixel intensity of Nova1/2 expression in SST cINs (n=25/26 cells for each condition, pVal=**≤0.01, ****≤0.001). (F) Quantification of the Ratio of Nova1/2 localization within the nucleus to cytoplasm from Nova2OE SSt cINs (pink) and Nova2-OE+KIR2.1 (blue). (n=10 cells from 3 mice; pVal=*≤0.05). (G) Right, recording schematic. Left, Peak IPSC amplitude recorded from pyramidal neurons in response to optogenetic stimulation of SST-cINs in either the Nova2-OE condition or Nova2-OE+Kir2.1 condition (n=19–25 cells in each condition, pVal=**≤0.01, ***≤0.005). (H) Model of experimental findings: center is a cartoon wild type SST cIN depicting normal expression of Nova1/2 with the soma (red) whereas, on the left, the conditional loss of Nova1, Nova2, or the expression of KIR2.1 alone or dual overexpression of Nova2 and KIR2.1 results in the reduction in Nova expression and restricts Nova localization to the cytoplasm (In the case of KO animals the protein is lost completely). This effect is accompanied by a reduction in the connectivity of SST cINs. To the contrary, Expression of NaChBac and/or overexpression of Nova2 alone results in expression of Nova throughout the cell and nucleus and is accompanied by an increase in the SST cINs output. (I) Summary table of experimental findings in all conditions tested.
-
Figure 7—source data 1
Summary table for major experimental findings.
- https://cdn.elifesciences.org/articles/86842/elife-86842-fig7-data1-v2.zip
Tables
Key resources table
| Reagent type (species) or resource | Designation | Source or reference | Identifiers | Additional information |
|---|---|---|---|---|
| Strain, strain background (Mus musculus) | SST-Cre | Jackson Laboratories | 13044 | |
| Strain, strain background (Mus musculus) | RCE-GFP | Jackson Laboratories | 032037-JAX | |
| Strain, strain background (Mus musculus) | tgLhx6;eGFP | MMRC | 000246-MU | |
| Strain, strain background (Mus musculus) | Nova1LoxP/LoxP | https://elifesciences.org/articles/00178 | Gift from Darnell Lab | |
| Strain, strain background (Mus musculus) | Nova2 LoxP/LoxP | https://elifesciences.org/articles/00178 | Gift from Darnell Lab | |
| Strain, strain background (Mus musculus) | TRE-Bi-SypGFP-tdTomato | Jackson Laboratories | 12345 | |
| Strain, strain background (Mus musculus) | Rosa-tTA LoxP/LoxP | Jackson Laboratories | 8600 | |
| Strain, strain background (Mus musculus) | Ai9 LoxP/LoxP | Jackson Laboratories | 7909 | |
| Strain, strain background (Mus musculus) | Ai32 LoxP/LoxP | Jackson Laboratories | 24109 | |
| Antibody | Anti-GFP, Chicken Polyclonal IgY | Abcam | Ab13970 | |
| Antibody | Anti-RFP (5 F8), Rat monoclonal | ChromoTek | 5 f8-100 | |
| Antibody | Anti-mCherry, Goat polyclonal | Origene | AB0040-200 | |
| Antibody | Anti-Somatostatin (YC7), Rat monoclonal | EMD Millipore | MAB354 | |
| Antibody | Somatostatin 14, Rabbit | Peninsula Labs | T-4103.0050 | |
| Antibody | Homer 1 c, Rabbit polyclonal | Synaptic systems | 160 023 | |
| Antibody | Vglut 1, Guinea pig polyclonal | Sigma | ab5905 | |
| Antibody | Gephyrin, Mouse IgG monoclonal | Synaptic systems | 147 011 | |
| Antibody | VGAT, Rabbit polyclonal | Synaptic systems | 131 003 | |
| Antibody | Nova1/2, Human polyclonal | pan-Nova (anti-Nova paraneoplastic human serum) | Gift from Darnell Lab | |
| Antibody | tagBFP, Rabbit polyclonal | Evrogen | AB233 | |
| Antibody | Anti-cFOS (4), Rabbit polyclonal | Santa Cruz Biotechnology | SC-52 | |
| Viral Vector | AAV-Syn-DIO-NachBac-P2A-mCherry | NYUAD | This paper | |
| Viral Vector | AAV-Syn-Kir2.1-P2A-mCherry | NYUAD | This paper | |
| Viral Vector | AAV-Syn-DIO-Nova2- tagBFP | NYUAD | This paper | |
| Viral Vector | VTKS2 Backbone | NYUAD | Addgene_170853 | |
| Software, algorithm | BEDTools | Quinlan Lab | v2.17.0 | |
| Software, algorithm | Picard tools | Broad Institute | http://broadinstitute.github.io/picard/ | |
| Software, algorithm | DESeq2 | Bioconductor | R studio package | |
| Software, algorithm | rMATS | Xing Lab | v3.0.9 | |
| Software, algorithm | Rstudio | Rstudio.com | Version 1.1.456 | |
| Software, algorithm | Custom code | This paper | https://github.com/IbrahimLab-23/Nova-proteins-and-synaptic-integration-of-Sst-interneurons; Laboratory of Neural Circuits, 2023 | |
| Software, algorithm | ImageJ 2.0.0 Java 1.8.0_66 | National Institute of Health | https://imagej.net/; RRID:SCR_003070 | |
| Software, algorithm | Clampfit 10.7 (pClamp) | Molecular Devices | ||
| Software, algorithm | https://www.moleculardevices.com/products/software/pclamp.html; RRID:SCR_011323 | |||
| Software, algorithm | ||||
| Software, algorithm | Prism 9.1.2 | Graphpad Software | https://www.graphpad.com/; RRID:SCR_002798 | |
| Software, algorithm | ||||
| Software, algorithm | Zen Blue | Zeiss | ||
| Software, algorithm | https://www.zeiss.com/microscopy/en_us/products/microscope-software/zen.html; RRID:SCR_013672 | |||
| Software, algorithm |
Additional files
-
MDAR checklist
- https://cdn.elifesciences.org/articles/86842/elife-86842-mdarchecklist1-v2.pdf
-
Supplementary file 1
Intrinsic properties of SST-Nova1 SST-Nova2 and SST-Nova12-dKO.
- https://cdn.elifesciences.org/articles/86842/elife-86842-supp1-v2.docx
-
Supplementary file 2
Exon coverage of synaptic genes.
- https://cdn.elifesciences.org/articles/86842/elife-86842-supp2-v2.docx
Download links
A two-part list of links to download the article, or parts of the article, in various formats.
Downloads (link to download the article as PDF)
Open citations (links to open the citations from this article in various online reference manager services)
Cite this article (links to download the citations from this article in formats compatible with various reference manager tools)
Nova proteins direct synaptic integration of somatostatin interneurons through activity-dependent alternative splicing
eLife 12:e86842.
https://doi.org/10.7554/eLife.86842


