Aging impairs cold-induced beige adipogenesis and adipocyte metabolic reprogramming
- Institute for Diabetes, Obesity & Metabolism, Perelman School of Medicine at the University of Pennsylvania, United States
- Department of Cell and Developmental Biology; Perelman School of Medicine at the University of Pennsylvania, United States
- Division of Endocrinology, Diabetes, and Metabolism, Beth Israel Deaconess Medical Center, United States
- Broad Institute of MIT and Harvard, United States
- Harvard Medical School, United States
Figures
Figure 1 with 1 supplement
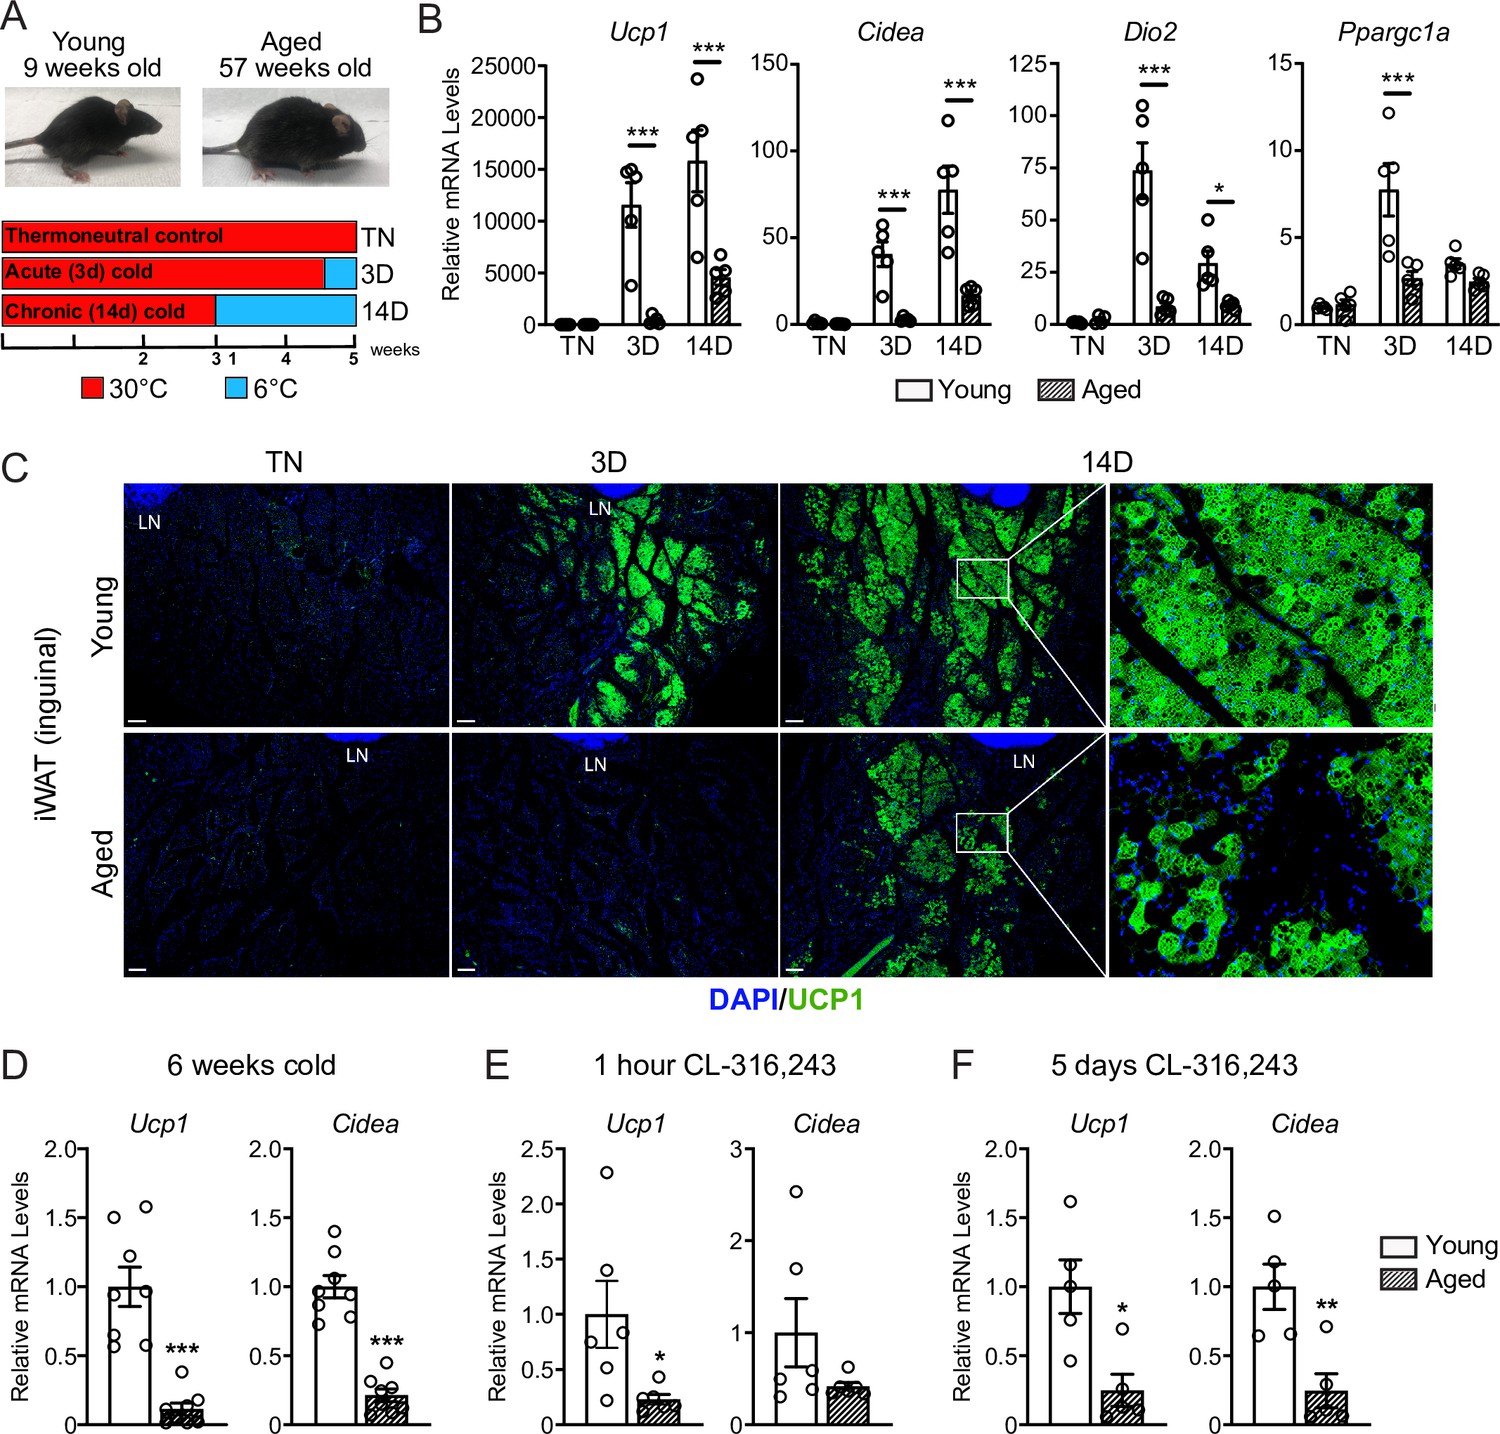
Aged mice exhibit decreased iWAT beiging in response to cold exposure or β3-agonist treatment.
(A) Young (9-week-old) and aged (57-week-old) C57BL/6 mice were acclimated to 30 °C for 3 weeks, followed by two additional weeks either remaining at 30 °C (TN, thermoneutral), spending the last 3 days at 6 °C (3D, acute cold) or the last 14 days at 6 °C (14D, chronic cold). (B) Relative mRNA levels of thermogenic marker genes in mouse iWAT from (A), n=5. (C) Immunofluorescence analysis of UCP1 (green) and DAPI (blue) in iWAT sections from mice in (A), LN = lymph node. Scale bar 100 μm. (D–F) Relative mRNA levels of Ucp1 and Cidea in iWAT from separate groups of young and aged mice that were either: exposed to 6 °C cold for 6 weeks (D), treated with CL-316,243 for 1 hr (E) or treated with CL 316,243 for 5 days (F). Data represent mean ± SEM, points represent biological replicates, two groups analyzed using a Student’s t-test, and multiple conditions analyzed using a two-way ANOVA with a Tukey correction for multiple comparisons. Significance: not significant, p>0.05; * p<0.05 ** p<0.01; *** p<0.001.
Figure 1—figure supplement 1
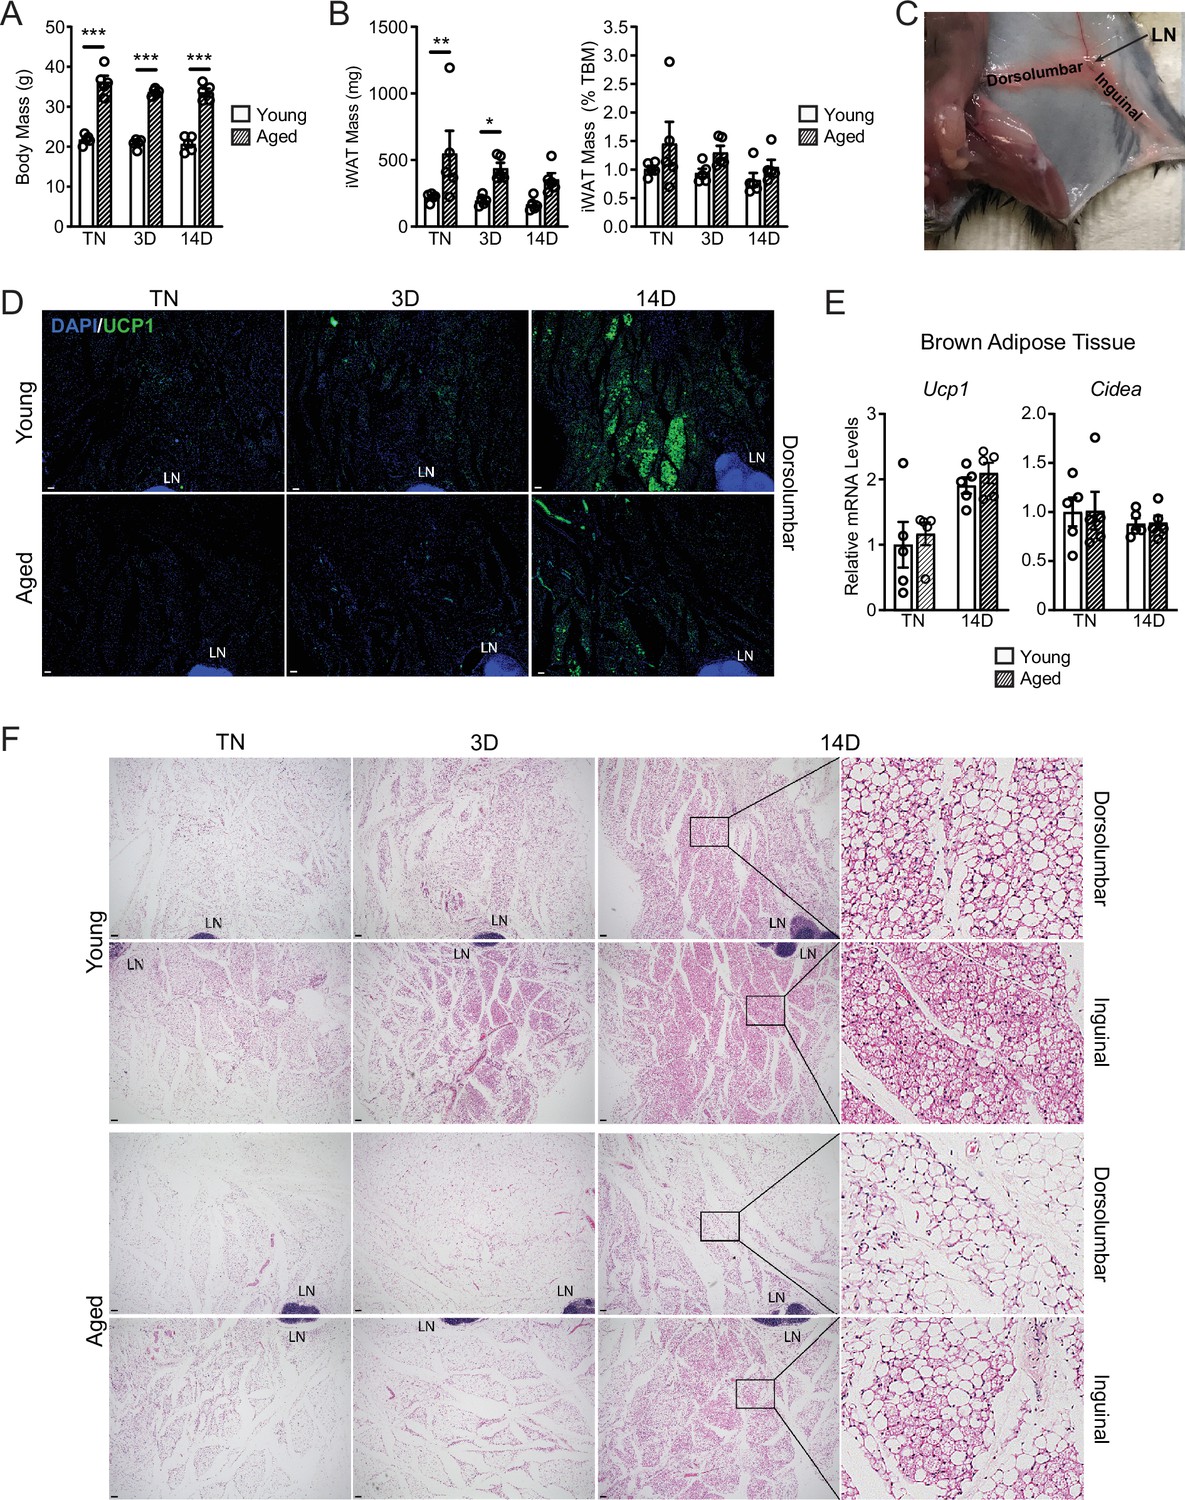
Aging impairs WAT beiging.
(A, B) Body mass and iWAT mass of mice described in Figure 1A, n=5. (C) Mouse dissection with lymph node (LN) orientation showing the dorsolumbar and inguinal regions of the iWAT pad. (D) IF analysis of UCP1 (green) in iWAT, DAPI (nuclei, blue). LN = lymph node. Scale bar 100 μm. (E) mRNA levels of Ucp1 and Cidea in BAT of young and aged mice housed at TN, and either maintained at TN or exposed to cold for 2 weeks. (F) H&E staining of serial sections of iWAT from D (above) and Figure 1C, LN = lymph node. Scale bar 100 μm. Data represent mean ± SEM, points represent biological replicates, analyzed using a Student’s t-test with a two-way ANOVA with a Tukey correction for multiple comparisons. Significance: not significant, p>0.05; * p<0.05 ** p<0.01; *** p<0.001.
Figure 2 with 1 supplement
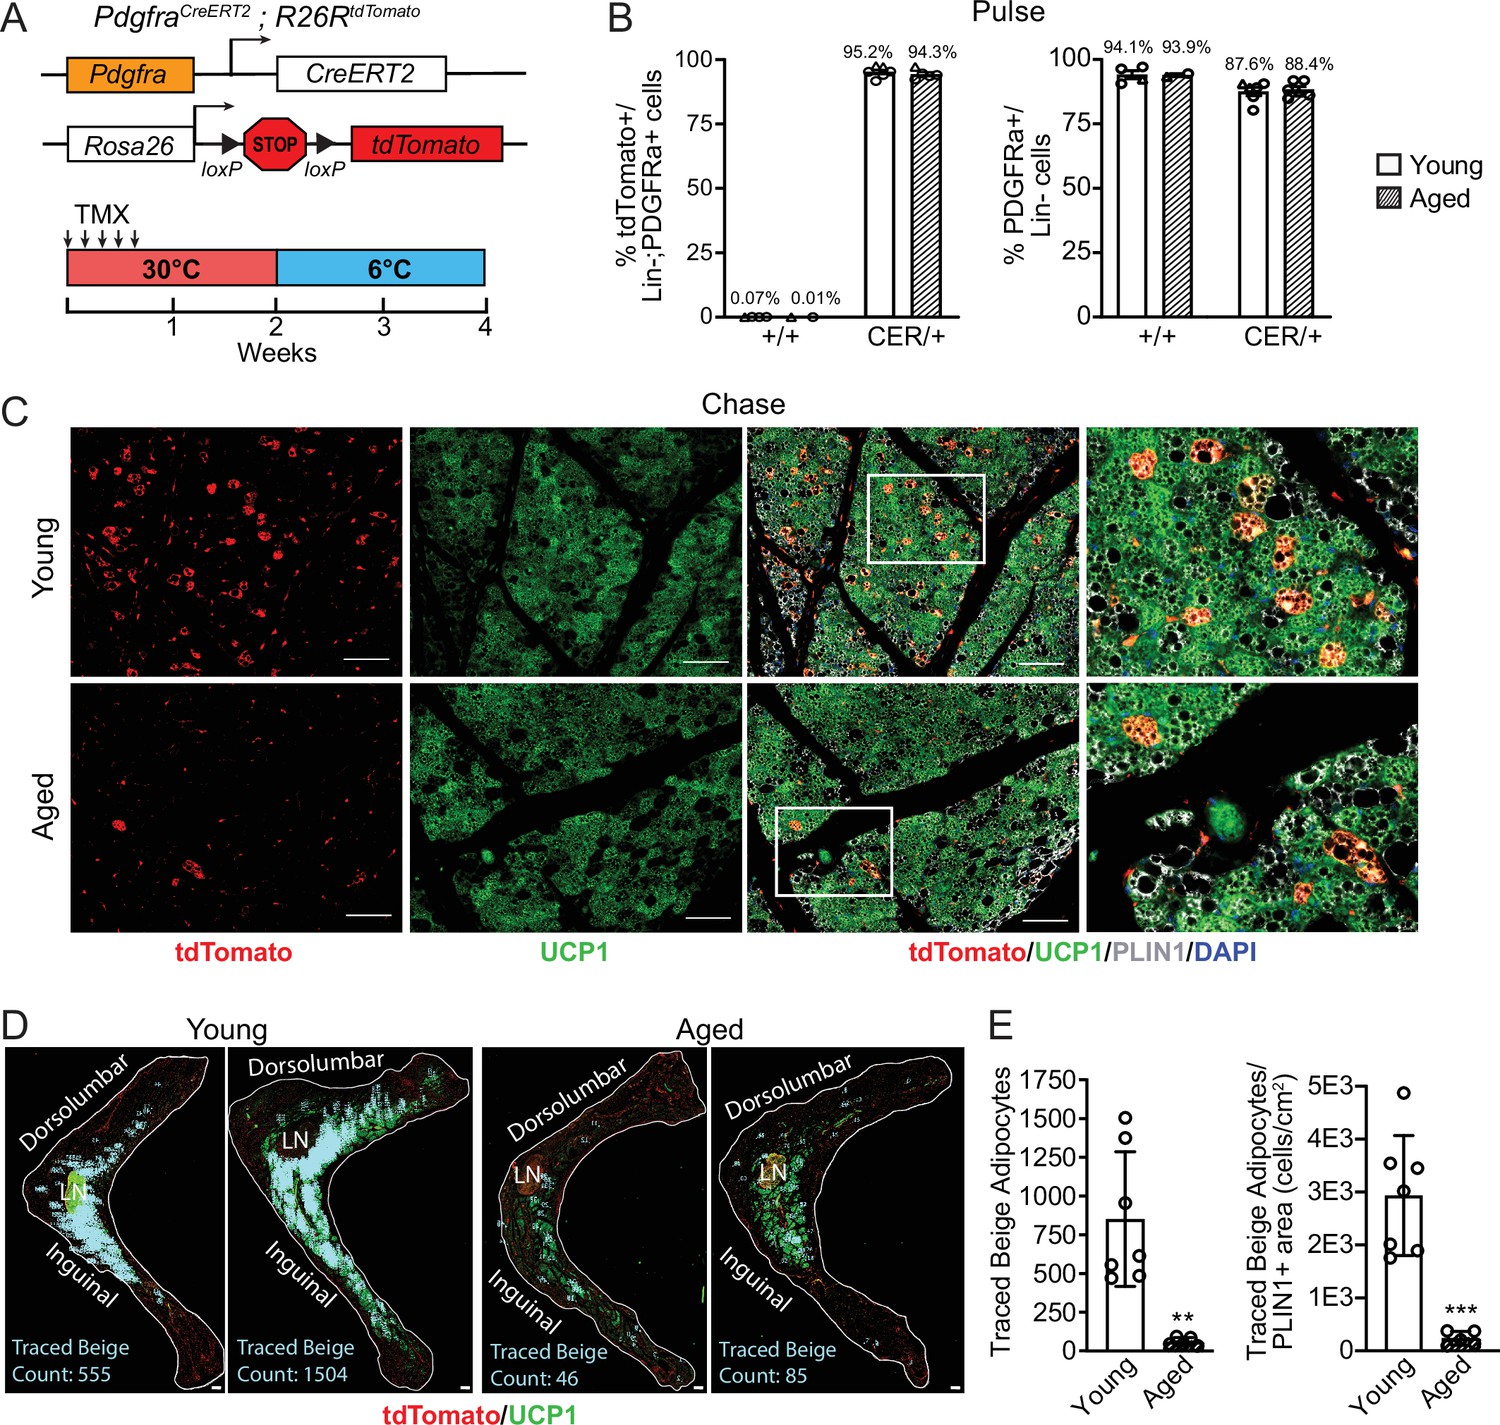
Aging blocks beige adipogenesis from fibroblastic ASPCs.
(A) Schematic of Pdgfra-CreERT2;R26R-tdTomato reporter mouse model and lineage tracing paradigm. (B) Flow cytometry-based quantification showing proportions of tdTomato-expressing cells (as % of total Live, Lin- (CD45-/CD31-, PDGFRα+ cells)) (left) and PDGFRα+ cells (as % of total Live, Lin- cells) (right) in iWAT from young and aged Cre- (control, +/+), and Cre+ (CER) mice. n=6 young, 5 aged (Circles represent male mice, triangles represent female mice). (C) IF analysis of tdTomato (red), UCP1 (green), PLIN1 (white) and DAPI (blue) in iWAT from young and aged reporter mice after 14 days of 6 °C cold exposure (chase). Scale bar 100 μm. (D) Representative stitched images of full length iWAT histology slices from samples in (C) showing quantification of traced tdTomato+; UCP1 + multilocular (beige) adipocytes (blue numbers). LN = lymph node, scale bar 500 μm. (E) Quantification of traced beige adipocytes from (D) presented as total cell number (left) or proportion of PLIN1 + area (right), n=7 (young), n=5 (aged). Data represent mean ± SEM, points represent biological replicates, two groups analyzed using a Student’s t-test, and multiple conditions analyzed with a two-way ANOVA with a Tukey correction for multiple comparisons. Significance: not significant, p>0.05; * p<0.05 ** p<0.01; *** p<0.001.
Figure 2—figure supplement 1
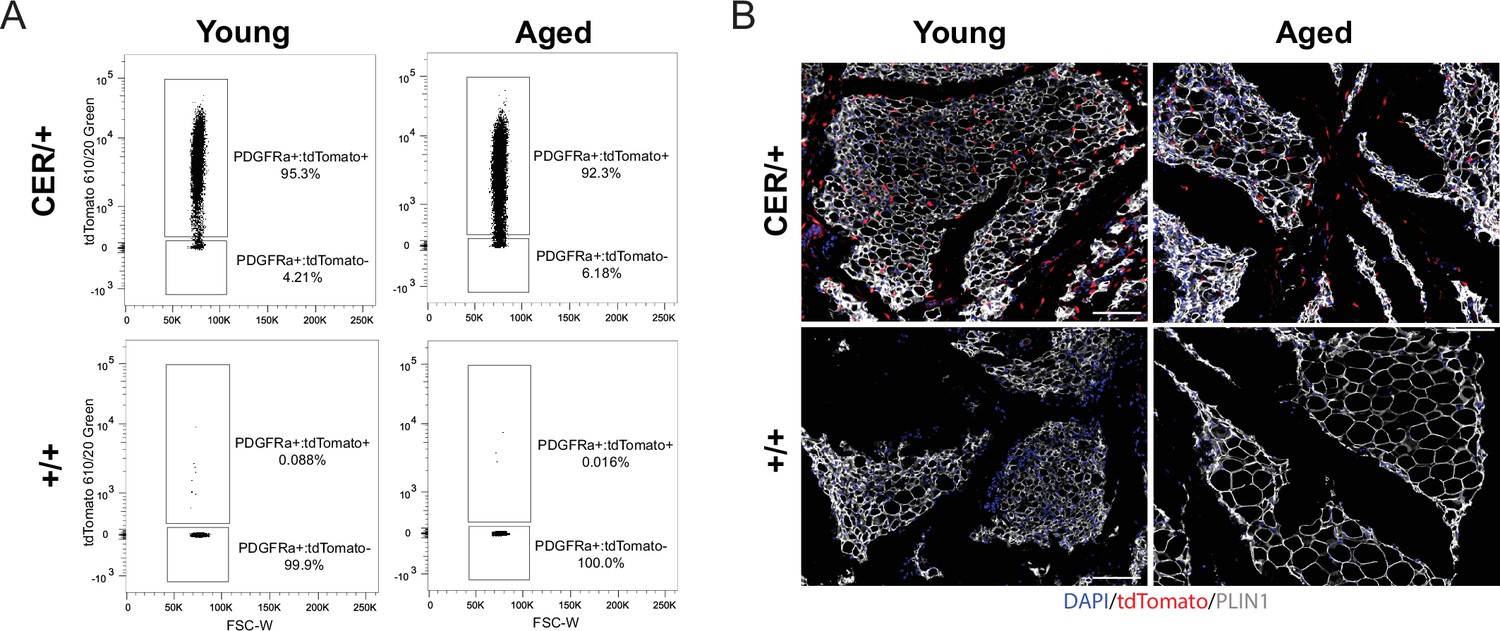
Aging blocks beige adipogenesis from PDGFRa +ASPCs.
(A) Representative flow cytometry plots showing expression of tdTomato in gated Live, Lin-; PDGFRα+stromal vascular cells isolated from young and aged reporter mice (described in Figure 2) immediately after treatment with tamoxifen (tmx, pulse). (B) IF analysis of iWAT from young and aged reporter mice with tdTomato (red), PLIN1 (white), and DAPI (blue) after the tmx pulse, scale bar 100 μm.
Figure 3 with 1 supplement
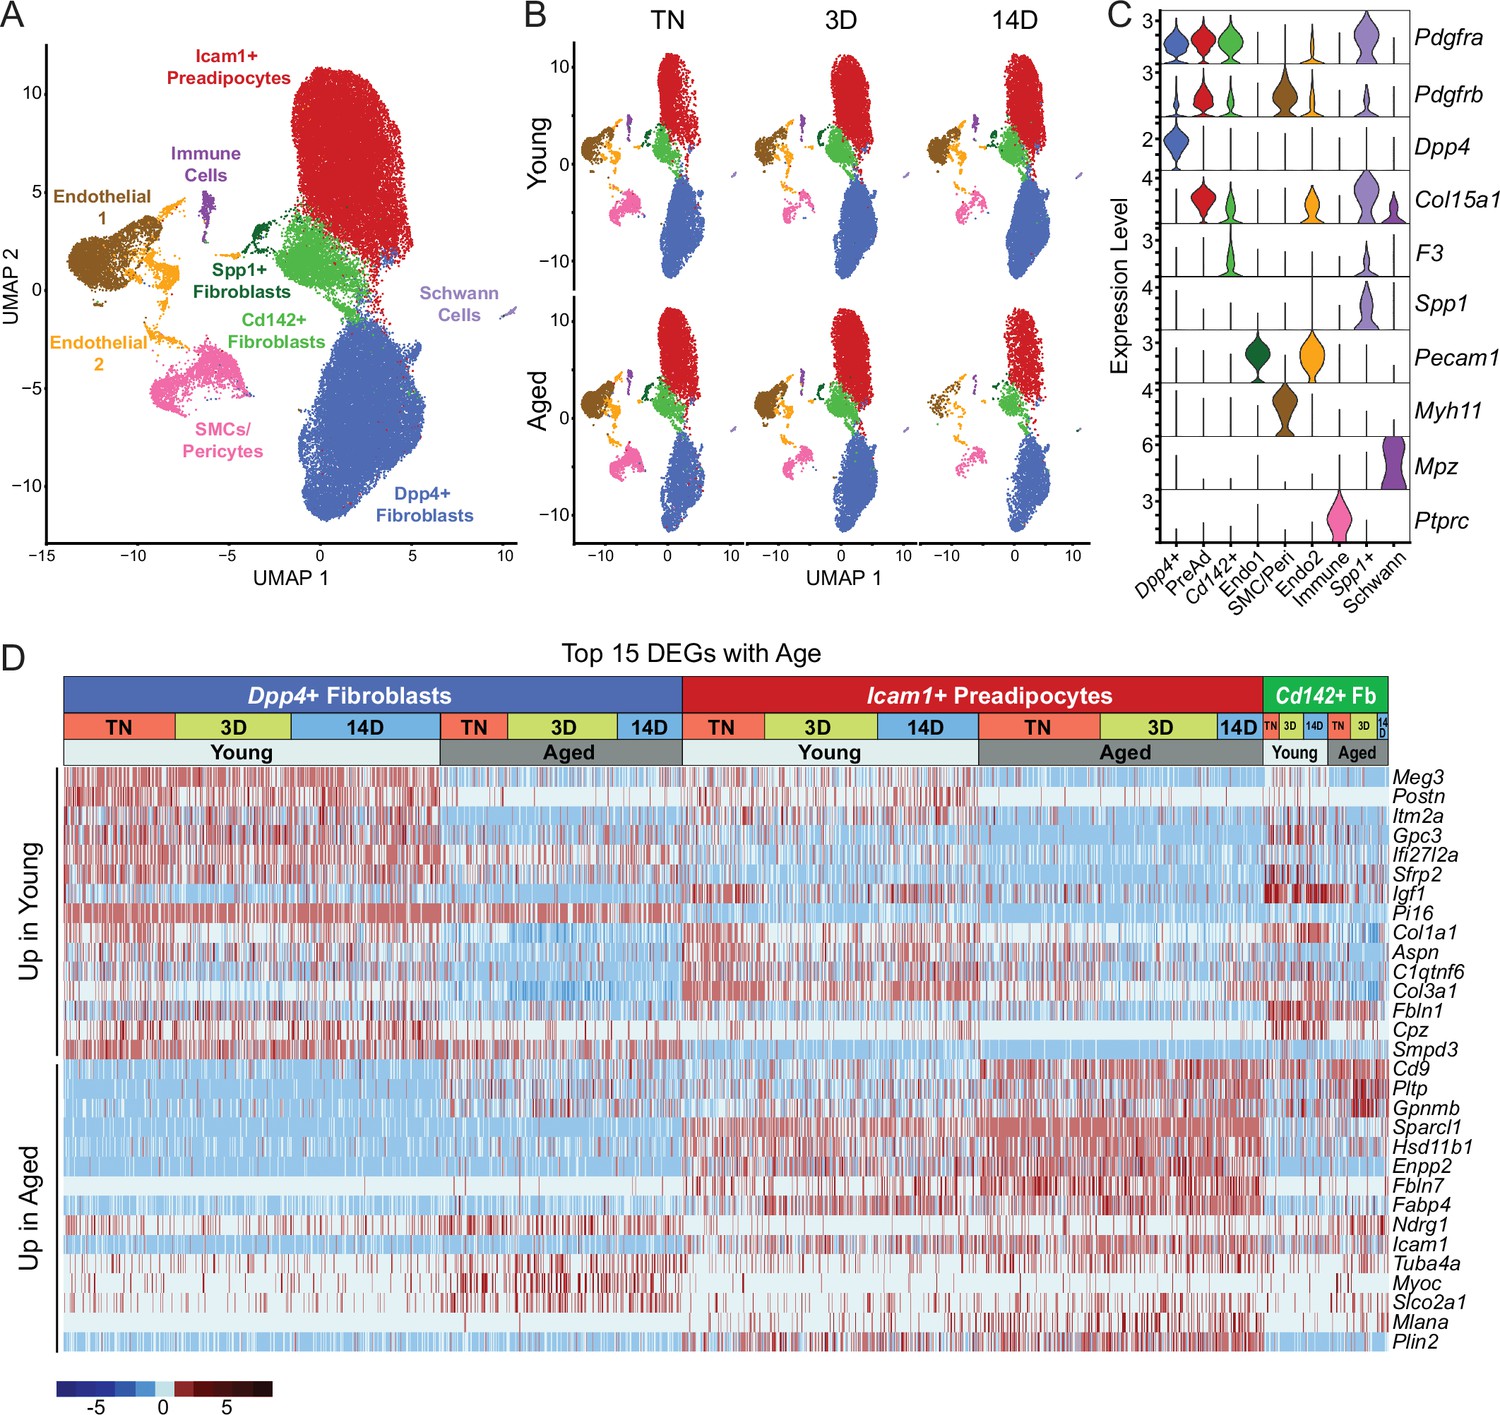
Single-cell expression profiling of ASPCs during iWAT beiging.
(A) Integrated UMAP of gene expression in 54,987 stromal vascular cells (FACS depleted of CD45 +immune cells) from young and aged mouse groups detailed in Figure 1A. (B) UMAPs split by condition. (C) Violin plots showing the expression levels of representative marker genes for cell clusters. Y-axis=log-scale normalized read count. (D) Expression heatmap of the top differentially expressed genes in young vs. aged fibroblastic ASPCs (Dpp4+, Icam1+ preadipocytes and Cd142+ cells). Table shows expression of these genes in ASPC populations across temperature conditions (TN, cold 3D, cold 14D) from young and aged mice.
Figure 3—figure supplement 1
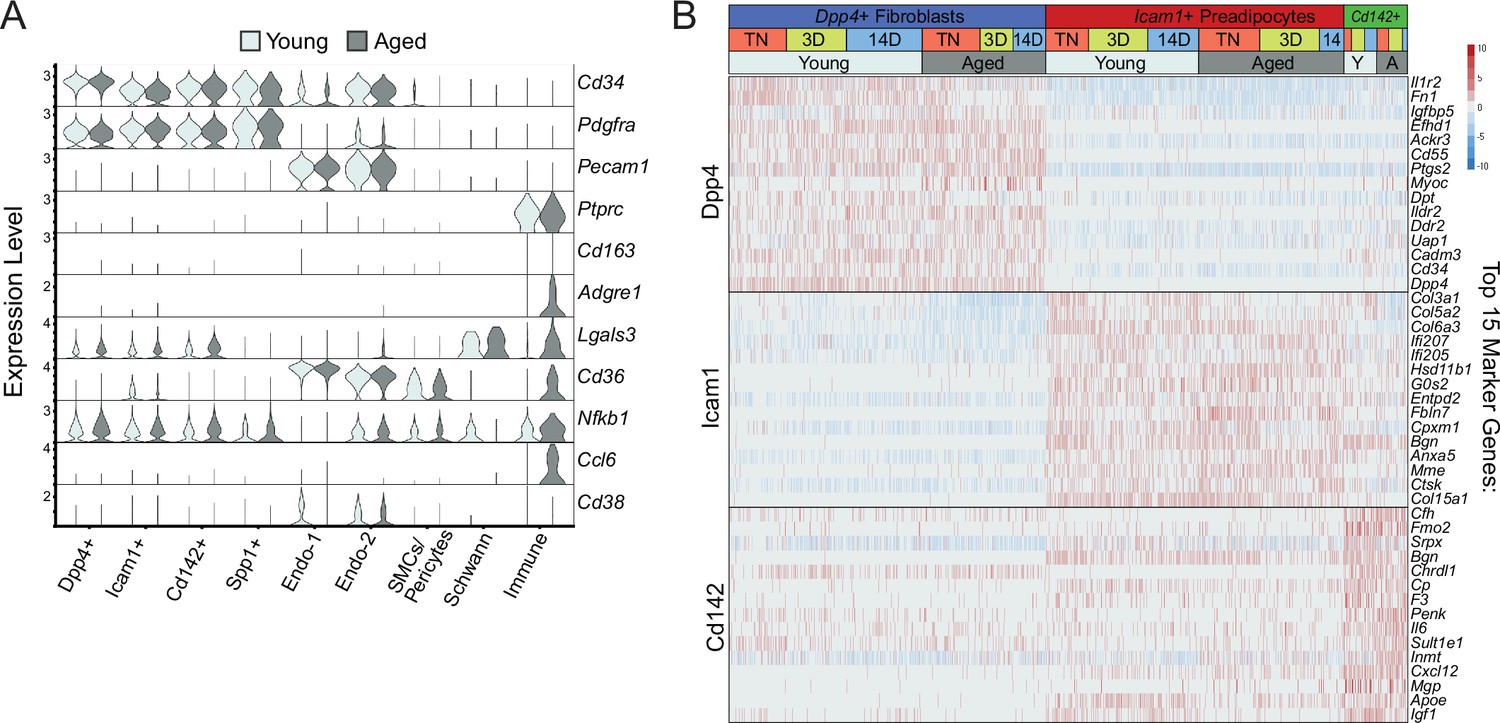
Single-cell expression profiling of ASPCs during iWAT beiging.
(A) Violin plot showing expression of ARC marker genes in cell clusters split by age, Y-axis=log-scale normalized read count. (B) Expression heatmap of top ASPC marker genes across age and housing conditions.
Figure 4
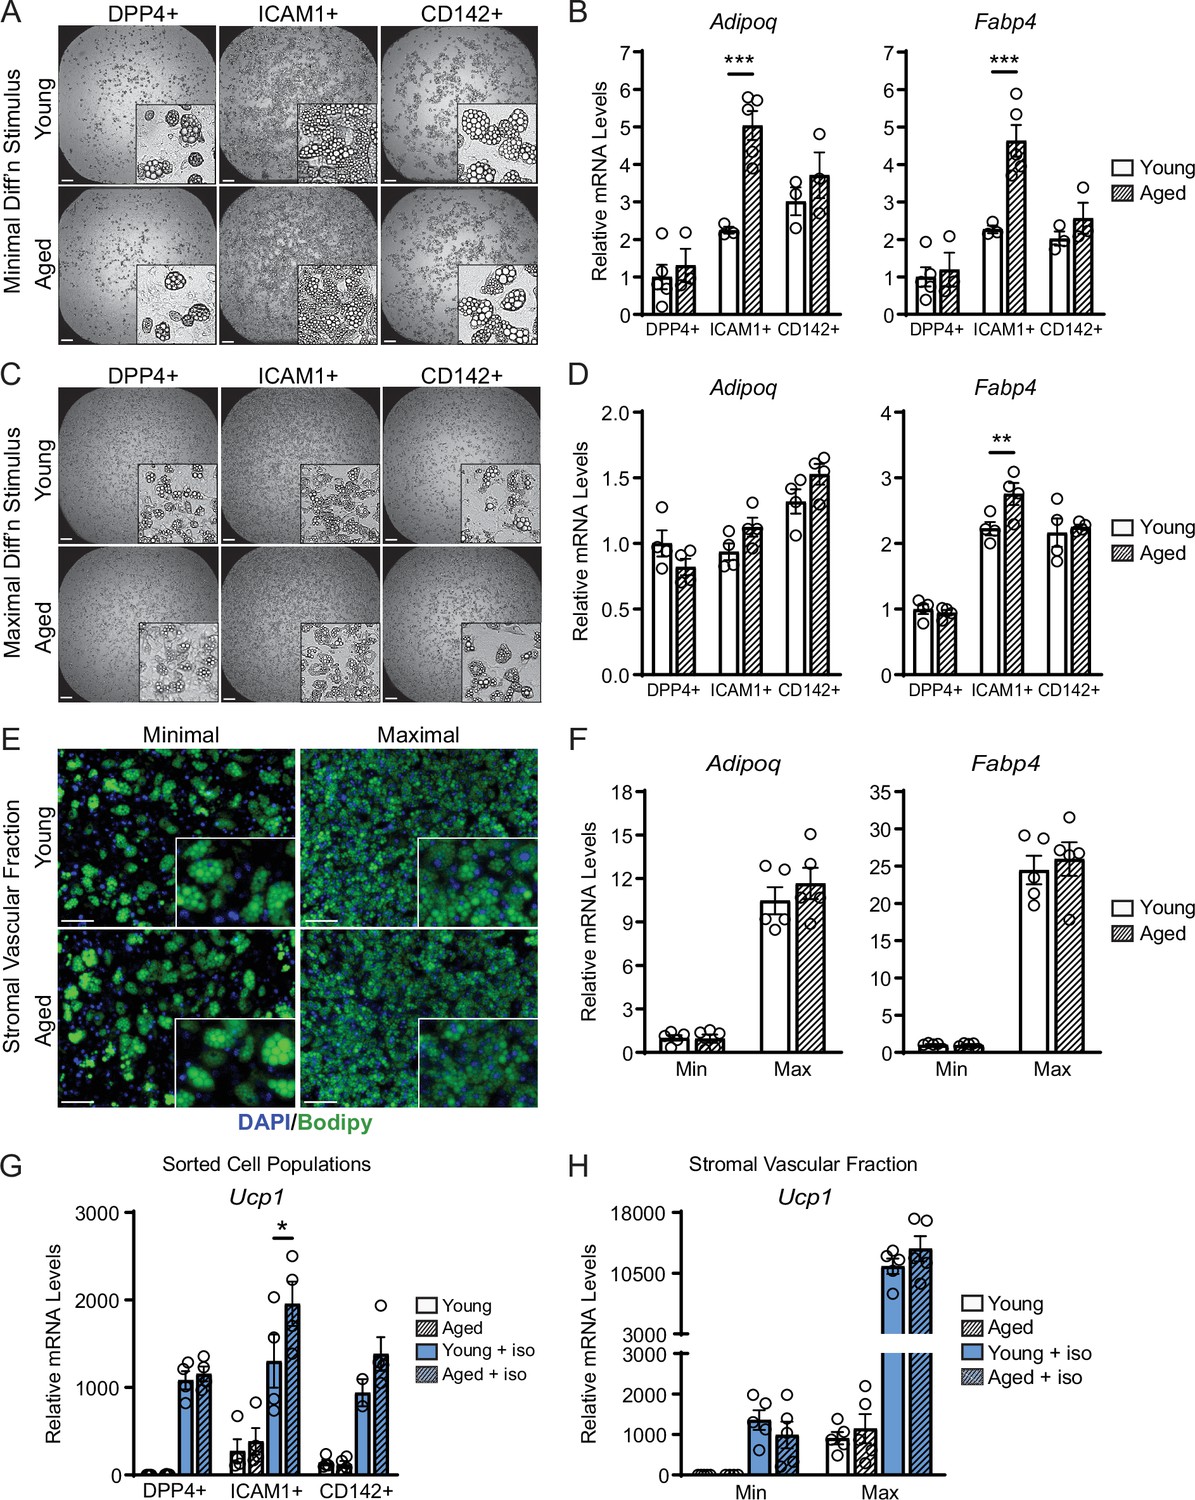
ASPCs from young and aged mice display similar beige adipogenic activity ex vivo.
(A, C) Phase contrast images of DPP4+, ICAM1+ and CD142+ cells from iWAT of young and aged mice that were induced to undergo adipocyte differentiation with minimal (Min, A) or maximal (Max, C) induction cocktail for 8 days. Scale bar 200 μm. (B, D) mRNA levels of adipocyte marker genes Adipoq and Fabp4 in cultures from (A, C). Data points represent separate wells, sorted from a pool of five mice (A) or sorted from two pools of two to three mice (C). (E) Stromal vascular fraction (SVF) cell cultures from the iWAT of young and aged mice were induced to differentiate for 8 days with Minimal or Maximal cocktail, followed by Bodipy (green) staining of lipid droplets and DAPI (blue) staining of nuclei. Scale bar 100 μm. (F) Relative mRNA levels of Adipoq and Fabp4 in cultures from (E). Data points represent wells from individual mice, n=5. (G, H) Relative mRNA levels of Ucp1 in adipocyte cultures from (C, E) with or without treatment with isoproterenol for 4 hr. Data points represent wells sorted from two pools of two to three mice (G) or wells from individual mice, n=5 (H). Data represent mean ± SEM, two groups analyzed using a Student’s t-test, and multiple conditions analyzed with a two-way ANOVA with a Tukey correction for multiple comparisons. Significance: not significant, p>0.05; * p<0.05 ** p<0.01; *** p<0.001.
Figure 5 with 1 supplement
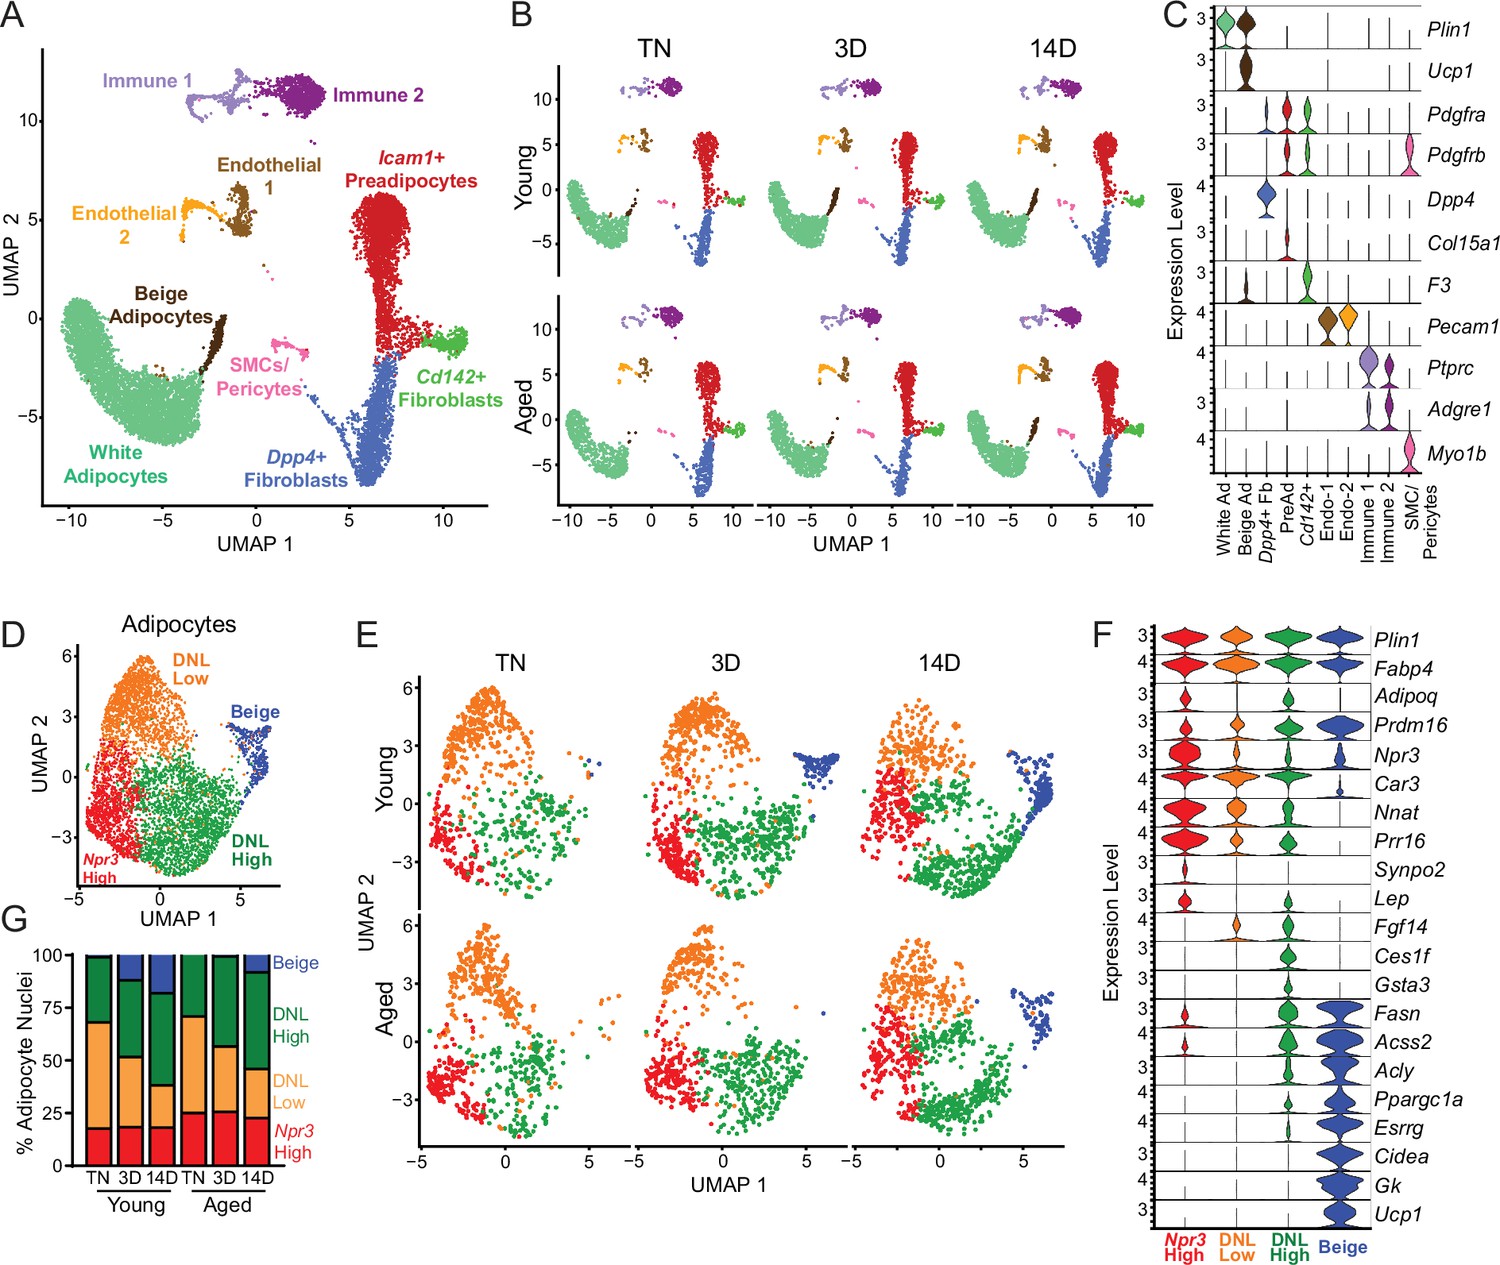
Single-nucleus expression profiling of adipocytes during the beiging process in young and aged mice.
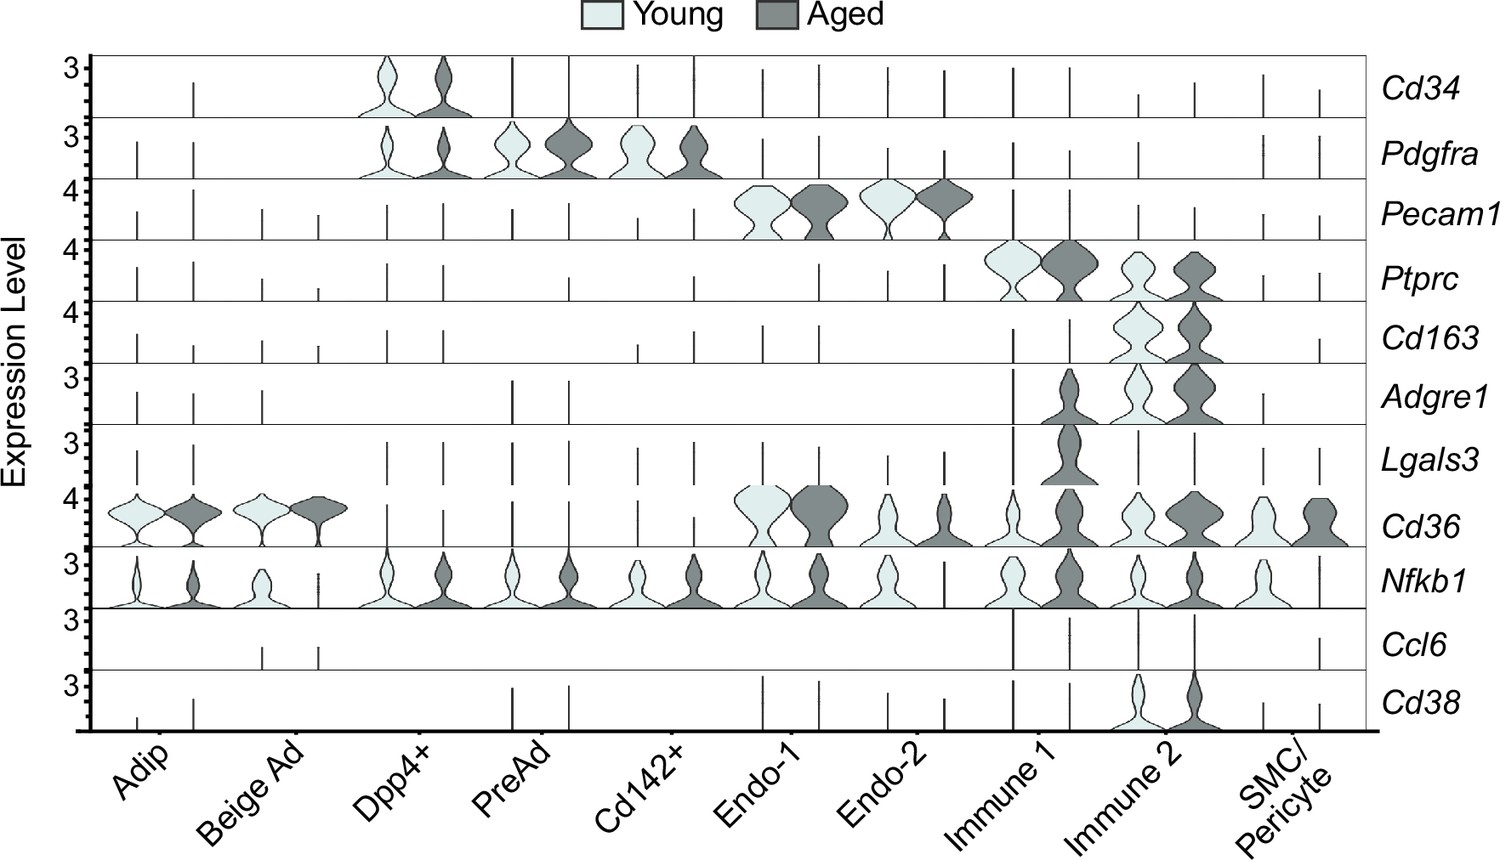
(A) Fully integrated UMAP of mRNA levels in 11,905 nuclei from iWAT of mouse groups detailed in Figure 1A, n=2 mice per condition. (B) UMAPs split by condition. (C) Violin plots showing expression patterns of cell cluster-selective marker genes, Y-axis=log-scale normalized read count. (D) UMAP of gene expression in re-integrated adipocyte clusters including 4937 nuclei from (A) identifying four populations: Npr3-high, beige, DNL-low, and DNL-high. (E) Adipocyte UMAPs split by condition. (F) Violin plots showing expression patterns of selected genes in adipocyte populations, Y-axis=log-scale normalized read count. (G) Adipocyte nuclei numbers in each sample, plotted as percent of total adipocytes captured for that sample.
Figure 5—figure supplement 1
Single-nucleus expression profiling of iWAT during the beiging process.
Violin plot showing marker gene levels split by age, y-axis=log-scale normalized read count.
Figure 6 with 1 supplement
Aging blocks activation of the lipogenic gene program in adipocytes.
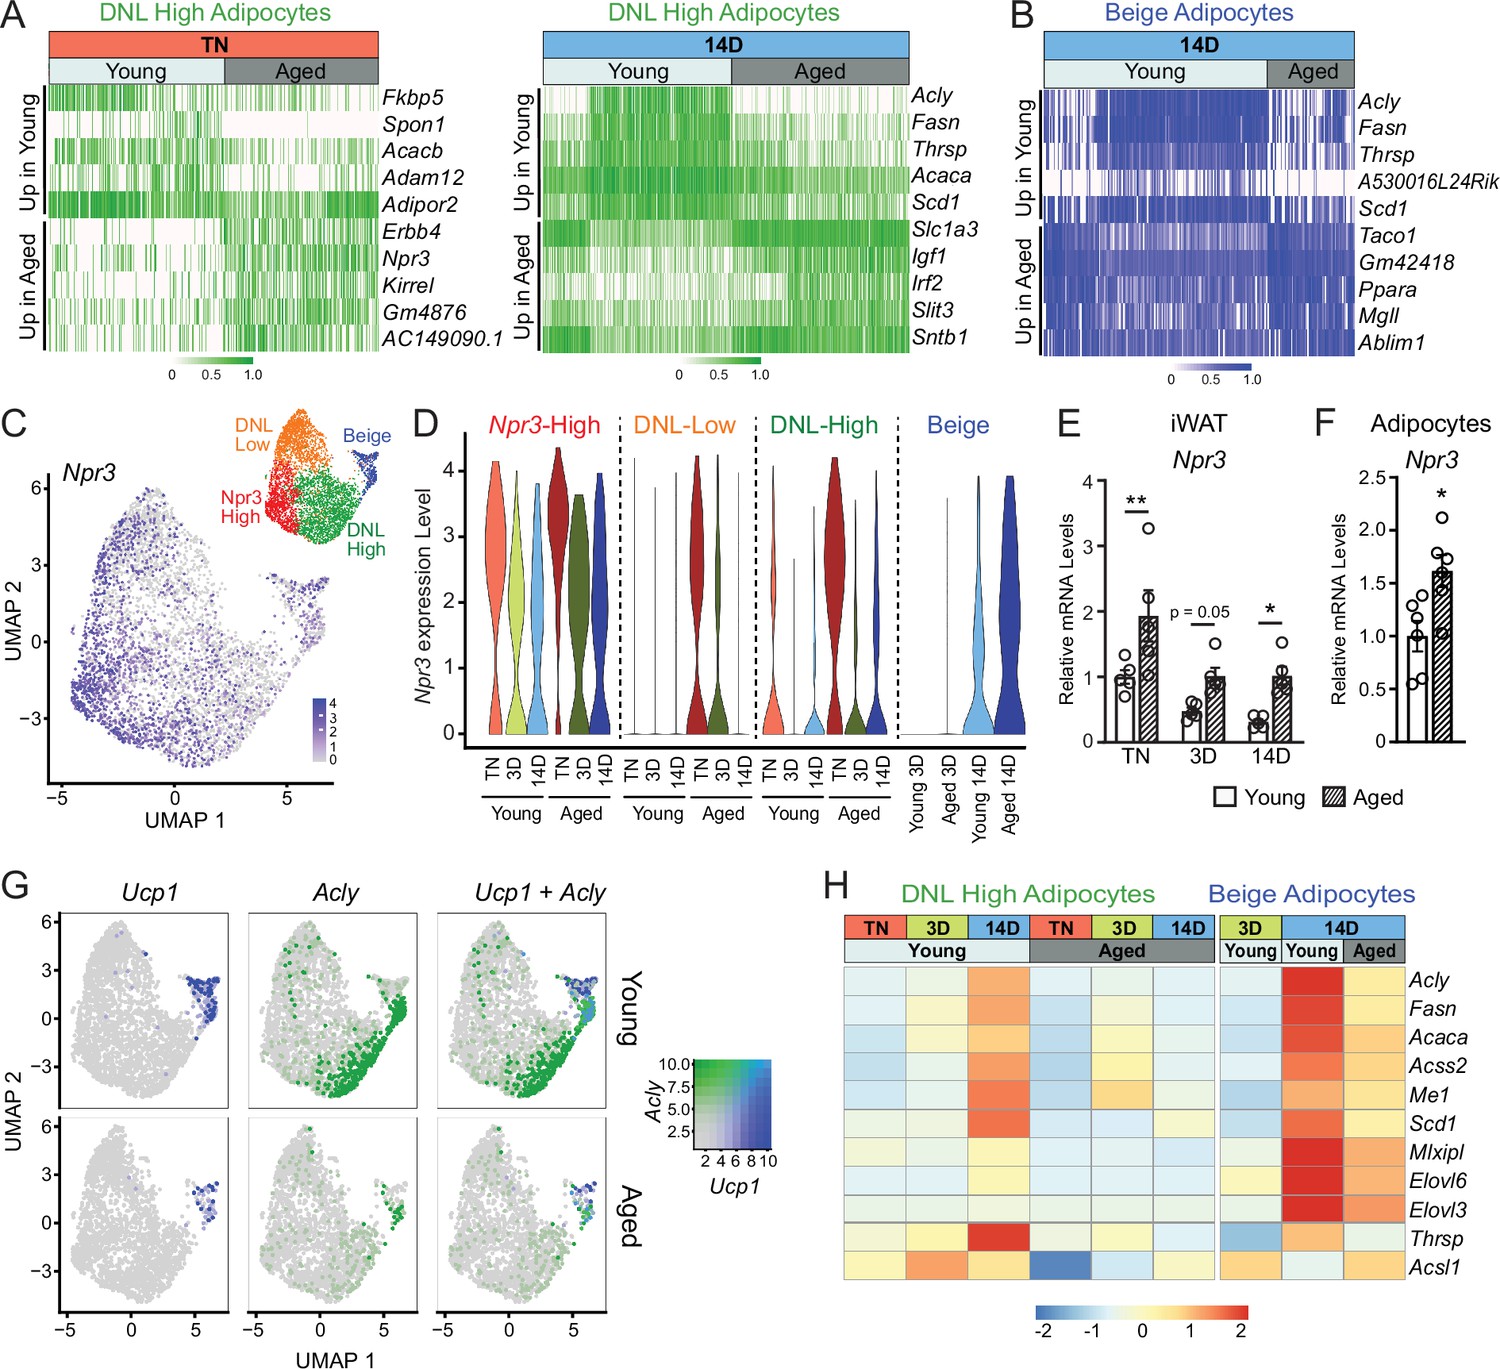
(A) Expression heatmap of the top aging-regulated genes in DNL-high adipocytes at TN (left) and after 14 days of cold exposure (right). (B) Expression heatmap of the top aging-regulated genes in beige adipocytes after 14 days of cold exposure. (C) UMAP of Npr3 mRNA levels in adipocyte populations (from Figure 5D). (D) Violin plots showing Npr3 mRNA levels in adipocyte populations at TN (T), and at 3 and 14 days of cold exposure, Y-axis=log-scale normalized read count. (E) Npr3 mRNA levels in iWAT from mouse groups described in Figure 1A, n=5. (F) Npr3 mRNA levels in isolated adipocytes from TN- acclimated young and aged mice, n=6. (G) UMAPs of Ucp1, Acly, and their co-expression in adipocyte populations from young and aged mice. (H) Heatmap showing average expression of DNL genes in all nuclei from DNL-high and beige adipocytes per condition indicated in the top table. Data represent mean ± SEM, points represent biological replicates, two groups analyzed using a Student’s t-test, and multiple conditions analyzed with a two-way ANOVA with a Tukey correction for multiple comparisons. Significance: not significant, p>0.05; * p<0.05 ** p<0.01; *** p<0.001.
Figure 6—figure supplement 1
Single-nucleus expression profiling of adipocytes during the beiging process.
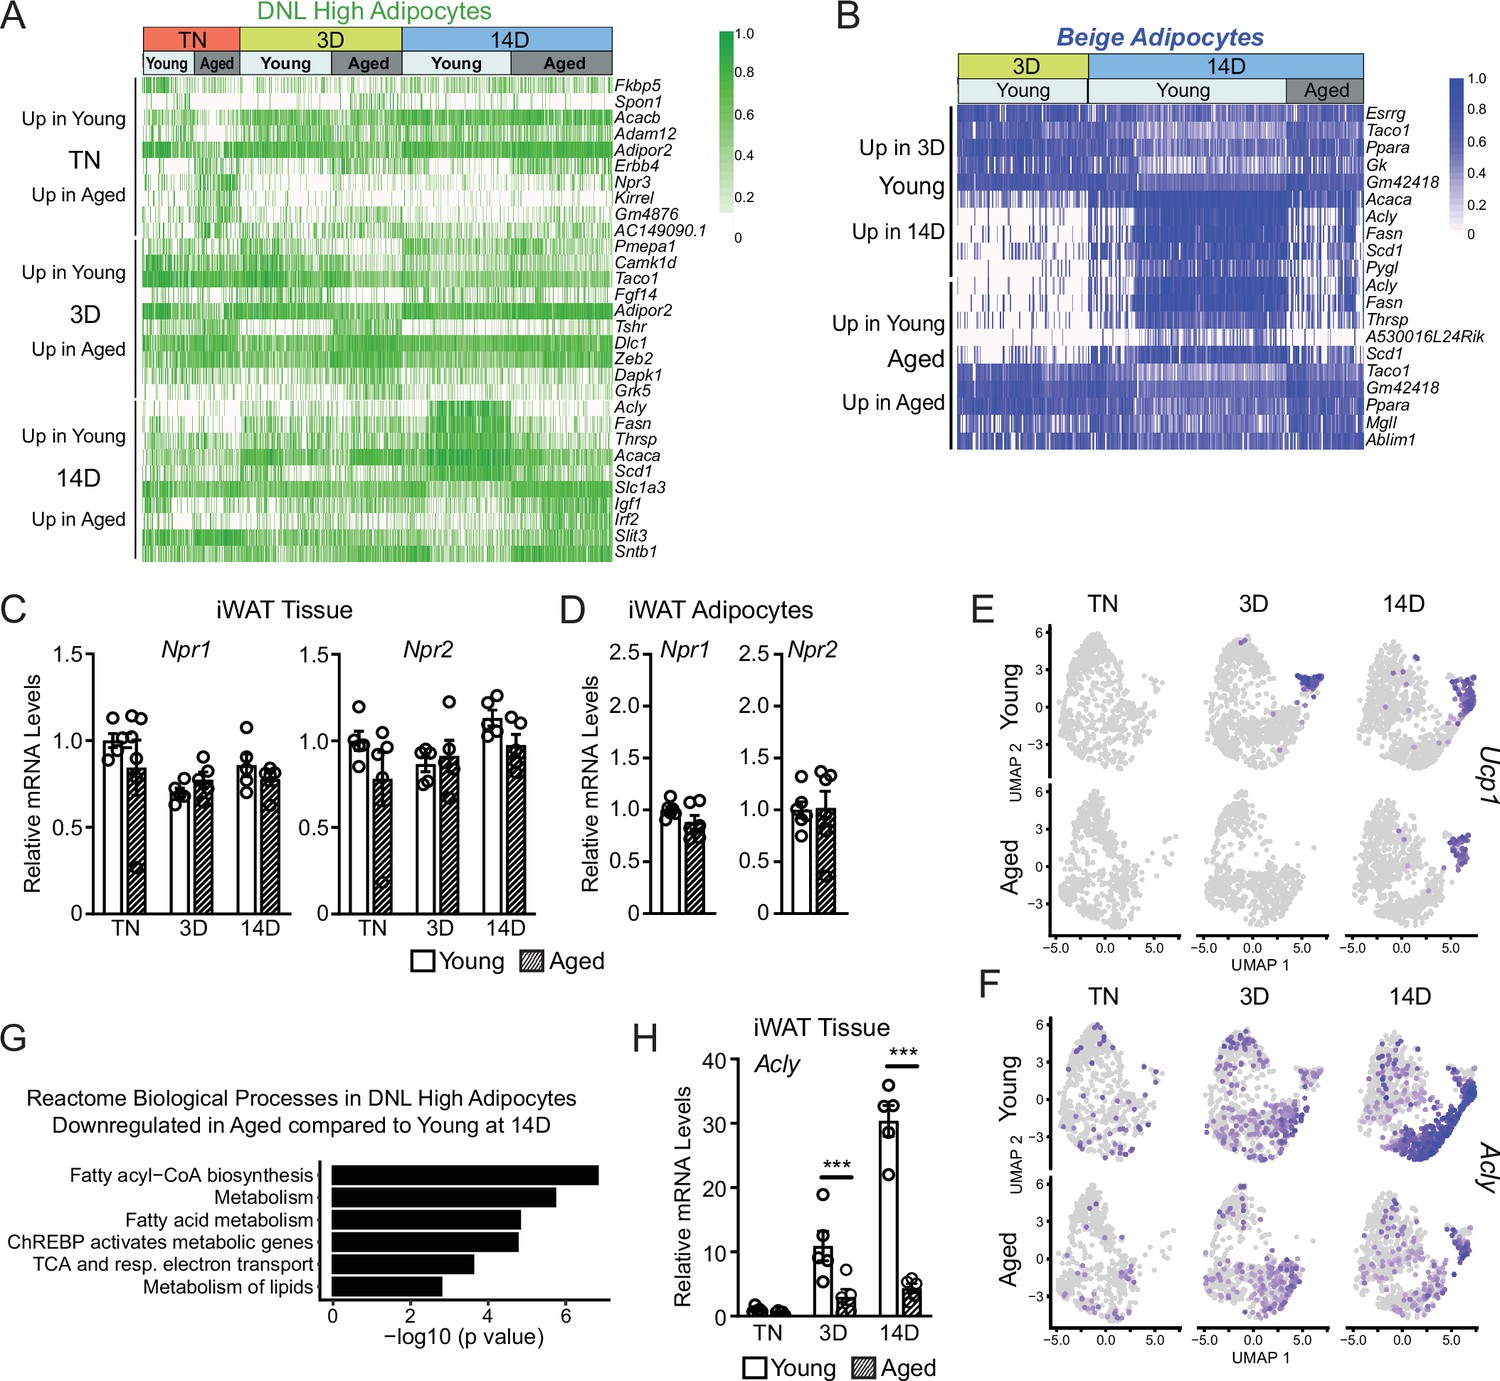
(A) Expression heatmap of the top aging-regulated genes in DNL-high adipocytes. (B) Expression heatmap of the top aging- and cold-regulated genes in beige adipocytes. (C, D) Npr1 and Npr2 mRNA levels in iWAT (from mouse groups in Figure 1A) (C), n=5 and in isolated adipocytes from iWAT (D), n=6. (E, F) UMAP of Ucp1 (E) and Acly (F) mRNA levels in adipocyte groups (from Figure 5D). (G) Enrichment analysis of age-regulated genes in DNL high adipocytes. (H) Acly mRNA levels in iWAT (from groups in Figure 1A) n=5. Data are mean ± SEM, points represent biological replicates, two groups analyzed using a Student’s t-test, and multiple conditions analyzed with a two-way ANOVA with a Tukey correction for multiple comparisons. Significance: *p<0.05; **p<0.01; ***p<0.001.
Tables
Key resources table
| Reagent type (species) or resource | Designation | Source or reference | Identifiers | Additional information |
|---|---|---|---|---|
| Genetic reagent (M. musculus) | C57BL/6 J | The Jackson Laboratory, Bar Harbor, ME | RRID:IMSR_JAX:000664 | |
| Genetic reagent (M. musculus) | C57BL/6JN | NIA, Bethesda, MD | NA | |
| Genetic reagent (M. musculus) | Rosa26 loxp-stop-loxp tdTomato Reporter (Ai14) | The Jackson Laboratory, Bar Harbor, ME | RRID:IMSR_JAX:007914 | |
| Genetic reagent (M. musculus) | PdgfraCreERT2 | The Jackson Laboratory, Bar Harbor, ME | RRID:IMSR_JAX:032770 | |
| Antibody | Rabbit polyclonal anti–red fluorescent protein (RFP) | Rockland, Pottstown, PA | 600-401-379, RRID:AB_2209751 | 1:500 |
| Antibody | Rabbit polyclonal anti-Perilipin (D418) | Cell Signaling, Denvers, MA | 3470, RRID:AB_2167268 | 1:200 |
| Antibody | Rabbit polyclonal anti- UCP1 | Specially made by AstraZeneca, Cambridge, UK | NA | 1:2000 |
| Antibody | Rabbit polyclonal Anti-mouse CD142 | Sino Biological, Chesterbrook, PA | R001 | 1:100 |
| Antibody | Goat polyclonal Anti-mouse CD142 | R & D Systems, Minneapolis, MN | AF3178, RRID:AB_2278143 | 1:50 |
| Antibody | Rat monoclonal Anti-mouse CD140a-(PDGFRɑ)-PECy7 | Biolegend, San Diego, CA | 135912, RRID:AB_2715974 | 1:100 |
| Antibody | Rat monoclonal Anti-mouse-CD31 (APC-Fire) | Biolegend, San Diego, CA | 102528, RRID:AB_2721491 | 1:1000 |
| Antibody | Rat monoclonal Anti-mouse CD45-allophycocyanin (APC/Cy7) | Biolegend, San Diego, CA | 103116, RRID:AB_312981 | 1:1000 |
| Antibody | Rat monoclonal Anti-mouse ICAM1-phycoerythrin (PE/Cy7) | Biolegend, San Diego, CA | 116122, RRID:AB_2715950 | 1:100 |
| Antibody | Rat monoclonal Anti-mouse CD26 (DPP-4)- fluorescein isothiocyanate (FITC) | Biolegend, San Diego, CA | 137806, RRID:AB_10663402 | 1:200 |
| Sequence-based reagent | mTbp | PMID:24703692 | NA | F-GAAGCTGCGGTACAATTCCAG R-CCCCTTGTACCCTTCACCAAT |
| Sequence-based reagent | mAdipoq | PMID:24703692 | NA | F-GCACTGGCAAGTTCTACTGCAA R-GTAGGTGAAGAGAACGGCCTTGT |
| Sequence-based reagent | mFabp4 | PMID:24703692 | NA | F-ACACCGAGATTTCCTTCAAACTG R-CCATCTAGGGTTATGATGCTCTTCA |
| Sequence-based reagent | mCidea | PMID:24703692 | NA | F-TGCTCTTCTGTATCGCCCAGT R-GCCGTGTTAAGGAATCTGCTG |
| Sequence-based reagent | mPgc1a | PMID:24703692 | NA | F-CCCTGCCATTGTTAAGACC R-TGCTGCTGTTCCTGTTTTC |
| Sequence-based reagent | mUcp1 | PMID:24703692 | NA | F-ACTGCCACACCTCCAGTCATT R-CTTTGCCTCACTCAGGATTGG |
| Sequence-based reagent | mDio2 | PMID:24703692 | NA | F-CAGTGTGGTGCACGTCTCCAATC R-TGAACCAAAGTTGACCACCAG |
| Sequence-based reagent | mAcly | PMID:31141698 | NA | F-GAGTGCTATTGCGCTTCCC R-GGTTGCCGAAGTCACAGGT |
| Sequence-based reagent | mNpr3 | This Paper | NA | F-TTTTCAGGAGGAGGGGTTGC R-ACACATGATCACCACTCGCT |
| Sequence-based reagent | mNpr1 | MGH PrimerBank | Primer Bank ID: 113930717 c1 | F-GCTTGTGCTCTATGCAGATCG R-CCTCGACGAACTCCTGGTG |
| Sequence-based reagent | mNpr2 | MGH PrimerBank | Primer Bank ID: 118129825 c2 | F-CATGACCCCGACCTTCTGTTG R-CGAACCAGGGTACGATAATGCT |
| Commercial assay or kit | ABI High-Capacity cDNA Synthesis kit | Applied Biosystems, Waltham, MA | 4368813 | |
| Commercial assay or kit | Purelink RNA Mini columns | Invitrogen, Waltham, MA | LT-12183018 | |
| Commercial assay or kit | TSA TMR Tyramide Reagent Pack | Akoya Biosciences, Marlborough, MA | NEL742001KT | |
| Commercial assay or kit | TSA Fluorescein Tyramide Reagent Pack | Akoya Biosciences, Marlborough, MA | NEL741001KT | |
| Commercial assay or kit | Bulls Eye Decloaking Buffer | Biocare, Pacheco, CA | BULL1000 MX | |
| Commercial assay or kit | AbC Total Antibody Compensation Bead Kit | BioLegend,San Diego, CA | A10497 | |
| Commercial assay or kit | Biotium Mix-n-Stain CF647 | Sigma, Burlington, MA | MX647S100 | |
| Commercial assay or kit | PicoPure RNA Isolation Kit | Invitrogen, Waltham, MA | KIT0204 | |
| Commercial assay or kit | Qubit dsDNA High Sensitivity assay kit | ThermoFisher, Waltham, MA | Q32851 | |
| Commercial assay or kit | DNA High Sensitivity Bioanalyzer Chip (Agilent) | Agilent, Santa Clara, CA | 5067–4626 | |
| Software, algorithm | Graphpad Prism | Graphpad, San Diego, CA | RRID:SCR_002798 | |
| Software, algorithm | Adobe Illustrator | Adobe, San Jose, CA | RRID:SCR_010279 | |
| Software, algorithm | Adobe Photoshop | Adobe, San Jose, CA | RRID:SCR_014199 | |
| Software, algorithm | Image J | PMID:22743772 | RRID:SCR_003070 | |
| Software, algorithm | Cell Ranger | 10 x Genomics | RRID:SCR_017344 | |
| Software, algorithm | Seurat | PMID:34062119 | RRID:SCR_016341 | |
| Software, algorithm | bcl2fastq | Illumina | RRID:SCR_015058 | |
| Software, algorithm | Cumulus | PMID:32719530 | RRID:SCR_021644 | |
| Software, algorithm | FACSDiva Softward | Becton Dickinson, Franklin Lakes, NJ | RRID:SCR_001456 | |
| Other | Tamoxifen (Free Base) | Sigma, Burlington, MA | T5648 | Synthetic estrogen receptor antagonist used to activate Cre. |
| Other | Corn Oil | Sigma, Burlington, MA | C8267 | Vehicle solution for tamoxifen. |
| Other | 16% Paraformaldehyde | EMS, Hatfield, PA | 15710 | Fixative used for tissue histology |
| Other | TRIzol | Invitrogen, Waltham, MA | 15596018 | Phenol-based solution used for nucleic acid extraction |
| Other | CL-316,243 | Sigma, Burlington, MA | C5976 | Agonist of Beta3-adrenergic receptor |
| Other | 4’,6-Diamidine-2’-phenylindole dihydrochloride (DAPI), 1:10,000 | Roche, Basel, Switzerland | 10236276001 | Fluorescent stain for DNA/nuclei |
| Other | Bovine Serum Albumin, fraction V, fatty-acid free | Gold Biotechnology, St. Louis, MO | A-421–250 | Protein carrier for small molecules |
| Other | DMEM/F12 | Fisher Scientific, Waltham, MA | 11320033 | Basal cell culture medium |
| Other | Fetal Bovine Serum | Omega Scientific, Tarzana, CA | FB-11, Lot 401714 | For cell culture |
| Other | Primocin | InvivoGen, San Diego, CA | ant-pm-2 | Anti-microbial for cell culture |
| Other | PCR Master Mix, Power SYBR Green | Applied Biosystems, Waltham, MA | 4367659 | Kit for qRT-PCR |
| Other | HBSS, 1 X | Fisher Scientific, Waltham, MA | 14175079 | Hank’s Balanced Salt Solution |
| Other | Dispase II | Roche, Basel, Switzerland | 4942078001 | Enzyme used for adipose tissue digestion |
| Other | Collagenase, Type 1 | Worthington, Lakewood, NJ | LS004197 | Enzyme used for adipose tissue digestion |
| Other | Red Blood Cell Lysis Buffer, 10 x | BioLegend, San Diego, CA | 420302 | For lysing red blood cells during cell isolations |
| Other | Human Insulin, Novolin | Novo Nordisk, Bagsvaerd, Denmark | 183311 | Used for cell culture studies |
| Other | Dexamethasone | Sigma-Aldrich, Burlington, VT | D4902 | Glucorticoid Receptor agonist |
| Other | 3-isobutyl-1-methylxanthine (IBMX) | Sigma-Aldrich, Burlington, VT | I7018 | Chemical used to Increase cAMP levels, used in adipocyte differentiation cocktail |
| Other | Rosiglitazone | Cayman Chemical, Ann Arbor, MI | 11884 | Synthetic PPARgamma activator |
| Other | Indomethacin | Sigma-Aldrich, Burlington, VT | I8280 | Chemical used in adipocyte differentiation cocktail |
| Other | 3,30,5-Triiodo-L-thyronine sodium salt (T3) | Sigma-Aldrich, Burlington, VT | T6397 | Thyroid Receptor agonist |
| Other | isoproterenol | Sigma-Aldrich, Burlington, VT | I6504 | Pan beta-adrenergic receptor agonist |
| Other | Bodipy 493/503 | Invitrogen, Waltham, MA | D3922 | Fluorescent dye for neutral lipids |
| Other | Hoechst 33342 | Thermo Fisher, Waltham, MA | 62249 | DNA stain |
| Other | Protector RNase Inhibitor | Roche, Basel, Switzerland | 3335399001 | Used for RT-PCR |
Additional files
Download links
A two-part list of links to download the article, or parts of the article, in various formats.
Downloads (link to download the article as PDF)
Open citations (links to open the citations from this article in various online reference manager services)
Cite this article (links to download the citations from this article in formats compatible with various reference manager tools)
Aging impairs cold-induced beige adipogenesis and adipocyte metabolic reprogramming
eLife 12:RP87756.
https://doi.org/10.7554/eLife.87756.3


