Allosteric activation or inhibition of PI3Kγ mediated through conformational changes in the p110γ helical domain
- Department of Biochemistry and Microbiology, University of Victoria, Canada
- Department of Biochemistry and Molecular Biology, The University of British Columbia, Canada
- Department of Chemistry and Biochemistry, Institute of Molecular Biology, University of Oregon, United States
Figures
Figure 1
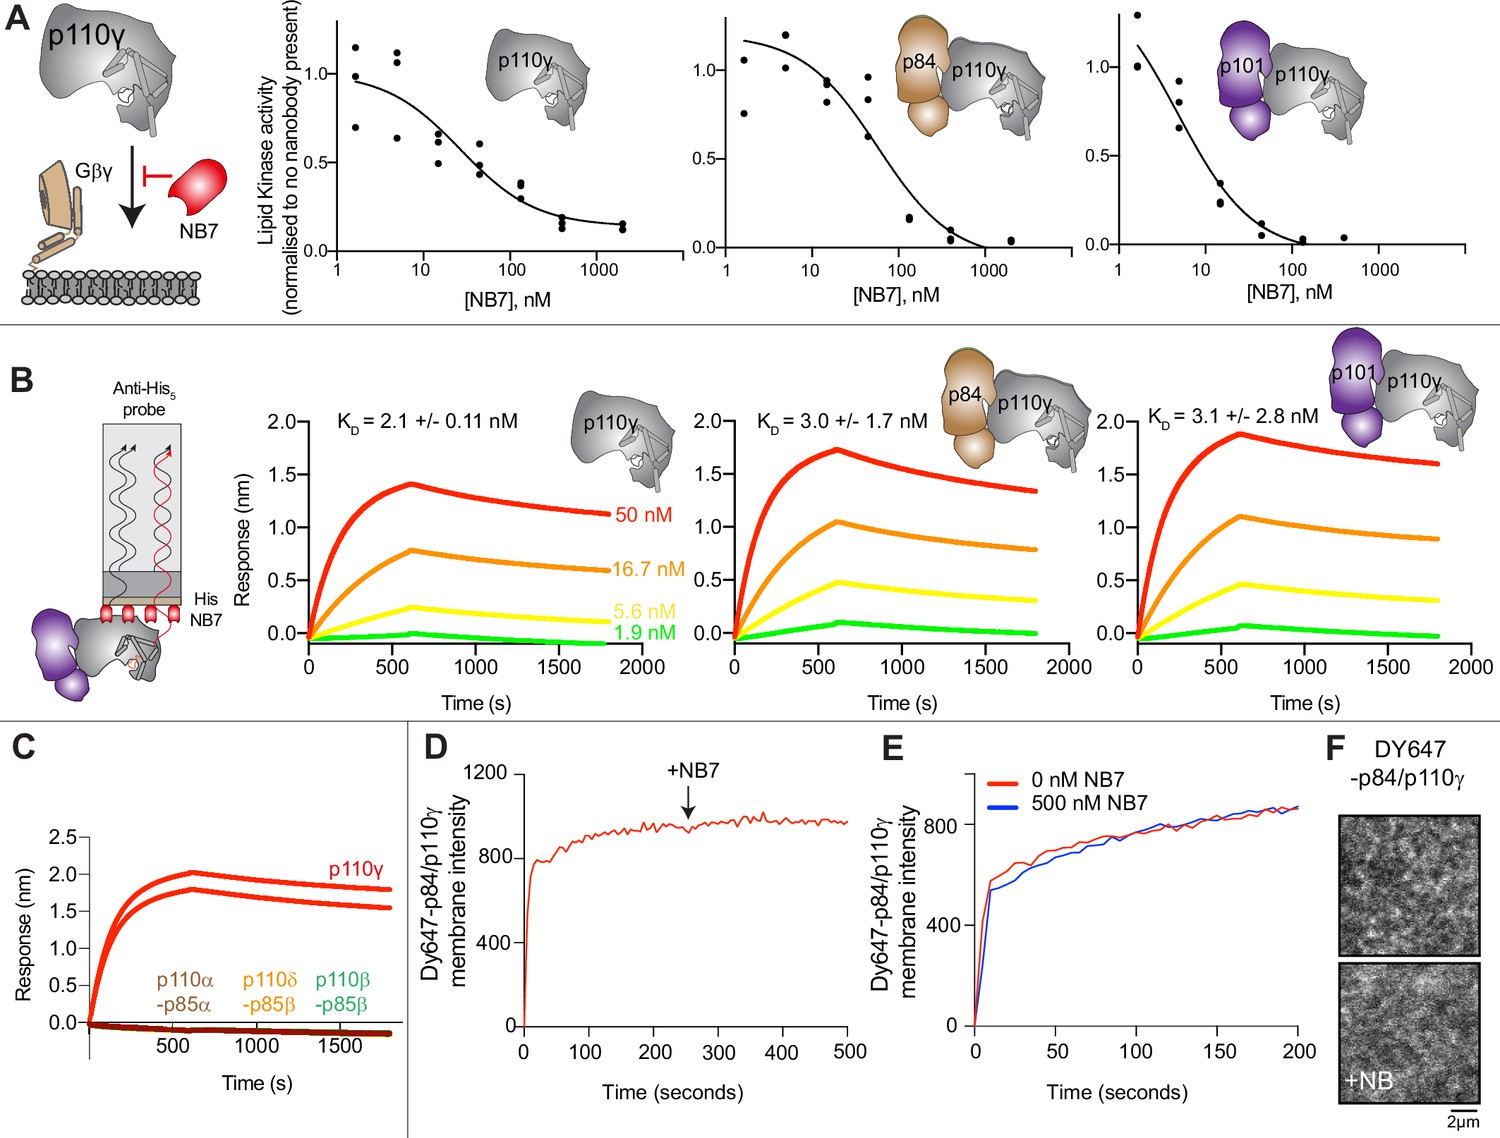
The inhibitory nanobody NB7 binds tightly to all p110γ complexes and inhibits kinase activity, but does not prevent membrane binding.
(A) Cartoon schematic depicting nanobody inhibition of activation by lipidated Gβγ (1.5 µM final concentration) on 5% PIP2 membrane (5% phosphatidylinositol 4,5-bisphosphate [PIP2], 95% phosphatidylserine [PS]) activation. Lipid kinase assays showed a potent inhibition of lipid kinase activity with increasing concentrations of NB7 (3–3000 nM) for the different complexes. Experiments are carried out in triplicate (n=3) with each replicate shown. The y-axis shows lipid kinase activity normalized for each complex activated by Gβγ in the absence of nanobody. Concentrations of each protein were selected to give a lipid kinase value in the detectable range of the ATPase Transcreener assay. The protein concentration of p110γ (300 nM), p110γ-p84 (330 nM), and p110γ-p101 (12 nM) was different due to intrinsic differences of each complex to be activated by lipidated Gβγ and is likely mainly dependent for the difference seen in NB7 response. (B) Association and dissociation curves for the dose response of His-NB7 binding to p110γ, p110γ-p84, and p110γ-p101 (50–1.9 nM) are shown. A cartoon schematic of biolayer interferometry (BLI) analysis of the binding of immobilized His-NB7 to p110γ is shown on the left. Dissociation constants (KD) were calculated based on a global fit to a 1:1 model for the top three concentrations and averaged with error shown. Error was calculated from the association and dissociation value (n=3) with standard deviation shown. Full details are present in Source data 1. (C) Association and dissociation curves for His-NB7 binding to p110γ, p110α-p85, p110β-p85, and p110δ-p85. Experiments were performed in duplicate with a final concentration of 50 nM of each class I phosphoinositide 3 kinase (PI3K) complex. (D) Effect of NB7 on PI3Kγ recruitment to supported lipid bilayers containing H-Ras (GTP) and farnesyl-G as measured by total internal reflection fluorescence microscopy (TIRF-M). DY647-p84/p110γ displays rapid equilibration kinetics and is insensitive to the addition of 500 nM nanobody (black arrow, 250 s) on supported lipid bilayers containing H-Ras (GTP) and farnesyl-G. (E) Kinetics of 50 nM DY647-p84/p110γ membrane recruitment appears indistinguishable in the absence and presence of nanobody. Prior to sample injection, DY647-p84/p110γ was incubated for 10 min with 500 nM nanobody. (F) Representative TIRF-M images showing the localization of 50 nM DY647-p84/p110γ visualized in the absence or presence of 500 nM nanobody (+NB7). Membrane composition for panels C–E: 93% DOPC, 5% DOPS, 2% MCC-PE, Ras (GTP) covalently attached to MCC-PE, and 200 nM farnesyl-G.
Figure 2 with 3 supplements
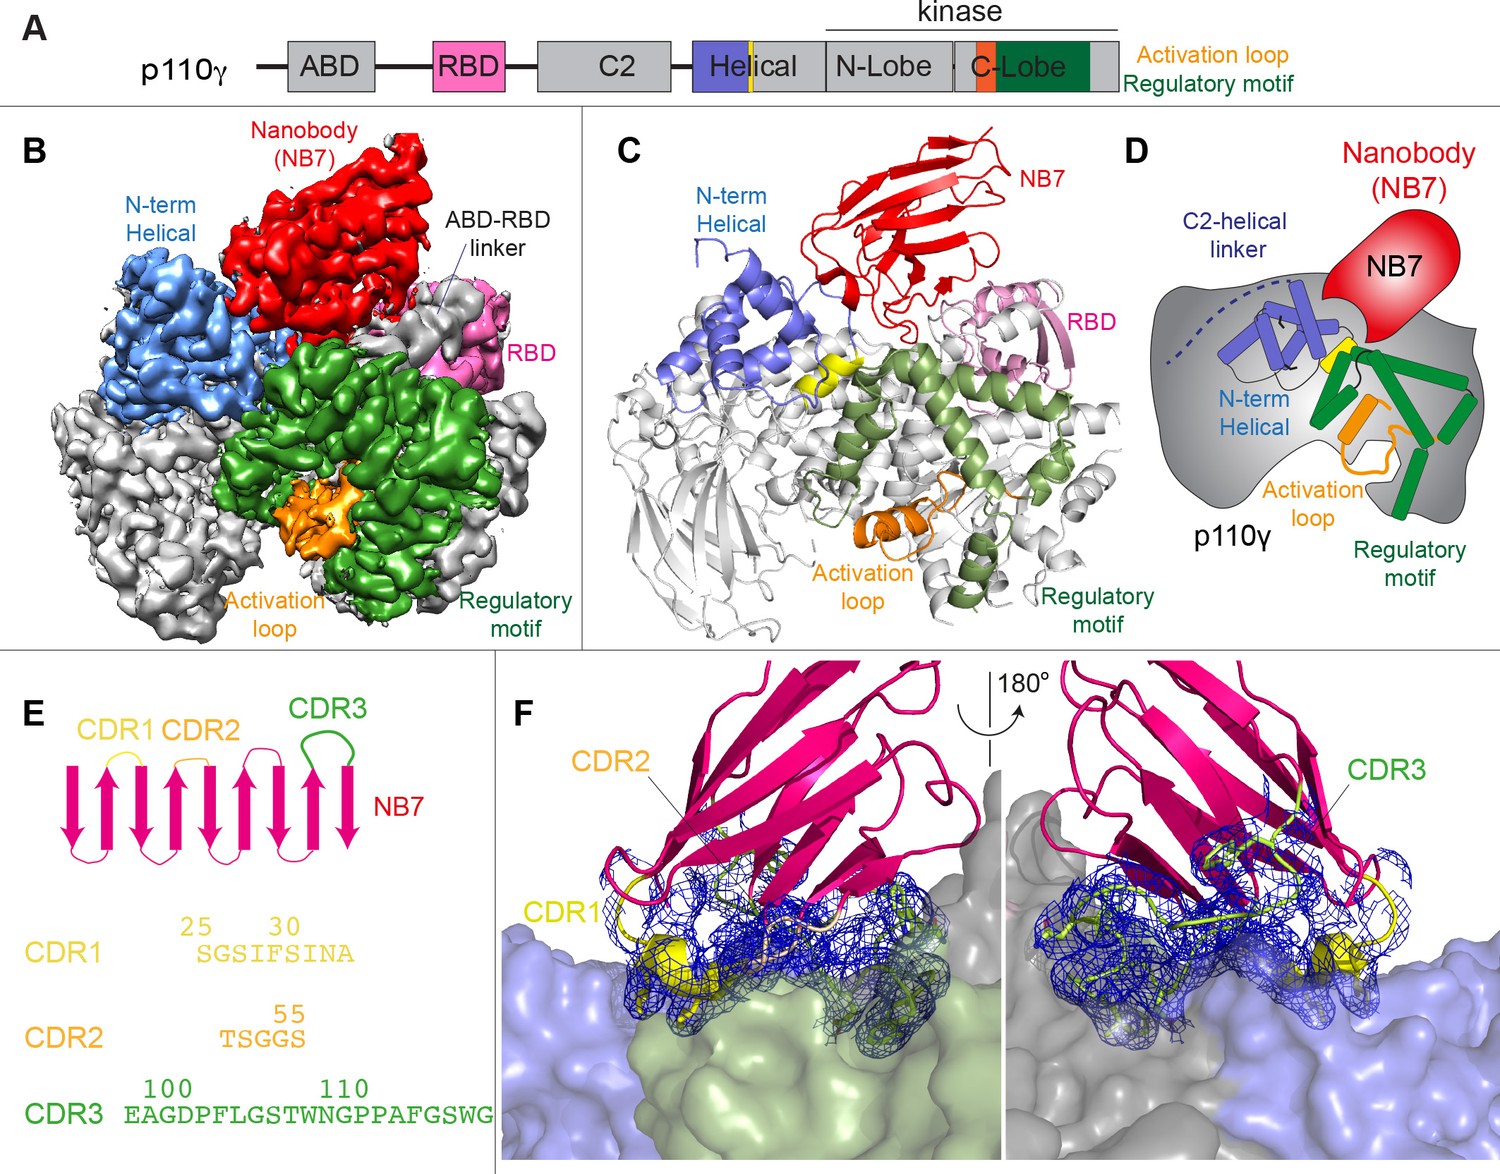
Structure of p110γ bound to inhibitory nanobody NB7.
(A) Domain schematics of p110γ with helical domain (blue), activation loop (orange), and regulatory motif (green) of p110γ annotated. (B) Cryo electron microscopy (cryo-EM) density of the p110γ-NB7 complex colored according to the schematic in (A). (C) Cartoon model of the structure of p110γ bound to NB7 colored according to (A). (D) Schematic depicting the key features of p110γ and the nanobody binding site, colored according to panel (A). (E) Domain schematic of NB7 complementarity determining regions (CDRs) and their sequences. (F) Zoom in on the binding interface of NB7, with the CDRs colored as in panel E, and the electron density of the CDRs contoured at 3σ (blue mesh).
Figure 2—figure supplement 1
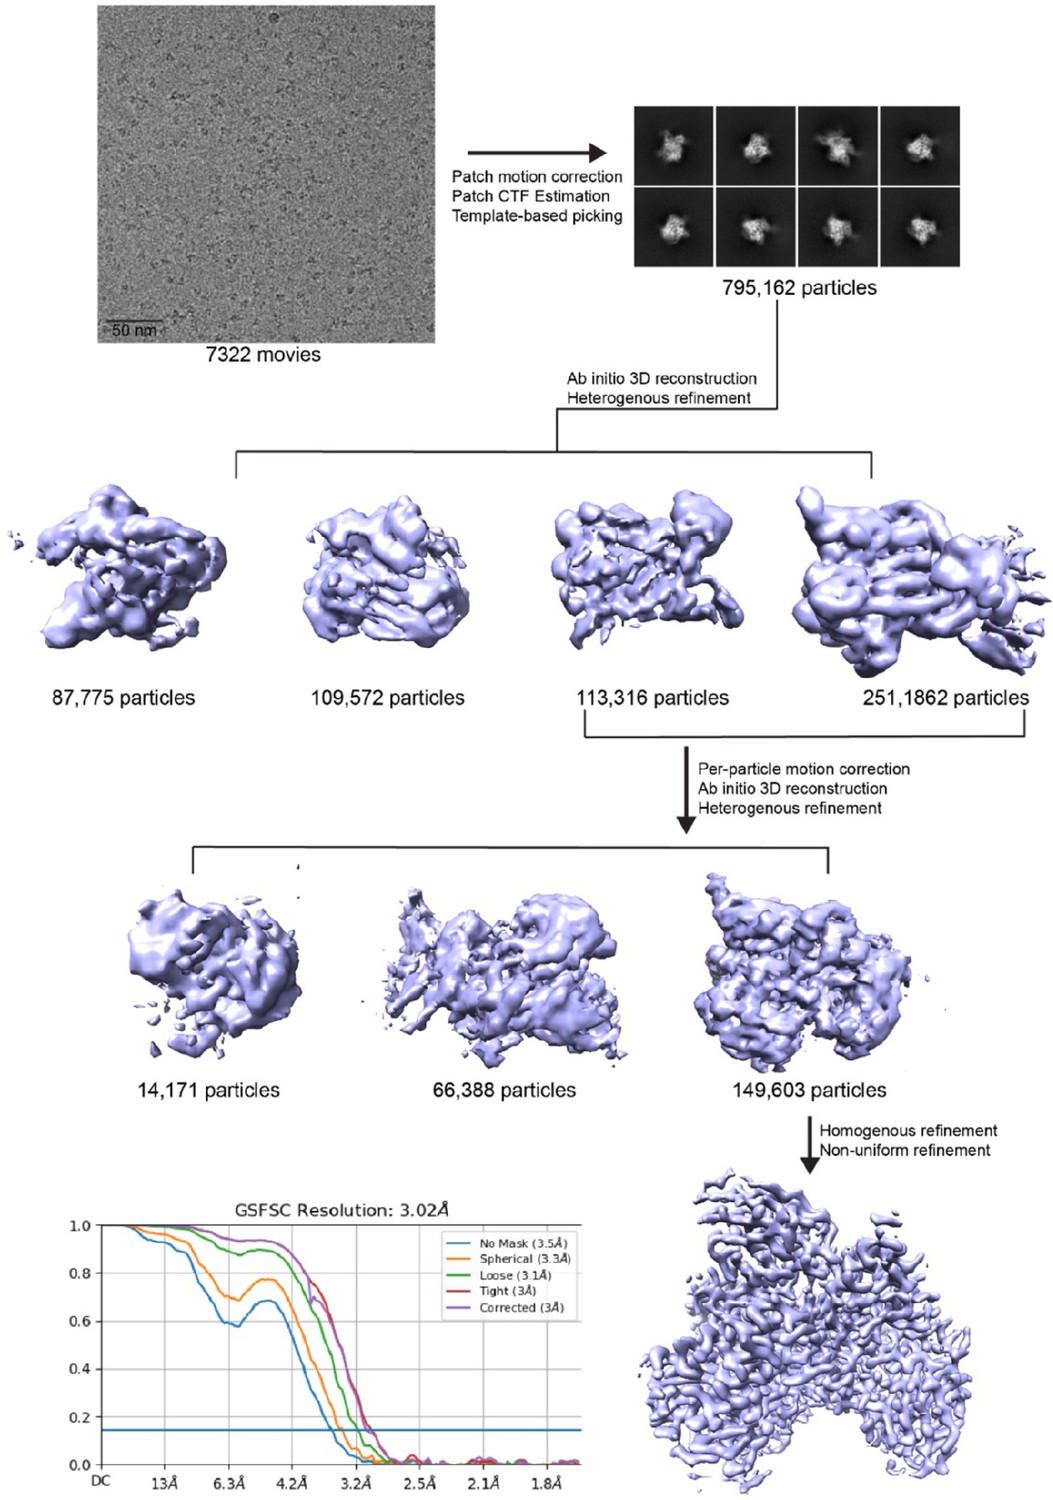
p110γ-NB7 complex cryo electron microscopy (cryo-EM) analysis workflow.
Cryo-EM processing workflow of p110γ-NB7 complex is shown in order of a representative micrographs, representative 2D classification and 3D reconstruction processing strategy. Bottom left shows gold-standard Fourier shell correlation (FSC) curve of final round on non-uniform homogenous refinement.
Figure 2—figure supplement 2
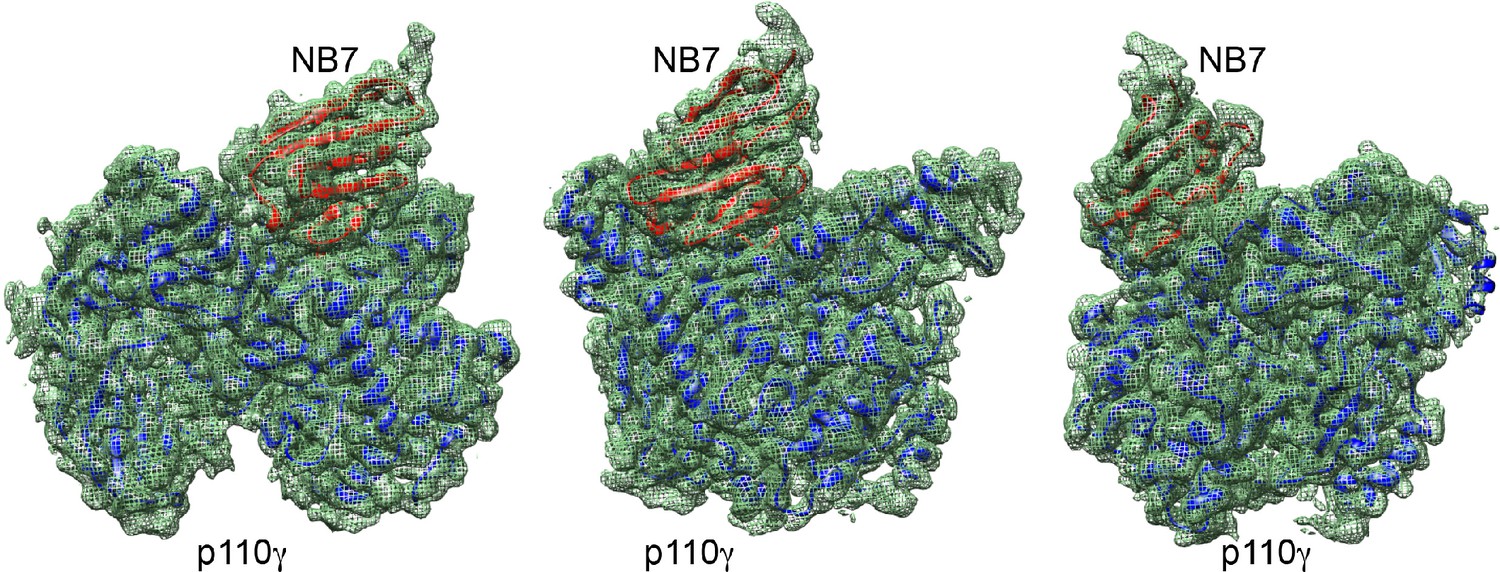
Density fit of p110γ-NB7 complex.
Model of p110γ (blue)/NB7 (red) complex in different orientations is shown fit within the cryo electron microscopy (cryo-EM) density map (green mesh).
Figure 2—figure supplement 3
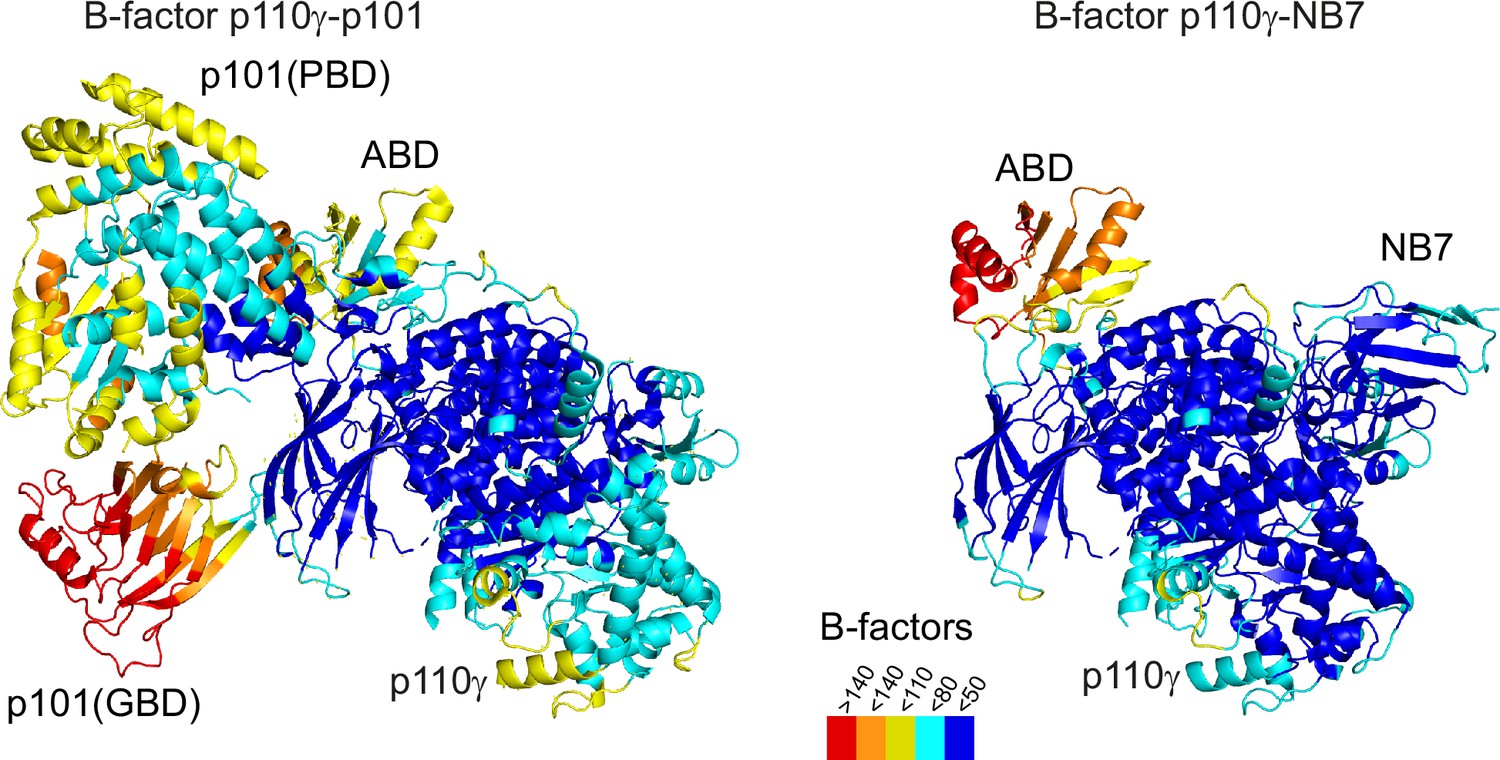
Comparison of full-length p110γ bound to NB7 compared to p110γ-p101.
The structure of the p110γ-p101 complex (PDB: 7MEZ) compared to the NB7-p110γ complex is shown colored according to B-factor based on the legend.
Figure 3 with 1 supplement
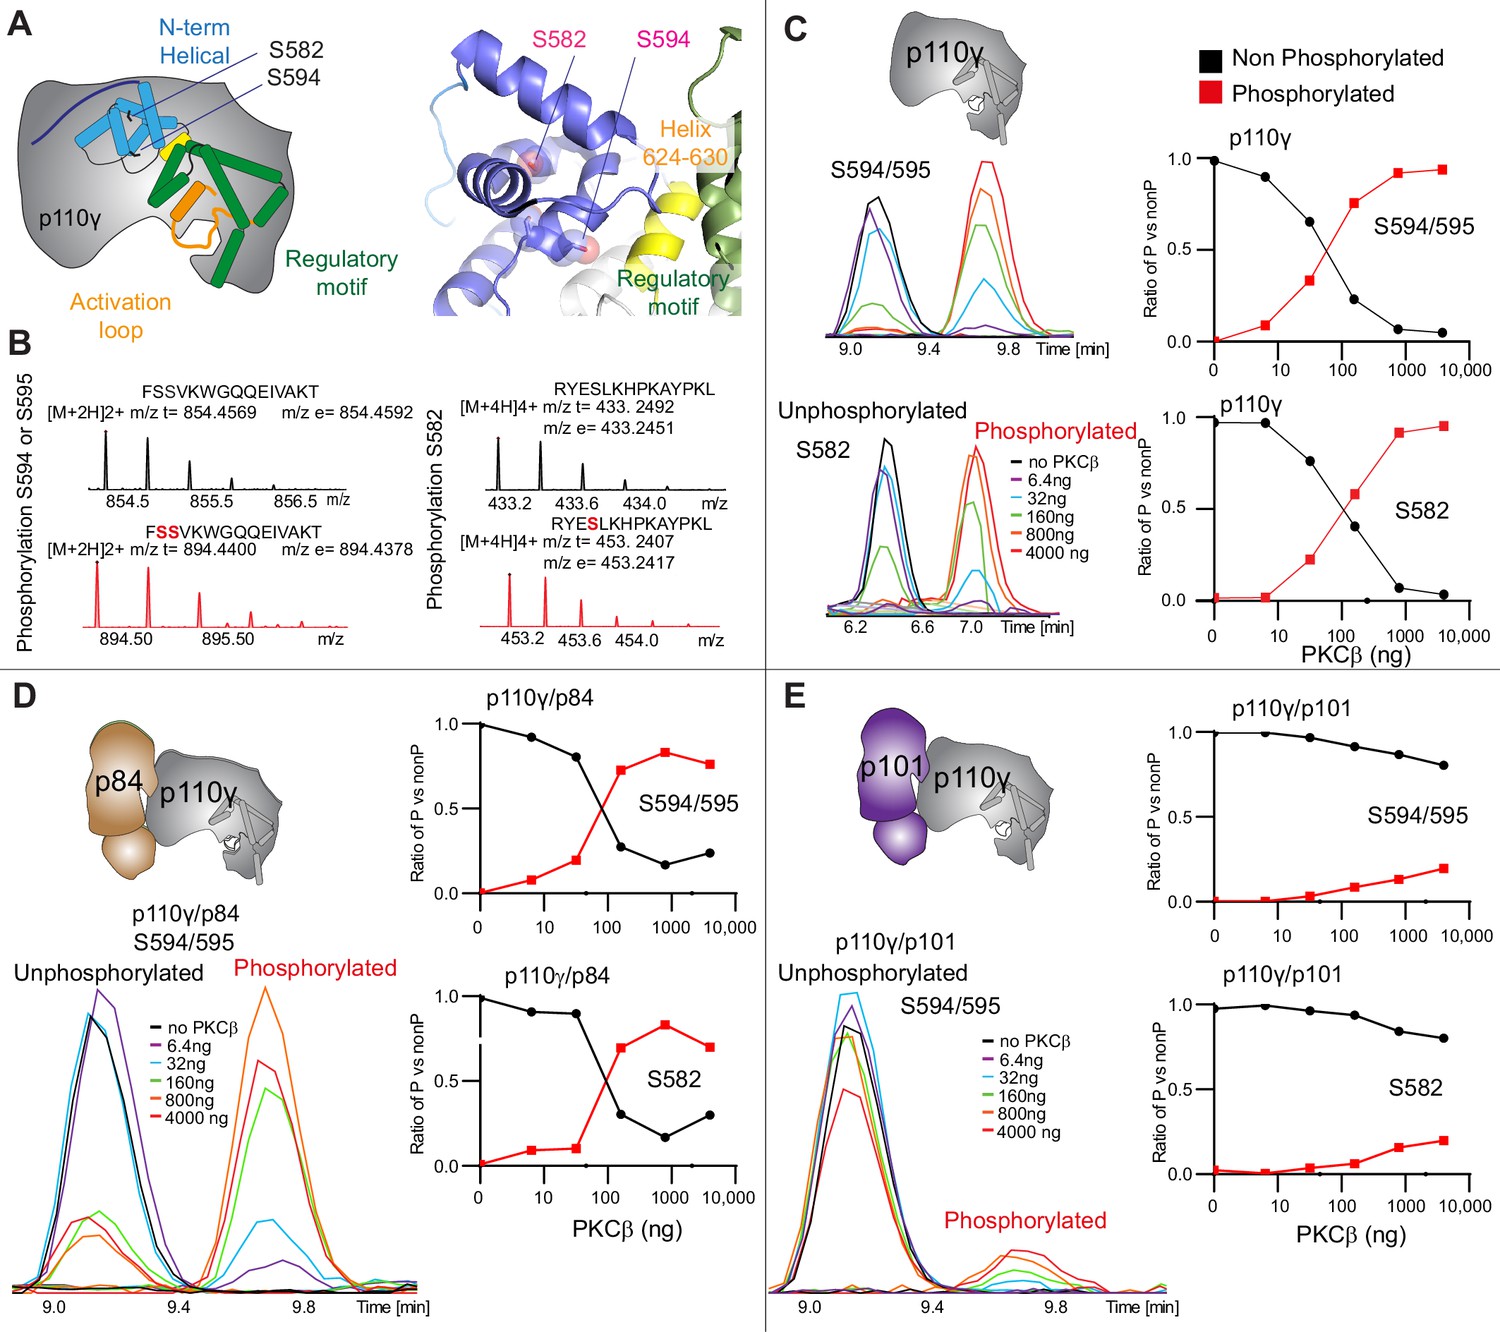
PKCβ leads to dual phosphorylation of internal sites in the helical domain, with selectivity for apo p110γ and p110γ-p84 over p110γ-p101.
(A) Putative phosphorylation sites mapped on the structure of p110γ (PDB: 7MEZ) and cartoon schematic. The regions are colored based on domain schematics featured in Figure 2A. (B) Raw MS spectra of the unphosphorylated and phosphorylated peptide for a region spanning 579–592 (RYESLKHPKAYPKL) and 593–607 (FSSVKWGQQEIVAKT). The putative phosphorylation sites in the sequence are shown in red, with the m/z theoretical (m/z t) and m/z experimental (m/z t) shown below each sequence. (C–E) Extracted traces and ratios of the intensity of extracted ion traces of different phosphorylation site peptides (top to bottom: S594/S595 and S582) from (C) p110γ, (D) p110γ/p84, or (E) p110γ/p101 samples treated with increasing concentration of PKCβ according to the legend. The black traces in the ratio graphs are the intensity of the non-phosphorylated peptide, and the red traces in the ratio graphs are the intensity of the phosphorylated peptide.
Figure 3—figure supplement 1
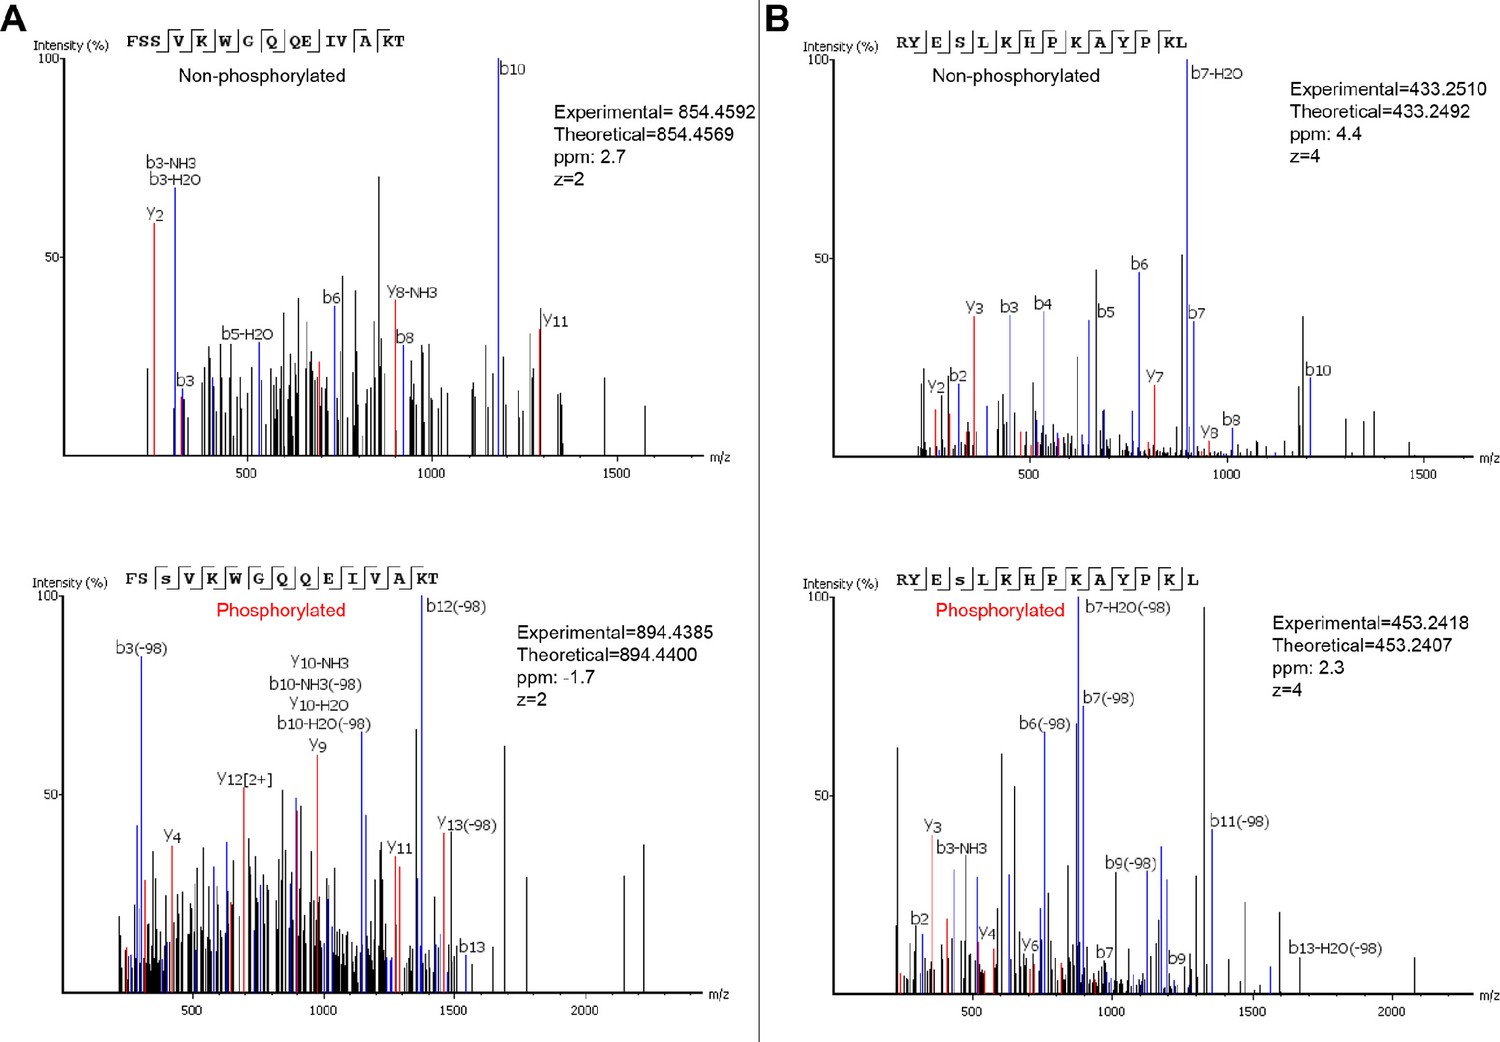
MS/MS spectra of peptides spanning S582 and S594/S595 for both phosphorylated and unphosphorylated states.
The theoretical and experimental mass are annotated for all peptides.
Figure 4
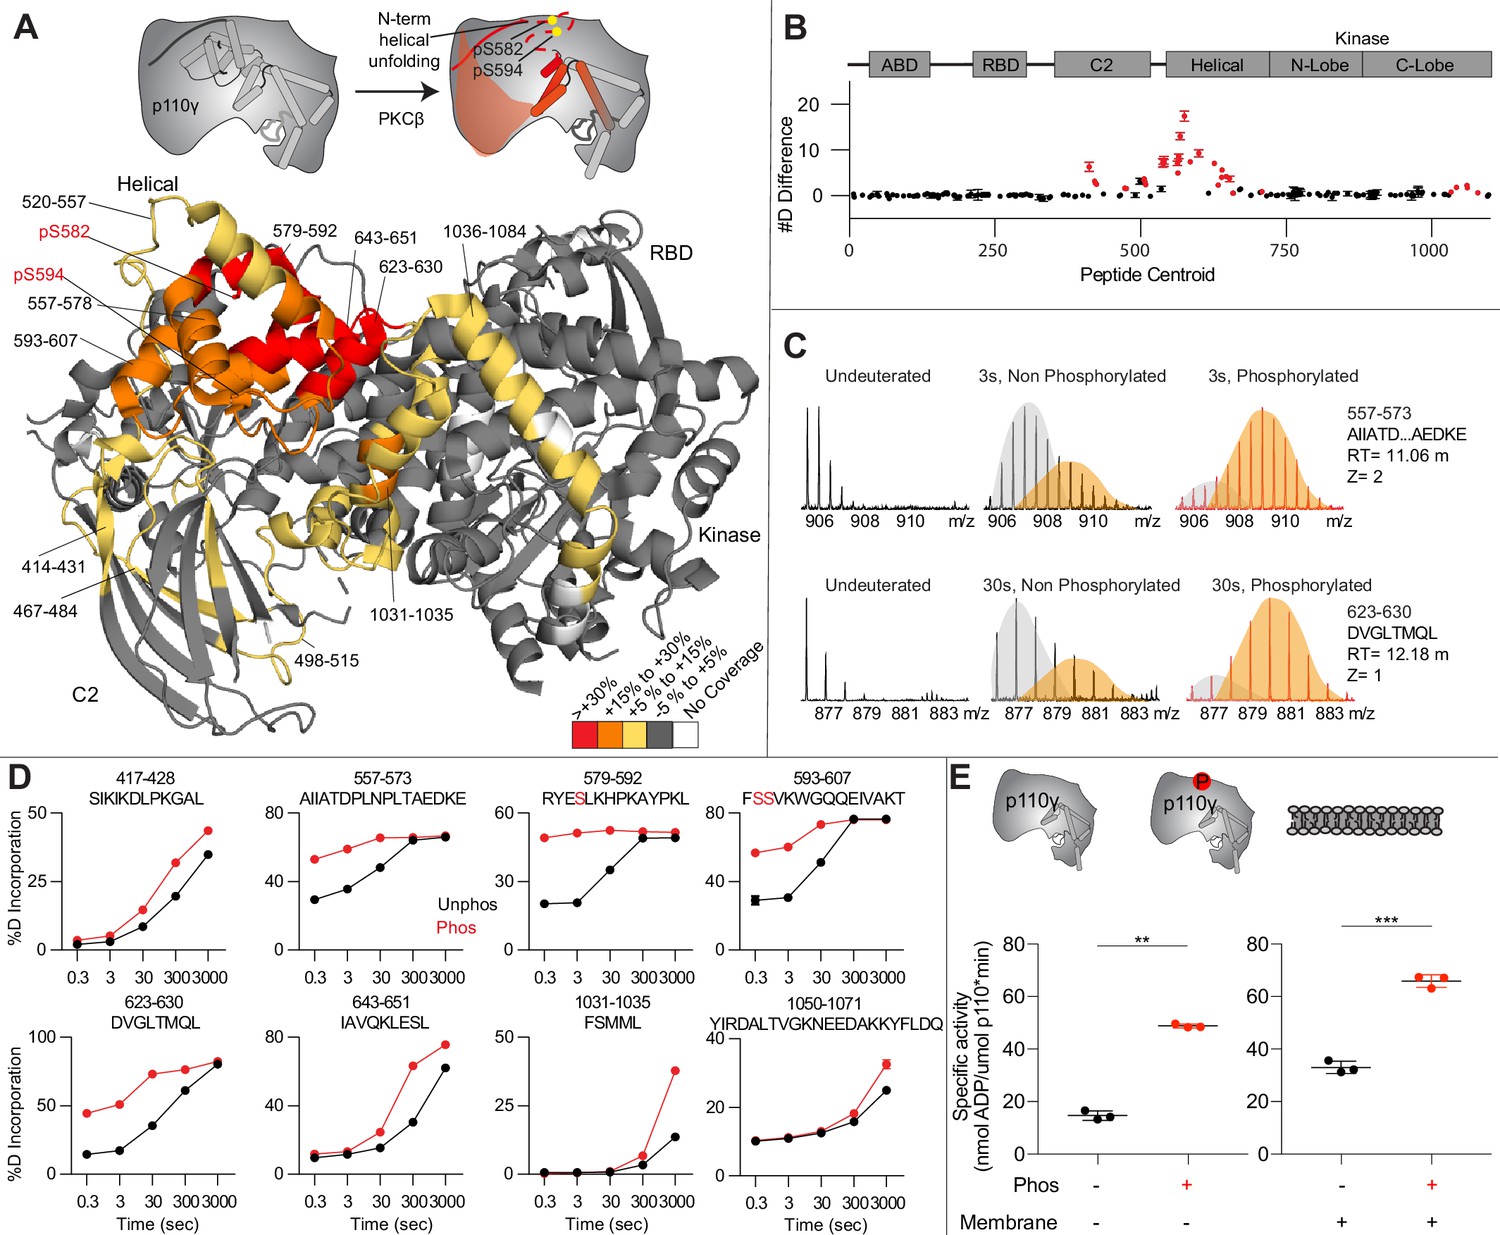
Activating phosphorylation at the helical domain leads to opening of the regulatory motif.
(A) Hydrogen-deuterium exchange mass spectrometry (HDX-MS) comparing apo and phosphorylated p110γ. Significant differences in deuterium exchange are mapped on to the structure and cartoon of p110γ according to the legend (PDB: 7MEZ). (B) The graph of the #D difference in deuterium incorporation for p110γ, with each point representing a single peptide. Peptides colored in red are those that had a significant change in the mutants (greater than 0.4 Da and 5% difference at any time point, with a two tailed t-test p<0.01). Error bars are SD (n=3). (C) Representative bimodal distribution (EX1 kinetics) observed in the helical domain peptides of p110γ. (D) Representative p110γ peptides displaying increases in exchange in the phosphorylated state are shown. For all panels, error bars show SD (n = 3). (E) Measurement of ATP to ADP conversion of phosphorylated and non-phosphorylated p110γ (1000 nM final concentration) ATPase activity in the absence (left) and presence of PIP2 membranes (5% phosphatidylinositol 4,5-bisphosphate [PIP2], 95% phosphatidylserine [PS]) activation (right). Significance is indicated by **(<0.001%) and ***(<0.0001%).
Figure 5
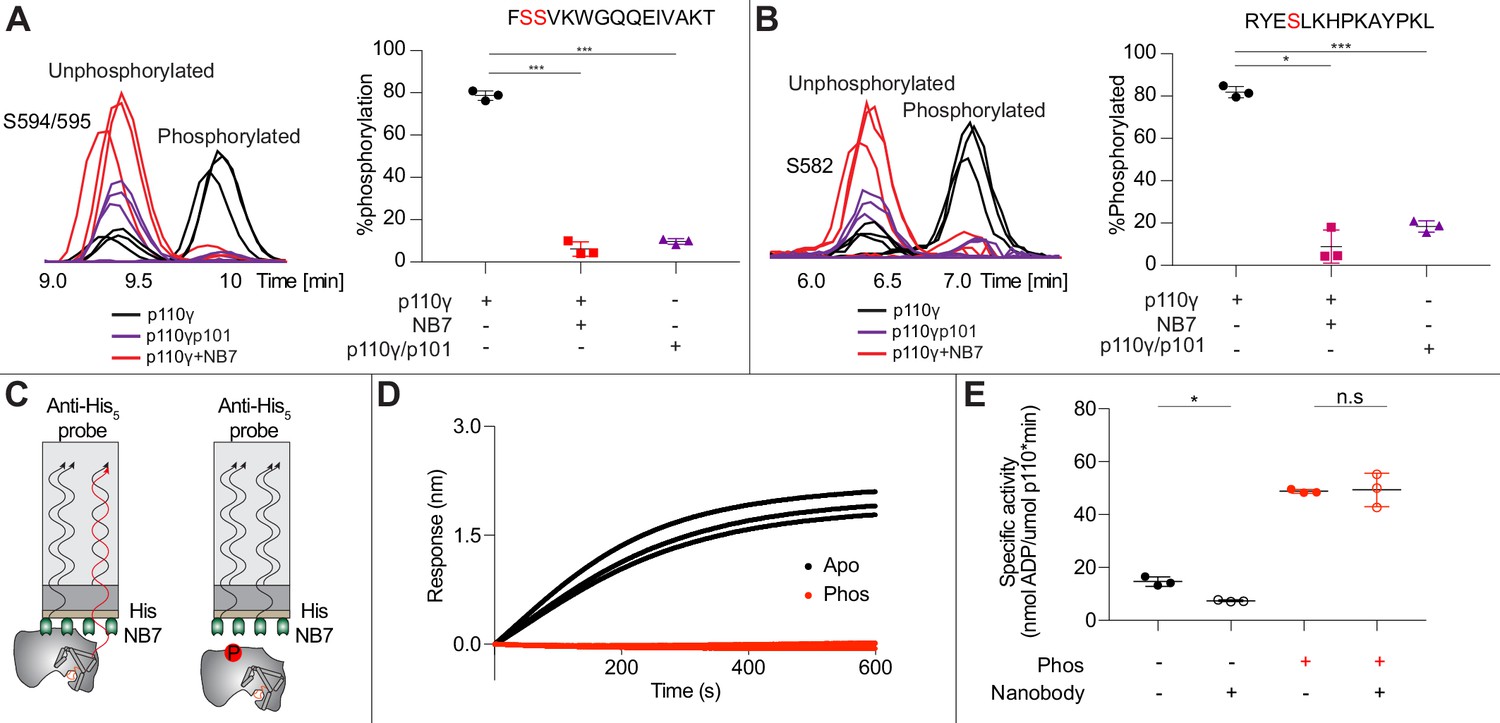
Nanobody NB7 blocks PKCβ phosphorylation, and phosphorylation prevents nanobody binding.
(A) Extracted ion chromatograms for p110γ, p110γ-p101, and p110γ bound to NB7 are shown for the S594 or S595 phosphorylation site in p110γ. A bar graph showing the intensities of phosphorylated and non-phosphorylated p110γ peptide (593-607) for p110γ (black), p110γ with NB7 (red), and p110γ-p101 (purple) are shown to the right of the extracted ion chromatograms (n=3, right). In all experiments in panels A+B, PKCβ was present at 500 nM. Significance is indicated by ***(<0.0001%). (B) Extracted ion chromatograms for p110γ, p110γ-p101, and p110γ bound to NB7 are shown for the S582 phosphorylation site in p110γ. A bar graph showing the intensities of phosphorylated and non-phosphorylated p110γ peptide (579-592) p110γ (black), p110γ with NB7 (red), and p110γ-p101 (purple) are shown to the right of the extracted ion chromatograms (n=3, right). Significance is indicated by *(<0.01%) and ***(<0.0001%). The putative phosphorylation site is shown in red in the sequence above the bar graphs for both panels A+B. (C) Cartoon schematic of biolayer interferometry (BLI) analysis of the binding of immobilized His-NB7 to phosphorylated and non-phosphorylated p110γ. (D) Association curves for phosphorylated and non-phosphorylated p110γ (25 nM) binding to His-NB7 are shown (n=3). (E) ATPase kinase activity assays comparing the activation/inhibition of phosphorylated and non-phosphorylated p110γ (1000 nM) with or without nanobody (3000 nM final) in the absence of PIP2 membranes. Significance is indicated by *(<0.05%) and NS (>0.05%).
Figure 6
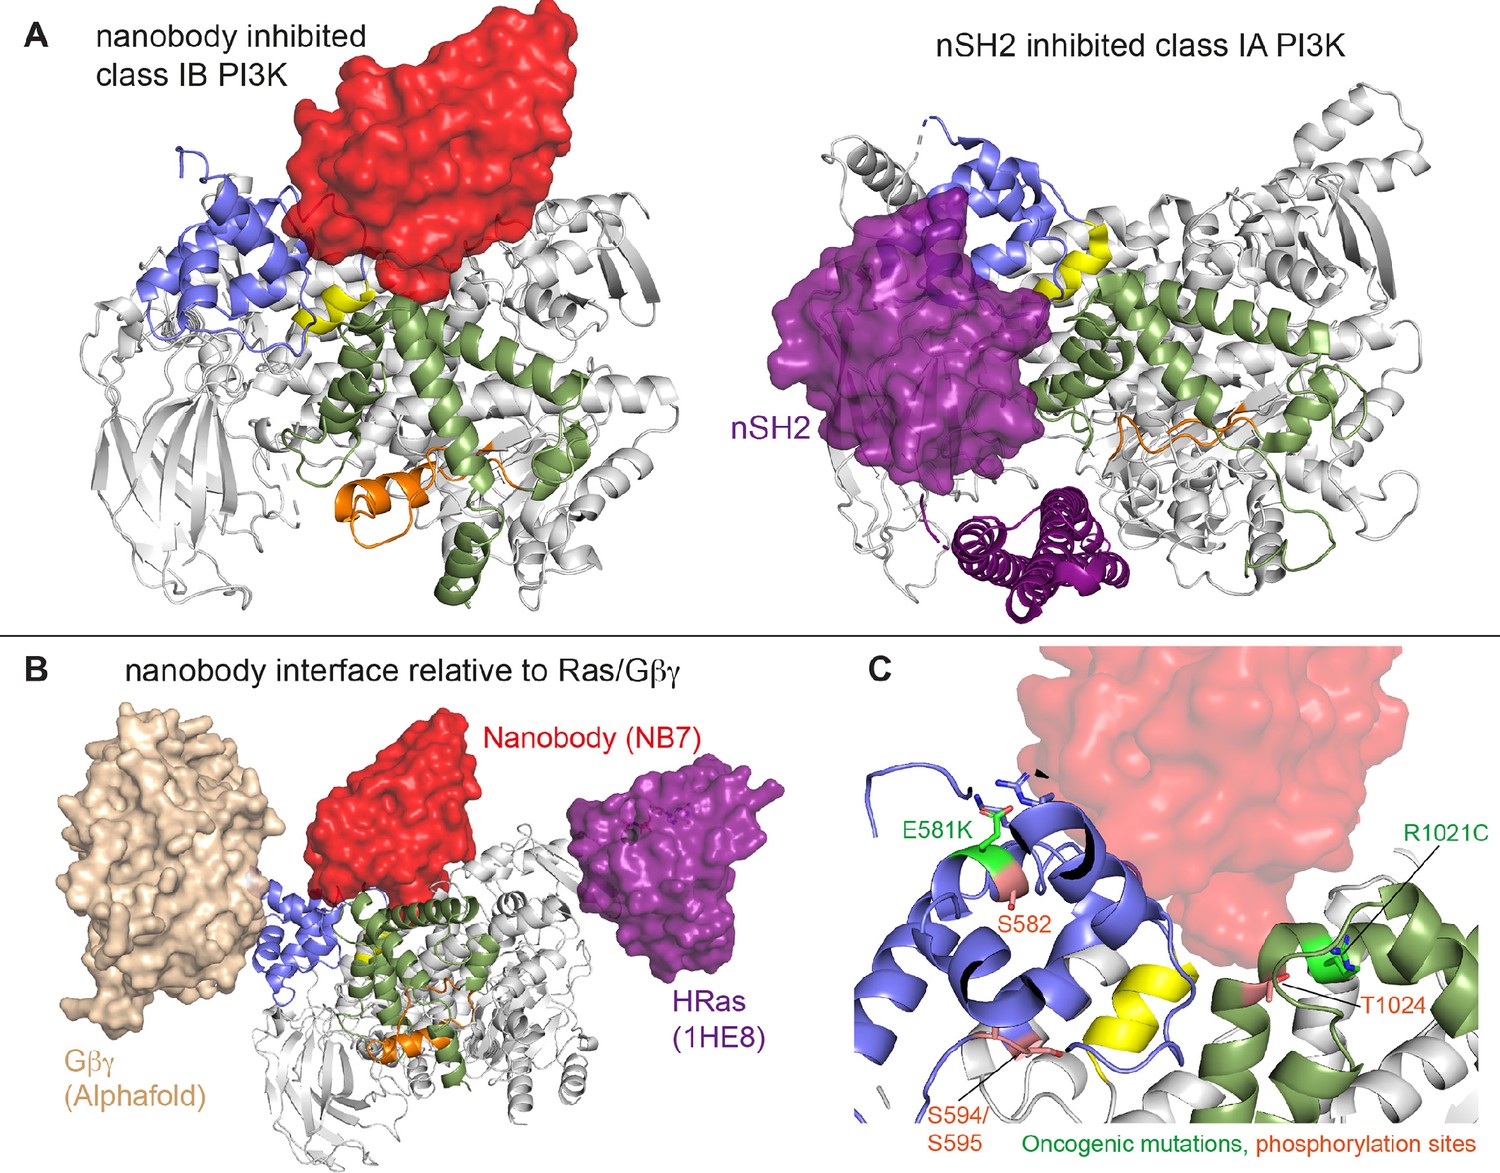
Comparison of nanobody binding site compared to p85 inhibition of class IA phosphoinositide 3 kinases (PI3Ks) and class IB activation sites.
(A) Comparison of the nanobody NB7 binding site in p110γ compared to the nSH2 inhibitory site in p110α (PDB: 3HHM) (Mandelker et al., 2009). (B) Comparison of the nanobody NB7 binding site in p110γ compared to the X-ray structure of the Ras binding site (PDB: 1HE8) (Pacold et al., 2000) and the Alphafold model of Gβγ bound to p110γ (Rathinaswamy et al., 2023). (C) Oncogenic mutations and post-translational modifications in spatial proximity to the nanobody binding site.
Tables
Appendix 1—key resources table
| Reagent type (species) or resource | Designation | Source or reference | Identifiers | Additional information |
|---|---|---|---|---|
| Strain, strain background (Escherichia coli) | E. coli XL10-GOLD KanR Ultracompetent Cells | Agilent | 200317 | |
| Strain, strain background (Escherichia coli) | BL21 E. coli C41 (DE3) RIPL | PMID: 24876499 | C41 | |
| Strain, strain background (Spodoptera frugiperda) | Sf9 Insect Cells | Expression systems | 94-001S | |
| Strain, strain background (Escherichia coli) | E. coli DH10EMBacY Competent Cells | Geneva Biotech | DH10EMBacY | |
| Recombinant DNA reagent | pMultiBac-Gβ1/Gγ2 | PMID:34452907 | pOP737 | |
| Recombinant DNA reagent | pACEBac1-hsp110γ | PMID:34452907 | MR30 | |
| Recombinant DNA reagent | pMultiBac-hsp110γ-ssp101 | PMID:34452907 | MR22 | |
| Recombinant DNA reagent | pMultiBac-hsp110γ-mmp84 | PMID:34452907 | MR24 | |
| Recombinant DNA reagent | pFastBac HRas G12V | PMID:34452907 | BS9 | |
| Recombinant DNA reagent | biGBac hsp110γ/ybbr-hsp84 | PMID:36842083 | HP28 | |
| Recombinant DNA reagent | biGBac hsp110γ/ybbr-hsp101 | PMID:36842083 | HP29 | |
| Recombinant DNA reagent | his6-GST-PrescissionProtease-SNAP-RBD(K65E) | PMID:34452907 | pSH936 | |
| Recombinant DNA reagent | his6TEV-HRas(1-184aa) C118S, C181S | PMID:34452907 | pSH414 | |
| Recombinant DNA reagent | his6-G2, SNAP-G1 (DUAL FastBac) | PMID:34452907 | pSH651 | |
| Recombinant DNA reagent | pACEBAC-PKCβII (internal tev cleavage site) | This paper | pMR56 | |
| Recombinant DNA reagent | pFASTBac p110α | PMID: 28515318 | pOV1181 | |
| Recombinant DNA reagent | pFASTBac p110β | PMID: 28515318 | pOV1182 | |
| Recombinant DNA reagent | pFASTBac p110δ | PMID: 28515318 | pOV1183 | |
| Recombinant DNA reagent | pFASTBac p85β | This paper | EX21 | |
| Sequence-based reagent | Fwd primer for amplifying KD of PKCII | Sigma | MR51F | GTATTTTCAGGGCgccggtaccACGA CCAACACTGTCTCCAAATTTG |
| Sequence-based reagent | Rvs primer for amplifying KD of PKCII | Sigma | MR51R | gactcgagcggccgcTTATAGCTCTT GACTTCGGGTTTTAAAAATTCAG |
| Sequence-based reagent | Fwd primer for amplifying N term of PKCII | Sigma | MR52F | CCATCACggatctggcggtagt ATGGCTGACCCGGCTGCG |
| Sequence-based reagent | Rvs primer for amplifying N term of PKCII | Sigma | MR52R | GCCCTGAAAATACAGGTTTTCCTTTTCTTCCGGGACCTTGGTTCCC |
| Sequence-based reagent | Fwd primer for adding stop codon to PKCII | Sigma | MR56F | AGTCAAGAGCTAAgcgg ccgctcgagtctagagcctgc |
| Sequence-based reagent | Rvs primer for adding stop codon to PKCII | Sigma | MR56R | gactcgagcggccgcTTAGCTCTTGA CTTCGGGTTTTAAAAATTCAG |
| Commercial assay or kit | Transcreener ADP2 FI Assay (1000 Assay, 384 Well) | BellBrook Labs | 3013-1K | |
| Chemical compound, drug | Deuterium oxide 99.9% | Sigma | 151882 | |
| Chemical compound, drug | Guanosine 5′-diphosphate (GDP) sodium salt hydrate | Sigma | G7127-100MG | |
| Chemical compound, drug | Guanosine 5′-triphosphate (GTP) sodium salt hydrate | Sigma | G8877-250MG | |
| Chemical compound, drug | Sodium deoxycholate | Sigma | D6750 | |
| Chemical compound, drug | Polyoxyethylene (10) lauryl ether | Sigma | P9769 | |
| Chemical compound, drug | CHAPS, Molecular Biology Grade | EMD Millipore | 220201 | |
| Chemical compound, drug | Phosphatidylserine (Porcine Brain) | Avanti | 840032C | |
| Chemical compound, drug | Phosphatidylethanolamine (Egg yolk) | Sigma | P6386 | |
| Chemical compound, drug | Cholesterol | Sigma | 47,127U | |
| Chemical compound, drug | Phosphatidylcholine (Egg yolk) | Avanti | 840051C | |
| Chemical compound, drug | Phosphatidylinositol-4,5-bisphosphate (Porcine Brain) | Avanti | 840046 | |
| Chemical compound, drug | Sphingomyelin (Egg yolk) | Sigma | S0756 | |
| Chemical compound, drug | 1,2-Dioleoyl-sn-glycero-3-phosphocholine (DOPC) | Avanti | 850375C | |
| Chemical compound, drug | 1,2-Dioleoyl-sn-glycero-3-phospho-L-serine (18:1, DOPS) | Avanti | 840035C | |
| Chemical compound, drug | 1,2-Dioleoyl-sn-glycero-3-phosphoethanolamine-N-[4-(p-maleimidomethyl)cyclohexane-carboxamide] (18:1 MCC-PE) | Avanti | 780201C | |
| Chemical compound, drug | 10 mg/mL beta casein solution | Thermo Fisher | 37528 | |
| Chemical compound, drug | 10× PBS (pH 7.4) | Corning | 46-013CM | |
| Chemical compound, drug | glucose oxidase from Aspergillus niger (225 U/mg) | Biophoretics | B01357.02 | |
| Chemical compound, drug | Catalase | Sigma | C40-100MG Bovine Liver | |
| Chemical compound, drug | Trolox | Cayman Chemicals | 10011659 | |
| Chemical compound, drug | Dyomics 647 maleimide dye | Dyomics | 647P1-03 | |
| Chemical compound, drug | Coenzyme A | Sigma | C3019 | |
| Chemical compound, drug | Sulfuric acid | Sigma | 58105-2.5L-PC | |
| Software, algorithm | COOT-0.9.4.1 | CCP4 | https://www2.mrc-lmb.cam.ac.uk/personal/pemsley/coot/ | |
| Software, algorithm | Phenix-1.19.1 | Open source | https://www.phenix-online.org/ | |
| Software, algorithm | PDBePISA (Proteins, Interfaces, Structures and Assemblies) | EMBL-EBI | https://www.ebi.ac.uk/pdbe/pisa/pistart.html | |
| Software, algorithm | ESPript 3.0 | Robert and Gouet, 2014 | https://espript.ibcp.fr | |
| Software, algorithm | HDExaminer | Sierra Analytics | http://massspec.com/hdexaminer | |
| Software, algorithm | GraphPad Prism 7 | GraphPad | https://www.graphpad.com | |
| Software, algorithm | PyMOL | Schroedinger | http://pymol.org | |
| Software, algorithm | Compass Data Analysis | Bruker | https://www.bruker.com | |
| Software, algorithm | ChimeraX | UCSF | https://www.rbvi.ucsf.edu/chimerax/ | |
| Software, algorithm | ImageJ/Fiji | ImageJ | https://imagej.net/software/fiji/ | |
| Software, algorithm | Nikon NIS elements | Nikon | https://www.microscope.healthcare.nikon.com/products/software/nis-elements | |
| Software, algorithm | cryoSPARC v.3.3.2 | Structura Biotechnology | https://cryosparc.com/ | |
| Other | Sf9 insect cells for expression | Expression Systems | 94–001S | Sf9 cell line used for protein expression (Methods) |
| Other | Insect cell media | Expression Systems | 96-001-01 | Sf9 cell media (Methods) |
| Other | Hellmanex III cleaning solution | Fisher | 14-385-864 | Cleaning solution for TIRF experiments (PMID:36842083) |
| Other | Six-well sticky-side chamber | IBIDI | 80608 | Side chamber used for TIRF experiments (Methods) |
| Other | C-Flat 2/2T grids | Electron Microscopy Sciences | CFT-223C | Grids used for EM studies (Methods) |
| Other | PDB coordinate file for p110γ-NB7 structure | PDB | 8DP0 | PDB to use for p110-NB7 structure |
| Other | EM density file for p110γ-NB7 complex | EMD | EMD-27627 | EM density file to use for p110-NB7 |
| Other | HDX-MS and phosphorylation proteomics data | PRIDE | PXD040765 | Database and number where HDX data was uploaded |
Additional files
-
Supplementary file 1
Cryo electron microscopy (cryo-EM) data collection, refinement, and validation statistics.
- https://cdn.elifesciences.org/articles/88058/elife-88058-supp1-v2.docx
-
Supplementary file 2
HDX-MS data collection and validation statistics.
- https://cdn.elifesciences.org/articles/88058/elife-88058-supp2-v2.docx
-
MDAR checklist
- https://cdn.elifesciences.org/articles/88058/elife-88058-mdarchecklist1-v2.pdf
-
Source data 1
Raw source data for figures.
- https://cdn.elifesciences.org/articles/88058/elife-88058-data1-v2.xlsx
Download links
A two-part list of links to download the article, or parts of the article, in various formats.
Downloads (link to download the article as PDF)
Open citations (links to open the citations from this article in various online reference manager services)
Cite this article (links to download the citations from this article in formats compatible with various reference manager tools)
Allosteric activation or inhibition of PI3Kγ mediated through conformational changes in the p110γ helical domain
eLife 12:RP88058.
https://doi.org/10.7554/eLife.88058.3


