Identification of 1600 replication origins in S. cerevisiae
- Clinical Research Division, Fred Hutch Cancer Center, United States
Figures
Figure 1 with 1 supplement
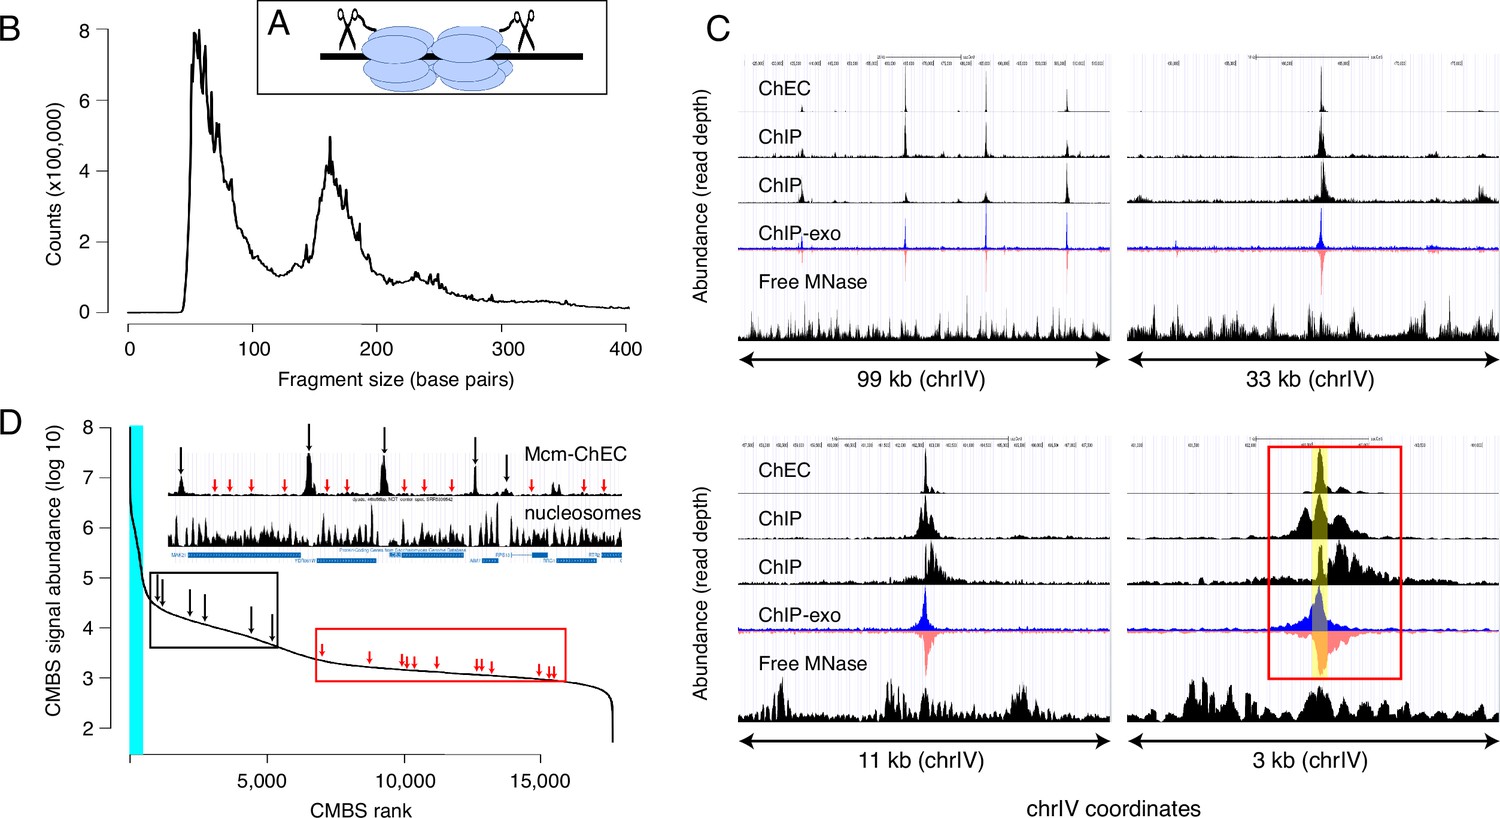
Mcm binding sites, identified by MCM-chromatin endogenous cleavage (ChEC), are consistent with those identified by Mcm-ChIP, and their occupancy varies over three orders of magnitude.
(A) MCM-ChEC strategy relies on Mcm-micrococcal nuclease (MNAse) fusion proteins that, when activated with exogenously added calcium, generate short DNA fragments corresponding to Mcm binding sites. These short fragments, which are conducive to PCR amplification, are identified through deep sequencing. (B) Library fragment size in MCM-ChEC library exhibits major and minor peaks at approximately 60 and 180 base pairs, corresponding to Mcm double helicases and nucleosomes, respectively. (C) Mcm binding sites identified by MCM-ChEC are consistent with results from Mcm-ChIP, but higher in resolution. Four panels show the same region of chrIV at various levels of magnification, from coordinates 417,855–516,737 (upper left) to coordinates 460,851–464,146 (lower right). The prominent peak in the middle corresponds to ARS416/ARS1. Yellow shading in lower right panel depicts within ARS1 (red rectangle) correspond to Mcm complex. From top to bottom, rows in each panel show MCM-ChEC (this study), Mcm- ChIP (Belsky et al., 2015), Mcm-ChIP (Dukaj and Rhind, 2021), Mcm-ChIP-exo (Rossi et al., 2021), and free MNase (Foss et al., 2019). (D) Signal intensities at candidate MCM binding sites (CMBSs) vary over approximately three orders of magnitude. The vertical portion of the plot at the far left represents ARS1200-1/ARS1200-2 in the repetitive rDNA. Blue vertical lines indicate the 142 peaks of MCM-ChEC signal that are within 100 base pairs of 1 of the 187 ARS consensus sequences (ACSs) reported in SGD. Inset shows an 11 kb region from chrIV, with MCM-ChEC signal in top row, nucleosome dyads in middle row, and gene locations in bottom row. Vertical black and red arrows point to CMBSs corresponding to intergenic Mcm helicases and low level background signal from nucleosomes, respectively, with the ranks of these sites depicted by corresponding arrows on the main curve.
-
Figure 1—source data 1
Data used to generate Figure 1B.
- https://cdn.elifesciences.org/articles/88087/elife-88087-fig1-data1-v1.txt
-
Figure 1—source data 2
Data used to generate Figure 1C.
- https://cdn.elifesciences.org/articles/88087/elife-88087-fig1-data2-v1.txt
-
Figure 1—source data 3
Data used to generate Figure 1D.
- https://cdn.elifesciences.org/articles/88087/elife-88087-fig1-data3-v1.txt
Figure 1—figure supplement 1
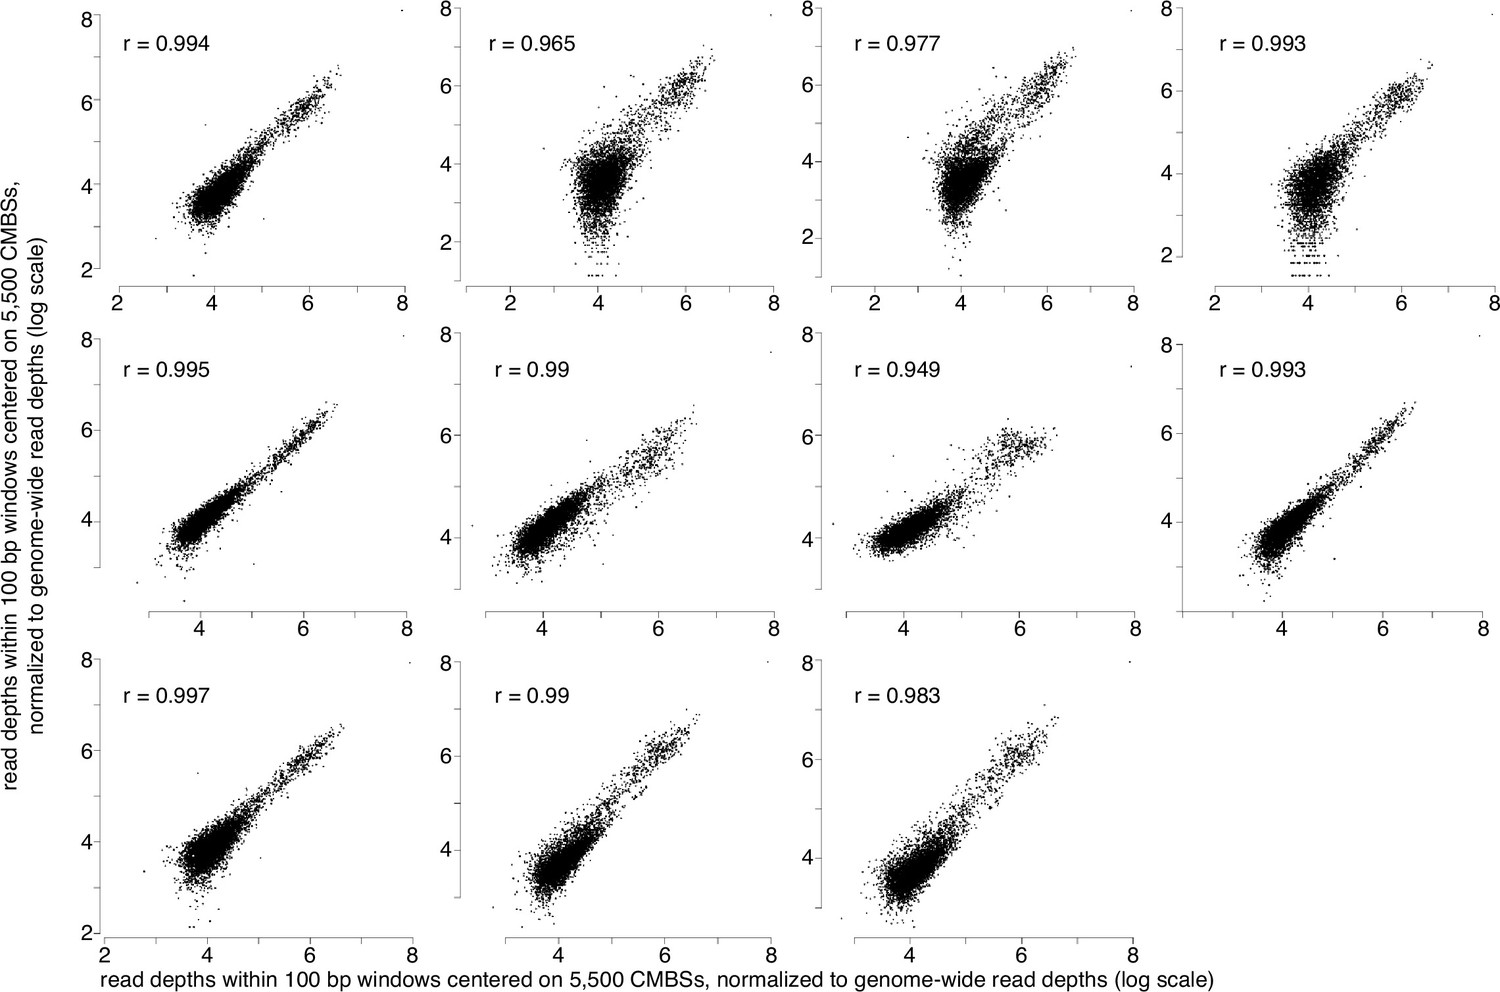
MCM-chromatin endogenous cleavage (ChEC) measurements are reproducible.
14 MCM-ChEC experiments show high reproducibility, with mean and median values of r2 of 0.95 and 0.98, respectively. All plots show the same sample plotted on the x axes with each of the 13 remaining samples plotted on the y axes. 100 base pair windows centered on each of the most abundant 5500 peaks of MCM-ChEC signal were quantified as the sum of per-base pair read depths, with all samples normalized to the same number of total counts for the entire genome. r2 values are noted on each plot.
-
Figure 1—figure supplement 1—source data 1
Data used to generate Figure 1—figure supplement 1.
- https://cdn.elifesciences.org/articles/88087/elife-88087-fig1-figsupp1-data1-v1.txt
Figure 2 with 1 supplement
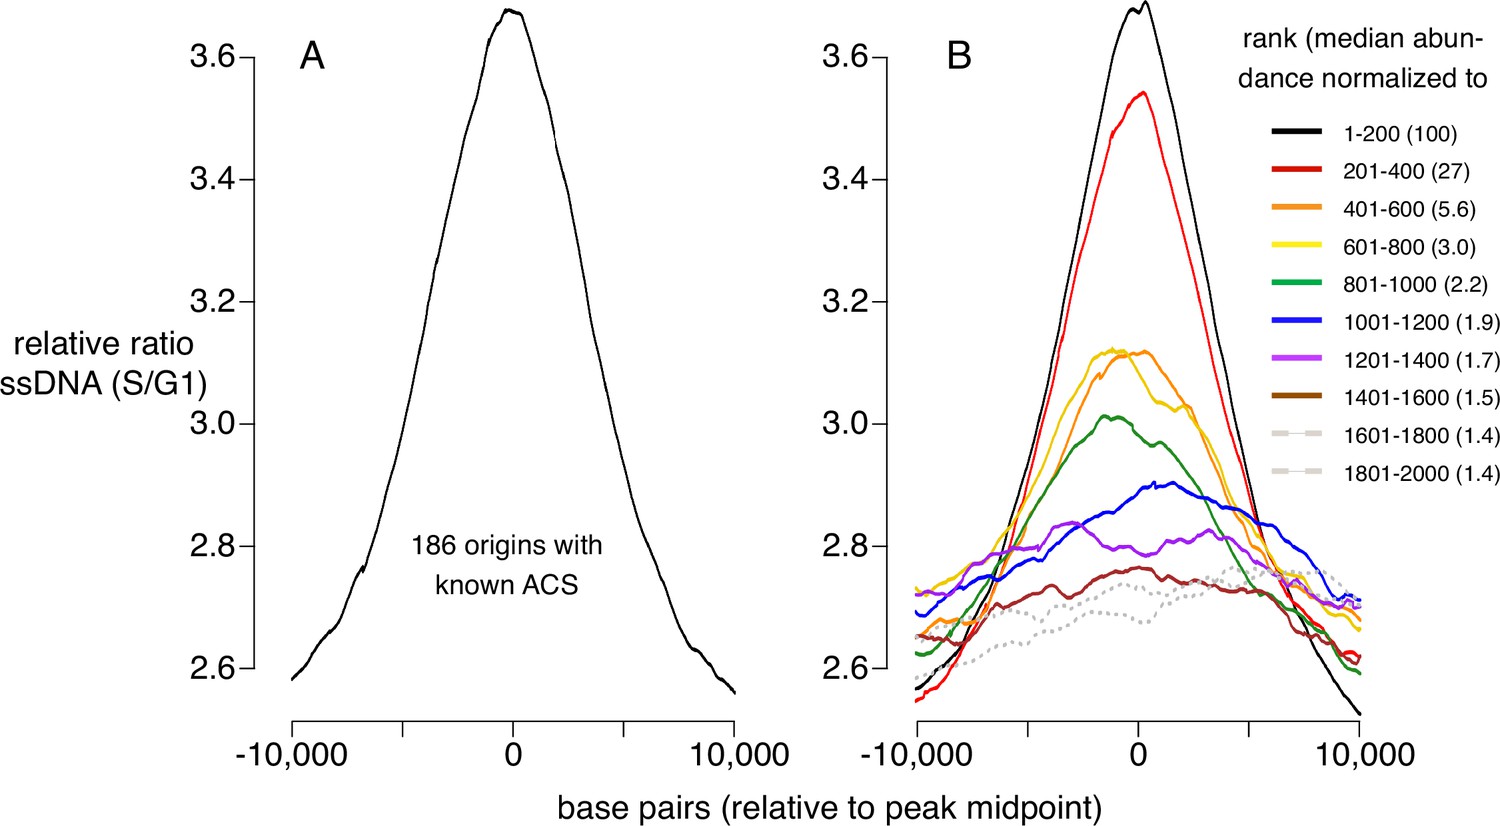
Replication activity at known origins and Mcm binding sites.
Replication activity was assessed by generation of single-stranded DNA (ssDNA) in rad53 mutants released from G1 arrest into medium containing hydroxyurea (HU). Plots show relative ratio of ssDNA in S/G1, as described (Feng et al., 2006). (A) Average replication profile centered on 181 ARS consensus sequences (ACSs) (all ACSs at least 10 kb from chromosome end listed in SGD for which data were available in Feng et al., 2006). (B) Average replication profiles of groups of 200 of the 2000 most prominent peaks of MCM-chromatin endogenous cleavage (ChEC) signal, centered on peak midpoints. Numbers in parentheses indicate median abundance of Mcm-ChEC signal, normalized such that the median signal in the highest group is 100.
-
Figure 2—source data 1
Data used to generate Figure 2B.
- https://cdn.elifesciences.org/articles/88087/elife-88087-fig2-data1-v1.txt
Figure 2—figure supplement 1
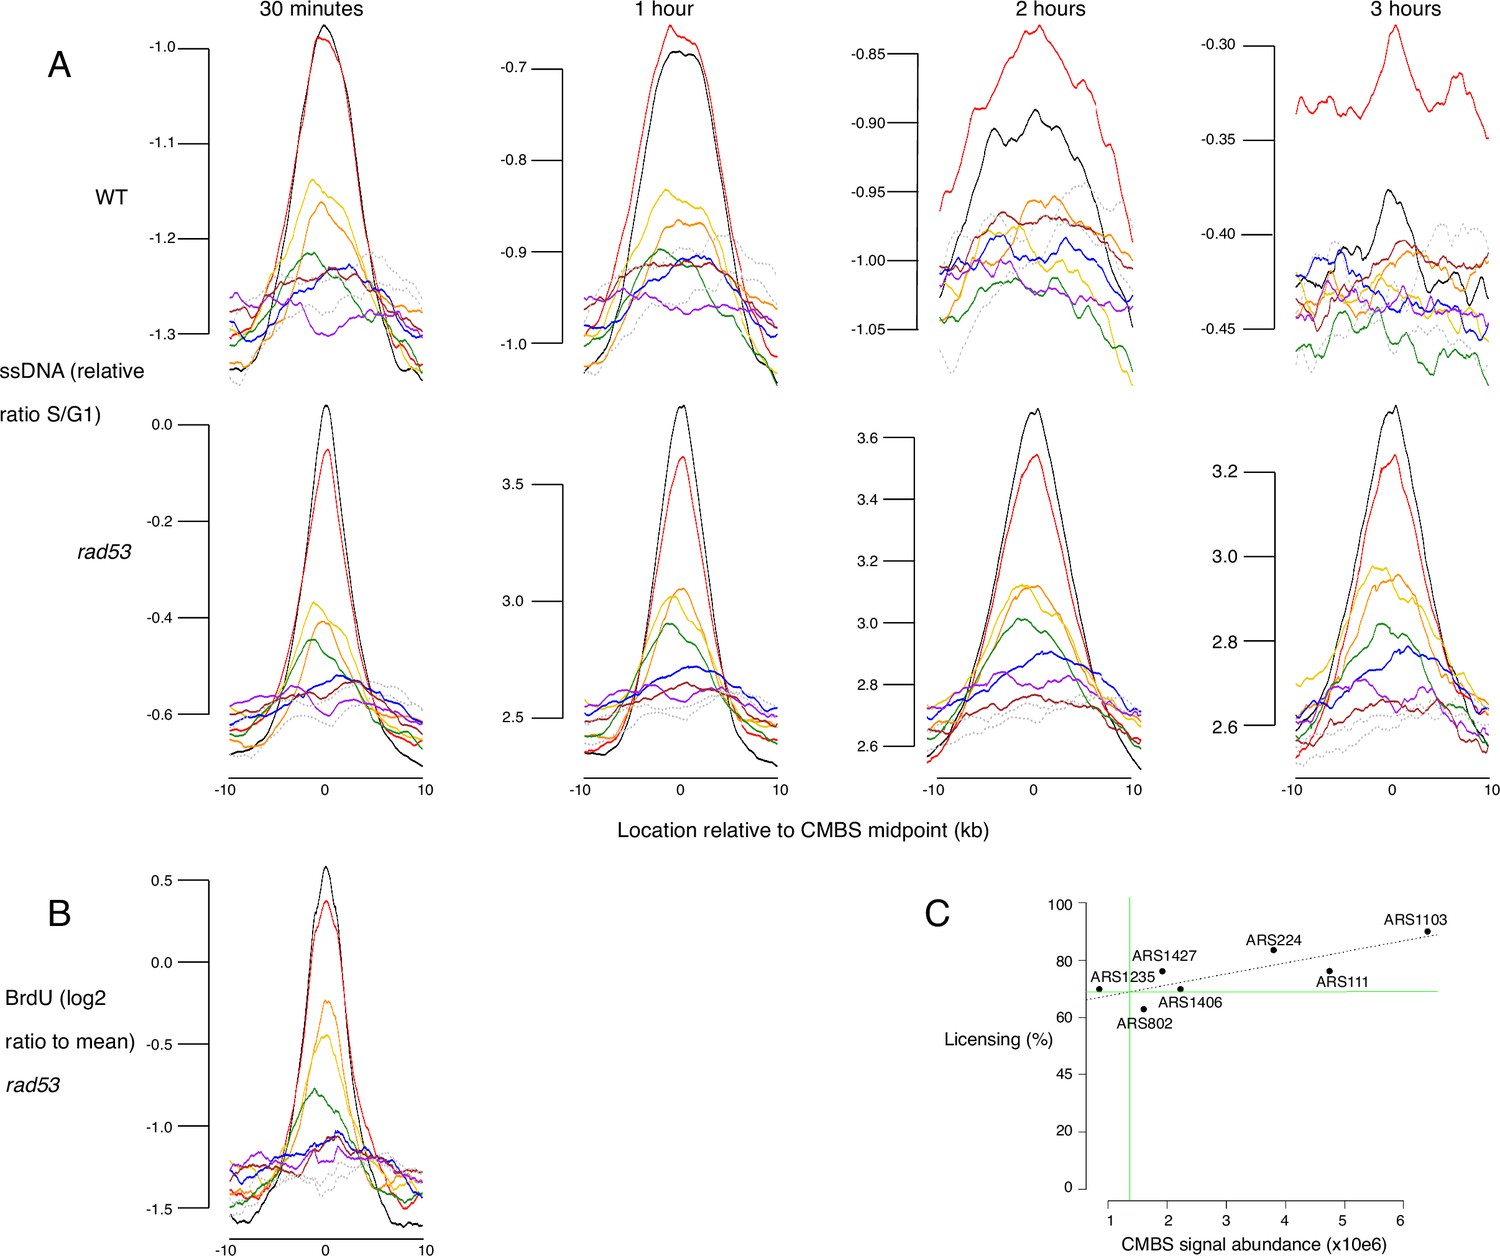
Replication activity and licensing at Mcm binding sites, assessed by single-stranded DNA (ssDNA) generation, BrdU incorporation, and qPCR.
(A) Average replication profiles, as determined by generation of ssDNA, for groups of 200 from the 1600 most prominent peaks of MCM-chromatin endogenous cleavage (ChEC) signal, centered on peak midpoints. Wild type (WT) (top row) and rad53 (bottom row) cultures were arrested in G1 and released into medium containing hydroxyurea (HU). Samples were collected at 30 min, 1 hr, 2 hr, and 3 hr and ssDNA was quantified, as described (Feng et al., 2006). (B) Average replication profiles, as determined by incorporation of BrdU, for groups of 200 from the 1600 most prominent peaks of MCM-ChEC signal, centered on peak midpoints. rad53 cells were arrested in G1 and released into medium containing HU and BrdU. BrdU was quantified on Affymetrix chips. y axis shows average of log 2 of measurement/mean. (C) qPCR across origins using Mcm-ChEC-cut templates can be used to assess licensing, because increased cutting by Mcm-micrococcal nuclease (MNase) is reflected in the requirement for increased qPCR cycles to generate a diagnostic product (Foss et al., 2021). Linear regression using qPCR at seven origins allowed us to determine that the candidate MCM binding site (CMBS) with rank 100 is licensed at 69% (green lines), and thereby to infer that the CMBSs in the eighth cohort, whose median CMBS abundance is 1.5% of that of the first cohort, is licensed at approximately 1% (69% × 0.015=1.0%). Autonomously replicating sequences (ARSs) analyzed correspond to the following CMBS ranks, and were licensed at the indicated percentages: ARS111: rank 5, 76%; ARS1235: rank 75, 63%; ARS802: rank 183, 70%; ARS1427: rank 51, 76%; ARS1406: rank 42, 70%; ARS224: rank 9, 84%; ARS1103: rank 3, 90.0%.
-
Figure 2—figure supplement 1—source data 1
Data used to generate Figure 2—figure supplement 1.
- https://cdn.elifesciences.org/articles/88087/elife-88087-fig2-figsupp1-data1-v1.zip
Figure 3 with 1 supplement
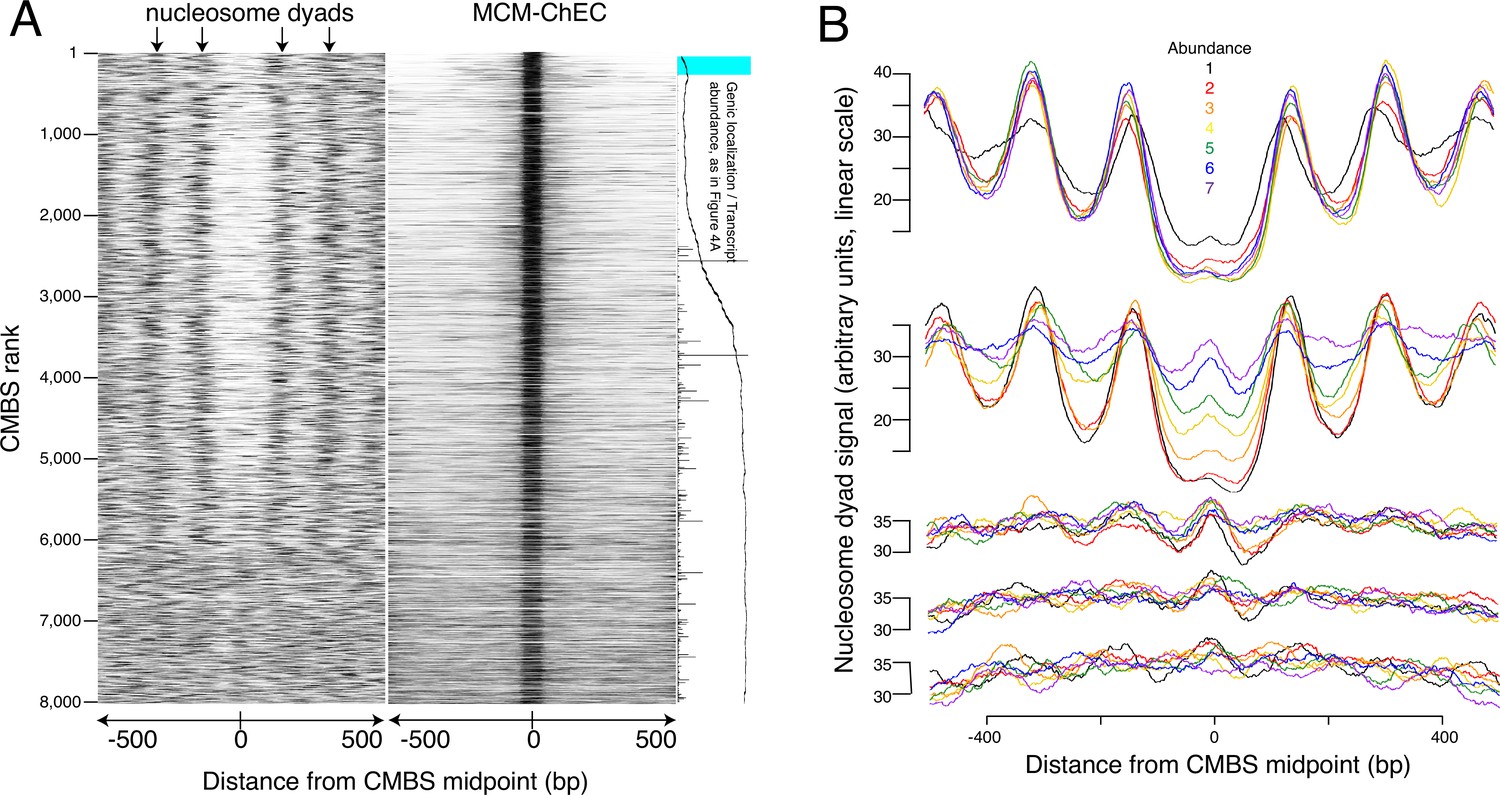
Most abundant 5500 peaks of MCM-chromatin endogenous cleavage (ChEC) signal are located predominantly in nucleosome-free regions.
(A) Left heat map shows 46–56 base pair fragments marking nucleosome dyads that were generated by ex vivo nuclease activity of H3Q85C coupled to phenanthroline (Chereji et al., 2018). Right heat map shows 51–100 base pair library fragments from MCM-ChEC. Both heat maps are centered on midpoints of the top 8000 MCM-ChEC peaks, ranked by abundance. Each row corresponds to a single peak, with the most abundant peak at the top. A portion of Figure 4A is shown rotated by 90° (right) to indicate average locations of 50 candidate MCM binding sites (CMBSs) relative to gene bodies (main curve), transcription levels of genes in those cases when CMBSs are genic rather than intergenic (horizontal bars), and CMBSs within 100 base pairs of an ARS consensus sequence (ACS) listed in SGD (light blue). (B) Composite signals of nucleosome dyads for groups of 500 CMBSs. The x axis is identical to that in the heat maps in (A). Each row shows 7 groups of 500. Moving from the top row to the bottom row corresponds to moving from high abundance CMBSs to low abundance CMBSs. Within each row, the order from high abundance to low abundance is indicated by color, as noted in the figure. The y axes are linear scales showing the relative abundance of nucleosomal signal, and the scales of these axes are the same for each row.
-
Figure 3—source data 1
Data used to generate Figure 3A and Figure 3—figure supplement 1.
- https://cdn.elifesciences.org/articles/88087/elife-88087-fig3-data1-v1.zip
-
Figure 3—source data 2
Data used to generate Figure 3B.
- https://cdn.elifesciences.org/articles/88087/elife-88087-fig3-data2-v1.txt
Figure 3—figure supplement 1
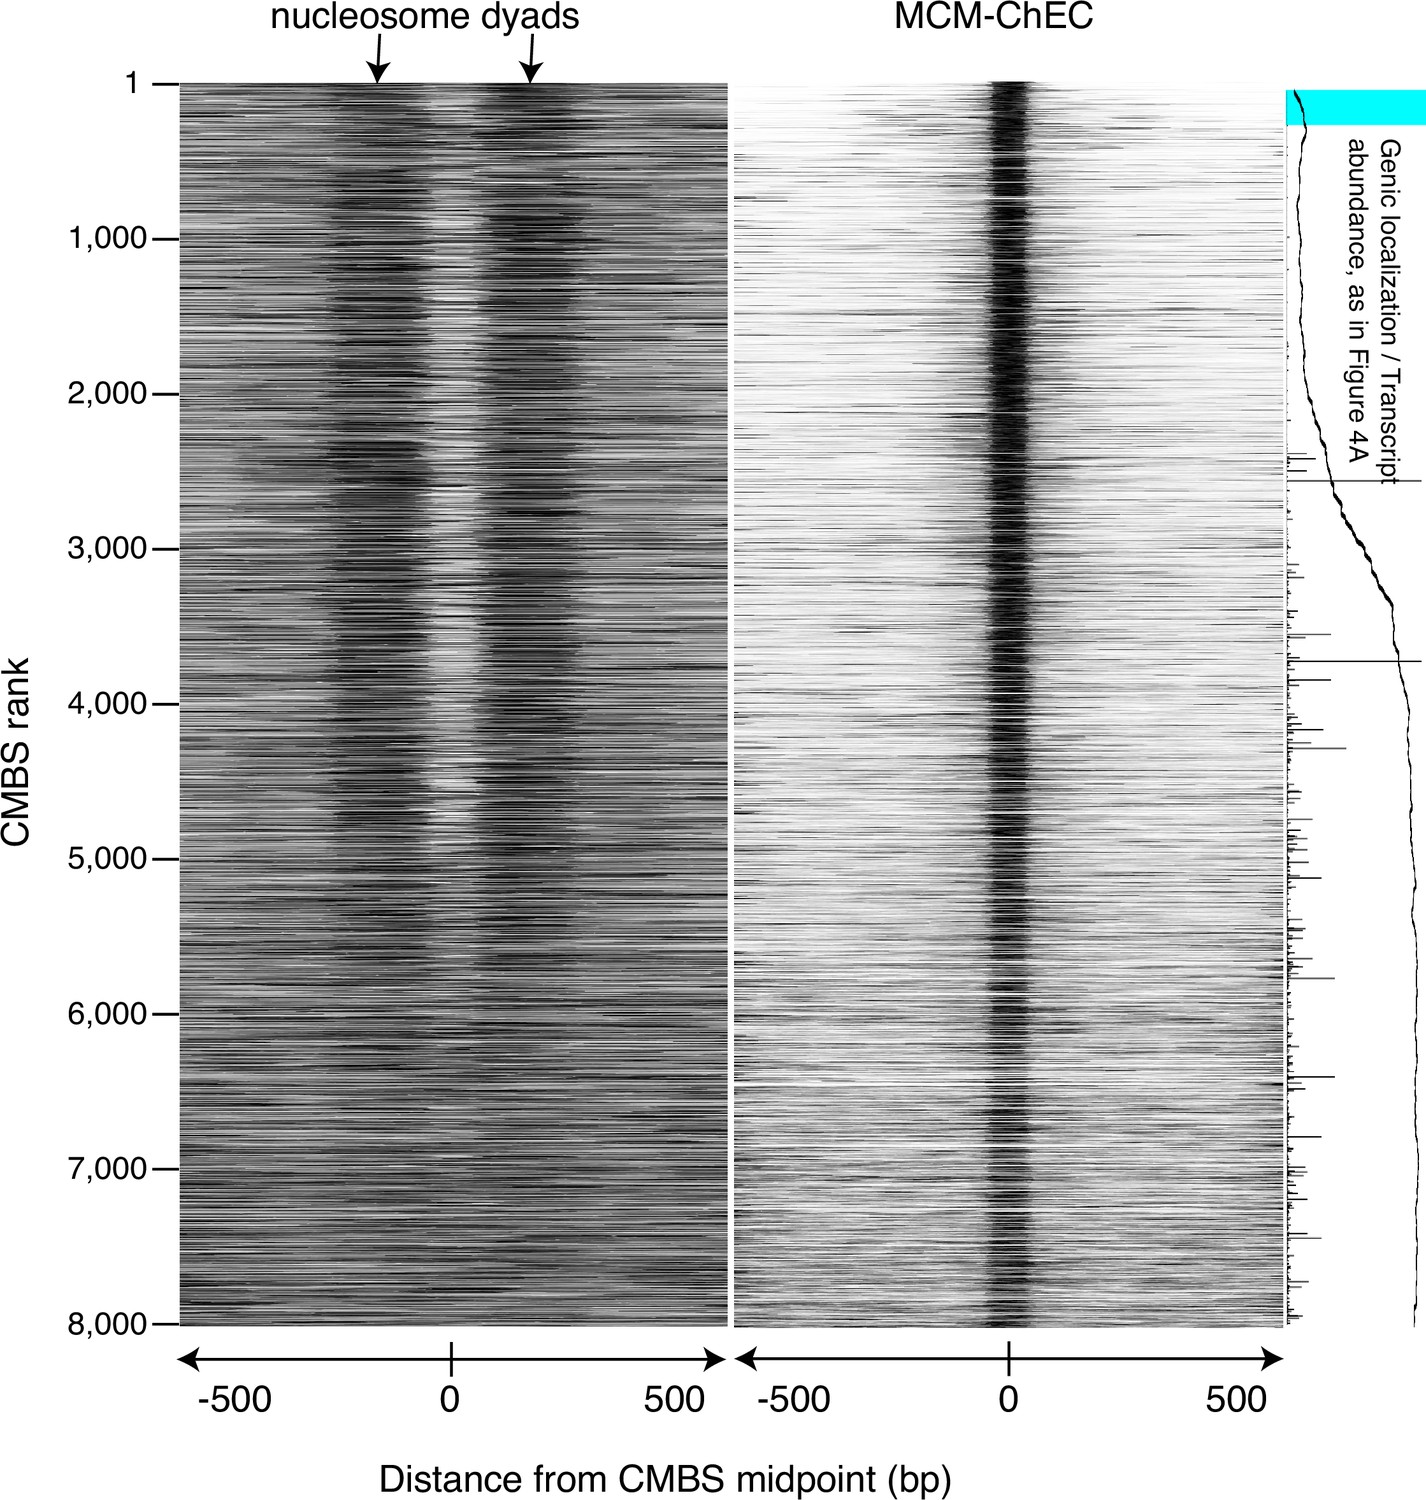
Figure identical to Figure 3, except that nucleosomes were identified by micrococcal nuclease (MNase) treatment of chromatin.
Heat map showing nucleosomes flanking candidate MCM binding sites (CMBSs) is derived from library fragments in the 151–200 base pair range.
Figure 4
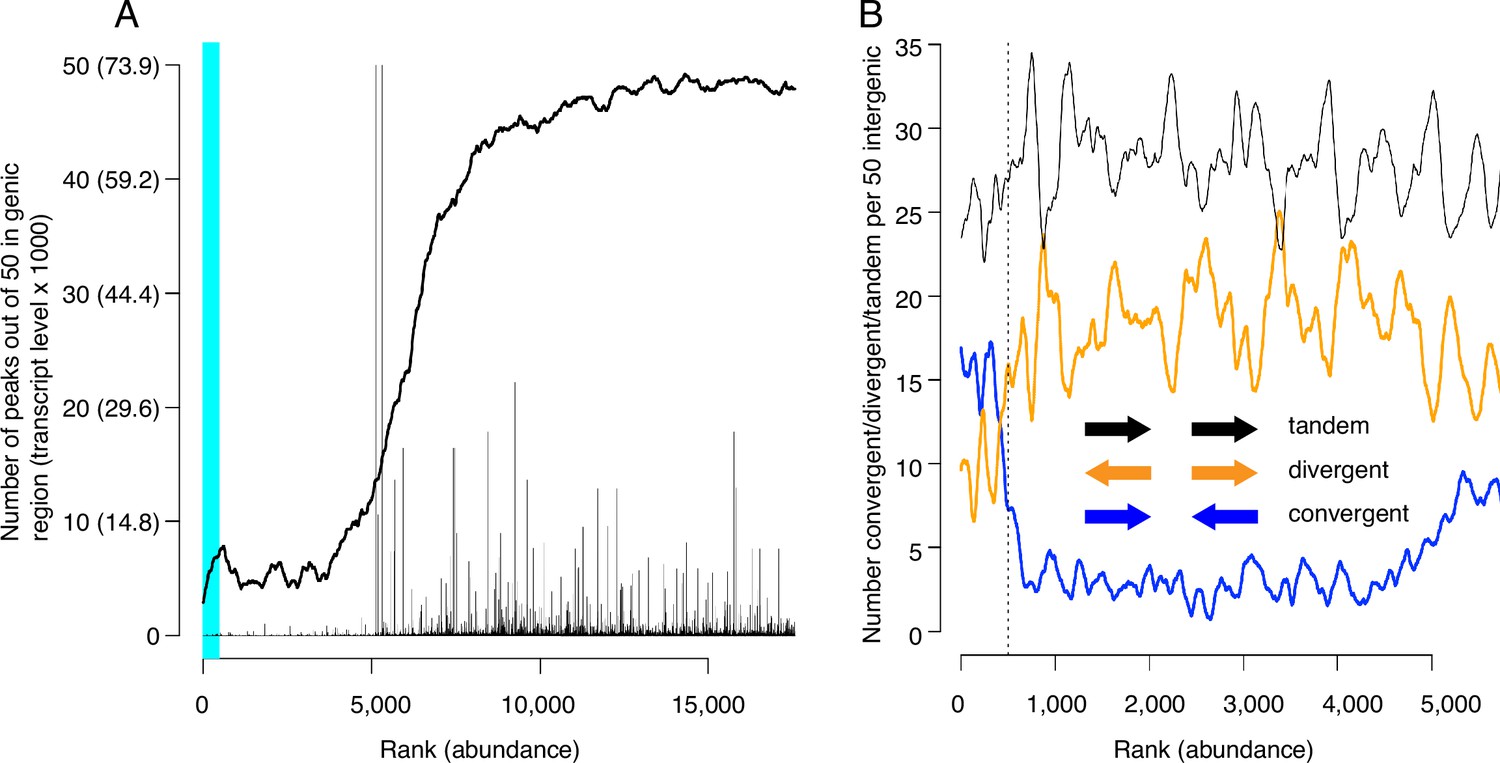
Locations of candidate MCM binding sites (CMBSs) with respect to locations and both levels and directions of transcription of adjacent genes.
(A) Continuous curve shows number of CMBSs, from a sliding window of 50, that are located within gene bodies. Vertical lines show levels of transcription of genes in those instances in which the corresponding CMBS is genic. Light blue area indicates CMBSs within 100 base pairs of ARS consensus sequence (ACS) listed in SGD. X axis is arranged by CMBS abundance rank, from high abundance (left) to low abundance (right). (B) Orientation of transcription of flanking genes in those instances when CMBSs are intergenic. Plots show number of convergently (blue), divergently (orange), and tandemly (black) transcribed genes enumerating only those CMBSs, within a sliding window of 50, that are intergenic. X axis is limited to CMBSs with ranks ≤ 5500, because higher ranks are mostly genic, and therefore cannot be classified according to relative transcription directions of flanking genes.
-
Figure 4—source data 1
Data used to generate Figure 4A.
- https://cdn.elifesciences.org/articles/88087/elife-88087-fig4-data1-v1.txt
-
Figure 4—source data 2
Data used to generate Figure 4B.
- https://cdn.elifesciences.org/articles/88087/elife-88087-fig4-data2-v1.txt
Figure 5
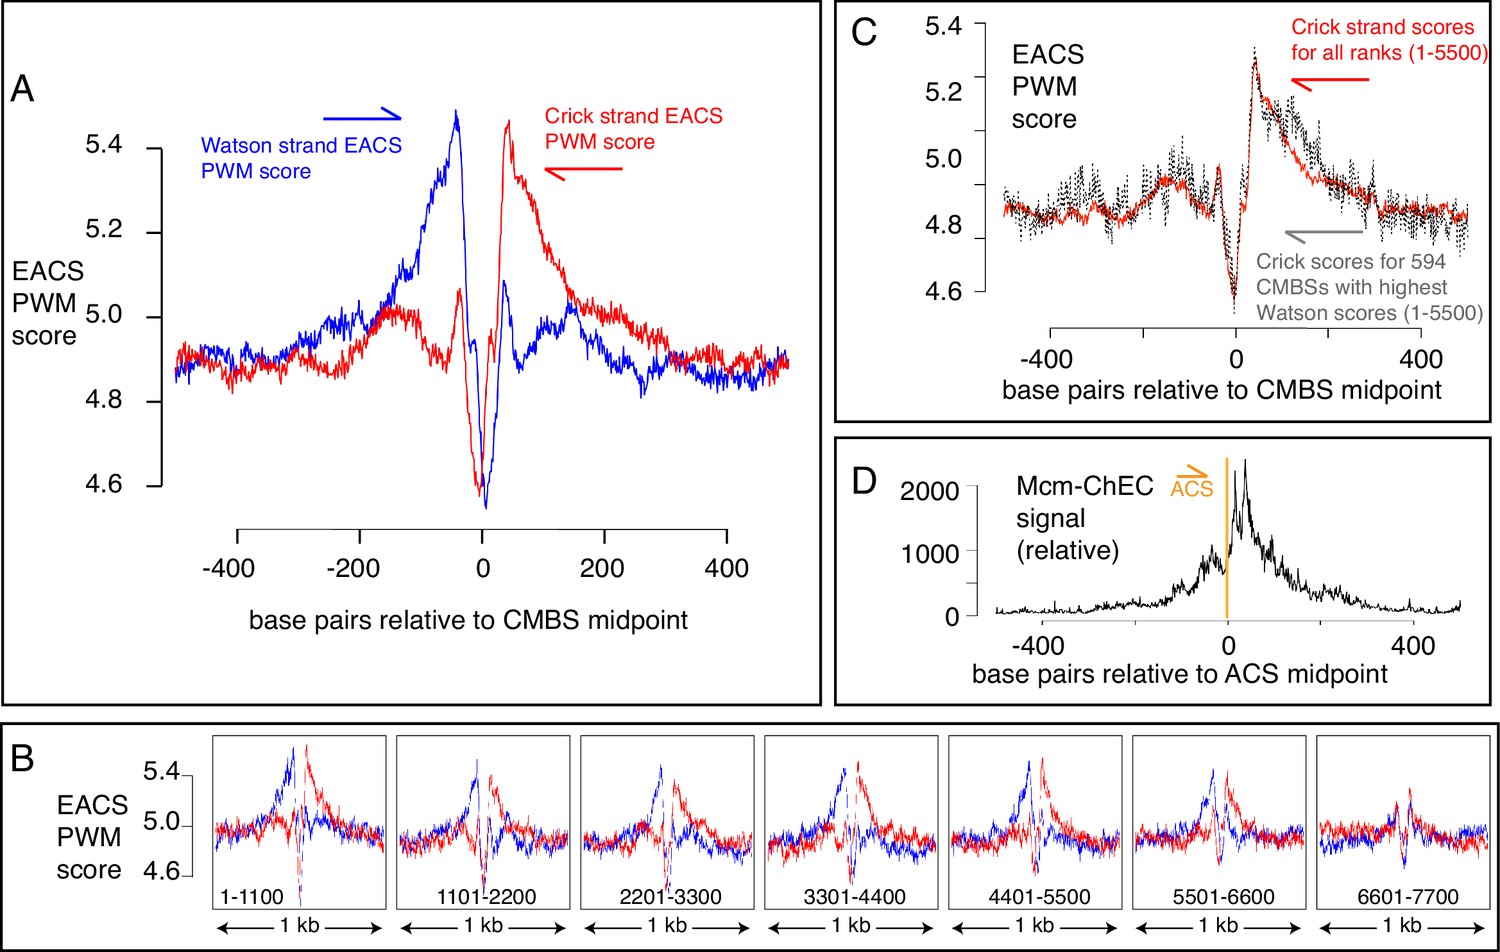
EACS PWM scores indicate that peaks of MCM signal are flanked by ARS consensus sequences (ACSs), and that Mcm helicases are loaded downstream of the ACS (maximum possible score is 12.742).
(A) Composite scores for Watson (red) and Crick (blue) strands for candidate MCM binding sites (CMBSs) with ranks ≤ 5500. (B) Composite scores for Watson (red) and Crick (blue) strands for CMBSs with ranks ≤ 7700, shown in groups of 1100. (C) Average EACS-PWM scores on Crick strand for peaks with the top 10% of EACS-PWM scores on the Watson strand are as high as average scores on the Crick strand for all 5500 peaks of MCM-chromatin endogenous cleavage (ChEC) signal. 10% of peaks with highest EACS-PWM scores on Wason strand are shown in black and total peaks are shown in red. This result supports a model in which peaks of Mcm signal are flanked on both sides by ACS signals, because, even if peaks have a very high EACS-PWM on the left side, they still maintain a significant score on the right side. (D) Cumulative MCM-ChEC signal for 187 ACSs indicate that Mcm helicases are loaded downstream of the ACS. 1 kb windows of MCM-ChEC signals centered on each of the 187 ACSs listed in SGD were oriented according to the ACS, normalized to 100, and then added to create a cumulative sum vector showing the location of MCM-ChEC signal relative to the ACS. MCM-ChEC signal was quantified according to the midpoints of library fragments with inserts from 51 to 100 base pairs.
-
Figure 5—source data 1
Data used to generate Figure 5A, D .
- https://cdn.elifesciences.org/articles/88087/elife-88087-fig5-data1-v1.txt
-
Figure 5—source data 2
Data used to generate Figure 5B.
- https://cdn.elifesciences.org/articles/88087/elife-88087-fig5-data2-v1.txt
-
Figure 5—source data 3
Data used to generate Figure 5C.
- https://cdn.elifesciences.org/articles/88087/elife-88087-fig5-data3-v1.txt
Figure 6 with 1 supplement
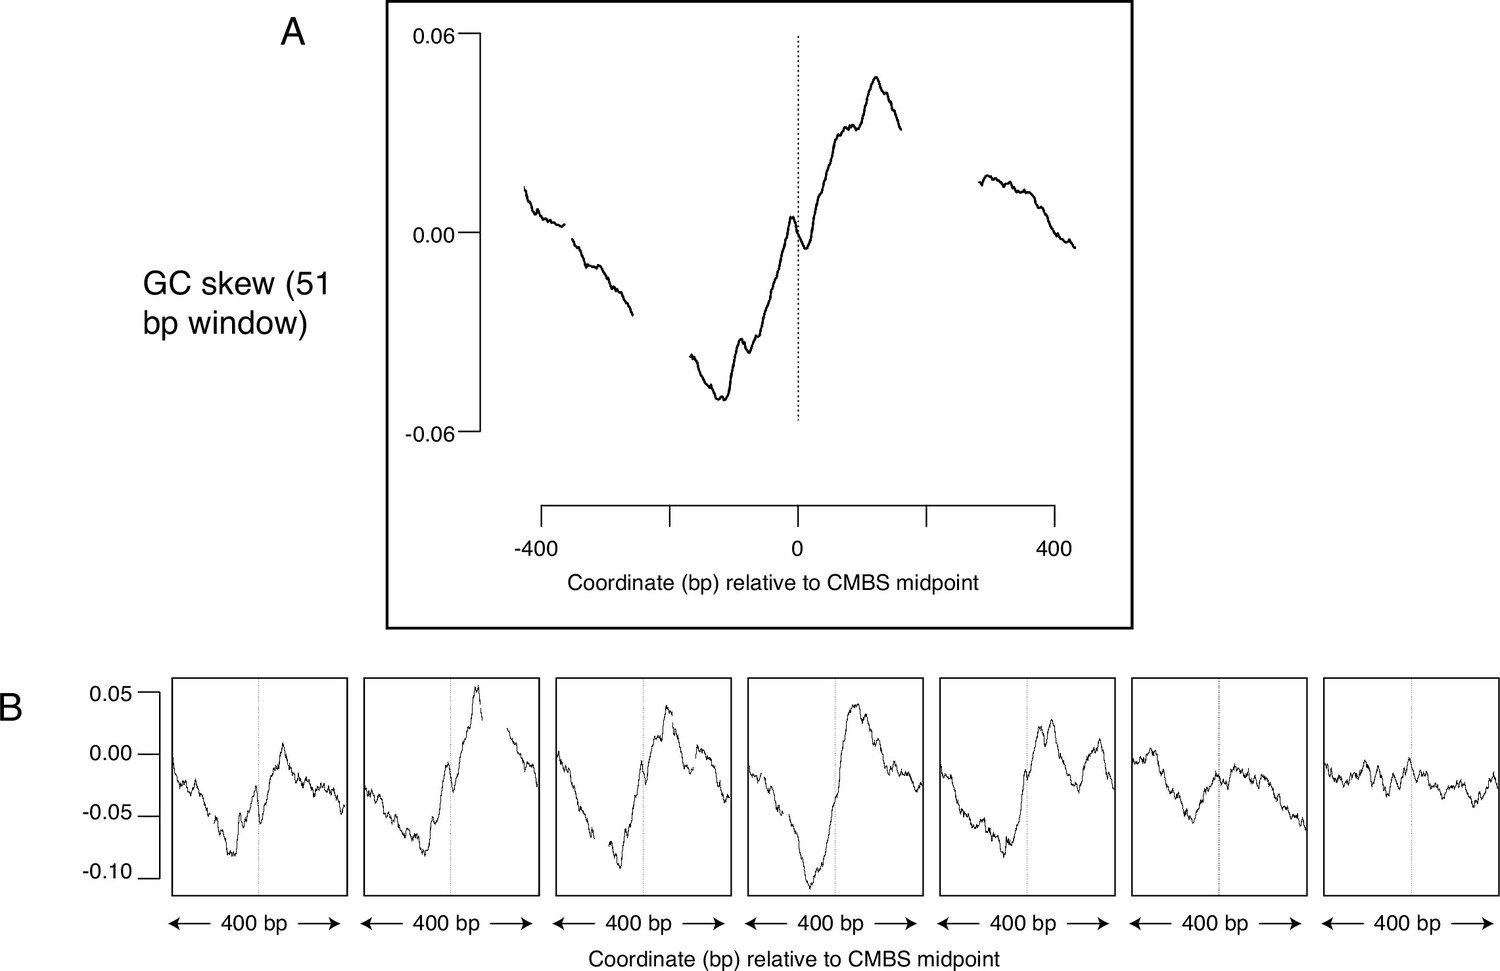
Average GC skew increases across the midpoints of the most abundant 5500 peaks of MCM-chromatin endogenous cleavage (ChEC) signal.
GC skew was calculated according to the numbers of Gs and Cs in the Watson strand along a 51 base pair moving window, as (G–C)/(G+C); the skew value plotted corresponds to the score at the midpoint of that window. (A) Average EACS PWM scores for the most abundant 5500 peaks of MCM-ChEC signal. (B) Averages of GC skew for groups of 1100, arranged from high (left) to low (right) abundance.
-
Figure 6—source data 1
Data used to generate Figure 6 and Figure 6—figure supplement 1.
- https://cdn.elifesciences.org/articles/88087/elife-88087-fig6-data1-v1.txt
Figure 6—figure supplement 1

Comparison of pattern of GC skew when centered on ARS consensus sequences (ACSs) versus candidate MCM binding sites (CMBSs).
(A) GC skew for 400 base pair sequences centered on 187 ACSs, oriented according to directionality specified in SGD. (B) GC skew for 400 base pair sequences centered on 5500 most abundant CMBSs. GC skew is measured as in Figure 6.
Tables
Table 1
Estimates of total number of origins by different criteria (estimates from all but first two rows rely on candidate MCM binding sites [CMBSs] from this report).
| Criterion | Estimate of number of origins |
|---|---|
| SGD classification | 354 (343 of which map unambiguously) |
| OriDB classification | 829 (410 confirmed, 216 likely, 203 dubious) |
| Generation of ssDNA in HU | 1600 |
| BrdU incorporation | 1400 |
| Nucleosome-free regions | 5000 |
| Transition from mostly intergenic to mostly genic | 6000 |
| Transition from low transcription genic to high transcription genic | 5000 |
| ACS motif | 6000 |
| GC skew | 6000 |
Key resources table
| Reagent type (species) or resource | Designation | Source or reference | Identifiers | Additional information |
|---|---|---|---|---|
| Strain, strain background (Saccharomyces cerevisiae, S288c) | 16535 | Antonio Bedalov, Fred Hutch Cancer Center | 16535 | Mat A, his3, leu2, met15, ura3, hmla:: HYG |
| Strain, strain background (Saccharomyces cerevisiae, S288c) | 16747 | Antonio Bedalov, Fred Hutch Cancer Center | 16747 | Mat A, his3, leu2, met15, ura3, hmla:: HYG, with MCM2 MNase 3xFlag Tag with KanMx |
| Strain, strain background (Saccharomyces cerevisiae, S288c) | 16753 | Antonio Bedalov, Fred Hutch Cancer Center | 16753 | Mat A, his3, leu2, met15, ura3, hmla:: HYG, with MCM6 MNase 3xFlag Tag with KanMx |
| Strain, strain background (Saccharomyces cerevisiae, S288c) | 16754 | Antonio Bedalov, Fred Hutch Cancer Center | 16754 | Mat A, his3, leu2, met15, ura3, hmla:: HYG, with MCM6 MNase 3xFlag Tag with KanMx |
| Strain, strain background (Saccharomyces cerevisiae, S288c) | 16749 | Antonio Bedalov, Fred Hutch Cancer Center | 16749 | Mat A, his3, leu2, met15, ura3, hmla:: HYG, with MCM4 MNase 3xFlag Tag with KanMx |
| Strain, strain background (Saccharomyces cerevisiae, S288c) | 16964 | Antonio Bedalov, Fred Hutch Cancer Center | 16964 | Mat A, his3, leu2, ura3, met15, hmla::NAT, MCM2 3x Flag Mnase tag with KanMX |
Additional files
-
MDAR checklist
- https://cdn.elifesciences.org/articles/88087/elife-88087-mdarchecklist1-v1.docx
-
Source code 1
Perl script to run as first step in quantifying paired-end reads such that one infers the entire library insert.
- https://cdn.elifesciences.org/articles/88087/elife-88087-code1-v1.zip
-
Source code 2
Perl script to run as second step in quantifying paired-end reads such that one infers the entire library insert.
This will provide quantitation along the entire library insert.
- https://cdn.elifesciences.org/articles/88087/elife-88087-code2-v1.zip
-
Source code 3
Perl script to run as second step in quantifying paired-end reads such that one infers the entire library insert.
This will provide quantitation for only the midpoint of each library insert.
- https://cdn.elifesciences.org/articles/88087/elife-88087-code3-v1.zip
Download links
A two-part list of links to download the article, or parts of the article, in various formats.
Downloads (link to download the article as PDF)
Open citations (links to open the citations from this article in various online reference manager services)
Cite this article (links to download the citations from this article in formats compatible with various reference manager tools)
Identification of 1600 replication origins in S. cerevisiae
eLife 12:RP88087.
https://doi.org/10.7554/eLife.88087.4


