Pharmacological inhibition of CLK2 activates YAP by promoting alternative splicing of AMOTL2
- Department of Chemistry, The Scripps Research Institute, United States
- Calibr, A Division of Scripps Research, United States
Figures
Figure 1
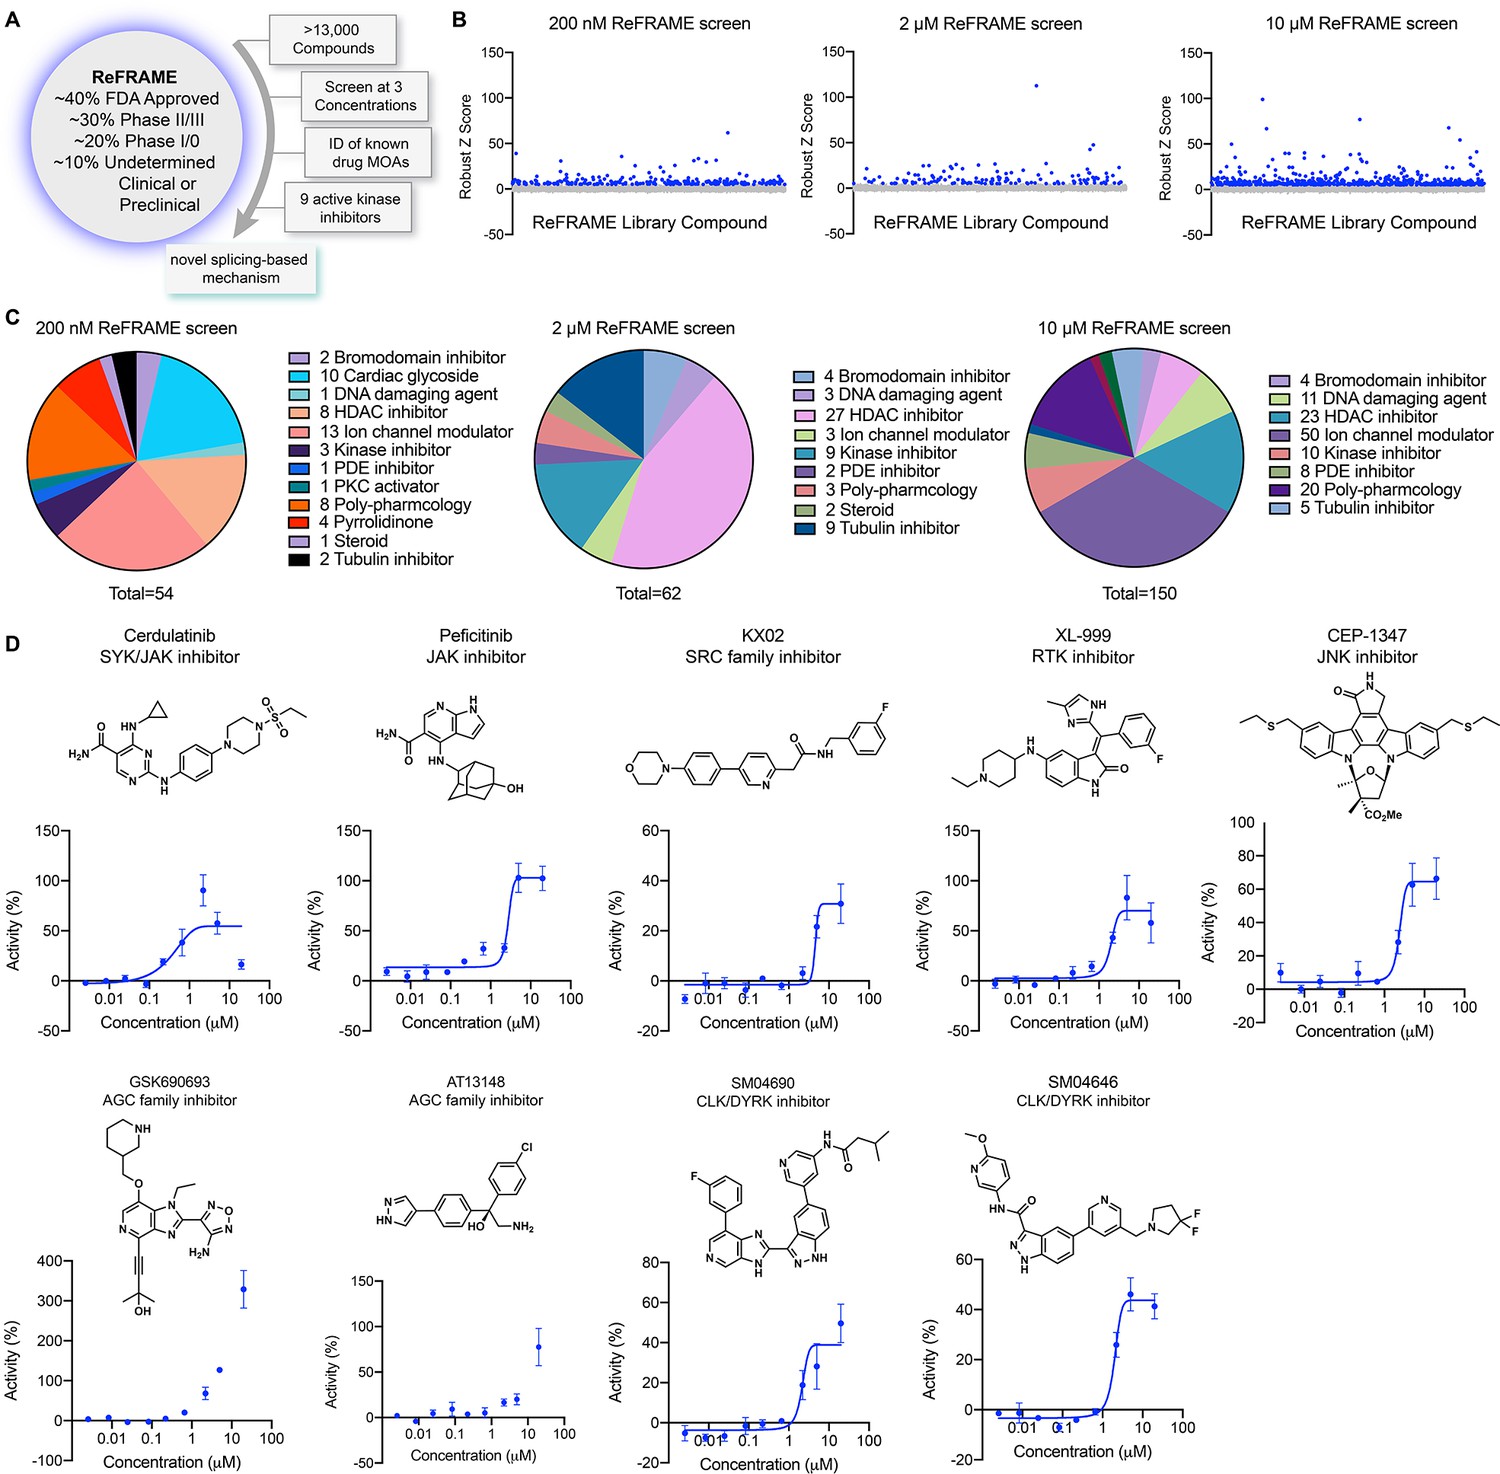
A screen of Repurposing, Focused Rescue, and Accelerated Medchem (ReFRAME) identifies pharmacological mechanisms for activating yes-associated protein (YAP).
(A) Schematic depicting screening workflow, which resulted in the identification of nine kinase inhibitor-based YAP activating small molecules. (B) Scatter plots of TEAD-LUC activity from each of the screens were conducted at the final compound concentrations of 200 nM, 2 µM, and 10 µM. Each data point represents a single compound. Hits were classified as having robust Z scores over five. (C) Pie charts indicate the classes of small molecules characterized as hits on each screen. (D) Structure and dose-response plots of TEAD-LUC activity of the nine identified kinase inhibitors (n=3, mean and s.d.).
-
Figure 1—source data 1
Data for each Repurposing, Focused Rescue, and Accelerated Medchem (ReFRAME) screen in Figure 2B.
- https://cdn.elifesciences.org/articles/88508/elife-88508-fig1-data1-v1.xlsx
-
Figure 1—source data 2
Dose response data for Figure 2D.
- https://cdn.elifesciences.org/articles/88508/elife-88508-fig1-data2-v1.xlsx
Figure 2 with 1 supplement
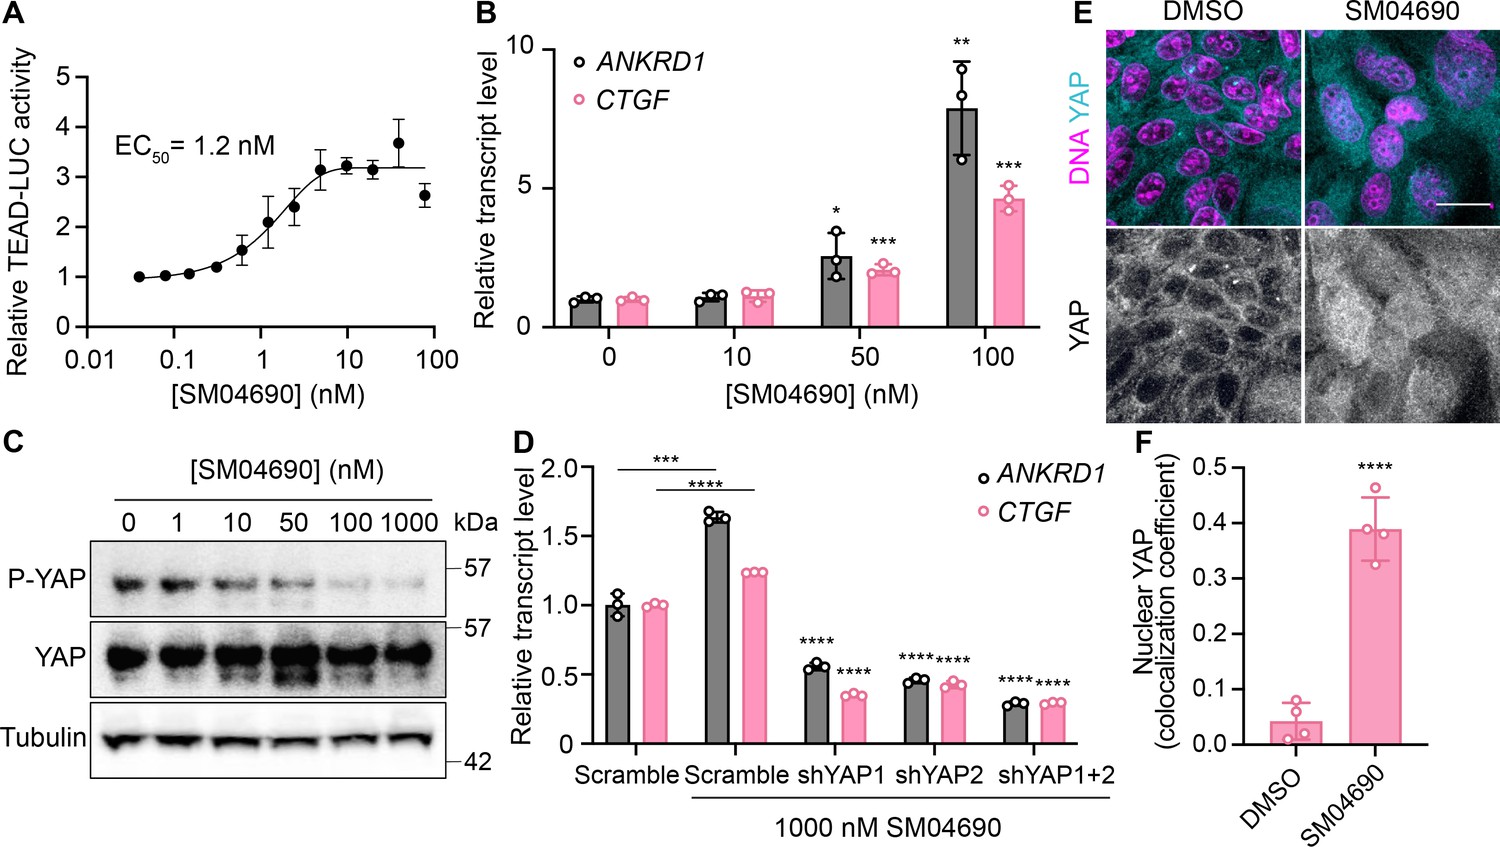
SM04690 is a pharmacological activator of yes-associated protein (YAP).
(A) Relative luminance values after 24 hr treatment of 293A-TEAD-LUC cells with the indicated concentrations of SM04690 (n=3 biological replicates, mean and s.e.m.). (B) Relative transcript levels of YAP-dependent genes (ANKRD1 and CTGF) from HEK293A cells were treated for 24 hr with SM04690, measured by RT-qPCR (n=3, mean and s.d.). (C) Western blot analysis of anti-phospho-YAP and total YAP levels from HEK293A cells treated with the indicated concentrations of SM04690 for 24 hr. (D) Relative transcript levels of ANKRD1 and CTGF from HEK293A cells expressing the indicated YAP targeting shRNAs and then treated with 1 µM SM04690, measured by RT-qPCR (n=3, mean and s.d.). Asterisks above samples treated with shRNAs to YAP and SM04690 refer to statistical significance as compared to scramble treated with SM04690. (E) Representative images of anti-YAP immunofluorescent staining of MDCK cells following treatment with 1 µM SM04690. Anti-YAP antibody in teal and Hoechst 33342 in pink to visualize nuclei (scale bar = 10 µm). (F) Quantification of anti-YAP and Hoechst 33342 (DNA) correlative immunofluorescent staining (n=4, mean and s.d.). (B, D, F) Statistical analyses are univariate two-sided t-tests (*p<0.0332, **p<0.0021, ***p<0.0002, ****p<0.0001).
-
Figure 2—source data 1
Data related to Figure 2A, B and D.
- https://cdn.elifesciences.org/articles/88508/elife-88508-fig2-data1-v1.xlsx
-
Figure 2—source data 2
Uncropped blots for Figure 2C.
- https://cdn.elifesciences.org/articles/88508/elife-88508-fig2-data2-v1.zip
Figure 2—figure supplement 1
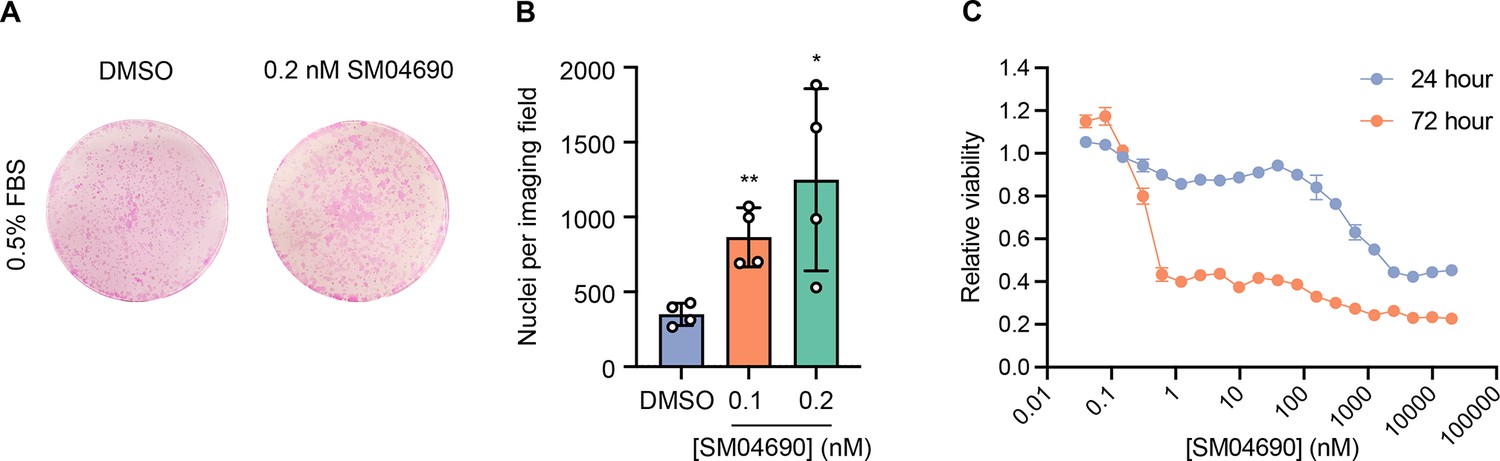
SM04690 induces yes-associated protein (YAP)-dependent proliferation at non-toxic concentrations.
(A) Representative Rhodamine B staining, and (B) number of cells of human keratinocytes (HaCaT) in 0.5% FBS treated with SM04690 for 7 days (n=4, mean and s.d.). Statistical test is a univariate two-sided t-test (*p<0.0332, **p<0.0021). (C) Cell viability dose-response of SM04690 in 293A-TEAD-LUC cells treated for 24 or 72 hr with SM04690 evaluated using CellTiter-Glo luminescent cell viability assay (n=3 biological replicates, mean and s.d.).
-
Figure 2—figure supplement 1—source data 1
Relative luminance values for Figure 2—figure supplement 1C.
- https://cdn.elifesciences.org/articles/88508/elife-88508-fig2-figsupp1-data1-v1.xlsx
Figure 3 with 3 supplements
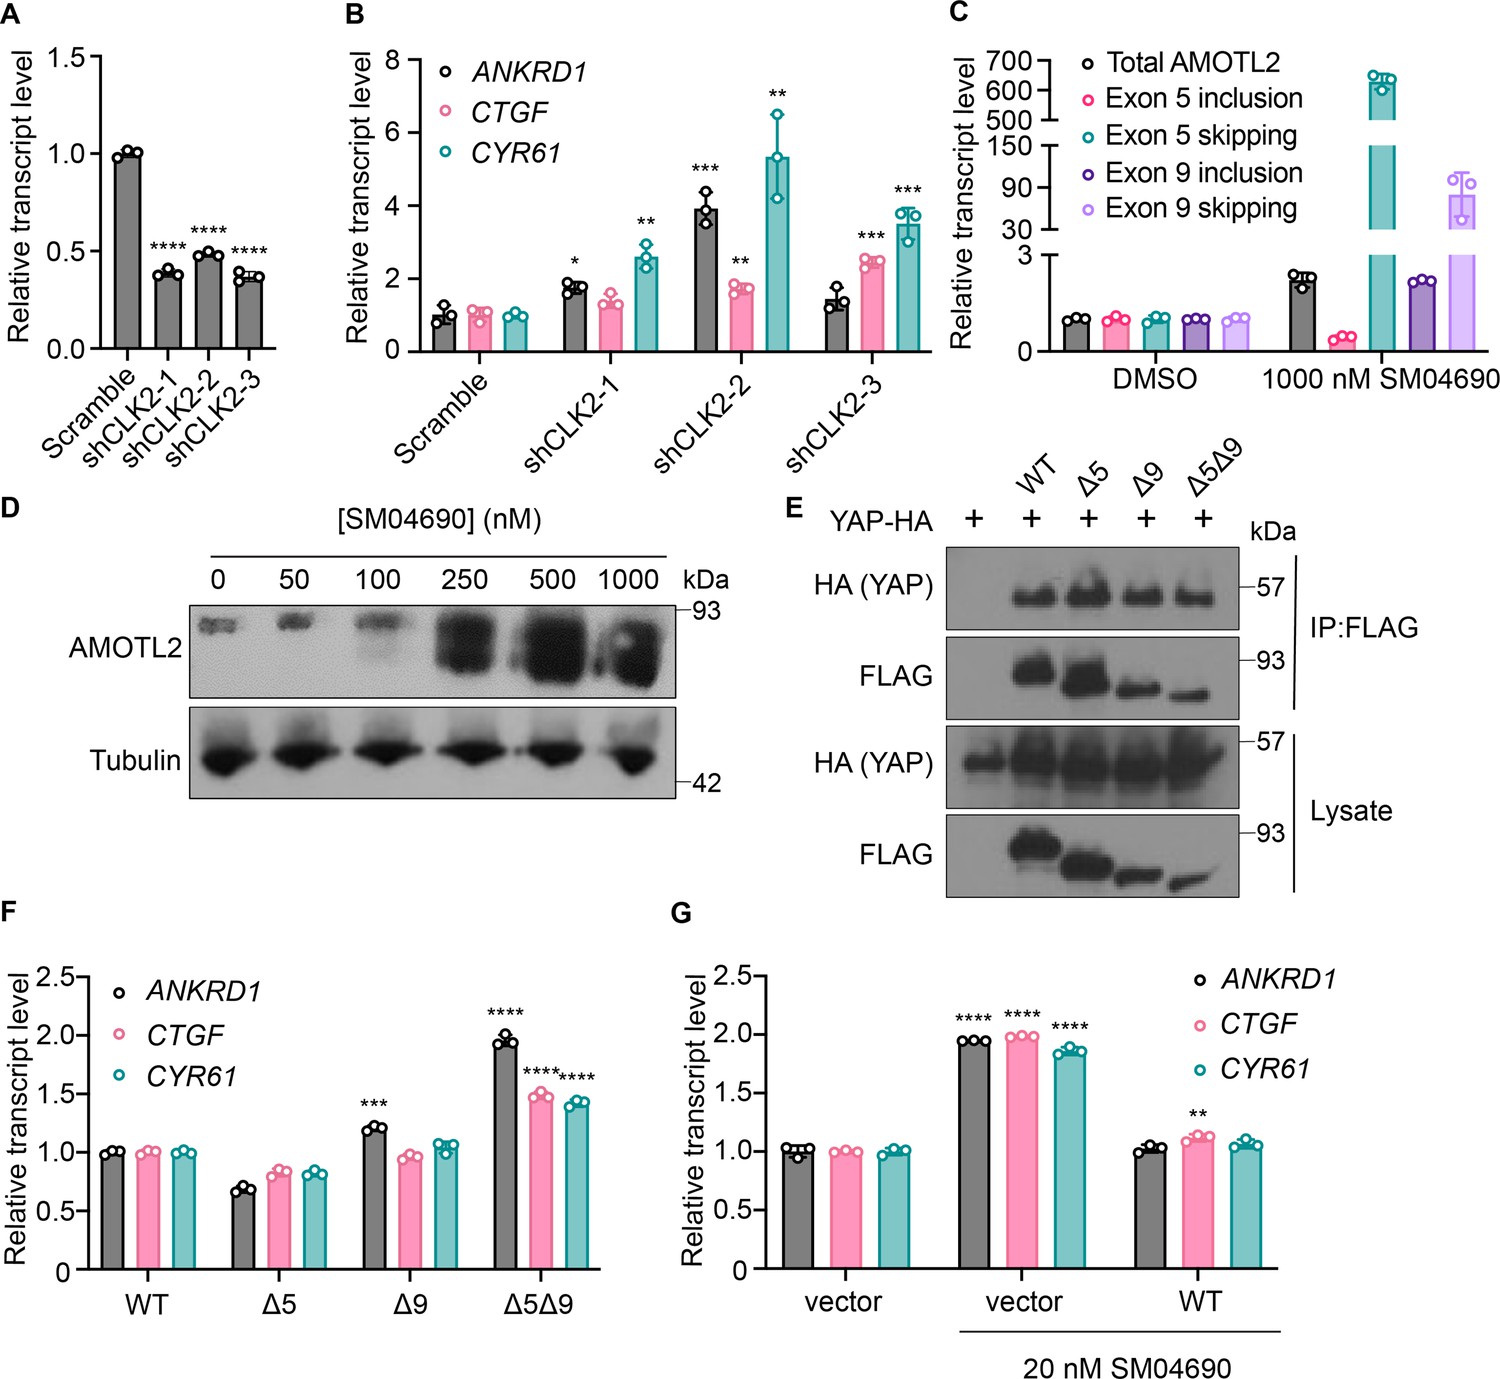
Inhibition of CLK2 by SM04690 induces alternative splicing of Hippo pathway component Angiomotin-like 2 (AMOTL2).
(A) Relative transcript levels of CLK2 following knockdown by the indicated shRNA, measured by RT-qPCR (n=3, mean and s.d.). (B) Relative transcript levels of yes-associated protein (YAP)-dependent genes (ANKRD1, CTGF, CYR61) expressing the indicated shRNA, measured by RT-qPCR (n=3, mean and s.d.). (C) Relative transcript levels of exon-included and exon-skipped spliceoforms following treatment with SM04690 for 24 hr in HEK293A cells, measured by RT-qPCR (n=3, mean and s.d.). (D) Anti-AMOTL2 immunoblotting from HEK293A cells treated with SM04690 for 24 hr. (E) Immunoblotting analysis of HA-YAP from anti-FLAG immunoprecipitated content from HEK293T cells. (F) Relative transcript levels of YAP-dependent genes (ANKRD1, CTGF, CYR61) following overexpression of 1 µg of AMOTL2 WT, ∆5, ∆9, ∆5∆9, measured by RT-qPCR (n=3, mean and s.d.). (G) Relative transcript levels of YAP-dependent genes (ANKRD1, CTGF, CYR61) following overexpression of 2 µg WT AMOTL2 and treatment with 20 nM SM04690 for 24 hr (n=3, mean and s.d.). (A, B, F, G) Statistical analyses are univariate two-sided t-tests (*p<0.0332, **p<0.0021, ***p<0.0002, ****p<0.0001).
-
Figure 3—source data 1
Relative transcript values for Figure 3A, B, C, F and G.
- https://cdn.elifesciences.org/articles/88508/elife-88508-fig3-data1-v1.xlsx
-
Figure 3—source data 2
Uncropped blots for Figure 3D.
- https://cdn.elifesciences.org/articles/88508/elife-88508-fig3-data2-v1.zip
-
Figure 3—source data 3
Uncropped blots for Figure 3E.
- https://cdn.elifesciences.org/articles/88508/elife-88508-fig3-data3-v1.zip
Figure 3—figure supplement 1
CLK2 inhibition activates yes-associated protein (YAP).
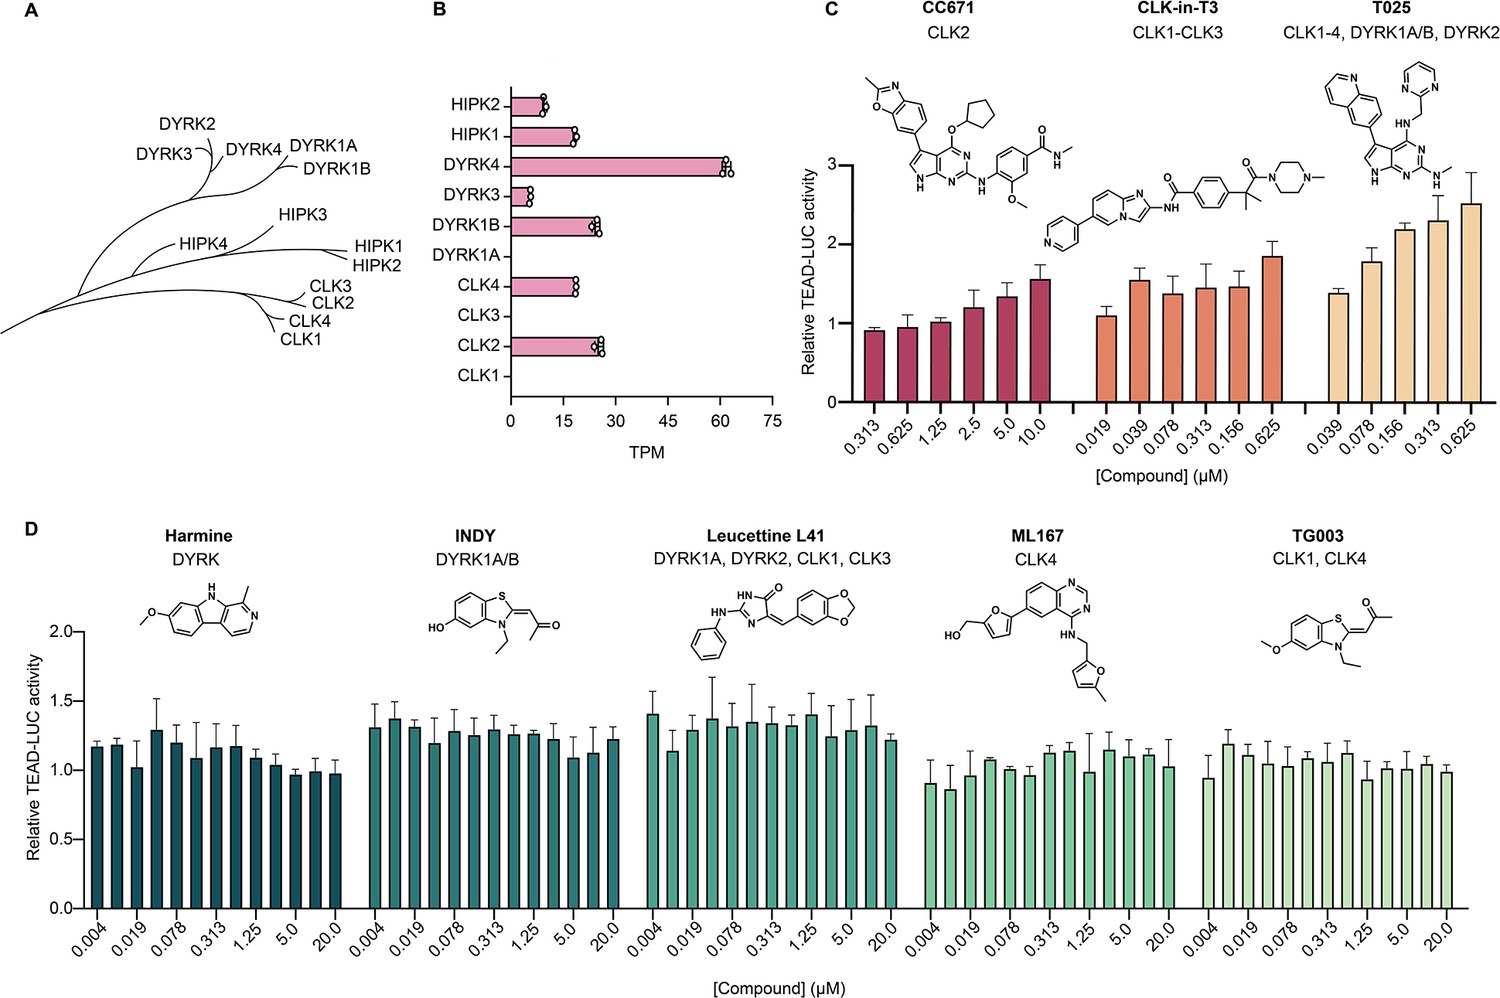
(A) Family tree of CLK, DYRK, and HIPK kinases. (B) Transcripts per million (TPM) of the transcripts corresponding to reported targets of SM04690 in HEK293A cells, as determined by RNA-sequencing of unstimulated cells. (C) Relative TEAD-LUC activity of CLK2-targeting inhibitors CC671, CLK-in-T3, and T025 in cells treated for 24 hr with compound (n=3 biological replicates, mean and s.d.). (D) Relative TEAD-LUC activity of non-CLK2-targeting inhibitors Harmine, INDY, Leucettine L41, ML167, and TG003 in cells treated for 24 hr with compound (n=3 biological replicates, mean and s.d.).
-
Figure 3—figure supplement 1—source data 1
Relative luminance values for Figure 3—figure supplement 1C and D.
- https://cdn.elifesciences.org/articles/88508/elife-88508-fig3-figsupp1-data1-v1.xlsx
Figure 3—figure supplement 2
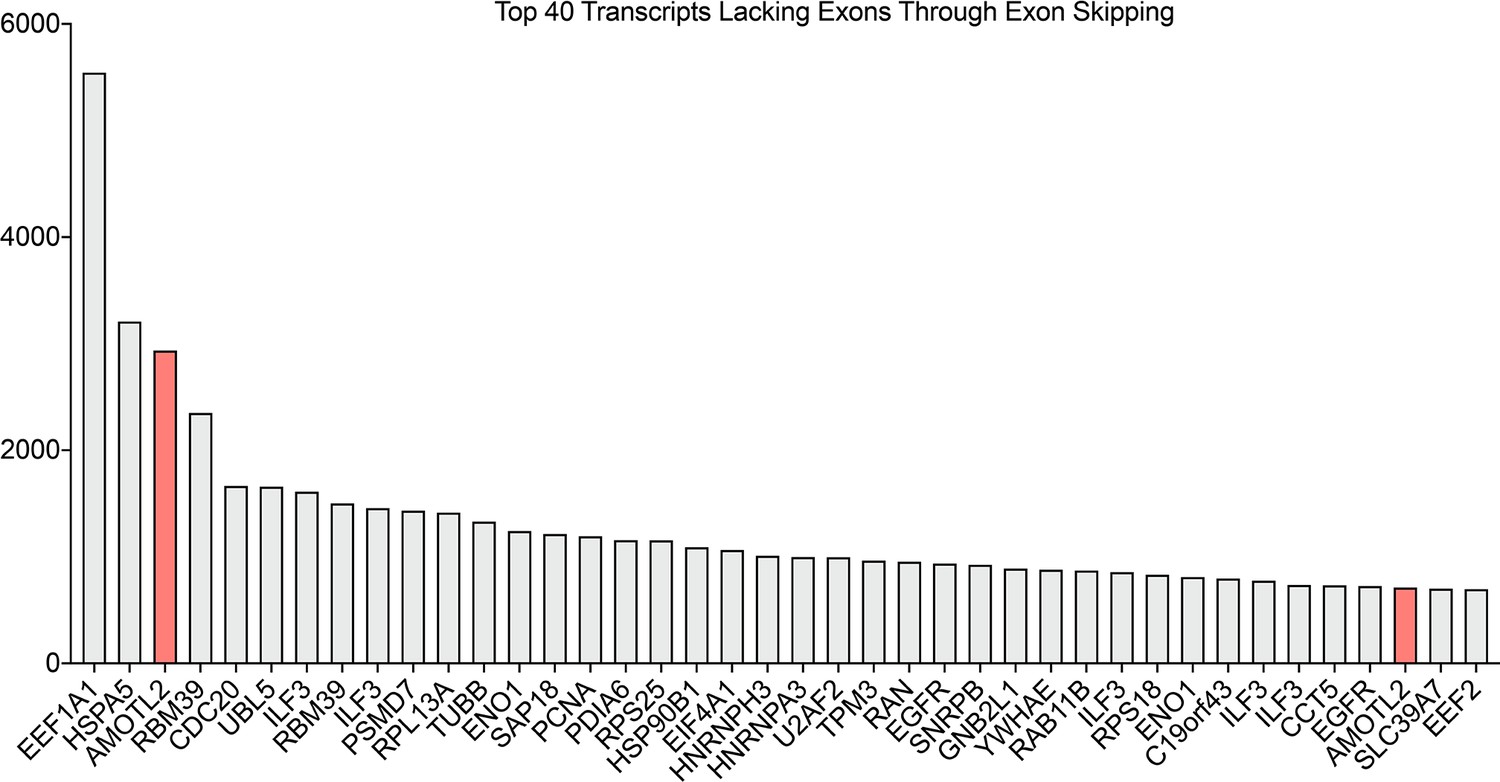
Top 40 transcripts with skipped exons in response to CLK2 inhibition.
Number of skipped exons of the indicated transcripts in response to CLK2 inhibition. Figure derived from Table B from Araki et al., 2015.
Figure 3—figure supplement 3
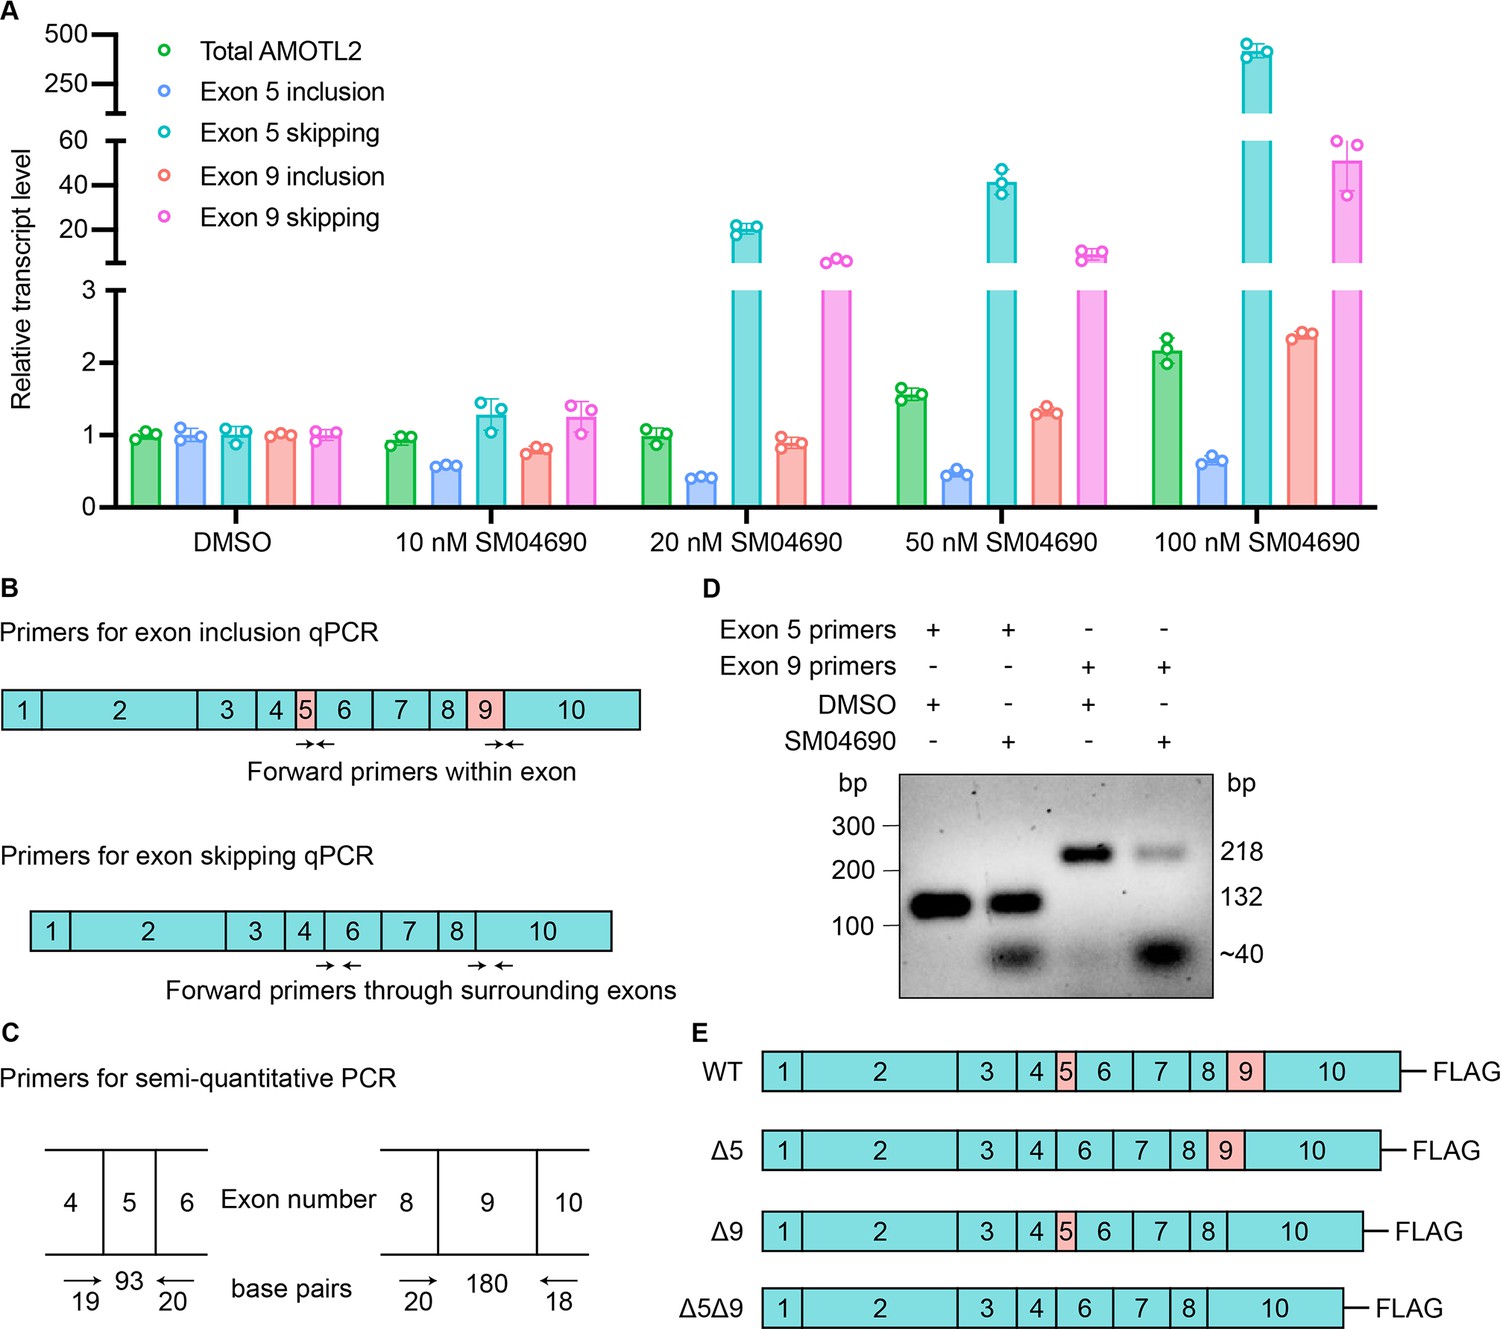
Inhibition of CLK2 by SM04690 causes alternative splicing of Angiomotin-like 2 (AMOTL2) exons 5 and 9.
Relative transcript levels of indicated spliceoforms (A) following treatment with increasing concentrations SM04690 for 24 hr in HEK293A cells, measured by RT-qPCR (n=3, mean and s.d.) and schematic of primer design (B) to determine the presence of exon skipping in AMOTL2 by RT-qPCR. Exon inclusion primers were designed with the forward primer within the exon and the reverse primer at the start of the next flanking exon. Exon skipping primers were designed with the forward primer spanning the junction between the two exons flanking the skipped exon and the reverse primer within the adjacent exon. (C) Schematic of primer design to determine exon skipping in AMOTL2 by semi-quantitative polymerase chain reaction (PCR). The forward primer resides in the exon preceding the skipped exon and the reverse primer resides in the exon following the skipped exon. (D) Agarose gel electrophoresis of PCR amplified products using exon-specific primer sets. The primers amplified differently sized PCR amplicons depending on whether the template included the variable exon. Exon-included samples appear in the gel at the size of the exon plus the size of the primers. Exon-skipped samples appear in the gel at the size of only the primers (~40 base pairs). (E) Schematic of C-terminally FLAG-tagged AMOTL2 constructs.
-
Figure 3—figure supplement 3—source data 1
Relative transcript values for Figure 3—figure supplement 3A.
- https://cdn.elifesciences.org/articles/88508/elife-88508-fig3-figsupp3-data1-v1.xlsx
-
Figure 3—figure supplement 3—source data 2
Uncropped gel for Figure 3—figure supplement 3D.
- https://cdn.elifesciences.org/articles/88508/elife-88508-fig3-figsupp3-data2-v1.zip
Figure 4 with 3 supplements
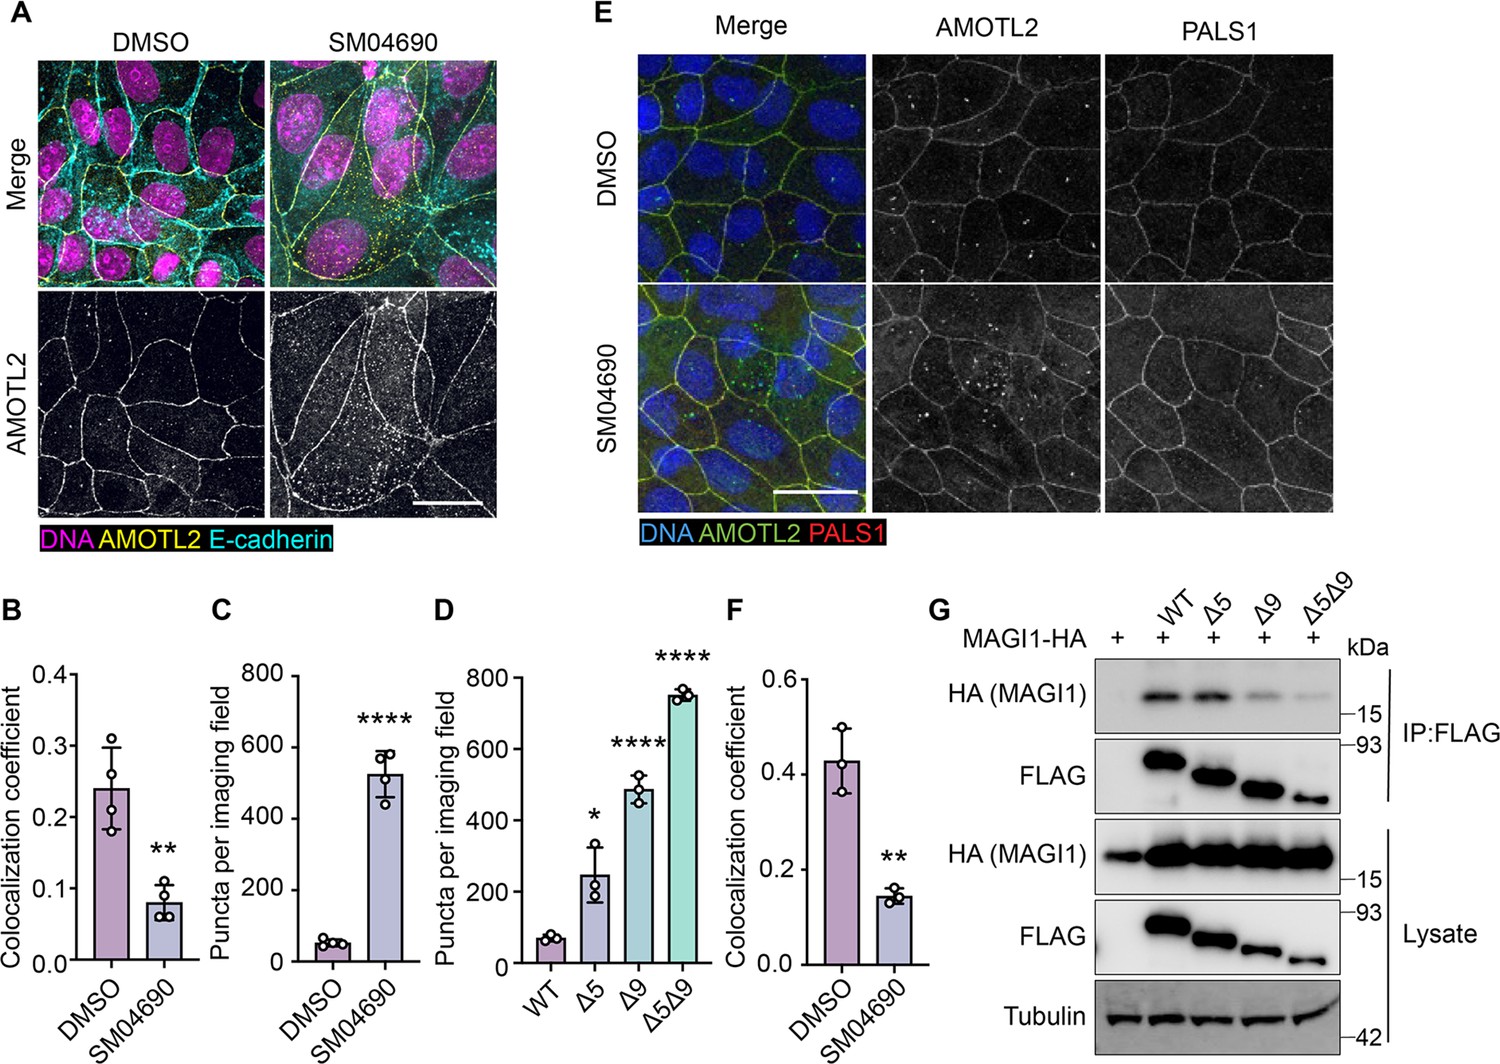
Alternative splicing of Angiomotin-like 2 (AMOTL2) promotes delocalization from the membrane, essential to the activity of SM04690.
(A) Representative images of anti-AMOTL2 (yellow) and anti-E-cadherin (teal) immunofluorescent staining (with Hoechst 33342 in pink to visualize nuclei) of MDCK cells treated with control or 1 µM SM04690 for 24 hr (scale bar = 10 µm). (B) Quantification of anti-AMOTL2 and anti-E-cadherin correlative immunofluorescent staining (n=4, mean and s.d.). (C) Number of puncta in HEK293A cells treated with 1 µM SM04690 for 24 hr (n=4, mean and s.d.). (D) Number of puncta per image field in HEK293A cells from 12-well plates overexpressing AMOTL2 spliceoforms (n=3, mean and s.d.). (E) Representative images of anti-AMOTL2 (green) with anti-PALS1 (red) immunofluorescent staining of MDCK cells treated with control or 1 µM SM04690 for 24 hr. Hoechst 33342 (blue) was used to visualize nuclei (scale bar = 20 µm). (F) Quantification of anti-AMOTL2 and anti-PALS1 correlative immunofluorescent staining (n=3, mean and s.d.). (I) Immunoblotting analysis of HA-MAGI1 WW1, 2 from anti-FLAG immunoprecipitated content from HEK293T cells. (B, C, D, F) Statistical analyses are univariate two-sided t-tests (*p<0.0332, **p<0.0021, ****p<0.0001).
-
Figure 4—source data 1
Uncropped blots for Figure 4G.
- https://cdn.elifesciences.org/articles/88508/elife-88508-fig4-data1-v1.zip
Figure 4—figure supplement 1
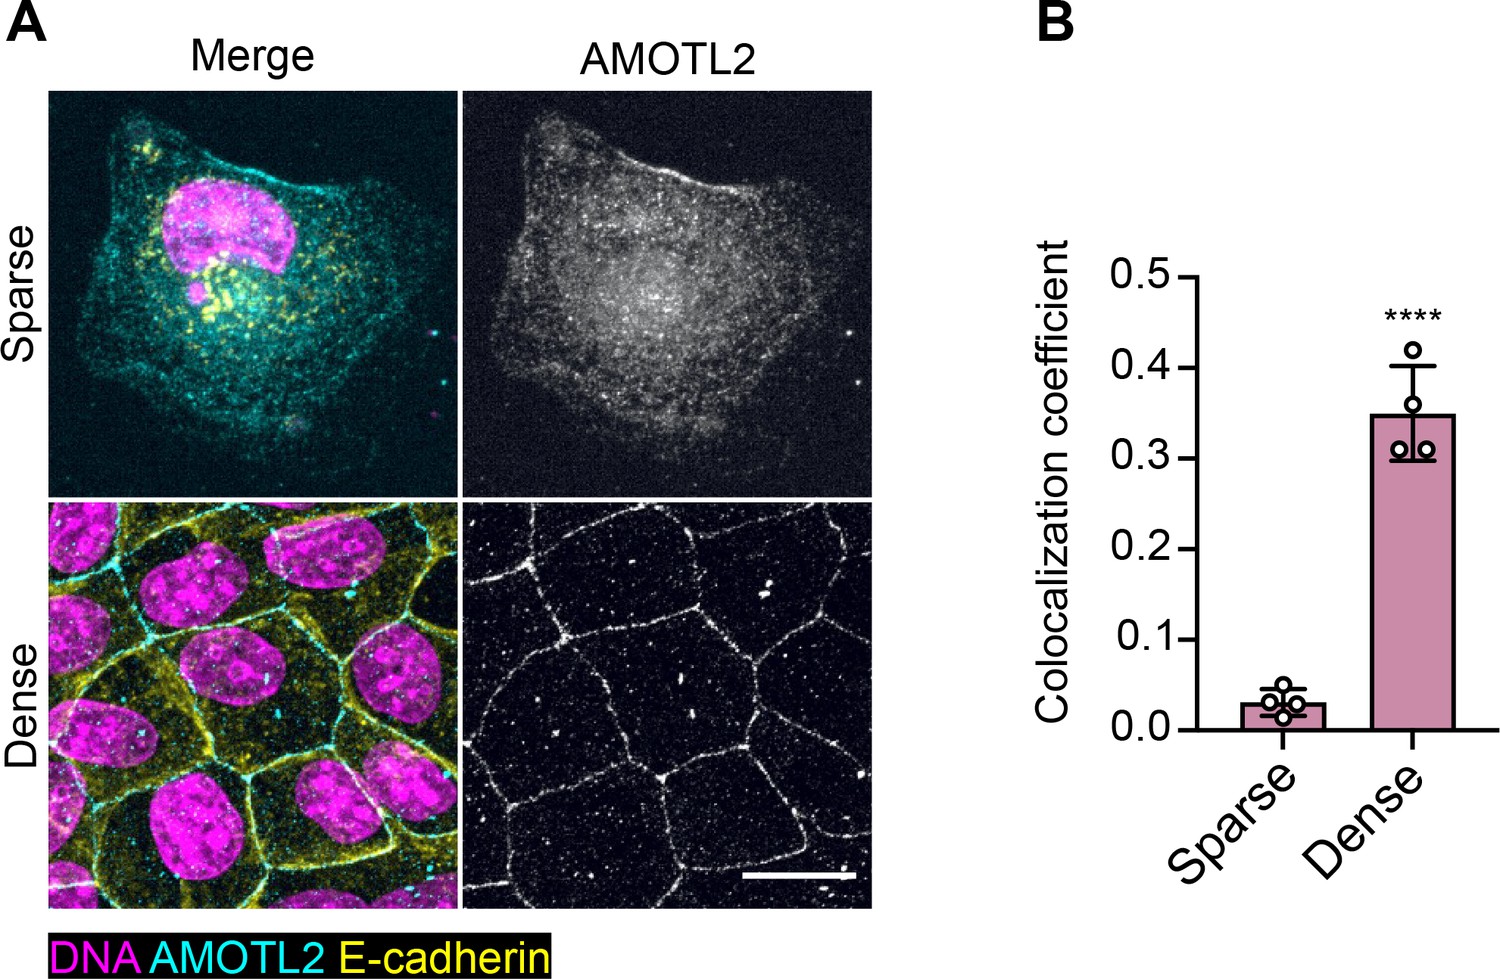
Angiomotin-like 2 (AMOTL2) displays density-dependent localization to the plasma membrane.
(A) Representative images of anti-AMOTL2 (teal) and anti-E-cadherin (yellow) immunofluorescent staining of MDCK cells grown in sparse (10,000 cells) and dense (400,000 cells) cell conditions with Hoechst 33342 (pink) to visualize nuclei (scale bar = 20 µm). (B) Quantification of anti-AMOTL2 and anti-E-cadherin correlative immunofluorescent staining (n=4, mean and s.d.). Statistical analysis is a univariate two-sided t-test (****p<0.0001).
Figure 4—figure supplement 2
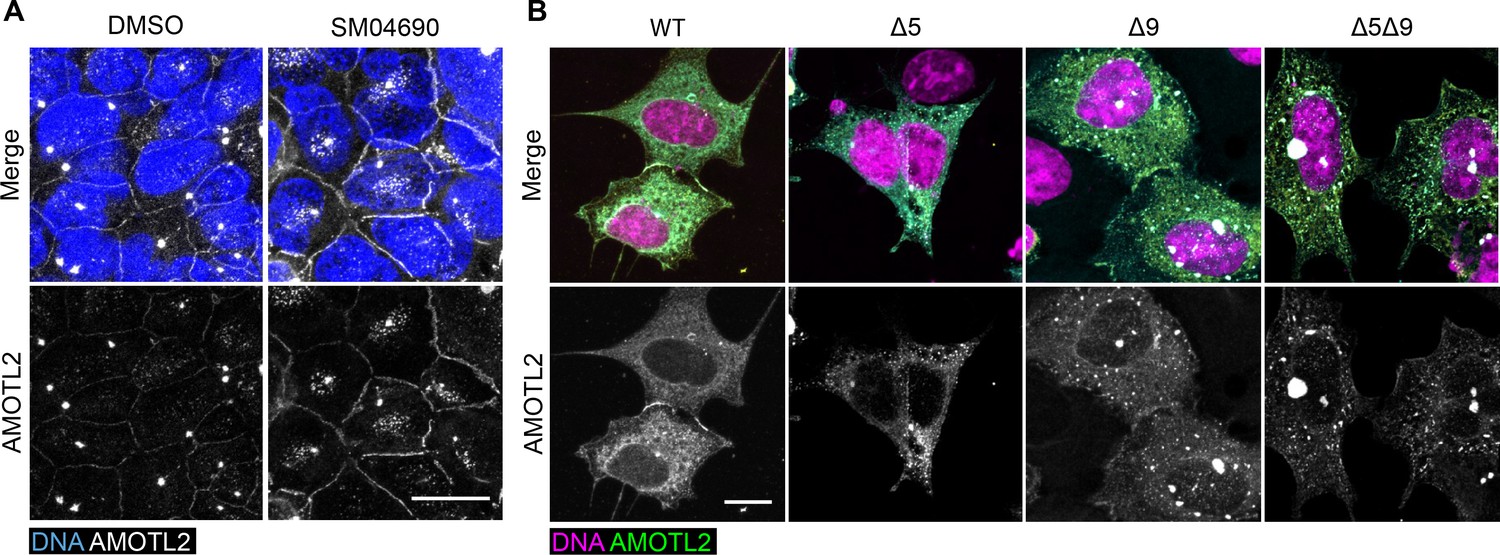
Angiomotin-like 2 (AMOTL2) spliceoforms are aggregation-prone and do not localize to membranes.
(A) Representative images of anti-AMOTL2 (white) immunofluorescent staining of HEK293A cells treated with control or 1 µM SM04690 for 24 hr with Hoechst 33342 (blue) to visualize nuclei (scale bar = 20 µm). (B) Representative images of anti-AMOTL2 (green) immunofluorescent staining of HEK293A cells overexpressing AMOTL2 spliceoforms with Hoechst 33342 (pink) to visualize nuclei (scale bar = 10 µm).
Figure 4—figure supplement 3
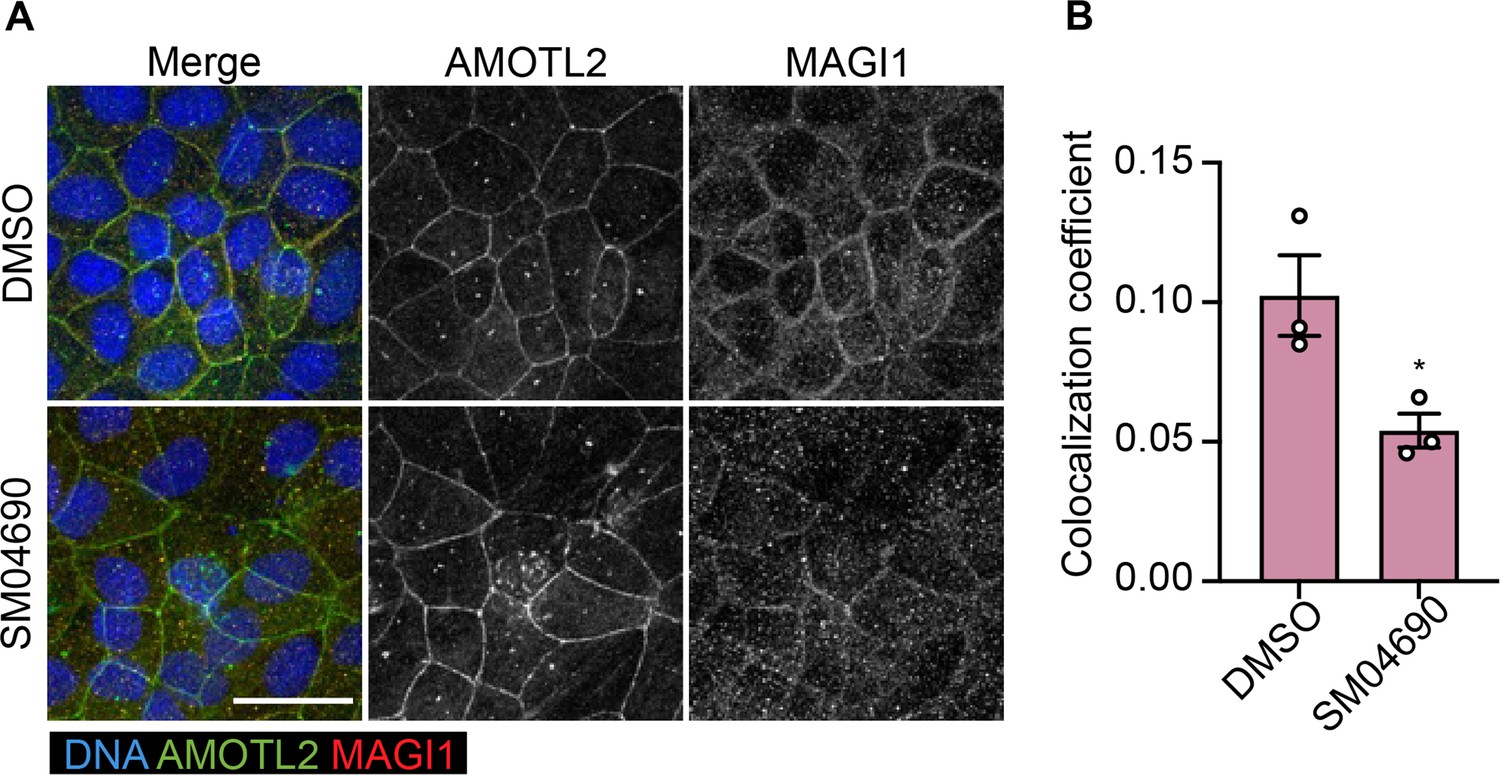
SM04690 treatment delocalizes Angiomotin-like 2 (AMOTL2) from MAGI1.
(A) Representative images of anti-AMOTL2 (green) and anti-MAGI1 (red) immunofluorescent staining of MDCK cells treated with control or 1 µM SM04690 for 24 hr. Hoechst 33342 (blue) was used to visualize nuclei (scale bar = 30 µm). (B) Quantification of anti-AMOTL2 and anti-MAGI1 correlative immunofluorescent staining (n=3, mean and s.d.). Statistical analysis is a univariate two-sided t-test (*p<0.0332).
Figure 5
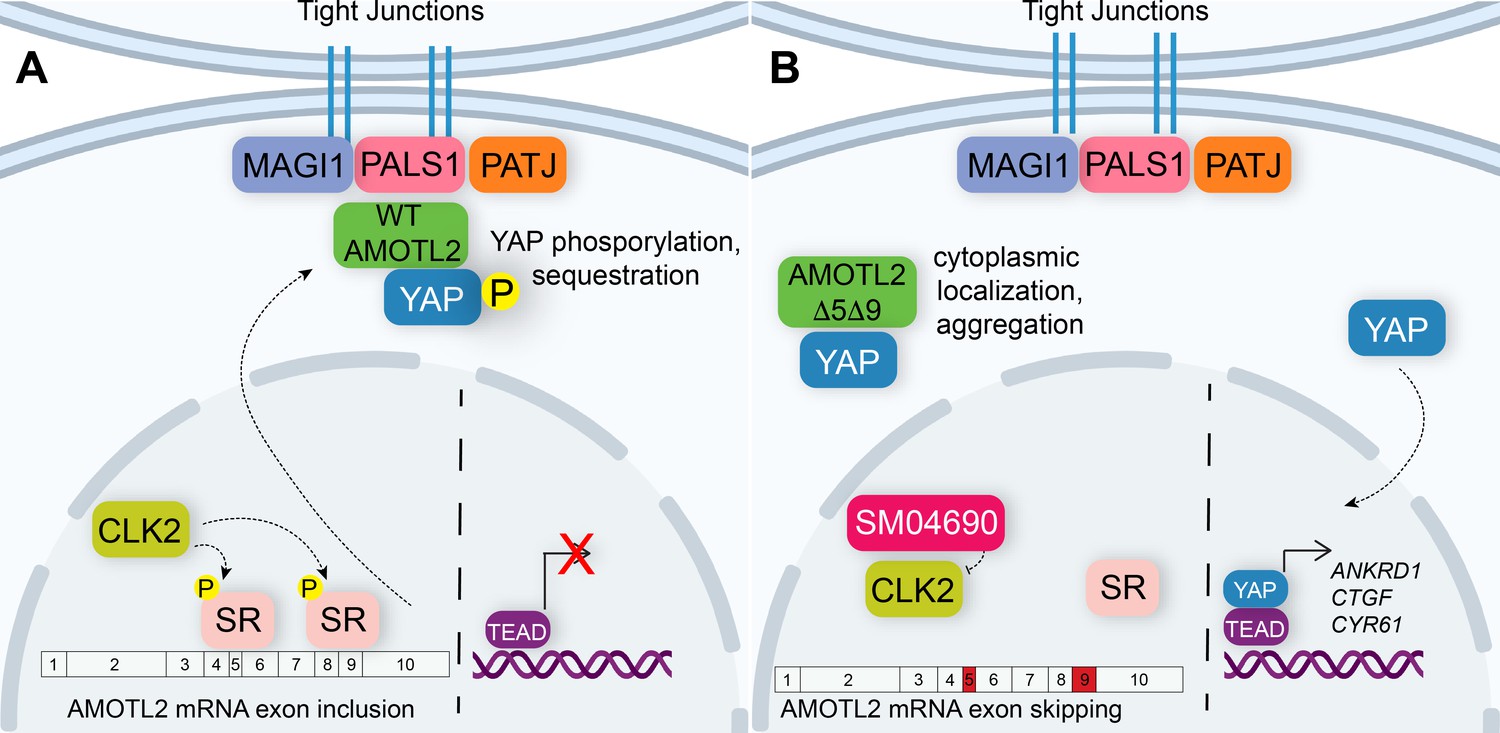
Alternative splicing of Angiomotin-like 2 (AMOTL2) modulates Hippo pathway activity.
(A) A mechanistic model depicting that in the unperturbed system, AMOTL2 localizes at the membranes with proteins associated at tight junctions, bringing yes-associated protein (YAP) in contact with the core kinase cascade of the Hippo pathway resulting in its phosphorylation and retention in the cytoplasm. (B) Inhibition of CLK2 by SM04690 decreases phosphorylation of serine/arginine-rich splicing factors, leading to exon skipping of exons 5 and 9 of AMOTL2. AMOTL2 lacking exons 5 and 9 cannot interact with membrane and membrane-associated tight junction proteins. As such, AMOTL2 cannot localize YAP to tight junctions, and so YAP localizes to the nucleus, interacts with TEA domain transcription factors (TEADs), and activates its transcripts.
Additional files
Download links
A two-part list of links to download the article, or parts of the article, in various formats.
Downloads (link to download the article as PDF)
Open citations (links to open the citations from this article in various online reference manager services)
Cite this article (links to download the citations from this article in formats compatible with various reference manager tools)
Pharmacological inhibition of CLK2 activates YAP by promoting alternative splicing of AMOTL2
eLife 12:RP88508.
https://doi.org/10.7554/eLife.88508.3


