Cell type-specific contributions to a persistent aggressive internal state in female Drosophila
- Division of Biology and Biological Engineering, Tianqiao and Chrissy Chen Institute for Neuroscience, California Institute of Technology, United States
- Janelia Research Campus, Howard Hughes Medical Institute, United States
- Howard Hughes Medical Institute, California Institute of Technology, United States
Figures
Figure 1 with 2 supplements
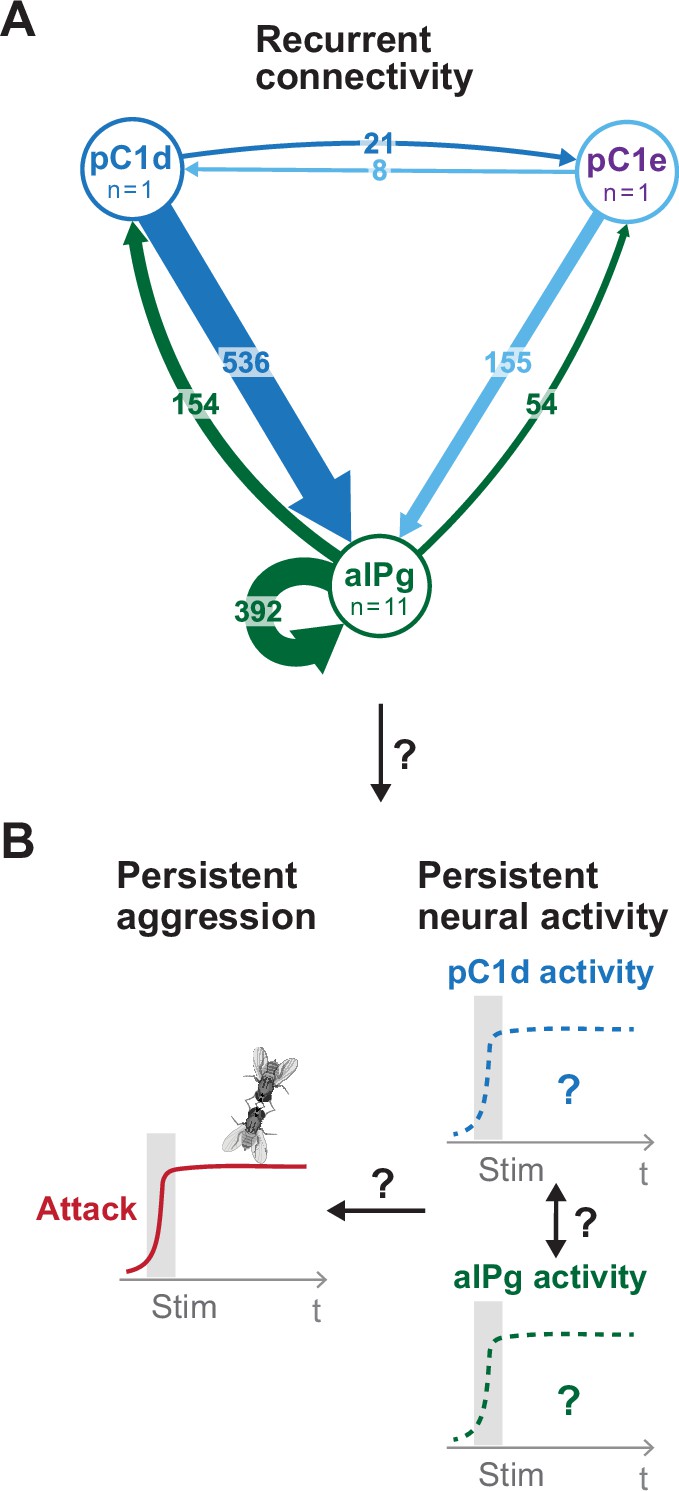
Proposed model for persistent aggressive behavior in females.
Recurrent connectivity between pC1d, pC1e, and aIPg (A) has been proposed to generate a persistent aggressive internal state by prolonging the neural activity of pC1d or aIPg neurons (B) (Deutsch et al., 2020; Schretter et al., 2020). For the connectivity diagram (A), synapse number is noted on each arrow and no thresholds were applied between types.
Figure 1—figure supplement 1
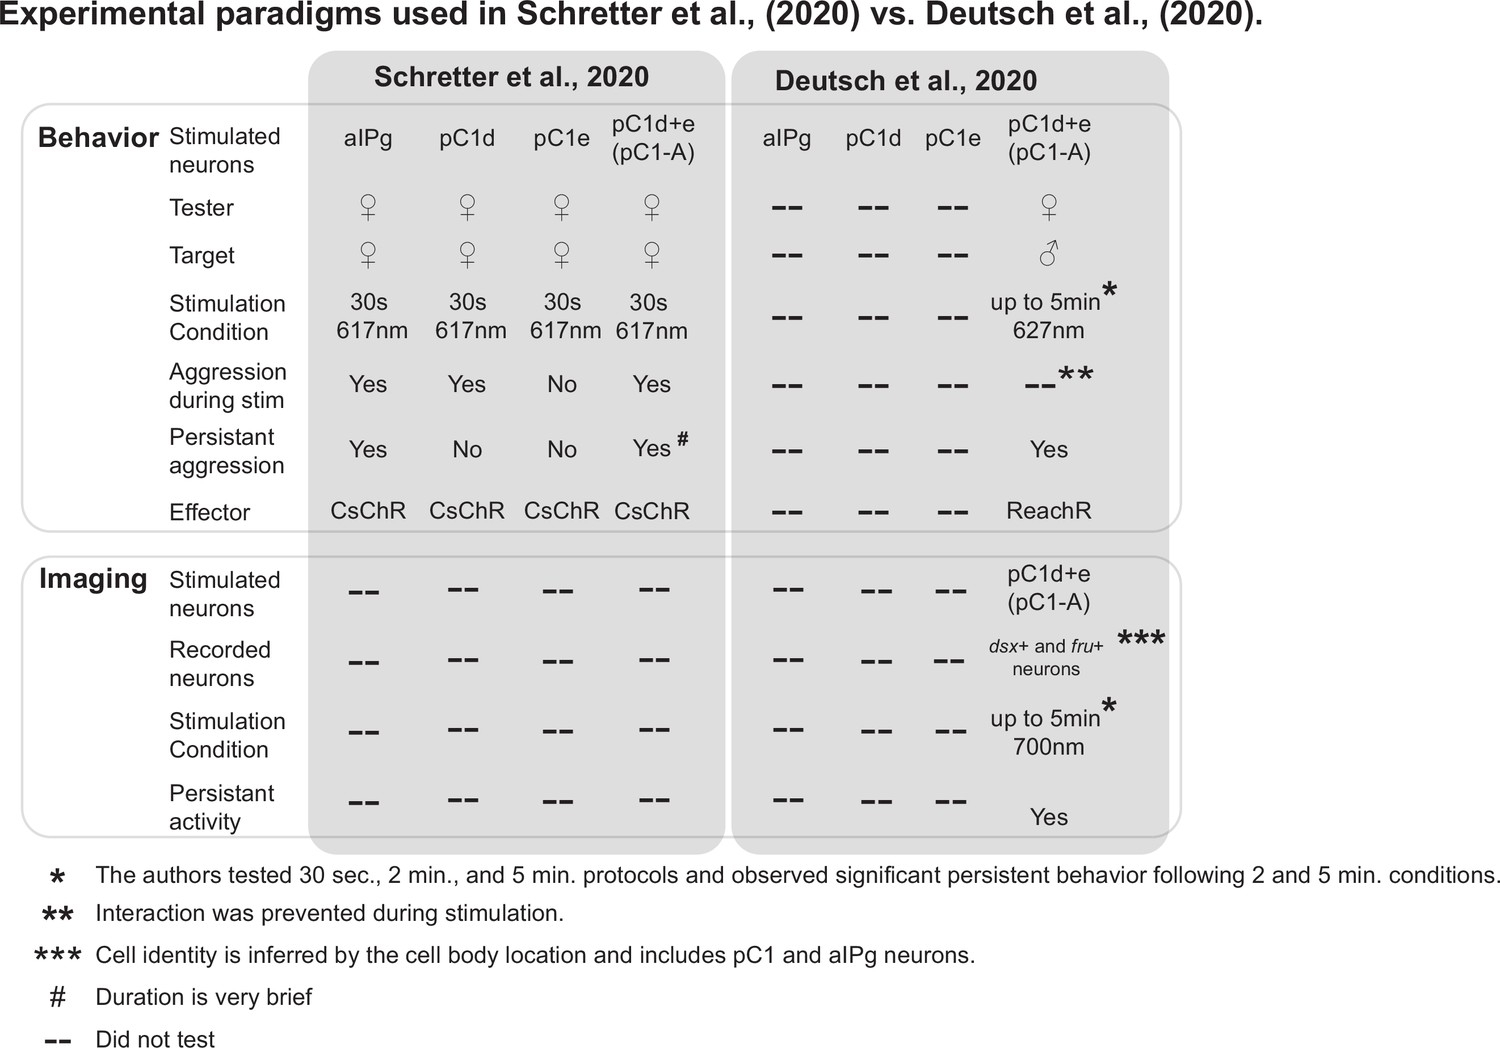
Comparison of the experimental designs used in Schretter et al., 2020 and Deutsch et al., 2020.
Experimental conditions and results of the behavioral and imaging experiments demonstrated in Schretter et al., 2020 and Deutsch et al., 2020 are compared. For behavioral experiments, the major differences between the two papers are in the stimulation duration (30 seconds vs. up to 5 minutes), sex of the target (female vs. male), and optogenetic effector (CsChrimson vs. ReachR). Based on the cell body location in pan-neuronal GCaMP imaging, Deutsch et al., 2020 conclude that persistent activity was observed in pC1 and aIPg neurons.
Figure 1—figure supplement 2
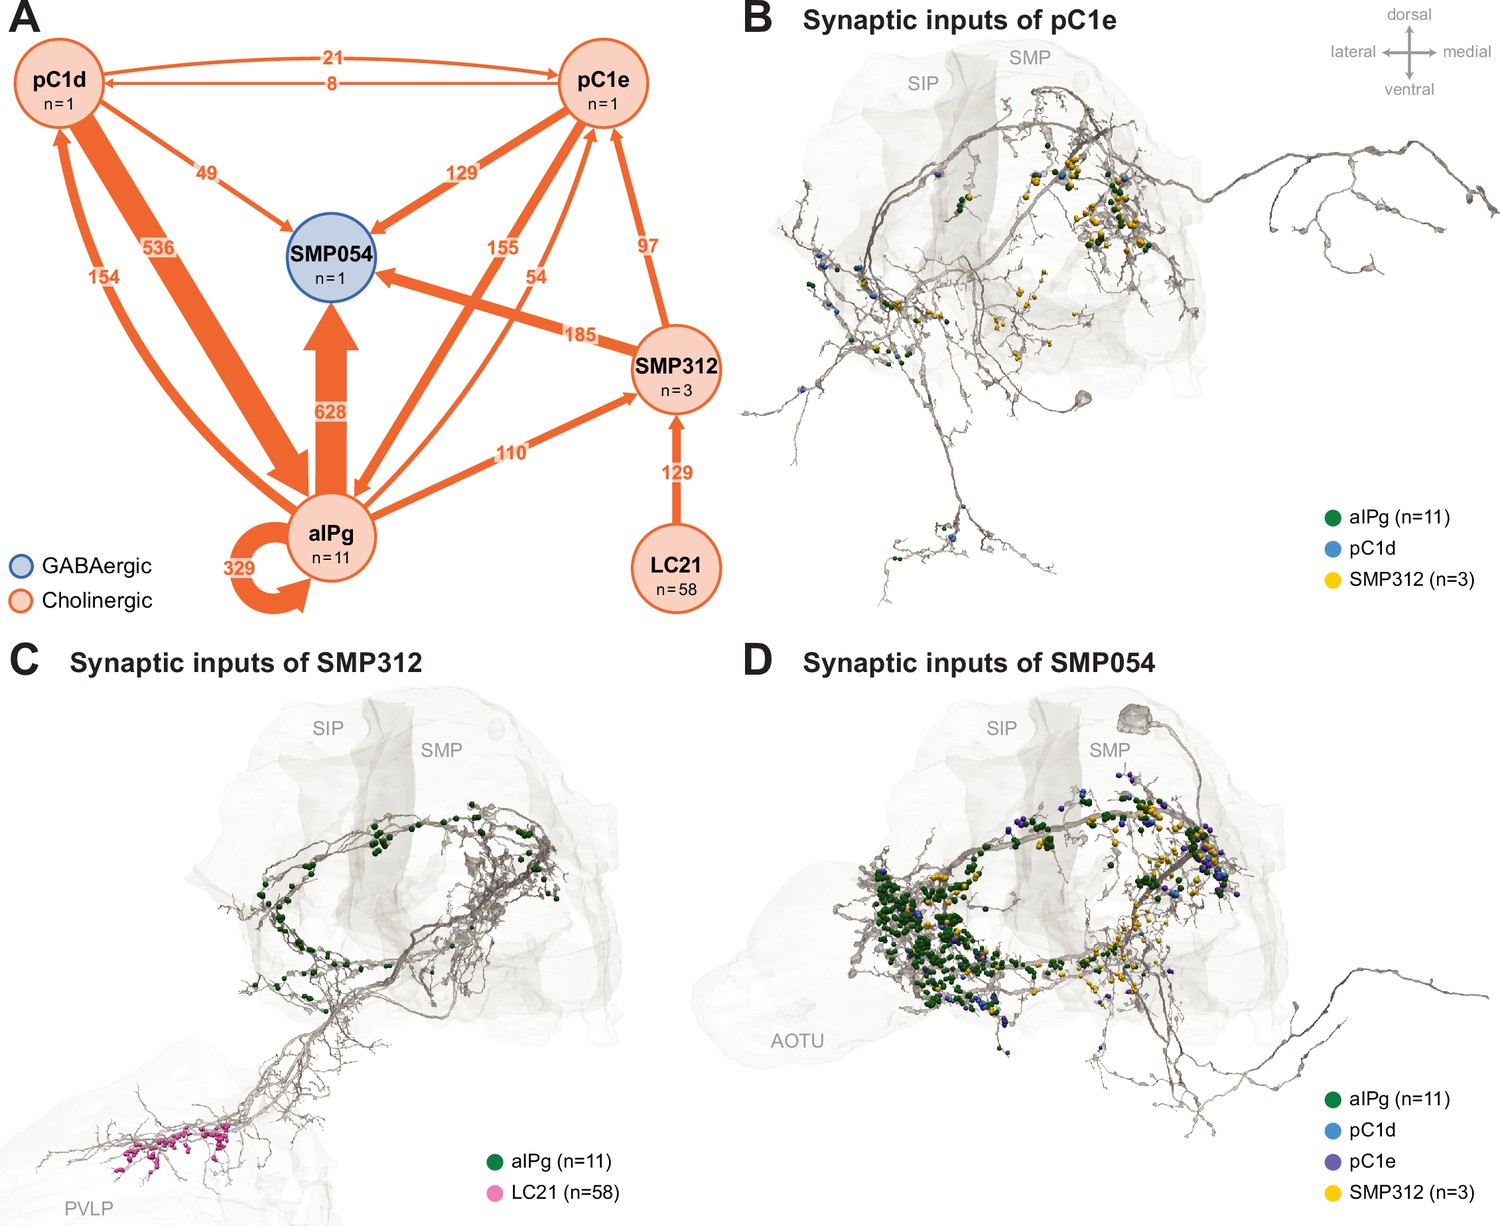
Additional circuit components.
Common prominent targets and inputs to aIPg, pC1d, and pC1e neurons. (A) aIPg neurons form direct and indirect connections with pC1e. The most prominent indirect connection goes through the interneuron SMP312. Previous connectomic analysis highlighted SMP054 neurons in a circuit indirectly linking aIPg with LC10 neurons, a specific type of lobula columnar visual output neurons tuned to small moving objects (Ribeiro et al., 2018; Schretter et al., 2020; Wu et al., 2016). In addition to being a common target of aIPg, pC1d, and pC1e, SMP054 receives indirect visual input through SMP312, possibly indicating the presence of another fly. Because our attempts to generate cell-type-specific driver lines for SMP054 have failed, we cannot test the behavior generated by SMP054 activation. Synapse number is noted on each arrow and neurotransmitter predictions (Eckstein et al., 2024) are indicated by color (blue, GABAergic; orange, cholinergic). A threshold of 25 synapses was applied, except for the connectivity between pC1d and pC1e. (B) Distribution of synaptic inputs from aIPg (green), pC1d (blue), and SMP312 (yellow) on the neuronal skeleton of pC1e. (C) Distribution of synaptic inputs from aIPg (green) and LC21 (pink) on the neuronal skeleton of SMP312. (D) Distribution of synaptic inputs from aIPg (green), pC1d (blue), pC1e (purple), and SMP312 (yellow) on the neuronal skeleton of SMP054. Select brain regions (SIP, superior intermediate protocerebrum; SMP, superior medial protocerebrum; PVLP, posterior ventrolateral protocerebrum; AOTU, anterior optic tubercle) are outlined in light gray. The dorsal side of the model brain is up, and the lateral is toward the left. Data are from the NeuPrint hemibrain dataset v1.2.1.
Figure 2 with 2 supplements
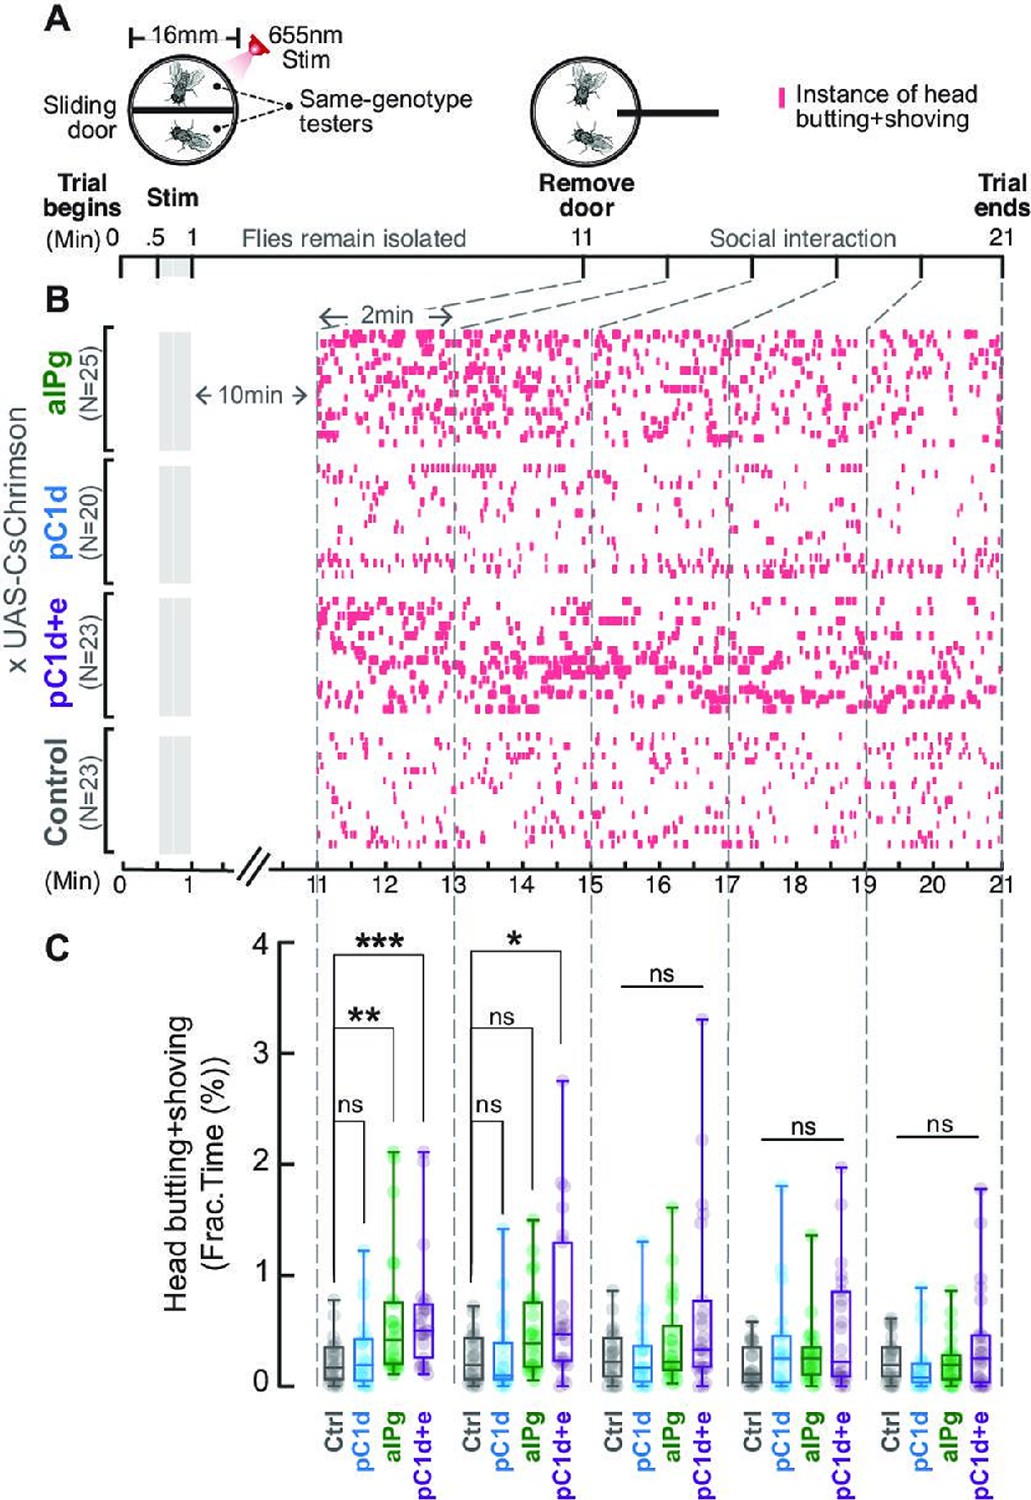
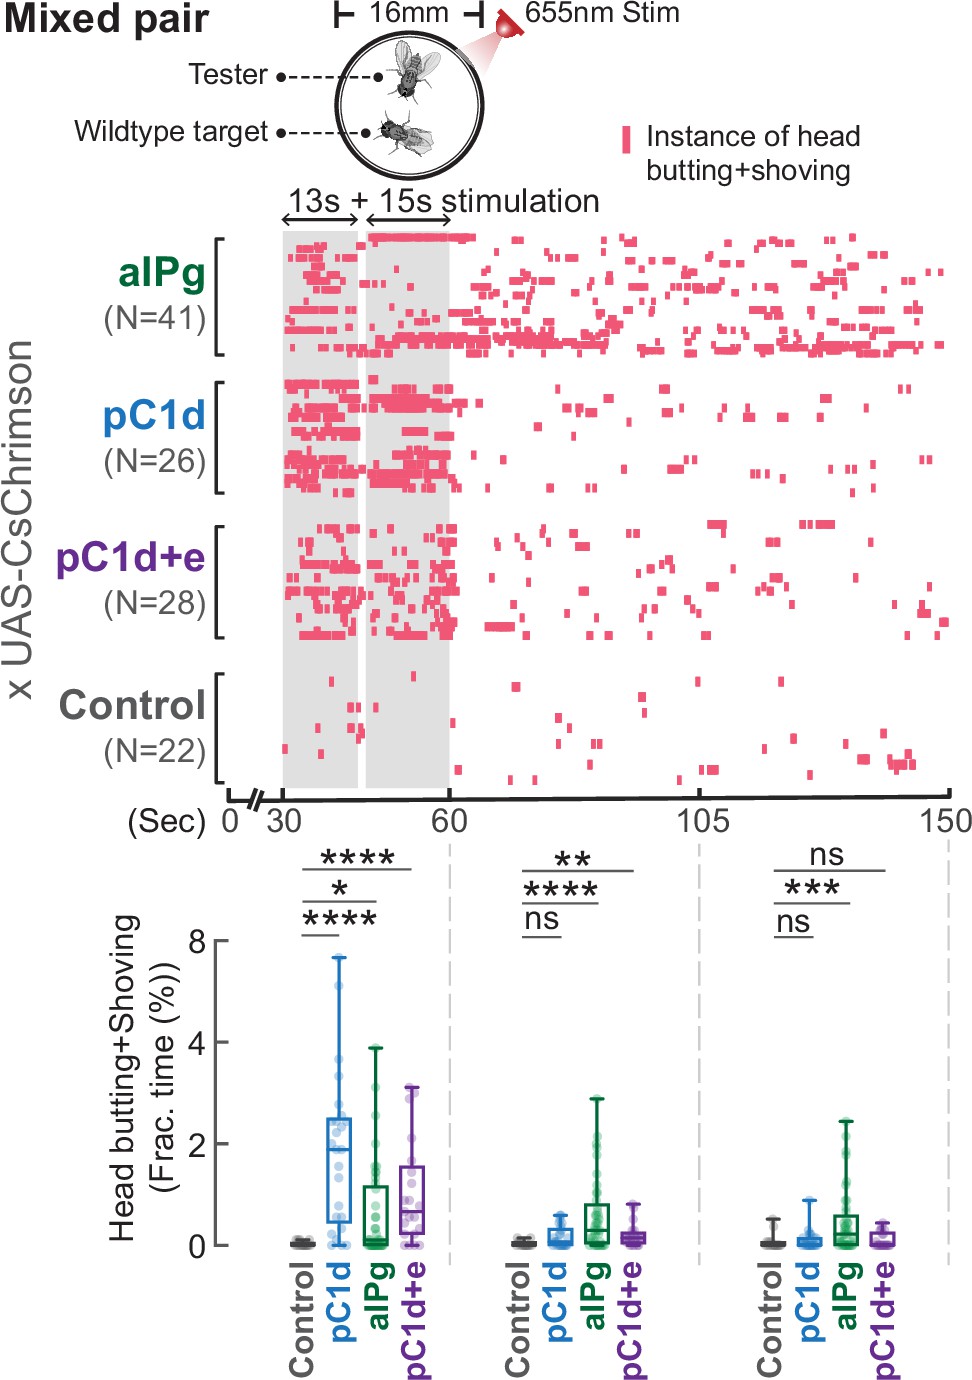
Brief stimulation of aIPg, but not pC1d alone, promotes persistent female aggression.
Cell-specific contributions of aIPg, pC1d, and pC1d+e neurons to persistent aggressive internal state were tested using the sliding-door assay (A). Same-genotype testers were separated by a sliding door in the behavioral chamber while receiving a brief 655 nm light stimulation (13+15 seconds). Doors were removed 10 minutes after the stimulation to allow the flies to interact. Level of female aggression (head butting + shoving, red ticks) is shown in the raster plot (B). Fraction of time spent on fighting by each genotype female is compared in the box plot (C). Data were combined from three independent biological repeats. Additional information on genotypes used and statistics performed is provided in Supplementary files 1 and 2. ***p<0.001; **p<0.01; *p<0.05; ns, not significant. Control, empty split-Gal4 driver (BDP-AD; BDP-DBD).
-
Figure 2—source data 1
Source data for Figure 2 graph on time spent performing aggressive behaviors.
- https://cdn.elifesciences.org/articles/88598/elife-88598-fig2-data1-v1.xlsx
Figure 2—figure supplement 1
Stimulation of aIPg, but not pC1d alone, promotes persistent attacks toward a wild-type target.
Stimulation of aIPg, but not pC1d alone, promotes persistent attacks toward a wild-type target. Testers remained aggressive toward a group housed wild-type target after the cessation of aIPg stimulation, but aggression was time-locked to the stimulation period when pC1d neurons were stimulated. Aggression (head butting+shoving, red ticks) was shown in the raster plot, and the fraction of time spent on attacks was compared in the box plot. Flies were freely interacting throughout the experiments, and data were combined from two independent biological repeats. Additional information on genotypes used and statistics performed is provided in Supplementary files 1 and 2. ****p<0.0001; ***p<0.001; **p<0.01; *p<0.05; ns, not significant. Control, empty split-Gal4 driver (BDP-AD; BDP-DBD).
-
Figure 2—figure supplement 1—source data 1
Source data for Figure 2—figure supplement 1 graph on time spent performing aggressive behaviors.
- https://cdn.elifesciences.org/articles/88598/elife-88598-fig2-figsupp1-data1-v1.xlsx
Figure 2—figure supplement 2
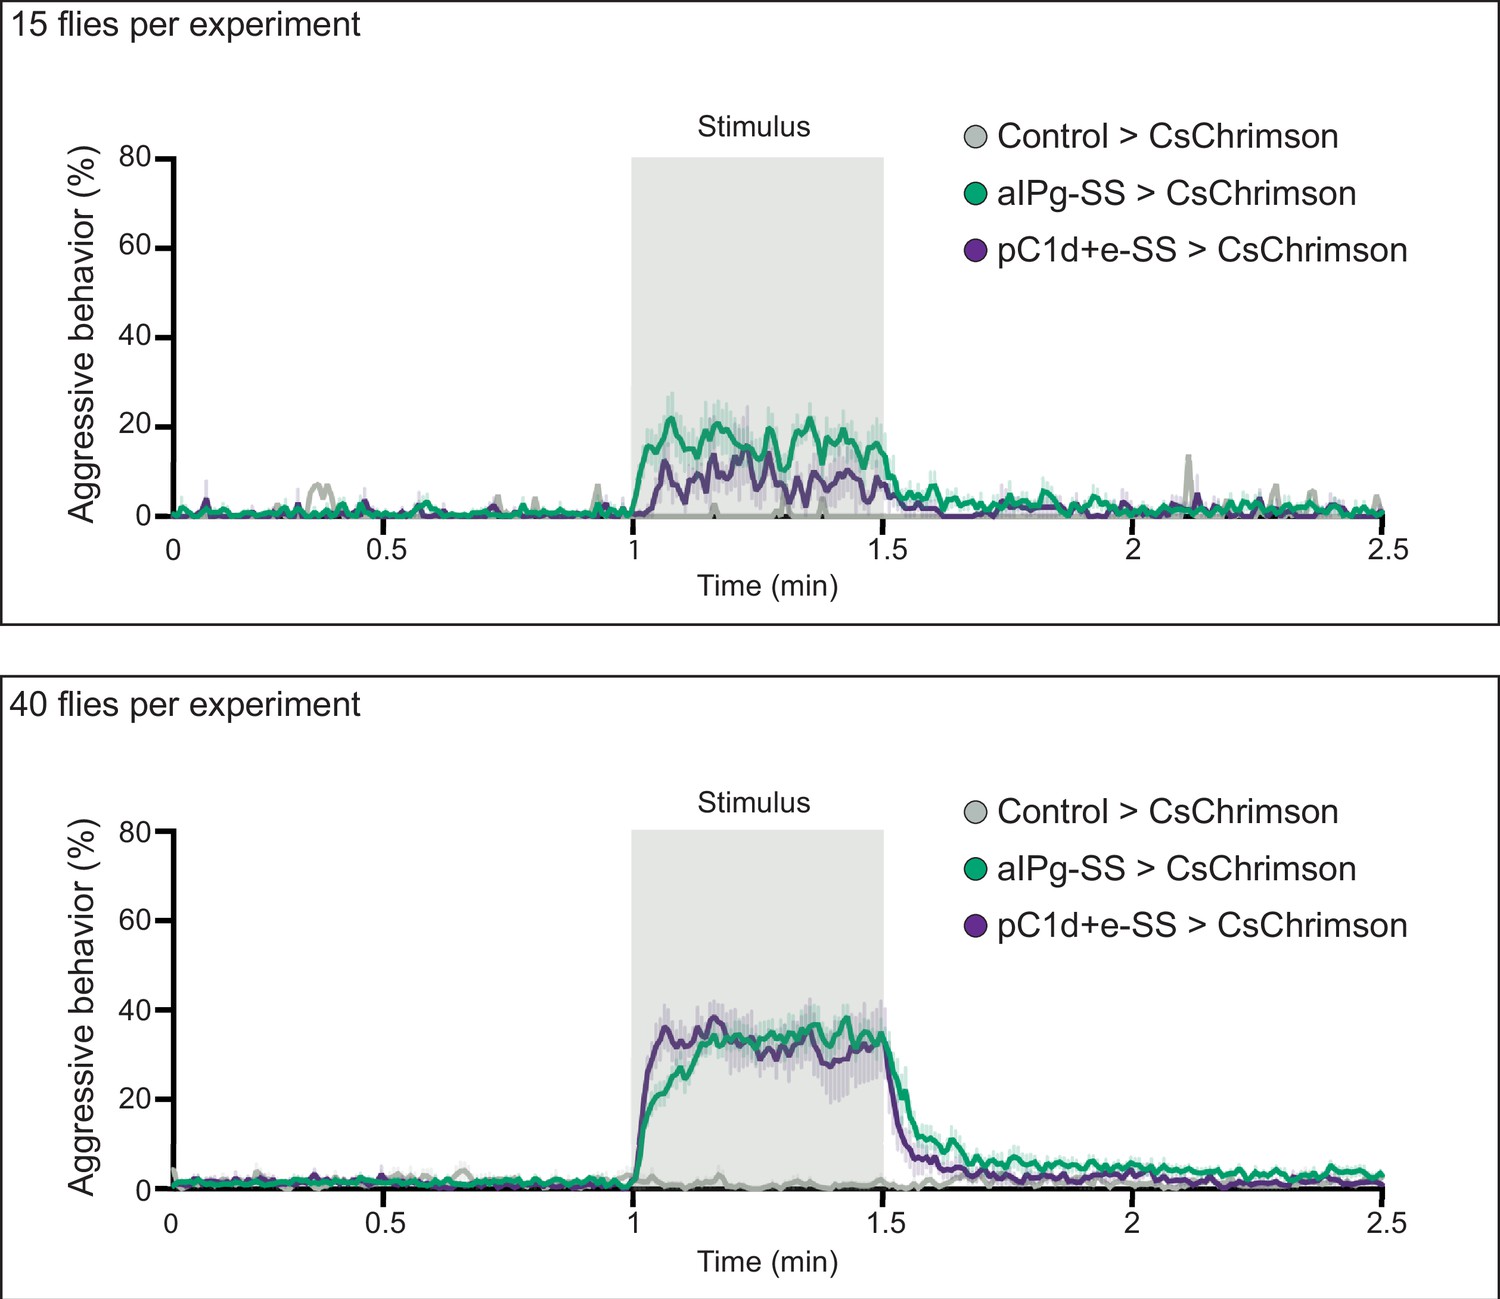
Density influences the persistence of aggression.
Density influences the persistence of aggression. Aggression increased and persisted longer after stimulation with increased fly density in the behavioral chambers. For each experiment, 15 (top) or 40 (bottom) flies were placed in the behavioral chamber. The percentage of flies performing aggressive behavior at a given frame is shown by the color-coded traces. Data were combined from two independent biological repeats. Green, aIPg-activated flies. Purple, pC1d-activated flies. Gray, Control flies (empty split-Gal4 driver, BDP-AD; BDP-DBD). (Top) Control>CsChrimson, n = 1 experiment; aIPg-SS>CsChrimson, n = 7 experiments; pC1d+e-SS>CsChrimson, n=4 experiments; (Bottom) Control>CsChrimson, n=4 experiments; aIPg-SS>CsChrimson, n=11 experiments; pC1d+e-SS>CsChrimson, n=7 experiments.
-
Figure 2—figure supplement 2—source data 1
Source data for Figure 2—figure supplement 2 on percent of flies engaging in aggressive behaviors.
- https://cdn.elifesciences.org/articles/88598/elife-88598-fig2-figsupp2-data1-v1.xlsx
Figure 3 with 1 supplement

pC1d-aIPg recurrent connectivity is not required for aIPg-induced persistent aggressive behavior.
Inhibition of pC1d by Kir2.1 expression did not suppress aIPg-induced persistent aggression. Aggression (head butting + shoving, red ticks) is shown in the raster plot. Flies were freely interacting throughout the experiments, and data were combined from two independent biological repeats. The differences between Control>Kir2.1 and pC1d>Kir2.1 groups in the separate 13-second and 15-second stimulation periods were not significant (13-second period, p=0.2978; 15 seconds, p=0.6650). Additional information on genotypes used is provided in Supplementary file 1 and see Figure 3—figure supplement 1 for quantification. Control, empty split-Gal4 driver (BDP-AD; BDP-DBD).
Figure 3—figure supplement 1

Inhibition of pC1d activity does not alter aIPg-induced aggressive behavior.
Blocking pC1d activity by Kir2.1 expression did not significantly change persistent behavior induced by aIPg activation. Fraction of time spent performing aggressive behaviors as shown in raster plots in Figure 3. Flies were freely interacting throughout the experiments, and the data were combined from two independent biological repeats. The differences between Control>Kir2.1 and pC1d>Kir2.1 groups in the separate 13-second and 15-second stimulation periods were not significant (13-second period, p=0.2978; 15-second period, p=0.6650). ns, not significant. Additional information on genotypes used and statistics performed is provided in Supplementary files 1 and 2. Control, empty split-Gal4 driver (BDP-AD; BDP-DBD).
-
Figure 3—figure supplement 1—source data 1
Source data for Figure 3—figure supplement 1 graph on time spent performing aggressive behaviors.
- https://cdn.elifesciences.org/articles/88598/elife-88598-fig3-figsupp1-data1-v1.xlsx
Figure 4 with 1 supplement
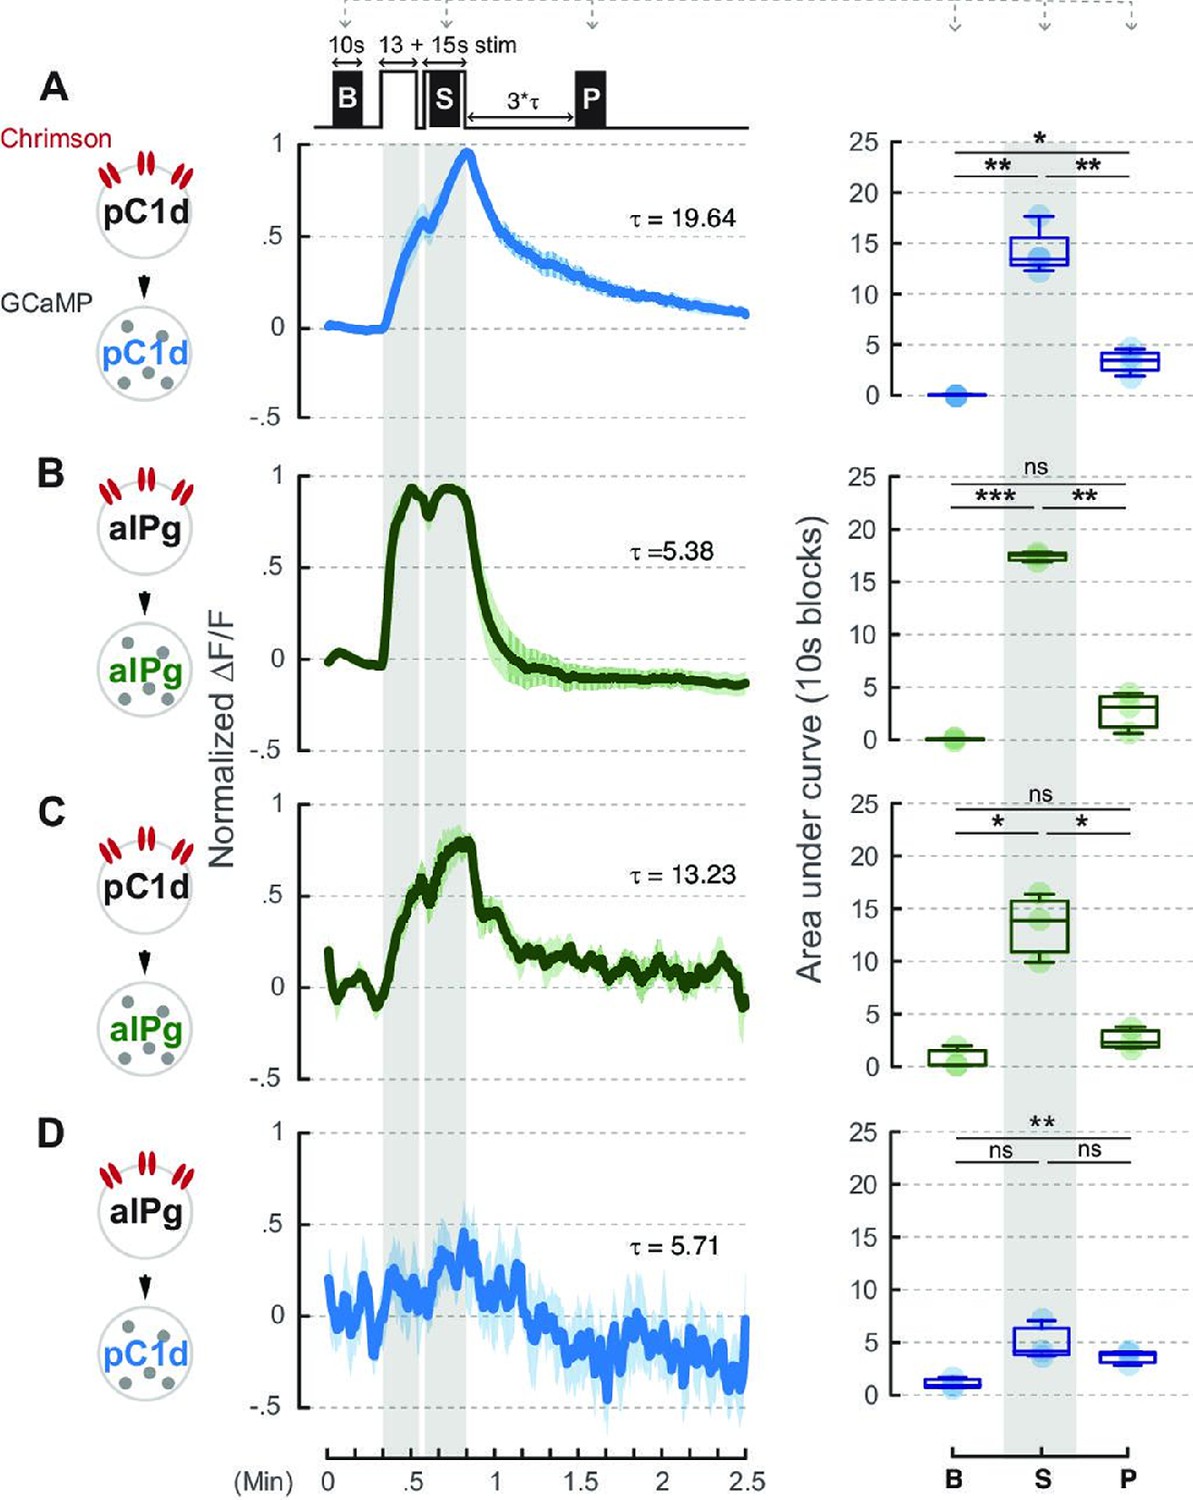
Neural activity of aIPg neurons is not prolonged by pC1d-aIPg or aIPg-aIPg recurrent connectivity.
A brief 660 nm stimulation that mimics the one used in the behavioral experiment was applied to activate the Chrimson-expressing neurons: pC1d (A or C) and aIPg (B or D). GCaMP responses of pC1d (A or D) or aIPg (B or C) neurons are shown by the blue and green traces, respectively. Dark blue/green line, mean. Light blue/green line, SEM. Tau of GCaMP signals in pC1d neurons is 19.64 seconds and 5.71 seconds when pC1d or aIPg neurons were stimulated, respectively. Tau of GCaMP signals in aIPg neurons is 5.38 seconds and 13.23 seconds when aIPg or pC1d neurons were stimulated, respectively. Area under the GCaMP trace during the 10-second blocks in the baseline (B), stimulation (S), and post-stimulation (P; measured at three times Tau after stimulation) period was compared in the box plots shown at right of panel. The difference between B and P in (D) was not significant after multiple comparisons correction. Data were combined from three to four independent biological repeats. Additional information on genotypes used and statistics performed is provided in Supplementary files 1 and 2. Light blue/green circle, individual data. ***p<0.001; **p<0.01; *p<0.05; ns, not significant.
-
Figure 4—source data 1
Source data for the area under the GCaMP trace during the 10-second block periods described in Figure 4.
- https://cdn.elifesciences.org/articles/88598/elife-88598-fig4-data1-v1.xlsx
Figure 4—figure supplement 1
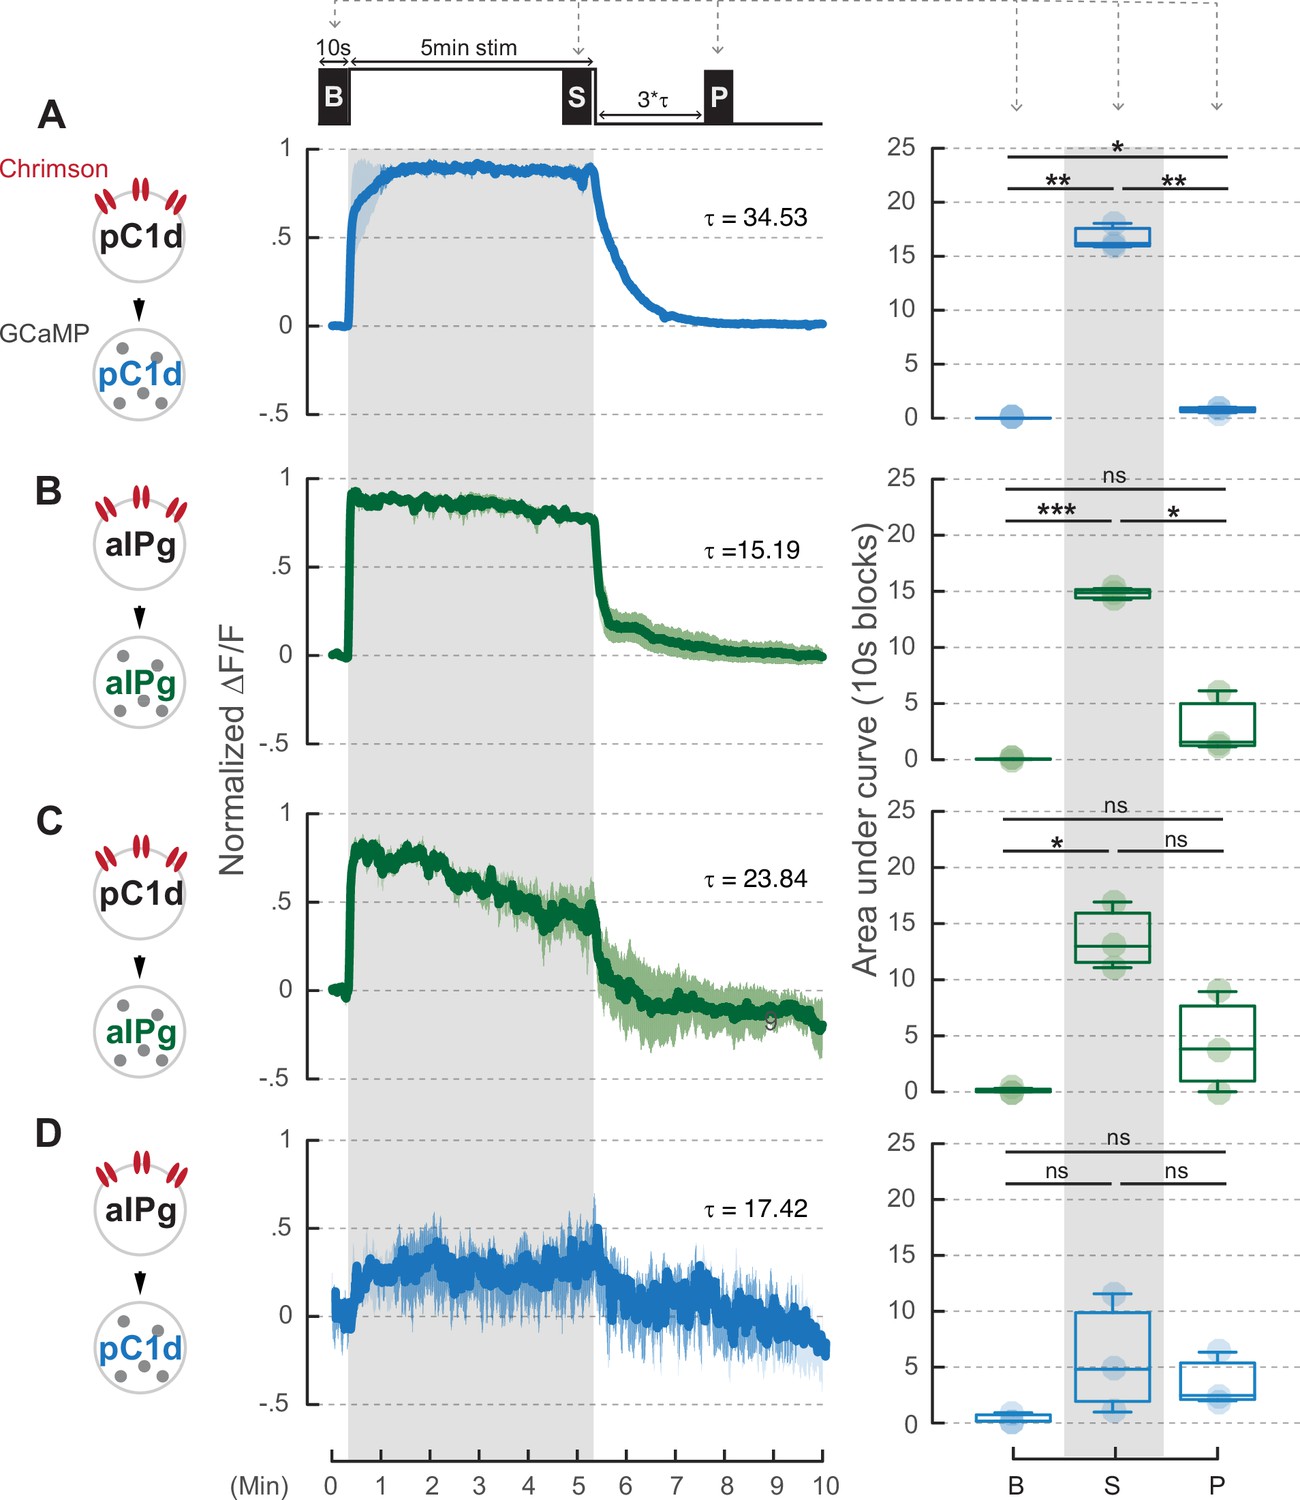
A 5-minute stimulation of pC1d neurons does not induce prolonged activity in aIPg neurons.
pC1d (A or C) or aIPg (B or D) neurons were activated for 5 minutes. The blue and green traces showed the GCaMP signals in either pC1d or aIPg neurons, respectively. Dark blue/green line, mean. Light blue/green line, SEM. Area under the GCaMP trace during the 10-second blocks in the baseline (B), stimulation (S), and post-stimulation (P; three times Tau after stimulation) period was compared in the box plots. Data were combined from three to four independent biological repeats. Additional information on genotypes used and statistics performed is provided in Supplementary files 1 and 2. Light blue/green circle, individual data. ***p<0.001; **p<0.01; *p<0.05; ns, not significant.
-
Figure 4—figure supplement 1—source data 1
Source data for the area under the GCaMP trace during the 10-second block periods described in Figure 4—figure supplement 1.
- https://cdn.elifesciences.org/articles/88598/elife-88598-fig4-figsupp1-data1-v1.xlsx
Tables
Key resources table
| Reagent type (species) or resource | Designation | Source or reference | Identifiers | Additional information |
|---|---|---|---|---|
| Genetic reagent (D. melanogaster) | w1118;;20XUAS-CsChrimson-mVenus (attP2) | Klapoetke et al., 2014; Aso et al., 2014 | UAS-CsChrimson | BDSC: 55136 |
| Genetic reagent (D. melanogaster) | w1118;; 20xUAS-Chrimson::tdT3.1(vk5) | Chiu et al., 2021; Rubin lab | UAS-Chrimson | |
| Genetic reagent (D. melanogaster) | w1118; 20xUAS-Chrimson::tdT3.1(su(Hw)attp5) | Watanabe et al., 2017; Rubin lab | UAS-Chrimson | |
| Genetic reagent (D. melanogaster) | w1118; 13xLexAop2-CsChrimson::tdT3.1(su(Hw)attp5) | Chiu et al., 2021; Rubin lab | LexAop-Chrimson | |
| Genetic reagent (D. melanogaster) | w1118;; 13xLexAop2-CsChrimson::TdT3.1(vk5) | Chiu et al., 2021; Rubin lab | LexAop-Chrimson | |
| Genetic reagent (D. melanogaster) | w1118;; 10xUAS-eGFP::Kir2.1(attP2) | Chiu et al., 2021; Rubin lab | UAS-Kir | |
| Genetic reagent (D. melanogaster) | w1118; 20xUAS-opGCaMP6s(su(Hw)attp5) | Chen et al., 2013 | UAS-GCaMP6s | |
| Genetic reagent (D. melanogaster) | w1118;; 13xLexAop2-jGCaMP7b(vk5) | Dana et al., 2019 | LexAop-GCaMP7b | |
| Genetic reagent (D. melanogaster) | w1118; BPp65ADZp (attP40); BPZpGAL4DBD (attP2) | Hampel et al., 2017 | Control (Empty-SS) | |
| Genetic reagent (D. melanogaster) | w1118; VT064565-p65ADZp (attP40); VT043699-ZpGAL4DBD (attP2) | Schretter et al., 2020 | aIPg (SS36564) | Available via https://janelia.org/split-GAL4. |
| Genetic reagent (D. melanogaster) | w1118; 35C10-p65ADZp (JK73A), 71A09-ZpGdbd (attP2) | Schretter et al., 2020 | pC1d (SS56987) | Available via https://janelia.org/split-GAL4. |
| Genetic reagent (D. melanogaster) | w1118; VT25602-p65ADZp(attP40); VT002064-ZpGal4DBD(attP2) | Schretter et al., 2020 | pC1d+e(SS43274) | Available via https://janelia.org/split-GAL4. |
| Genetic reagent (D. melanogaster) | w1118; 72C11-LexA (attP40) | Jenett et al., 2012 | aIPg-LexA | Available via https://flweb.janelia.org. |
Table 1
Head butting and shoving JAABA classifier.
| Classifier | True positive | True negative | False positive | False negative |
|---|---|---|---|---|
| Head butting + shoving | 80% (204) | 83.3% (1957) | 20% (51) | 16.7% (392) |
Additional files
-
MDAR checklist
- https://cdn.elifesciences.org/articles/88598/elife-88598-mdarchecklist1-v1.docx
-
Supplementary file 1
Genotype of flies used in each experiment.
- https://cdn.elifesciences.org/articles/88598/elife-88598-supp1-v1.xlsx
-
Supplementary file 2
Sample size and statistics for figures.
- https://cdn.elifesciences.org/articles/88598/elife-88598-supp2-v1.docx
Download links
A two-part list of links to download the article, or parts of the article, in various formats.
Downloads (link to download the article as PDF)
Open citations (links to open the citations from this article in various online reference manager services)
Cite this article (links to download the citations from this article in formats compatible with various reference manager tools)
Cell type-specific contributions to a persistent aggressive internal state in female Drosophila
eLife 12:RP88598.
https://doi.org/10.7554/eLife.88598.3


