Single-cell transcriptome analysis of cavernous tissues reveals the key roles of pericytes in diabetic erectile dysfunction
- School of Life Sciences, Gwangju Institute of Science and Technology (GIST), Republic of Korea
- National Research Center for Sexual Medicine and Department of Urolog, Inha University School of Medicine, Republic of Korea
- Program in Biomedical Science & Engineering, Inha University, Republic of Korea
Figures
Figure 1 with 4 supplements
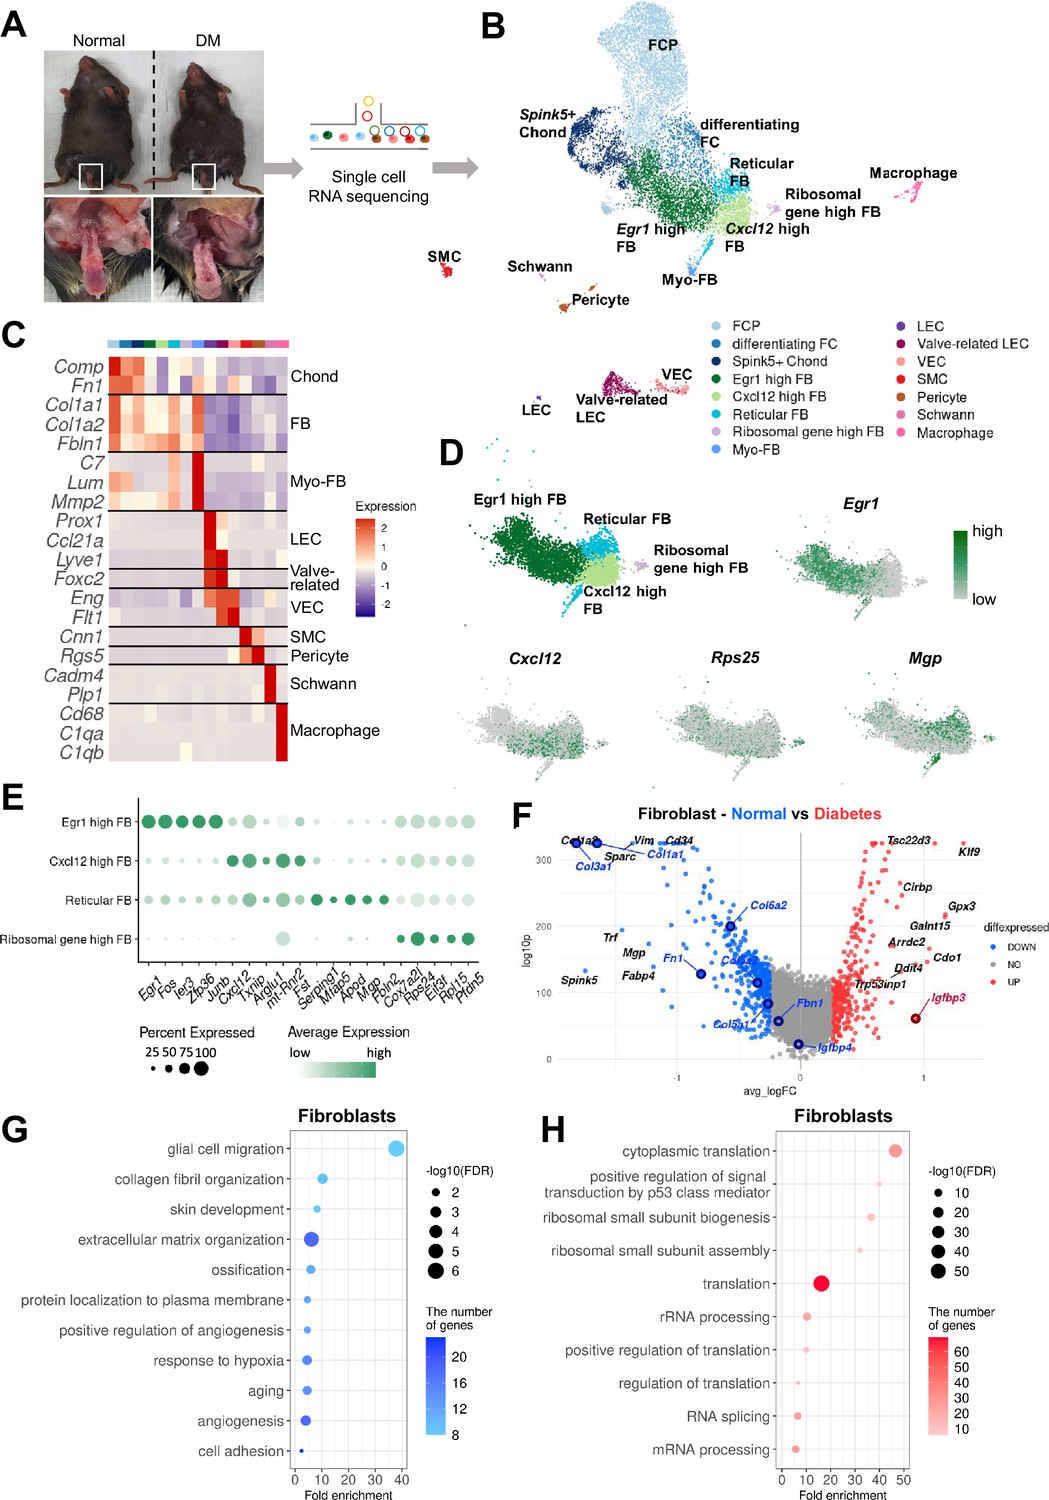
Single-cell transcriptional landscape of mouse cavernous tissues in normal and diabetic conditions.
(A) Schematic workflow of this study. Cavernous tissues from 16-week-old male mice were used for single-cell RNA sequencing (n=5 for each group). DM, diabetes mellitus. (B) Visualization of single-cell data from mouse cavernous tissues using Uniform Manifold Approximation and Projection (UMAP). Each cell type is indicated by a different color. FCP, fibrochondrocyte progenitors; FC, fibrochondrocytes; Chonds, chondrocytes; FBs, fibroblasts; MFBs, myofibroblasts; LEC, lymphatic endothelial cells; VEC, vascular endothelial cells; SMCs, smooth muscle cells. (C) Heatmap of known cell-type marker genes used for annotation. (D) UMAP of four fibroblast clusters and expression of marker genes of four fibroblast subsets. Egr1 for Egr1 high FB; Cxcl12 for Cxcl12 high FB; Mgp for reticular FB; Rps25 and Rps17 for ribosomal gene high FB. (E) Dot plot showing the expression of top five marker genes of each fibroblast subset. (F) Differentially expressed genes (DEGs) between diabetic and normal conditions in fibroblasts. The top 10 (based on log-fold change) DEGs are indicated with gene names, and genes identified as having high or low expression in diabetes in previous studies are indicated with gene names in red or blue. DEGs with adjusted p-value>0.05 were indicated in gray. (G) Gene ontology analysis of the DEGs higher in normal compared to diabetes in fibroblasts. (H) Gene ontology analysis of the DEGs higher in diabetes compared to normal in fibroblasts.
Figure 1—figure supplement 1
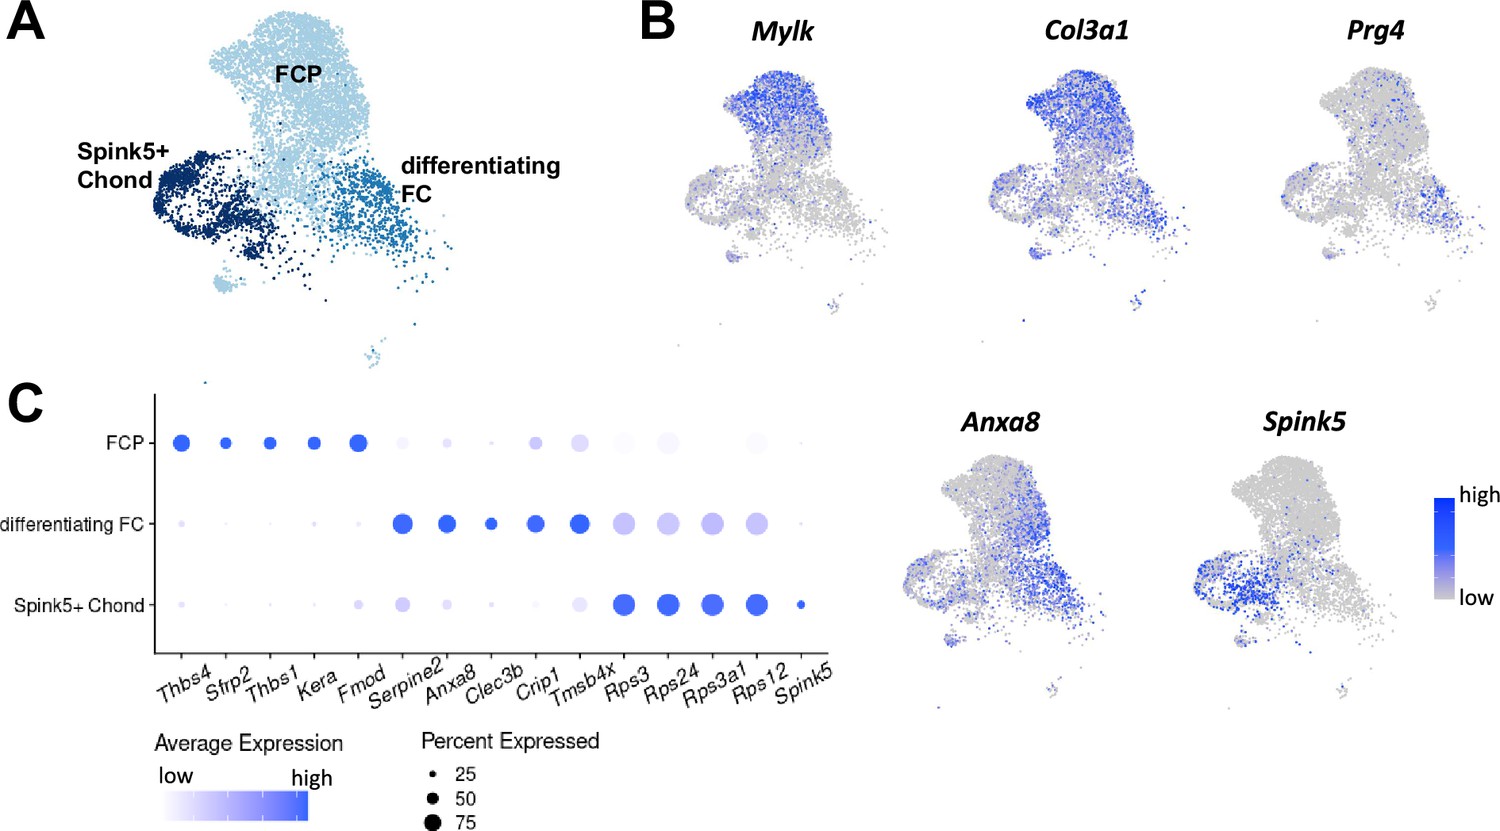
Chondrocyte subsets in single-cell RNA sequencing data of mouse cavernous tissues.
(A) Uniform Manifold Approximation and Projection (UMAP) of three chondrocyte clusters in single-cell data of mouse cavernous tissues. (B) Expression of marker genes of three chondrocyte subsets. Mylk and Col3a1 for FCP; Prg4 and Anxa8 for differentiating FC; Spink5 for Spink5+ Chond. (C) Dot plot showing the expression of top five marker genes of each chondrocyte subset. The color represents the average expression level, and the size of the dots represents the percentage of cells expressing each gene.
Figure 1—figure supplement 2
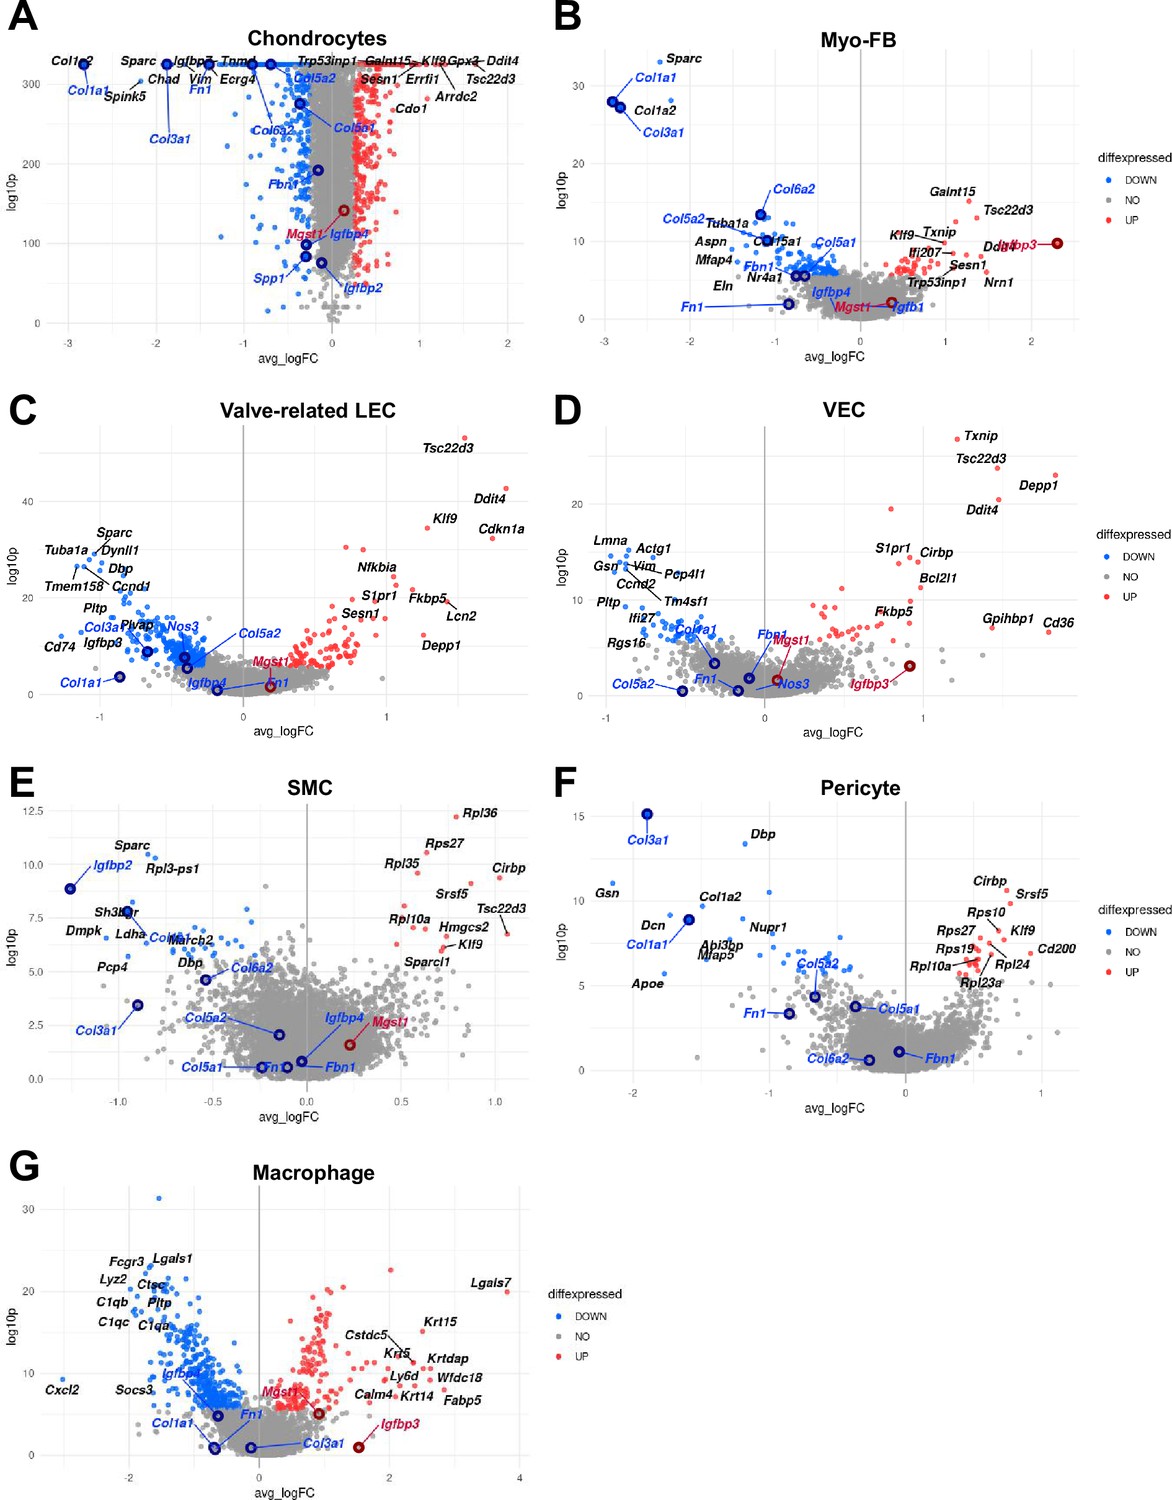
Volcano plots showing differentially expressed genes (DEGs) between diabetic and normal conditions in each cell type.
(A) DEGs between diabetic and normal conditions in chondrocytes. (B) DEGs between diabetic and normal conditions in myofibroblast (MFB). (C) DEGs between diabetic and normal conditions in valve-related lymphatic endothelial cells (LEC). (D) DEGs between diabetic and normal conditions in vascular endothelial cells (VEC). (E) DEGs between diabetic and normal conditions in smooth muscle cell (SMC). (F) DEGs between diabetic and normal conditions in pericyte. (G) DEGs between diabetic and normal conditions in macrophage. The top 10 (based on log-fold change) DEGs are indicated with gene names, and genes identified as having high or low expression in diabetes in previous studies are indicated with gene names in red or blue. DEGs with adjusted p-value>0.05 were indicated in gray. The LEC was not shown as a volcano plot because there were only two significant DEGs, and Schwann cells have no significant DEG (adjusted p-value<0.05).
Figure 1—figure supplement 3
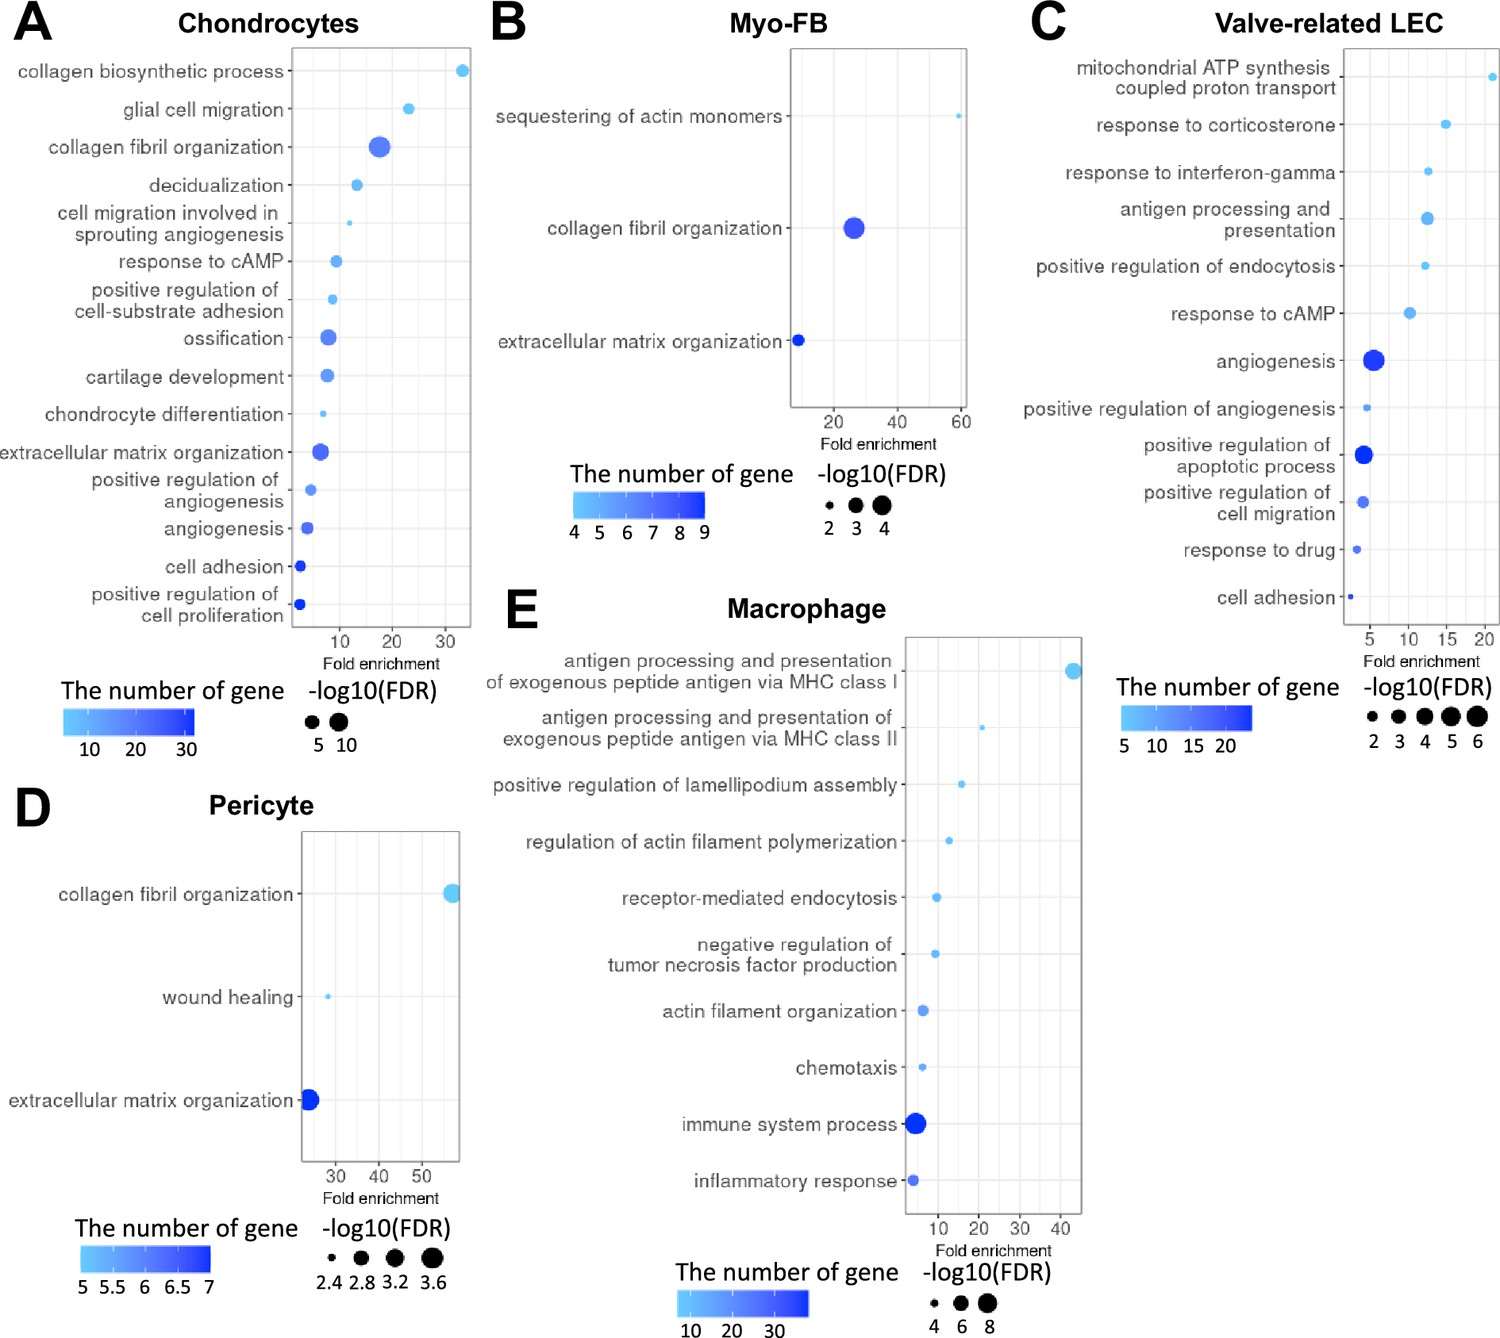
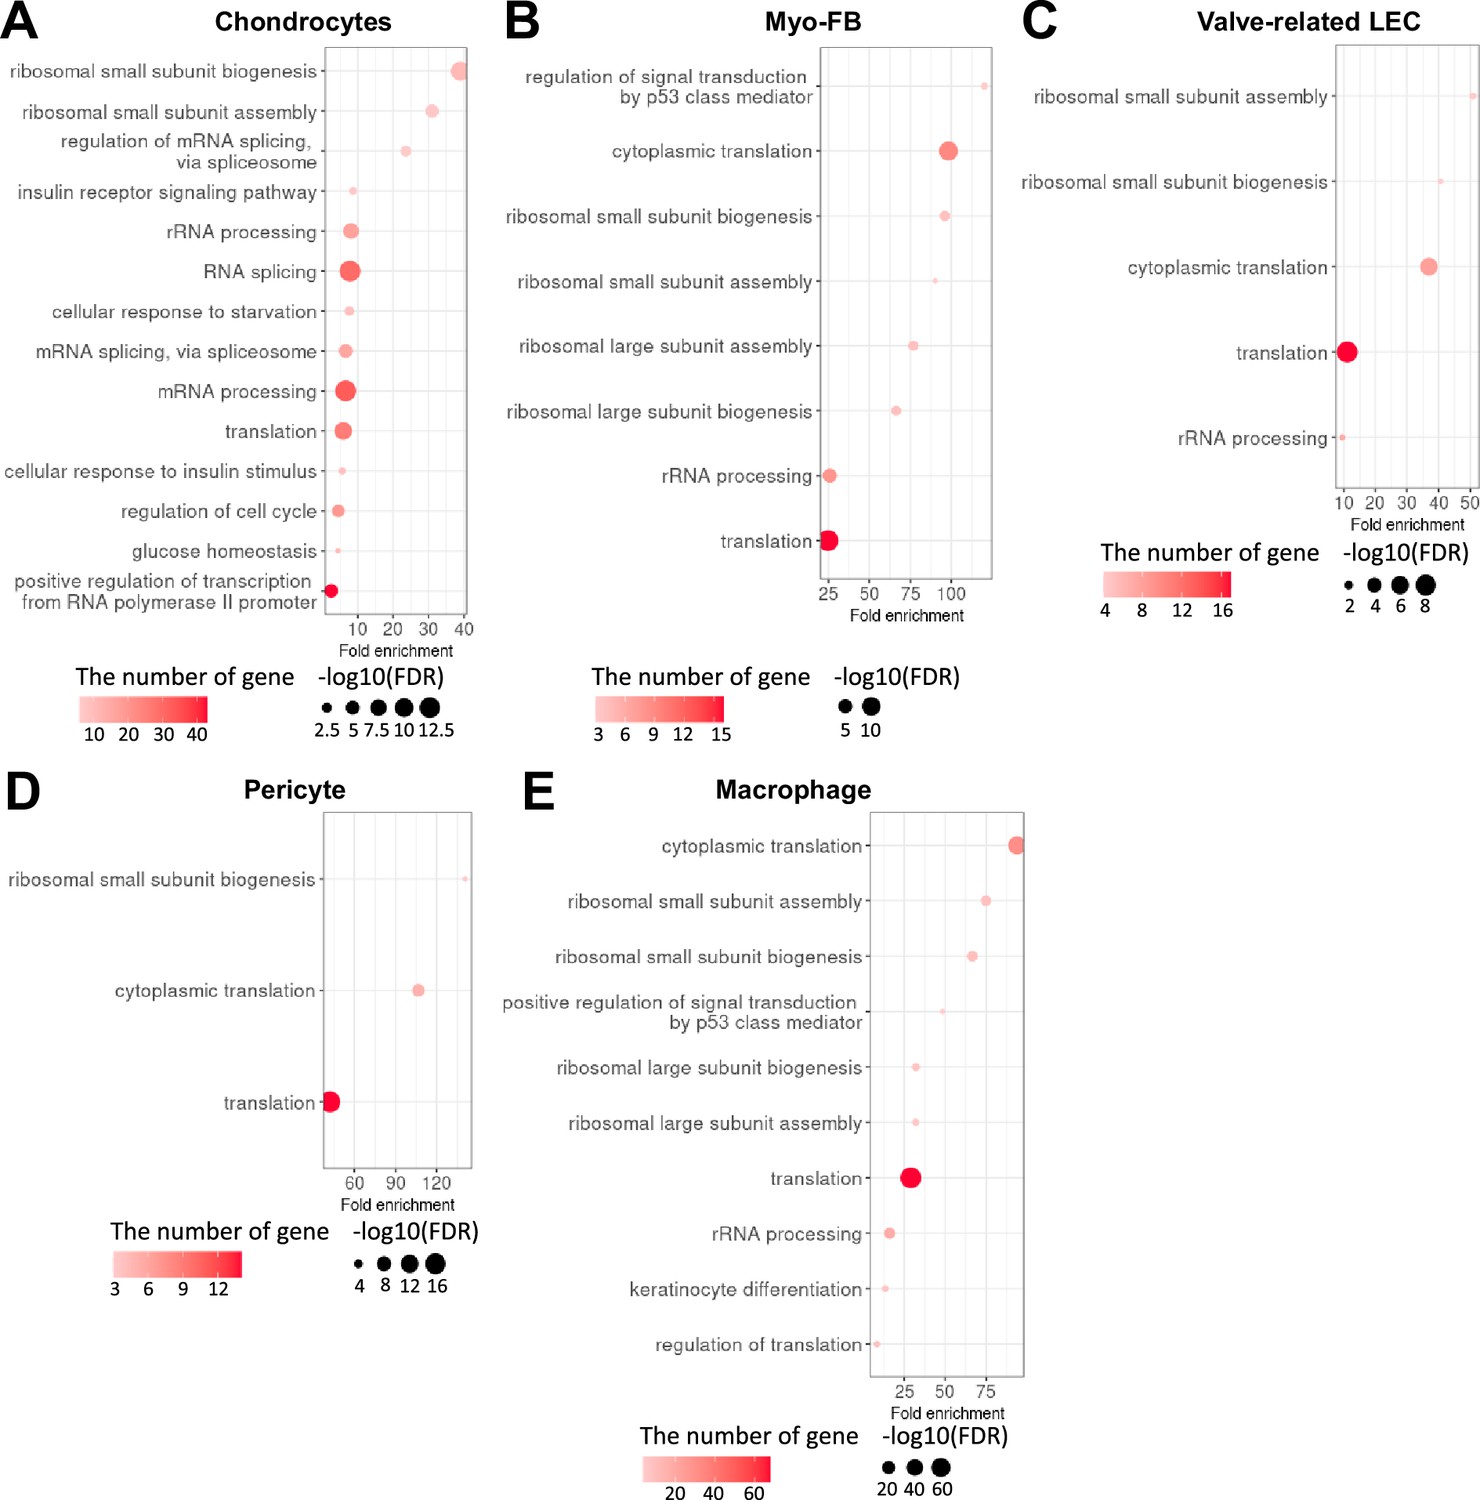
Gene ontology high in normal compared to diabetes in each cell type.
(A) Gene ontology analysis of the genes higher in normal compared to diabetes in chondrocytes. (B) Gene ontology analysis of the genes higher in normal compared to diabetes in myofibroblast (MFB). (C) Gene ontology analysis of the genes higher in normal compared to diabetes in valve-related lymphatic endothelial cells (LEC). (D) Gene ontology analysis of the genes higher in normal compared to diabetes in pericyte. (E) Gene ontology analysis of the genes higher in normal compared to diabetes in macrophage. There was no significant term in LEC, vascular endothelial cells (VEC), smooth muscle cells (SMCs), and Schwann cells (p-value<0.05 and false discovery rate [FDR]<0.25).
Figure 1—figure supplement 4
Gene ontology high in diabetes compared to normal in each cell type.
(A) Gene ontology analysis of the genes higher in diabetes compared to normal in chondrocytes. (B) Gene ontology analysis of the genes higher in diabetes compared to normal in myofibroblast (MFB). (C) Gene ontology analysis of the genes higher in diabetes compared to normal in valve-related lymphatic endothelial cells (LEC). (D) Gene ontology analysis of the genes higher in diabetes compared to normal in pericyte. (E) Gene ontology analysis of the genes higher in diabetes compared to normal in macrophage. There were no significant terms in LEC and Schwann cells (p-value<0.05 and false discovery rate [FDR]<0.25), and only translation-related terms were identified in vascular endothelial cells (VEC) and smooth muscle cells (SMCs).
Figure 2 with 2 supplements
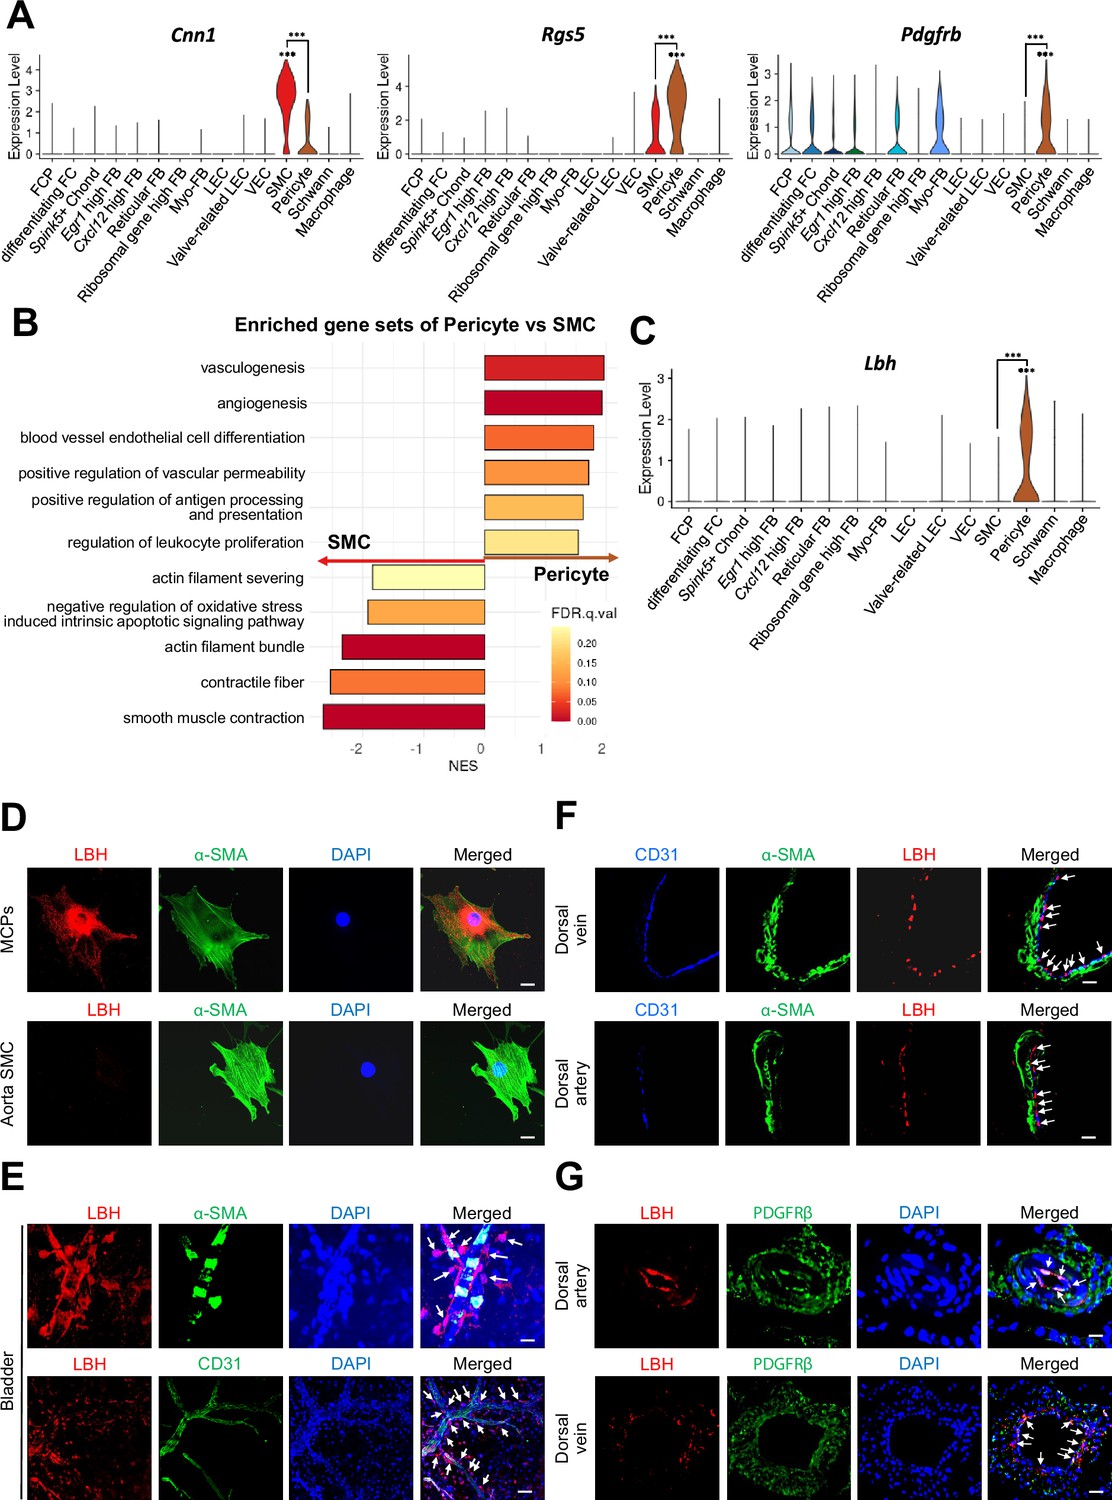
Identification of Lbh as a marker of pericytes.
(A) Expression of well-known marker genes of SMC and pericyte (Cnn1 for SMC, Rgs5 and Pdgfrb for pericyte). (B) Significantly enriched gene sets associated with function of SMC and pericyte. Gene sets with positive normalized enrichment score (NES) are enriched in pericyte, and negative values are enriched in SMC. (C) Violin plots showing expression of Lbh in each cell type. (D and E) LBH (red)/α-SMA (green) and LBH (red)/CD31 (green) staining in MCPs, aorta SMC, and bladder tissues. Nuclei were labeled with DAPI (blue). Scale bars, 25 µm (MCPs and aorta SMC), 50 µm (bladder top panel) and 100 µm (bladder bottom panel). (F and G) CD31 (blue)/α-SMA (green)/LBH (red) and LBH (red)/PDGFRβ (green) staining in mouse dorsal vein and dorsal artery tissues. Nuclei were labeled with DAPI (bottom panel, blue). Scale bars, 25 µm (dorsal artery) and 50 µm (dorsal vein). Arrows indicate the LBH expressed pericytes. MCPs, mouse cavernous pericytes; SMC, smooth muscle cell; DAPI, 4,6-diamidino-2-phenylindole. ***p<0.001 by DESeq2 test.
Figure 2—figure supplement 1
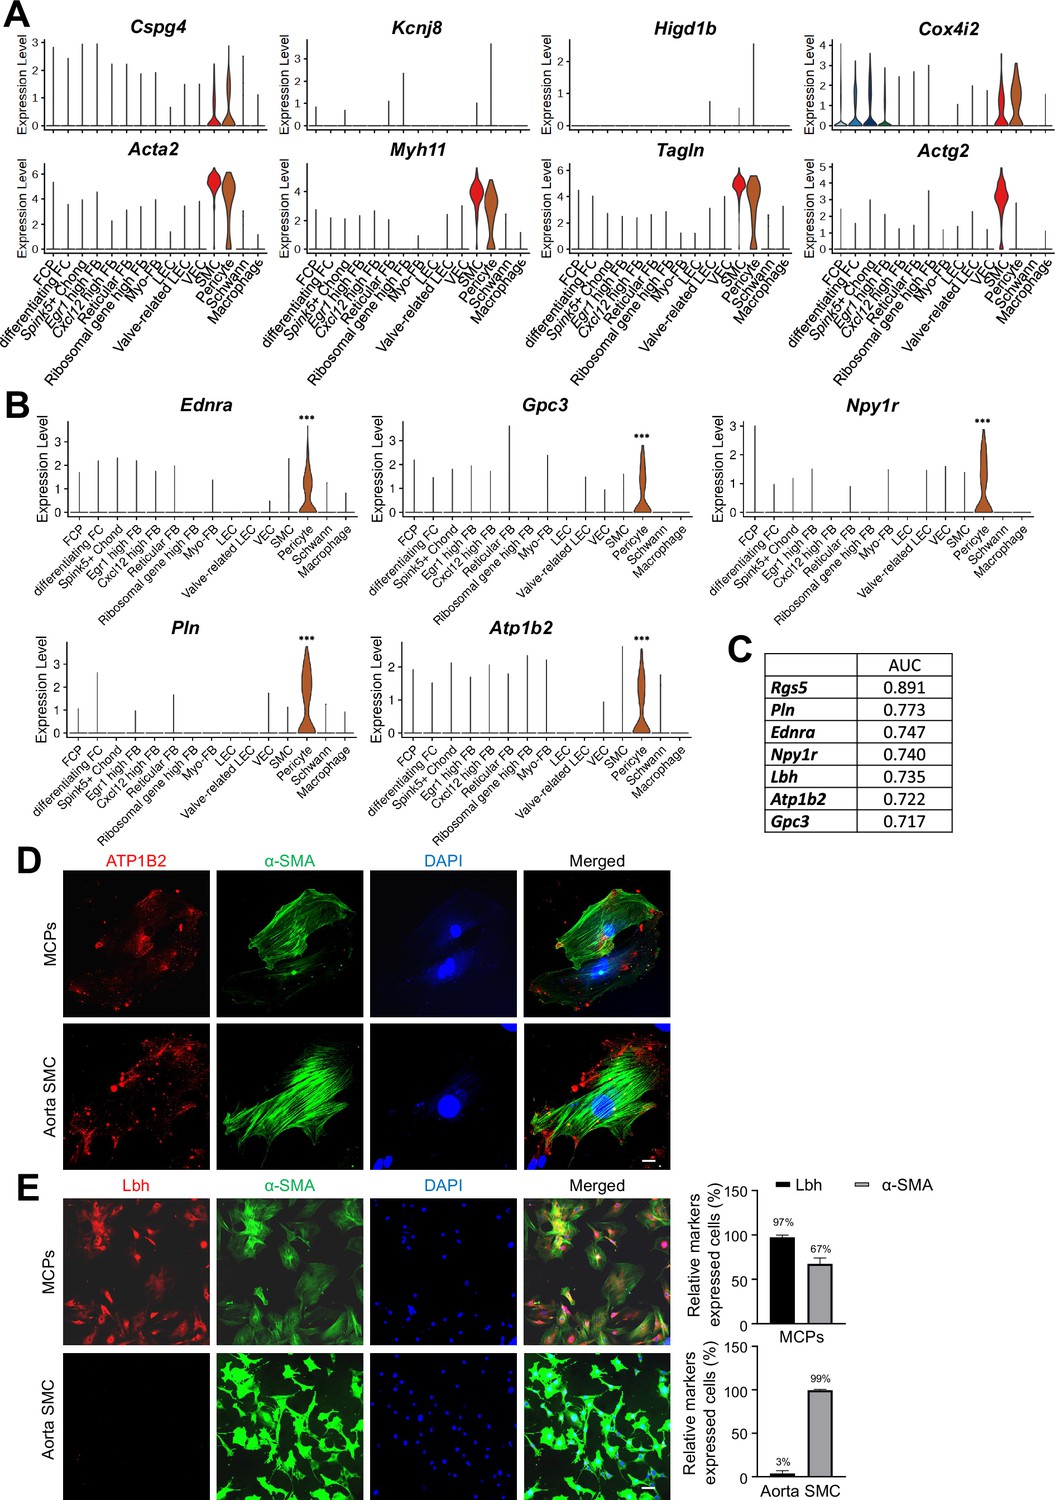
Pericyte-specifically expressed genes in single-cell RNA sequencing data.
(A) Violin plots showing the expression of known marker genes of pericyte (Cspg4, Kcnj8, Higd1b, Cox4i2) and SMC (Acta2, Myh11, Tagln, Actg2). (B) Violin plots showing the expression of Ednra, Gpc3, Npy1r, Pln, and Atp1b2 in each cell type of mouse cavernous tissues. (C) Area under the curve (AUC) scores of Rgs5, Lbh, Endra, Gpc3, Npylr, Pln, and Atplb2. (D) ATP1B2 (red)/α-SMA (green) staining in MCPs and aorta SMC. Scale bars, 25 µm. (E) LBH (red)/α-SMA (green) and LBH (red)/CD31(green) staining in MCPs, aorta SMC. Scale bars, 100 µm. The nuclei were stained with 4,6-diamidino-2-phenylindole (DAPI) (blue). Percentage of relative markers expressed cells. MCPs, mouse cavernous pericytes; SMCs, smooth muscle cells.
Figure 2—figure supplement 2
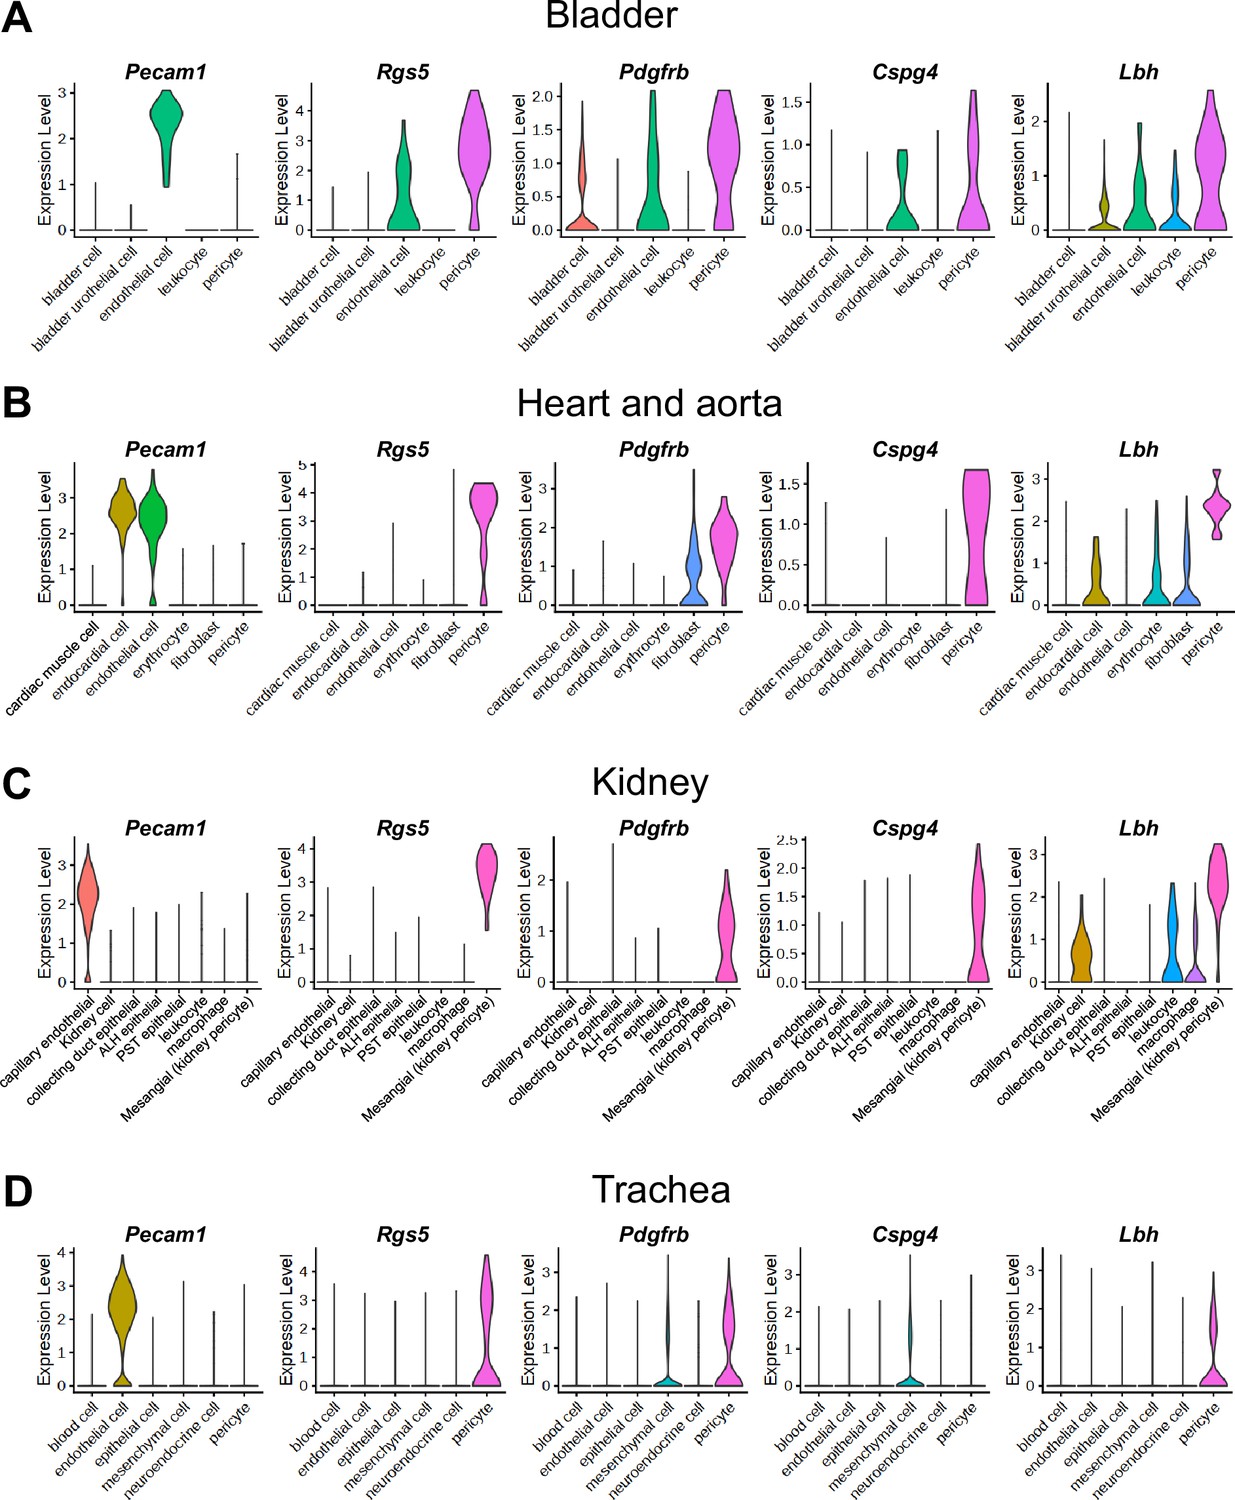
Expressions of Lbh in single-cell RNA sequencing data from tissues other than the penis.
ALH, ascending limb of loop of Henle; PST, proximal straight tubule. (A–D) Violin plots showing the expression of endothelial cell marker (Pecam1), known pericyte markers (Rgs5, Pdgfrb, Cspg4) and Lbh in mouse bladder (A), heart and aorta (B), kidney (C), trachea (D) from Tabula Muris.
Figure 3 with 3 supplements
Cell-cell interactions between pericytes and other cell types in normal and diabetes.
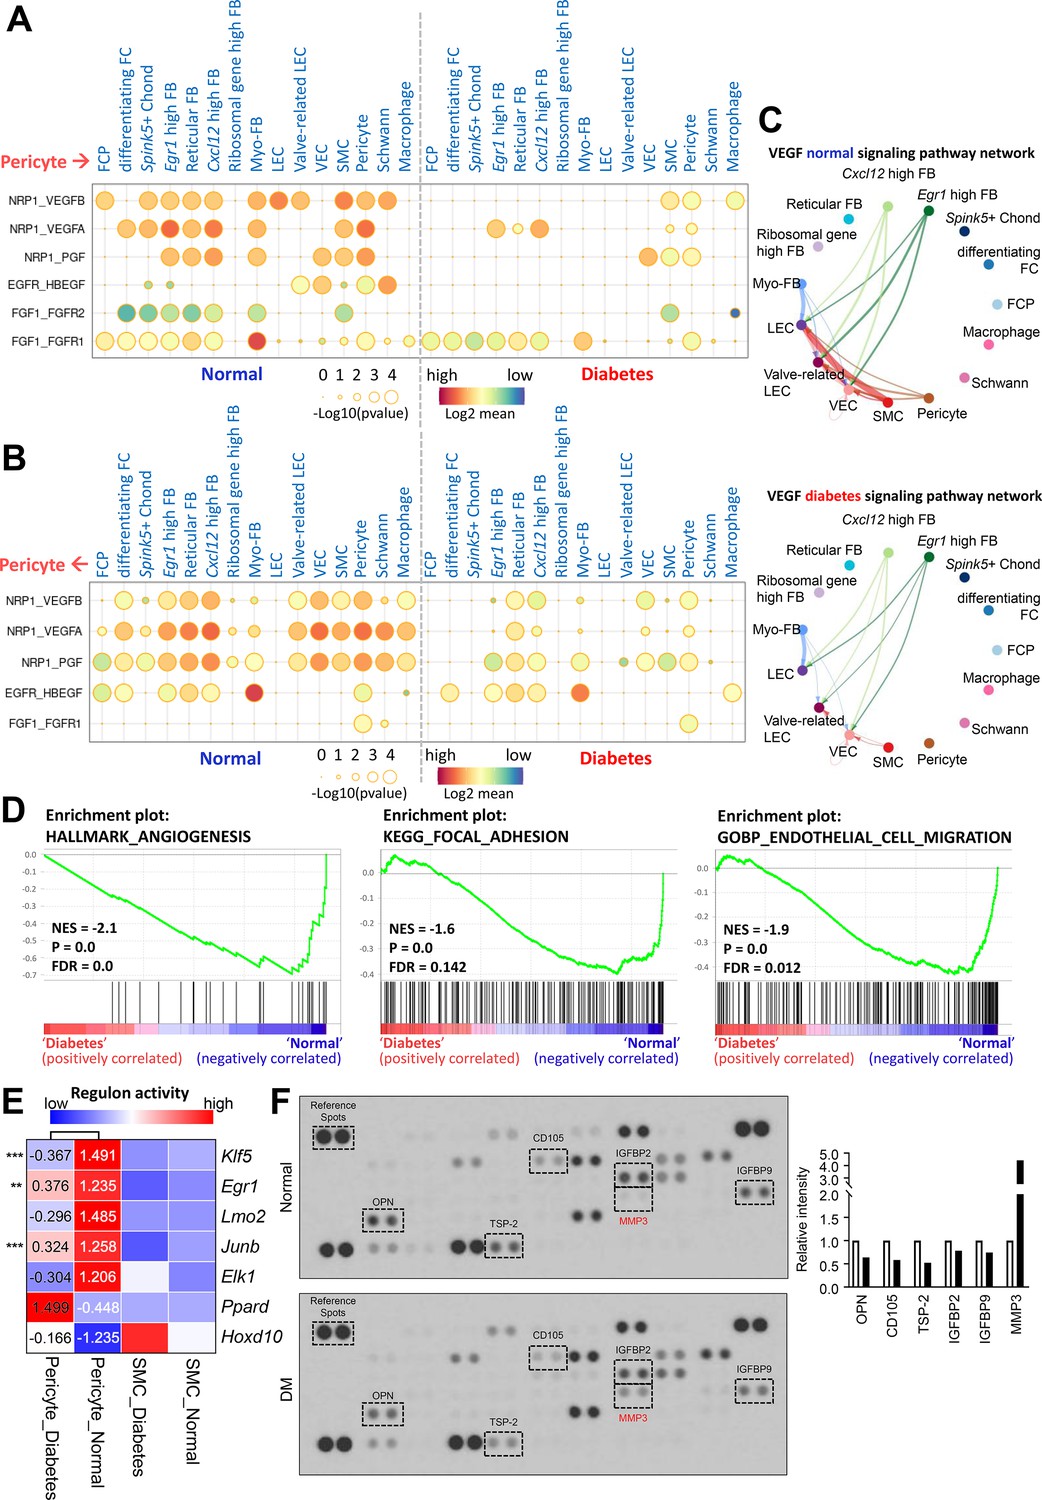
(A) CellPhoneDB dot plots showing angiogenesis-associated ligand-receptor interactions from pericytes to other cell types in normal and diabetic samples. p-Values are indicated as circle sizes. The means of the average expression level of the interaction are indicated by color. (B) CellPhoneDB dot plots showing angiogenesis-associated ligand-receptor interactions from other cell types to pericytes in normal and diabetic samples. p-Values are indicated as circle sizes. The means of the average expression level of the interaction are indicated by color. (C) The inferred vascular endothelial growth factor (VEGF) signaling pathway network in normal and diabetes using CellChat. The width of line represents the communication probability. The color of line matches the sender of the signal. (D) Gene set enrichment analysis (GSEA) plots showing the gene sets downregulated in diabetic pericytes compared to normal pericytes. (E) Heatmap showing the regulon activities of angiogenesis-related transcription factors in pericytes and smooth muscle cells (SMCs) in normal and diabetes. Scaled values of regulon activity scores are displayed on the heatmap. **p<0.01; ***p<0.001 by generalized linear model. (F) Proteome profiler mouse angiogenesis array analysis of mouse penis tissues from age-matched control and diabetic mice. The relative expression of each protein was determined by comparing the respective plots to the positive control (reference spot). The frame dot line indicates changed proteins between control and diabetic mice. Expression of the indicated proteins was quantified by assessing the intensity of the dot using ImageJ. DM, diabetes mellitus.
Figure 3—figure supplement 1
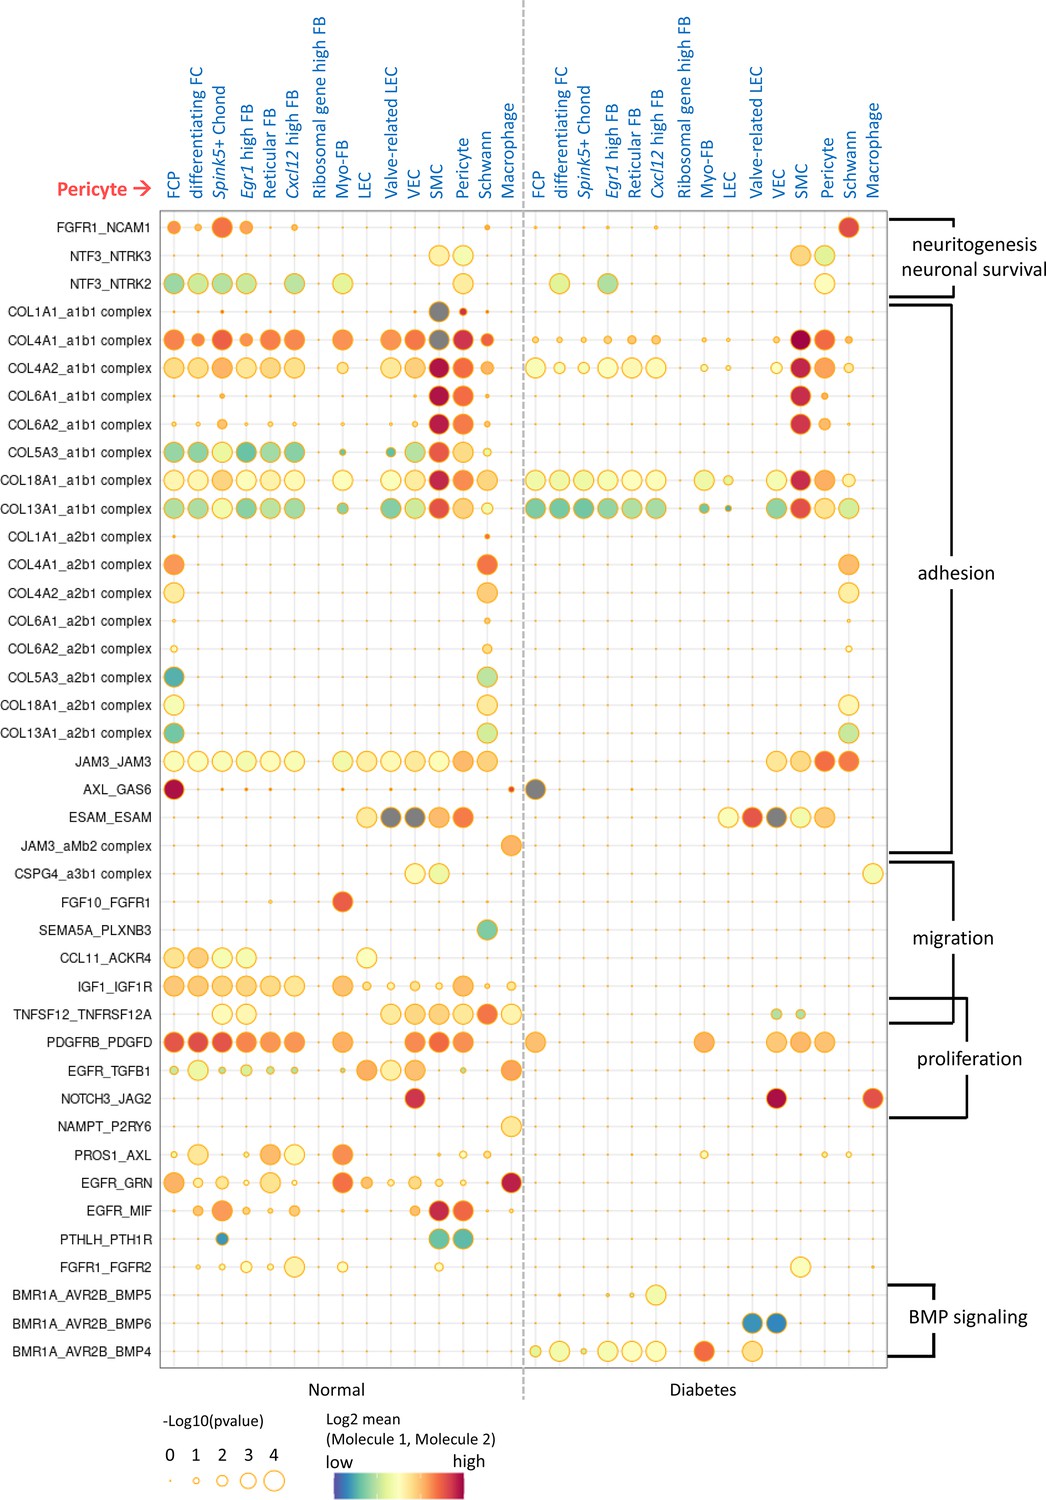
Cell-cell interactions between pericytes and other cell types showing significant differences between normal and diabetes.
CellPhoneDB dot plots showing ligand-receptor interactions between pericytes and other cell types in normal and diabetes. The plot shows all ligand-receptor interactions with significant differences between diabetes and normal. p-Values are indicated as circle sizes. The means of the average expression level of the interaction are indicated by color.
Figure 3—figure supplement 2
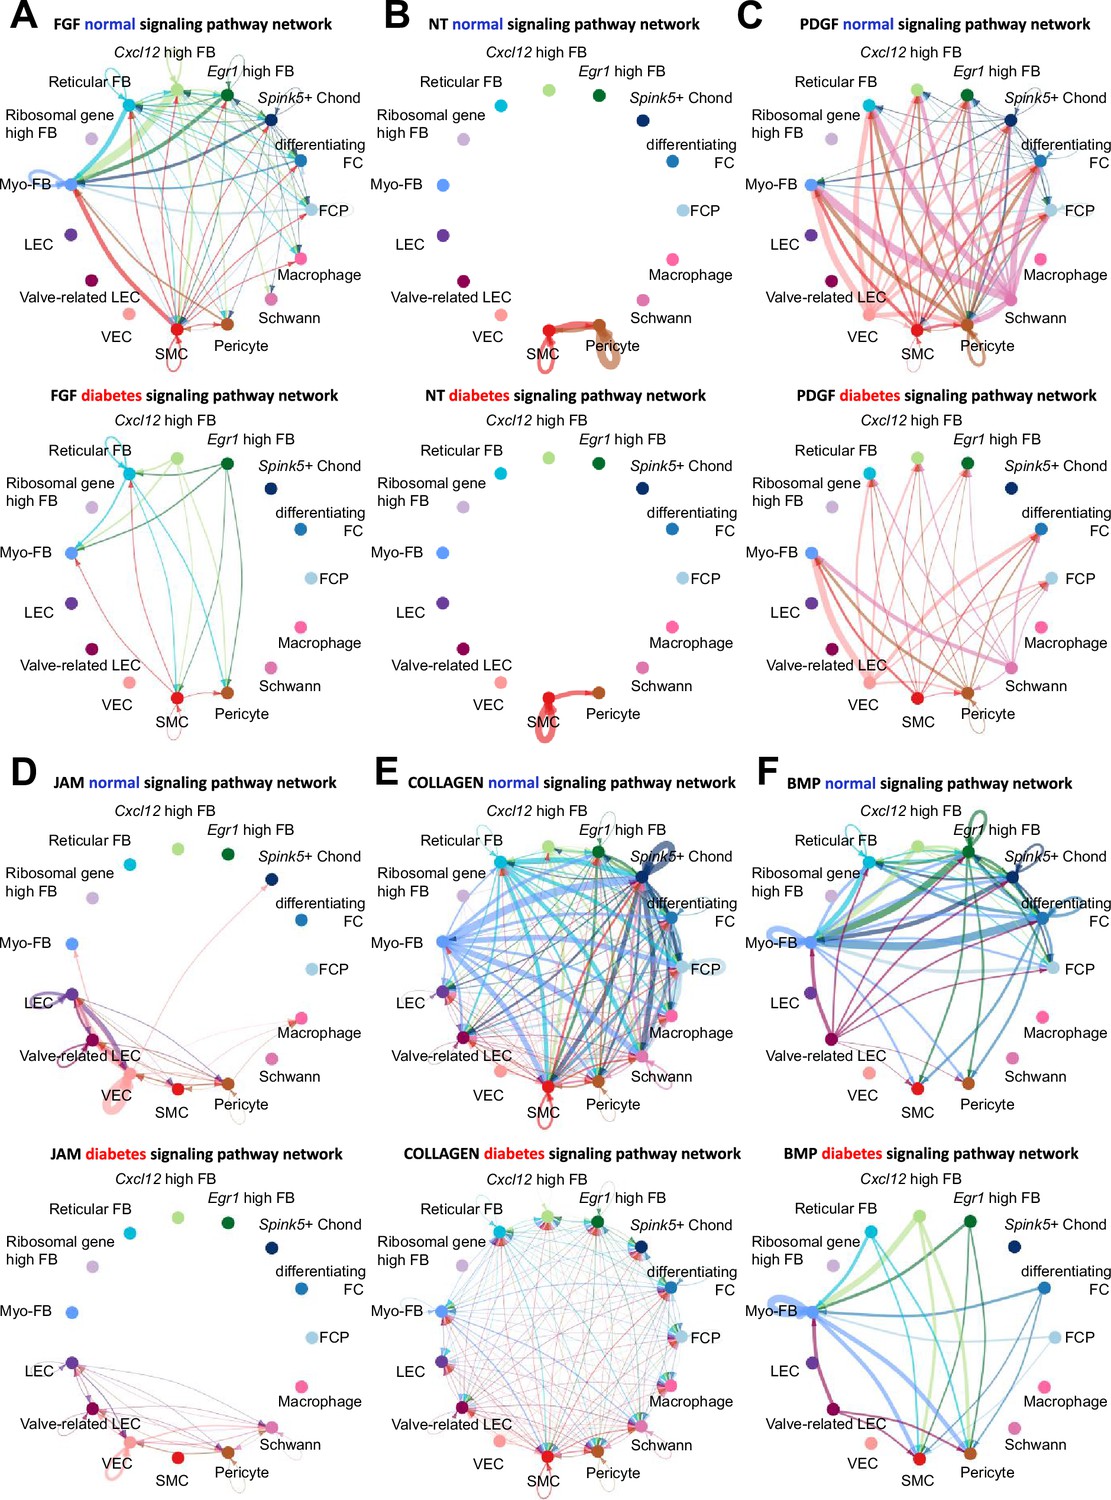
Cell-cell communication between cell types in normal and diabetes using CellChat.
(A) The inferred fibroblast growth factor (FGF) signaling network in normal and diabetes. (B) The inferred NT signaling network in normal and diabetes. (C) The inferred PDGF signaling network in normal and diabetes. (D) The inferred JAM signaling network in normal and diabetes. (E) The inferred COLLAGEN signaling network in normal and diabetes. (F) The inferred BMP signaling network in normal and diabetes. The width of line represents the communication probability. The color of line matches the sender of the signal.
Figure 3—figure supplement 3
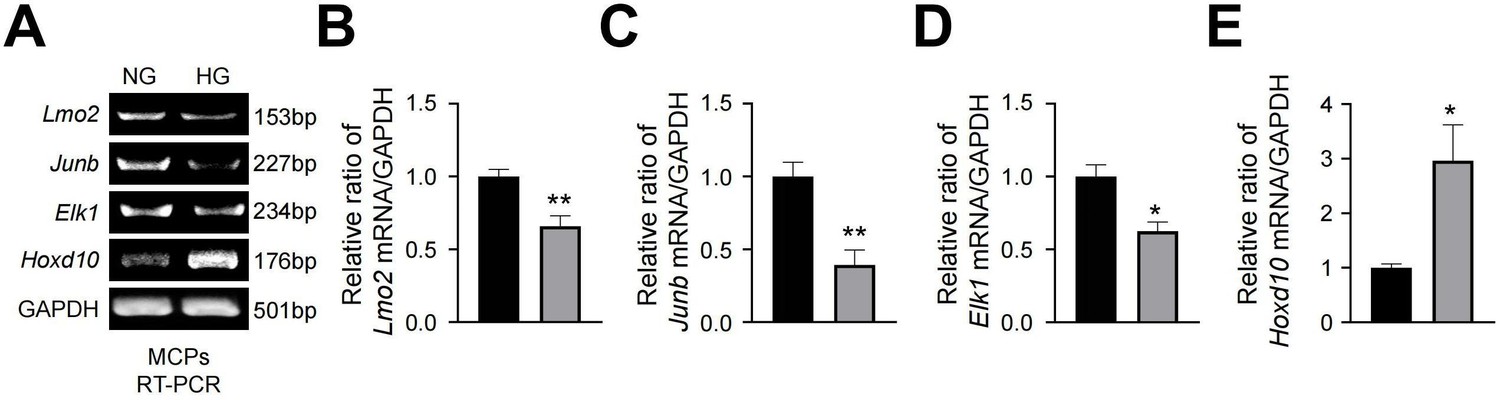
RT-PCR validation of differentially expressed genes from single-cell RNA sequencing analyses in MCPs exposed to NG or HG conditions for 72 hr.
(A) Representative RT-PCR for Lmo2, Junb, Elk1, Hoxd10 in MCPs. (B–E) Normalized band intensity values (n=4). *p<0.05 vs. NG group. The relative ratio of the NG group was arbitrarily set to 1. NG, normal glucose; HG, high glucose.
Figure 4 with 2 supplements
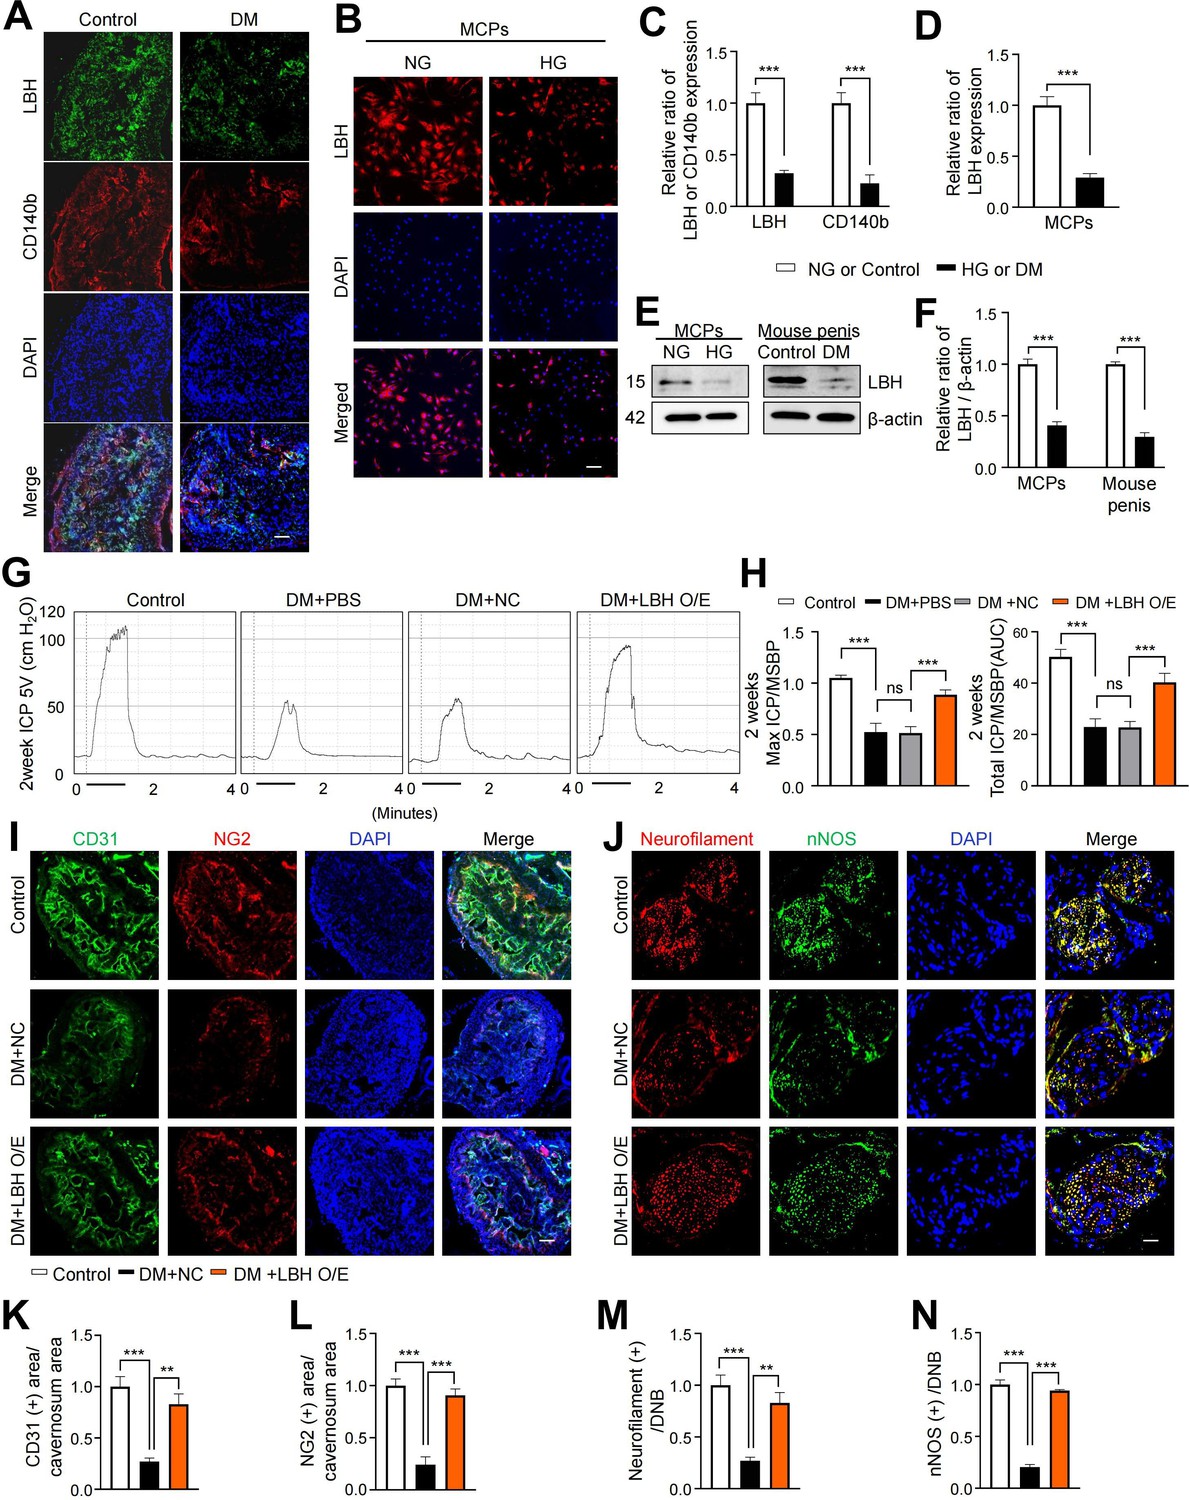
LBH improves erectile function under diabetic conditions through induction of neurovascular regeneration.
(A and B) Representative images of immunofluorescence staining of LBH (green)/CD140b (red) in cavernosum tissues and LBH (red) in MCPs under normal and diabetic conditions (in vivo and in vitro). Nuclei were labeled with DAPI (blue). Scale bar, 100 µm. (C and D) Quantification of LBH or CD140b expression in in vivo and in vitro by using ImageJ, and results are presented as means ± SEM (n=4). (E) Representative western blots for LBH of MCPs under NG and HG conditions, and mouse penis tissues from age-matched control and diabetic mice. (F) Normalized band intensity ratio of LBH to β-actin was quantified using ImageJ, and results are presented as means ± SEM (n=4). (G) Representative intracavernous pressure (ICP) responses for the age-matched control and diabetic mice stimulated at 2 weeks after intracavernous injections with PBS, lentiviruses ORF control particles (NC), and ORF clone of mouse Lbh (LBH O/E) (20 µL for PBS, 5×10⁴ IFU/mouse for lentiviral particles). The stimulus interval is indicated by a solid bar. (H) Ratios of mean maximal ICP and total ICP (area under the curve) versus MSBP were calculated for each group, and the results are presented as means ± SEM (n=5). (I and J) Cavernous CD31 (endothelial cell, red), NG2 (pericyte, green), neurofilament (red), and neuronal nitric oxide synthase (nNOS) (green) staining in cavernous tissues from age-matched control (C) and diabetic mice stimulated at 2 weeks after intracavernous injections with lentiviruses ORF control particles (NC) and ORF clone of mouse Lbh (LBH O/E). Scale bars, 100 µm (left), 25 µm (right). (K–N) Quantitative analysis of cavernous endothelial cell, pericyte, and neuronal cell content were quantified by ImageJ, and results are presented as means ± SEM (n=4). The relative ratio in the NG or control group was defined as 1. **p<0.01; ***p<0.001. DM, diabetes mellitus; PBS, phosphate-buffered saline; MCPs, mouse cavernous pericytes; NG, normal glucose; HG, high glucose; DAPI, 4,6-diamidino-2-phenylindole; MSBP, mean systolic blood pressure; ns, not significant.
Figure 4—figure supplement 1

LBH immunofluorescence staining in corpus cavernosum tissues after infection with lentiviruses containing ORF mouse clone of Lbh.
(A) Immunofluorescence staining of CD31 (green) and LBH (red) in corpus cavernosum tissues treated with lentiviruses ORF control particles (NC) and ORF clone of mouse Lbh (LBH O/E) in diabetic mice. Nuclei were labeled with DAPI (blue). Scale bars, 50 µm. (B) Quantification of LBH-positive area by ImageJ, and results are presented as means ± SEM (n=4). The relative ratio in the control group was defined as 1. *p<0.05; ***p<0.001. DM, diabetes mellitus; DAPI, 4,6-diamidino-2-phenylindole.
Figure 4—figure supplement 2
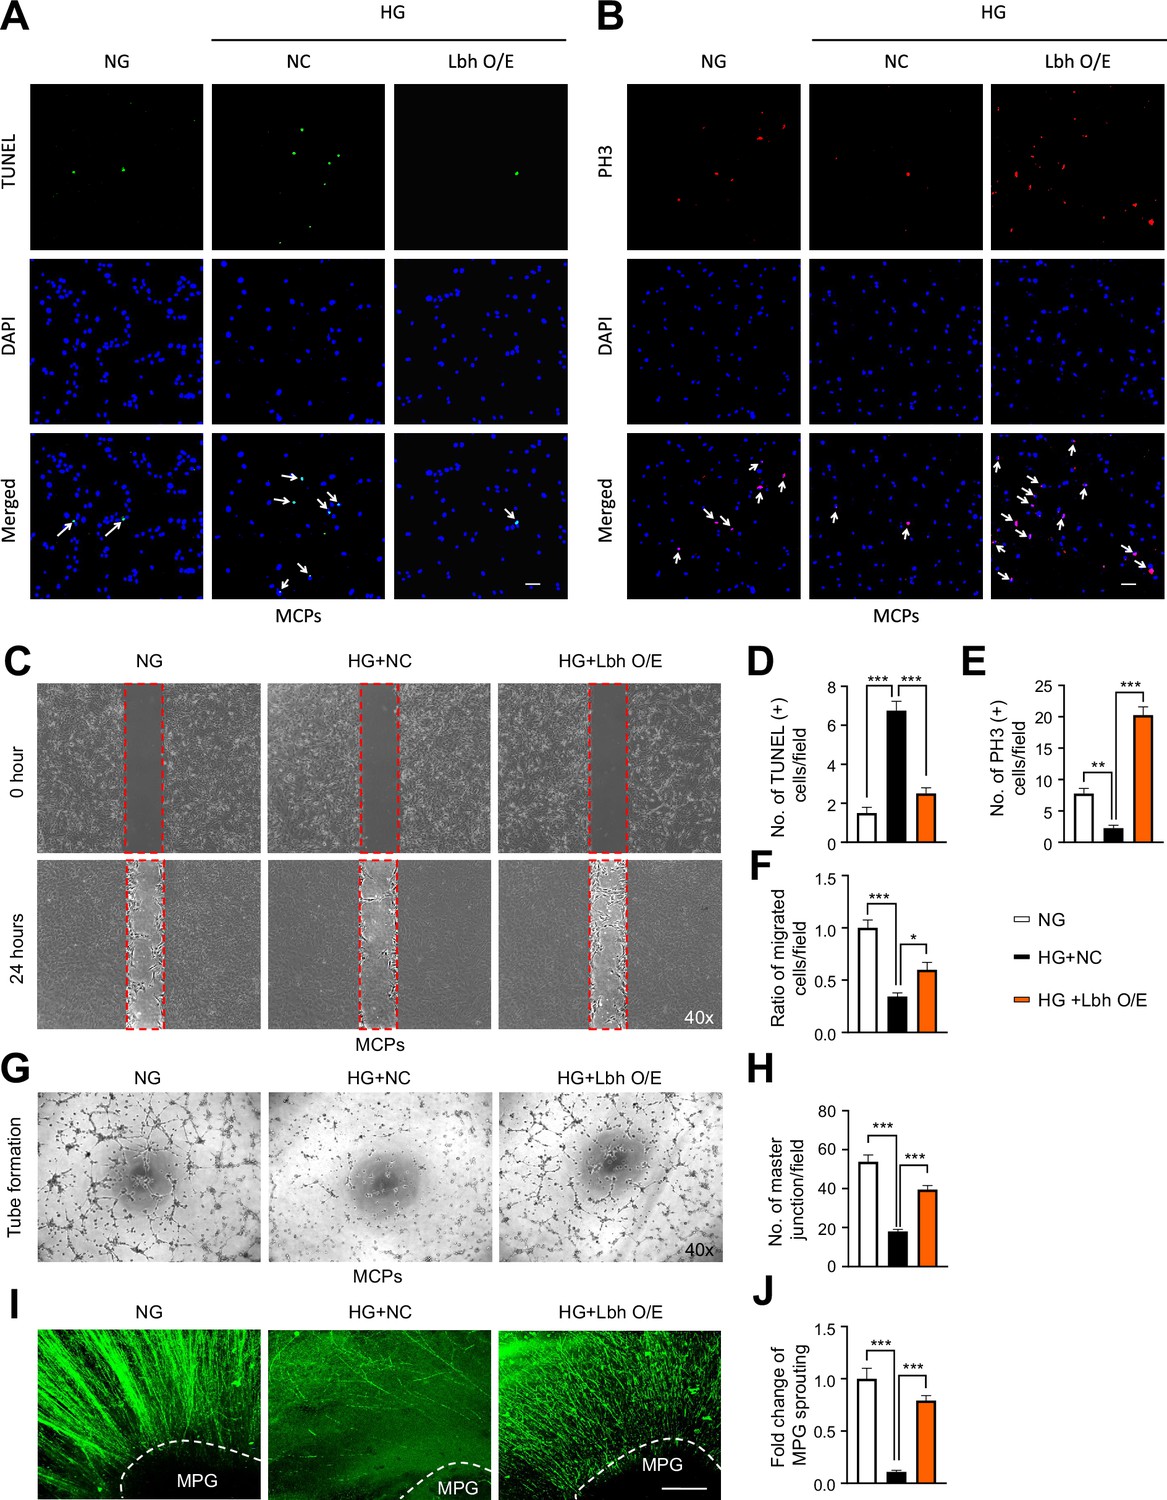
LBH enhances pericyte angiogenesis and MPG neurite sprouting under high glucose conditions.
(A, B, C, G, and I) TUNEL assay (A, green), immunofluorescence staining of PH3 (B, red), migration (C), tube formation (G) in MCPs, and immunofluorescence staining with neurofilament in MPG tissues (I, green) treated with lentiviruses ORF control particles (NC) and ORF clone of mouse Lbh (LBH O/E) under HG conditions. Nuclei were labeled with DAPI (blue). Scale bars, 50 µm. (D, E, F, H, and J) Quantification of number of TUNEL-positive cells (arrow indicated, D), PH3-positive cells (arrow indicated, E), ratio of migrated cells (cells in red frame dot line, F), master junctions (H), and fold change of MPG sprouting (J) by ImageJ, and results are presented as means ± SEM (n=4). The relative ratio in the NG group was defined as 1. *p<0.05; **p<0.01; ***p<0.001. TUNEL, terminal deoxynucleotidyl transferase-mediated deoxyuridine triphosphate nick-end labeling; NG, normal glucose; HG, high glucose; DM, diabetes mellitus; DAPI, 4,6-diamidino-2-phenylindole; MPG, major pelvic ganglion.
Figure 5 with 1 supplement
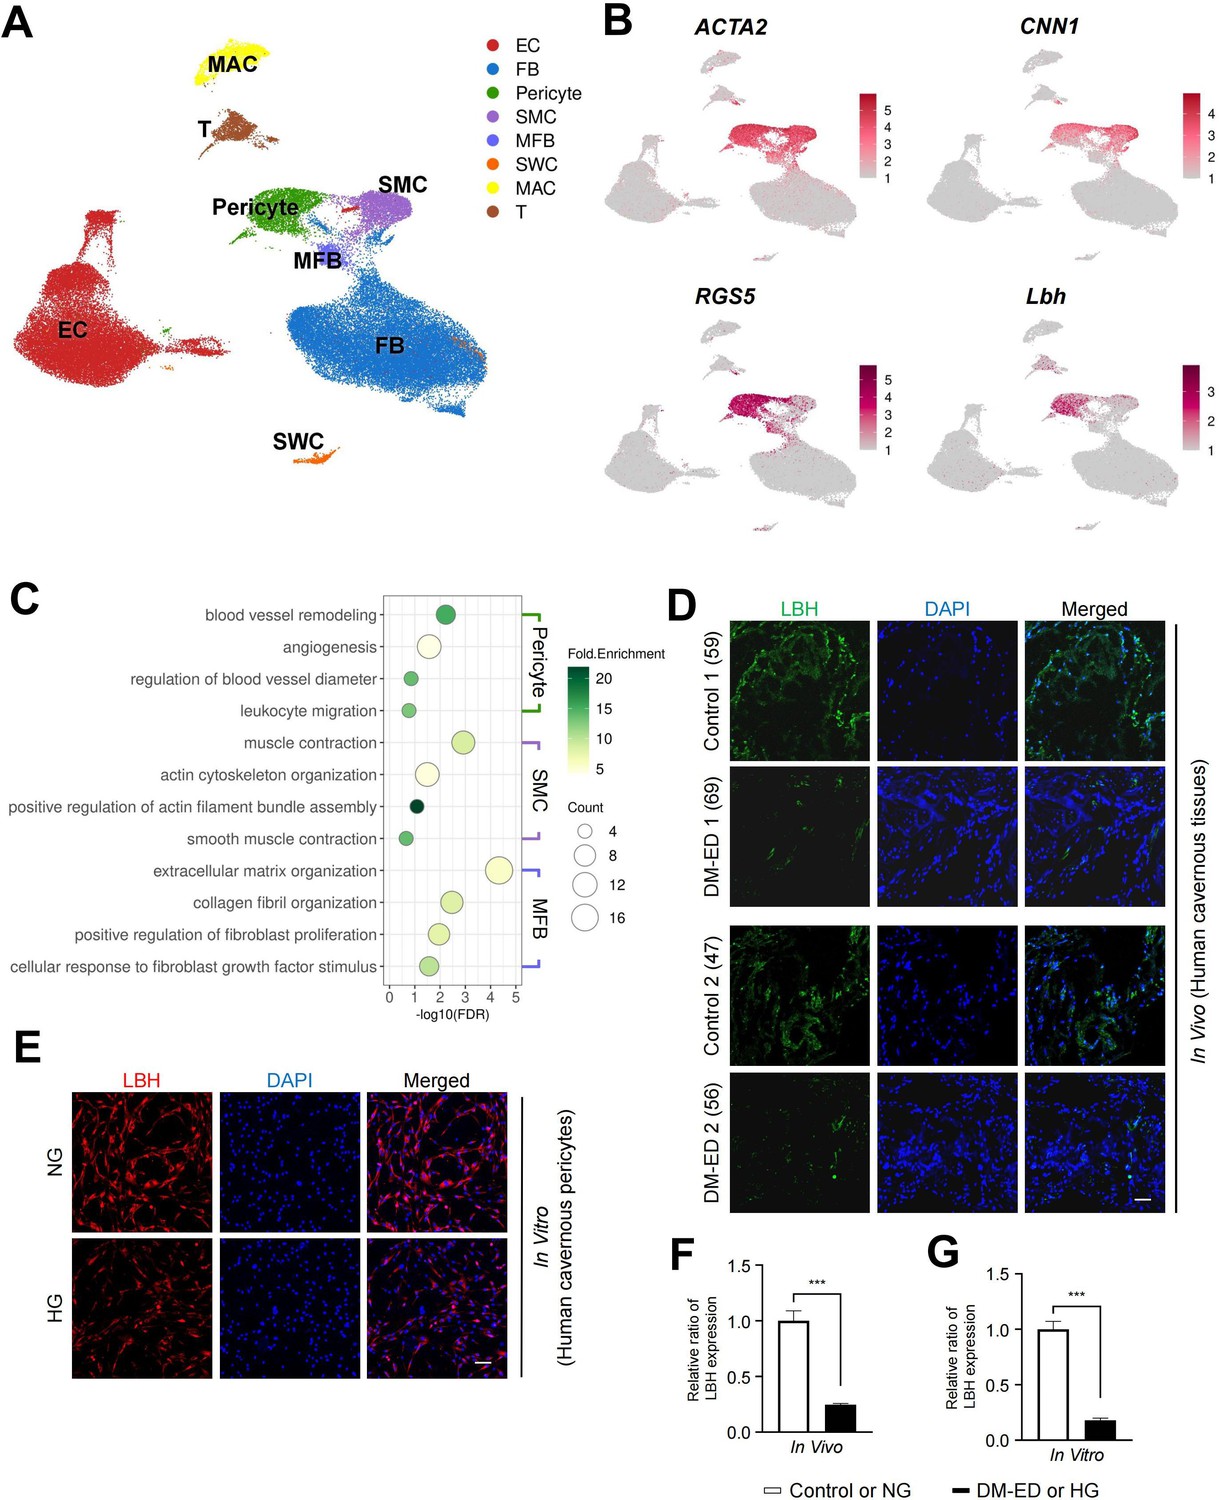
LBH as a marker of pericyte in human corpus cavernosum.
(A) Visualization of single-cell data from human corpus cavernosum using Uniform Manifold Approximation and Projection (UMAP). Each cell type is indicated by a different color. EC, endothelial cells; FBs, fibroblasts; SMC, smooth muscle cell; MFB, myofibroblast; SWC, Schwann cell; MAC, macrophage; T, T cell. (B) Expression of marker genes of SMC (ACTA2 and CNN1) and marker genes of pericyte (RGS5 and LBH). (C) Biological processes identified through gene ontology analysis of clusters annotated as pericyte, SMC, and MFB. (D) LBH (green) staining in cavernous tissues from two patients with diabetic erectile dysfunction and two patients with congenital penile curvature who had normal erectile function during reconstructive penile surgery. Scale bar, 100 µm. (E) LBH (red) staining in primary cultured human cavernous pericytes under NG and HG conditions for 3 days. (F and G) LBH immunopositive areas were quantified by ImageJ, and results are presented as means ± SEM (n=4). Nuclei were labeled with DAPI (blue). The relative ratio in the control or NG group was defined as 1. ***p<0.001. NG, normal glucose; HG, high glucose; DM, diabetes mellitus; DAPI, 4,6-diamidino-2-phenylindole.
Figure 5—figure supplement 1
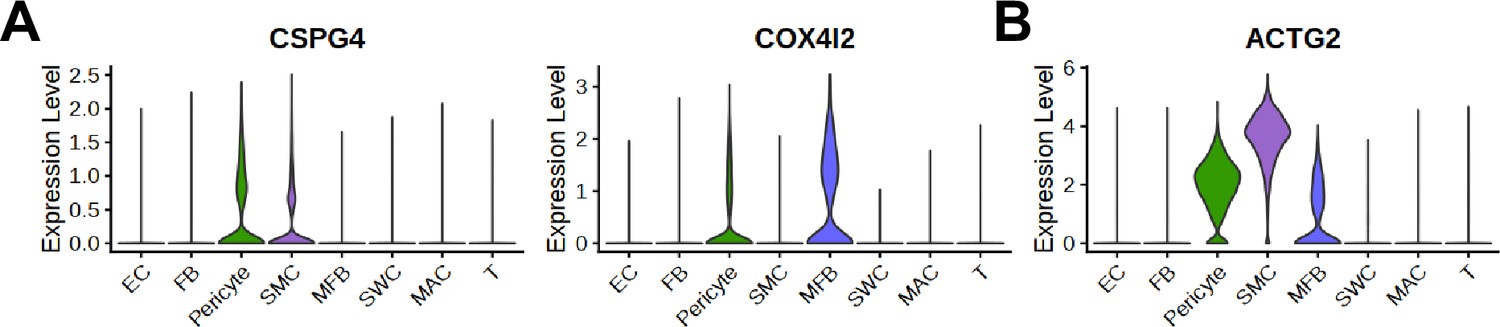
Expression of marker genes of pericyte and smooth muscle cells in human penis single-cell RNA sequencing data.
(A) Violin plots showing known pericyte marker genes, CSPG4 and COX4I2. (B) A violin plot showing known SMC marker genes, ACTG2. EC, endothelial cells; FBs, fibroblasts; SMCs, smooth muscle cells; MFB, myofibroblast; SWC, Schwann cells; MAC, macrophage; T, T cell.
Figure 6
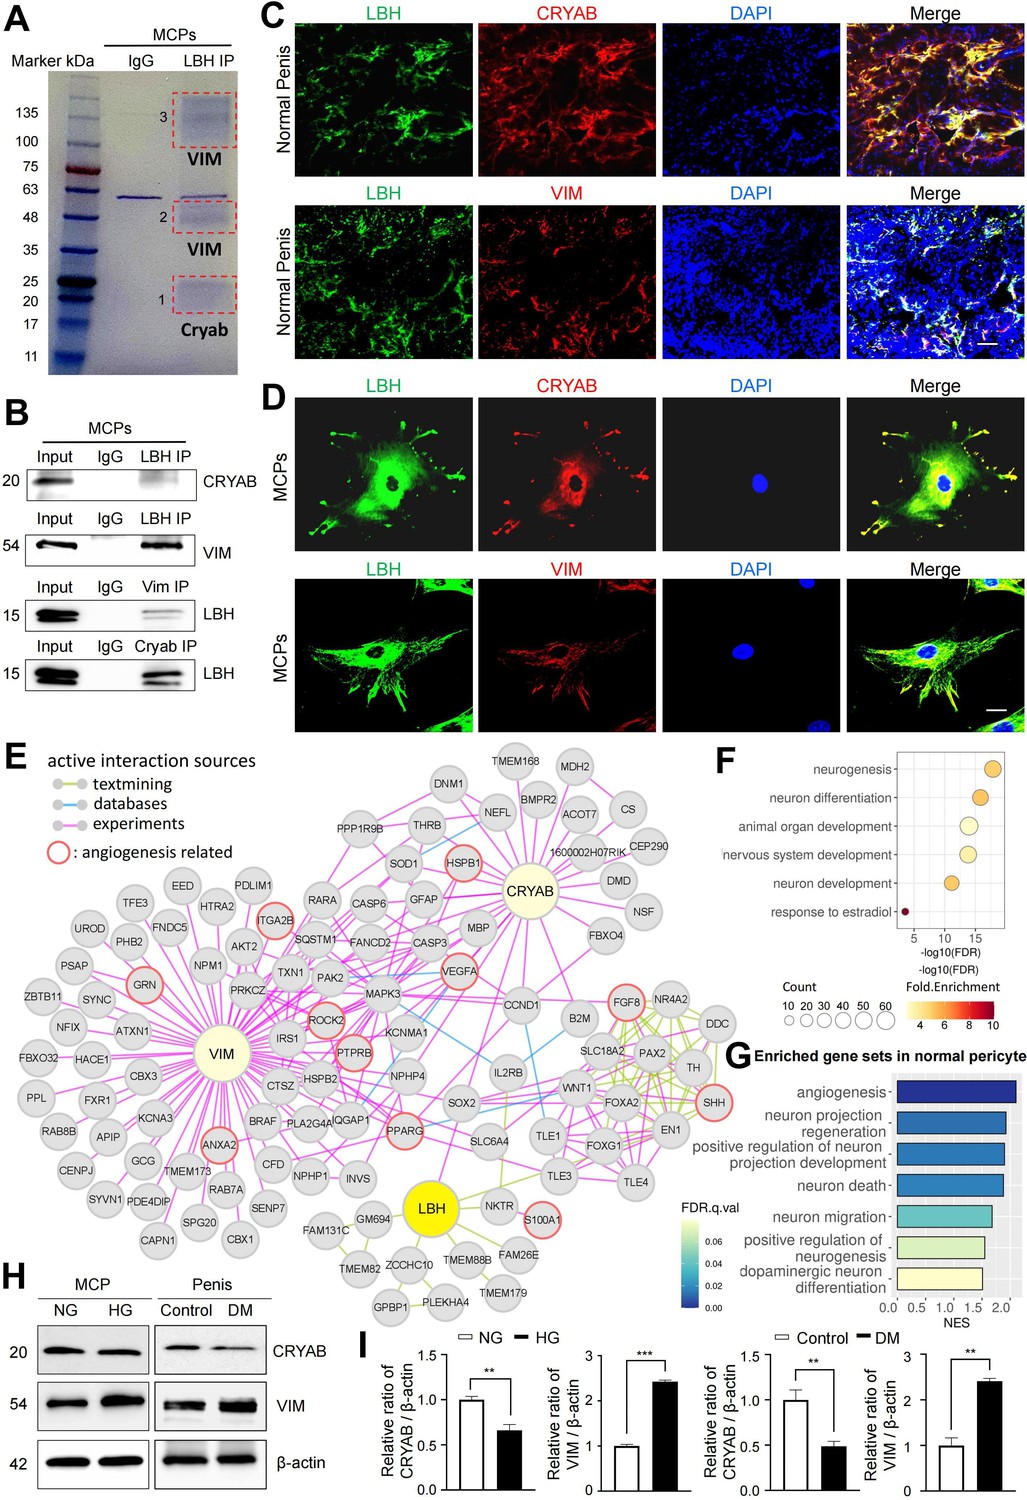
LBH-interacting protein identification in mouse cavernous pericytes.
(A) LBH was immunoprecipitated (IP) from whole-MCPs lysates, resolved on SDS-PAGE gels, and stained with Coomassie blue solution. Gel bands indicated by red frame dot line were analyzed by liquid chromatography tandem mass spectrometry (LC-MS/MS) analysis. (B) Co-IP of LBH, CRYAB, and Vimentin from whole-MCPs lysates followed by immunoblot analysis to detect CRYAB, Vimentin, and LBH. (C and D) Representative images of immunofluorescence staining of LBH (green)/CRYAB (red) and LBH (green)/VIM (red) in normal penis tissues and MCPs. Nuclei were labeled with DAPI (blue). Scale bar, 100 µm (top), 25 µm (bottom). (E) Protein-protein interaction (PPI) network of LBH, CRYAB, VIM, and first and second interactors of LBH. Lines connecting molecules show interaction sources in color. (F) Biological pathways involving molecules in PPI network identified by gene ontology analysis. (G) Significantly enriched gene sets associated with angiogenesis and nerve system in normal pericytes compared to diabetic pericytes in single-cell data. (H) Representative western blots for CRYAB and VIM of MCPs under NG and HG conditions (left), and mouse penis tissues from age-matched control and diabetic mice (right). (I) Normalized band intensity ratio of CRYAB and VIM to β-actin was quantified using ImageJ, and results are presented as means ± SEM (n=4). The relative ratio in the NG or control group was defined as 1. **p<0.01; ***p<0.001. MCPs, mouse cavernous pericytes; NG, normal glucose; HG, high glucose; DM, diabetes mellitus; DAPI, 4,6-diamidino-2-phenylindole.
Additional files
-
Supplementary file 1
Relative density of mouse angiogenesis array spots.
- https://cdn.elifesciences.org/articles/88942/elife-88942-supp1-v1.xlsx
-
Supplementary file 2
Physiological and metabolic parameters: 2 weeks after treatment with PBS, NC, LBH O/E.
Values are the mean ± SEMs for n=5 animals for each group. STZ, streptozotocin; MSBP, mean systolic blood pressure; NC, lentiviruses ORF control particles; LBH O/E, ORF clone of mouse Lbh lentiviruses, *p<0.05 vs. control group.
- https://cdn.elifesciences.org/articles/88942/elife-88942-supp2-v1.xlsx
-
MDAR checklist
- https://cdn.elifesciences.org/articles/88942/elife-88942-mdarchecklist1-v1.pdf
Download links
A two-part list of links to download the article, or parts of the article, in various formats.
Downloads (link to download the article as PDF)
Open citations (links to open the citations from this article in various online reference manager services)
Cite this article (links to download the citations from this article in formats compatible with various reference manager tools)
Single-cell transcriptome analysis of cavernous tissues reveals the key roles of pericytes in diabetic erectile dysfunction
eLife 12:RP88942.
https://doi.org/10.7554/eLife.88942.4


