Splicing factor SRSF1 is essential for homing of precursor spermatogonial stem cells in mice
- State Key Laboratory of Animal Biotech Breeding, College of Biological Sciences, China Agricultural University, China
- Key Laboratory of RNA Biology, Institute of Biophysics, Chinese Academy of Sciences, China
- College of Veterinary Medicine, Yangzhou University, China
- Key Laboratory of Precision Nutrition and Food Quality, Department of Nutrition and Health, China, Agricultural University, China
Figures
Figure 1 with 1 supplement
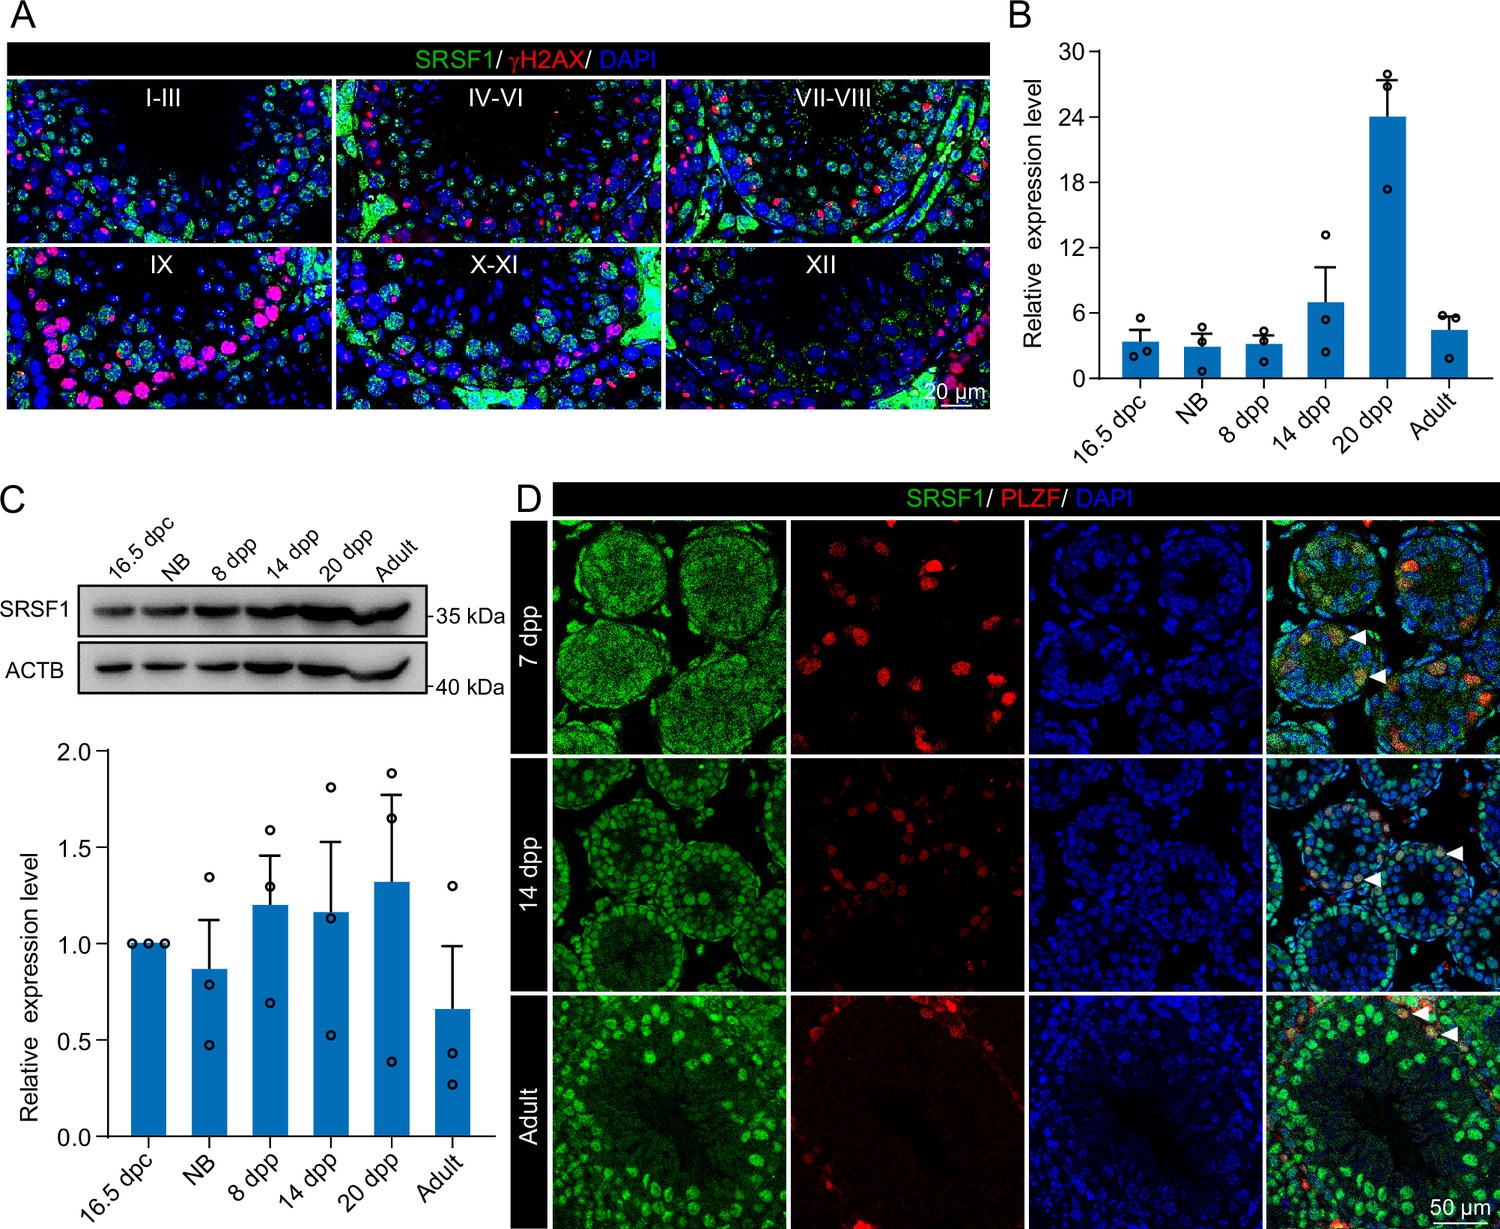
Expression and localisation of SRSF1 in the testis of mice at different developmental stages.
(A) Dynamic localisation of SRSF1 during spermatogenesis. Co-immunostaining was performed using SRSF1 and γH2AX antibodies in adult mouse testes. DNA was stained with DAPI. Scale bar, 20 μm. (B) Expression of Srsf1 in testes at different stages of development. The RT-qPCR data were normalised to Gapdh. N=3. (C) Western blotting of SRSF1 expression in testes at different stages of development. ACTB served as a loading control. The value in 16.5 days post-coitus (dpc) testes were set as 1.0, and the relative values of testes in other developmental periods are indicated. N=3. (D) Localisation and expression of SRSF1 in spermatogonia. Co-immunostaining was performed using PLZF and SRSF1 antibodies in 7 days postpartum (dpp), 14 dpp, and adult mouse testes. DNA was stained with DAPI. Arrowheads, spermatogonia. Scale bar, 50 μm.
-
Figure 1—source data 1
Western blotting of SRSF1 expression in testes at different stages of development.
ACTB served as a loading control.
- https://cdn.elifesciences.org/articles/89316/elife-89316-fig1-data1-v1.pdf
Figure 1—figure supplement 1
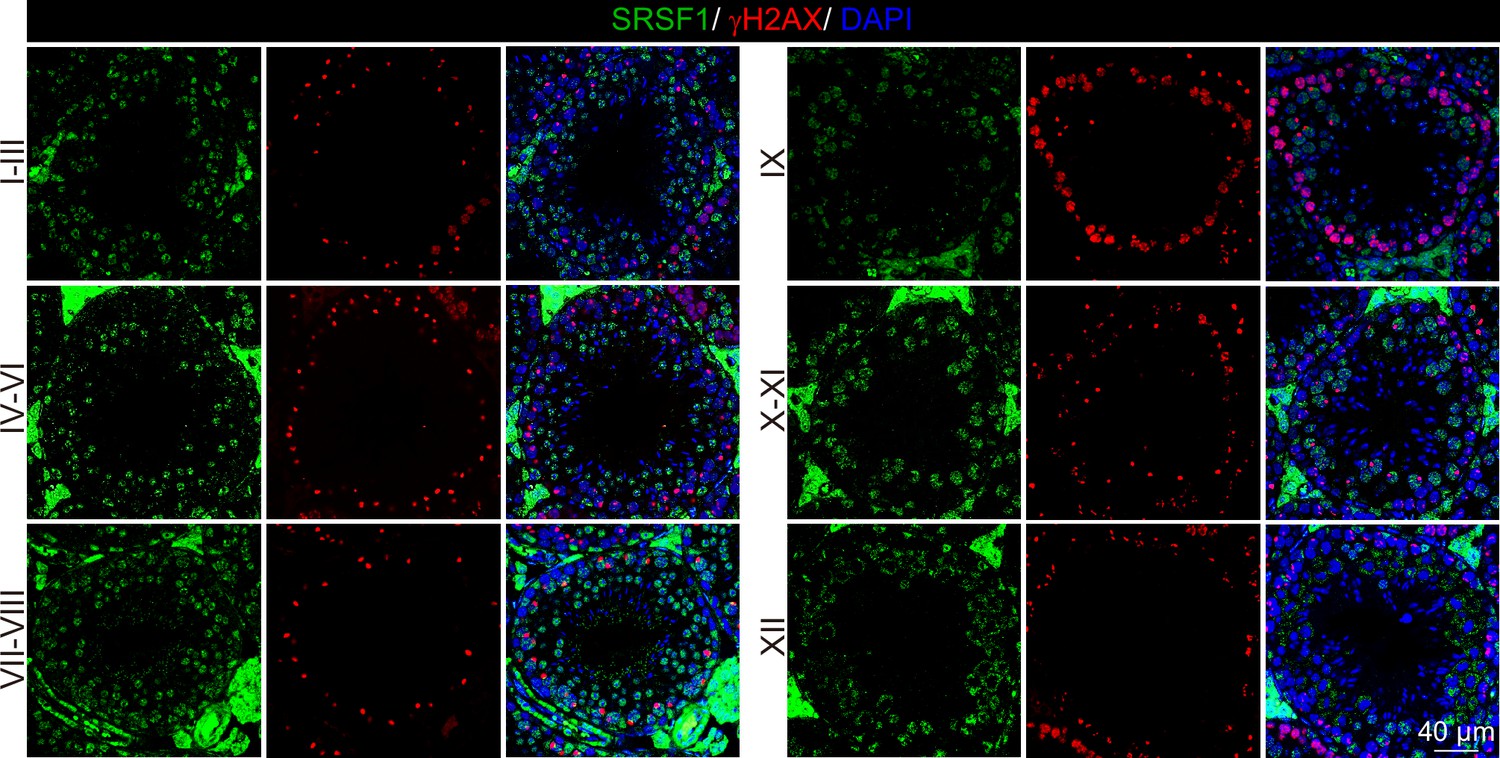
Dynamic localisation of SRSF1 during spermatogenesis.
Co-immunostaining was performed using SRSF1 and γH2AX antibodies in adult mouse testes. DNA was stained with DAPI. Scale bar, 40 μm.
Figure 2
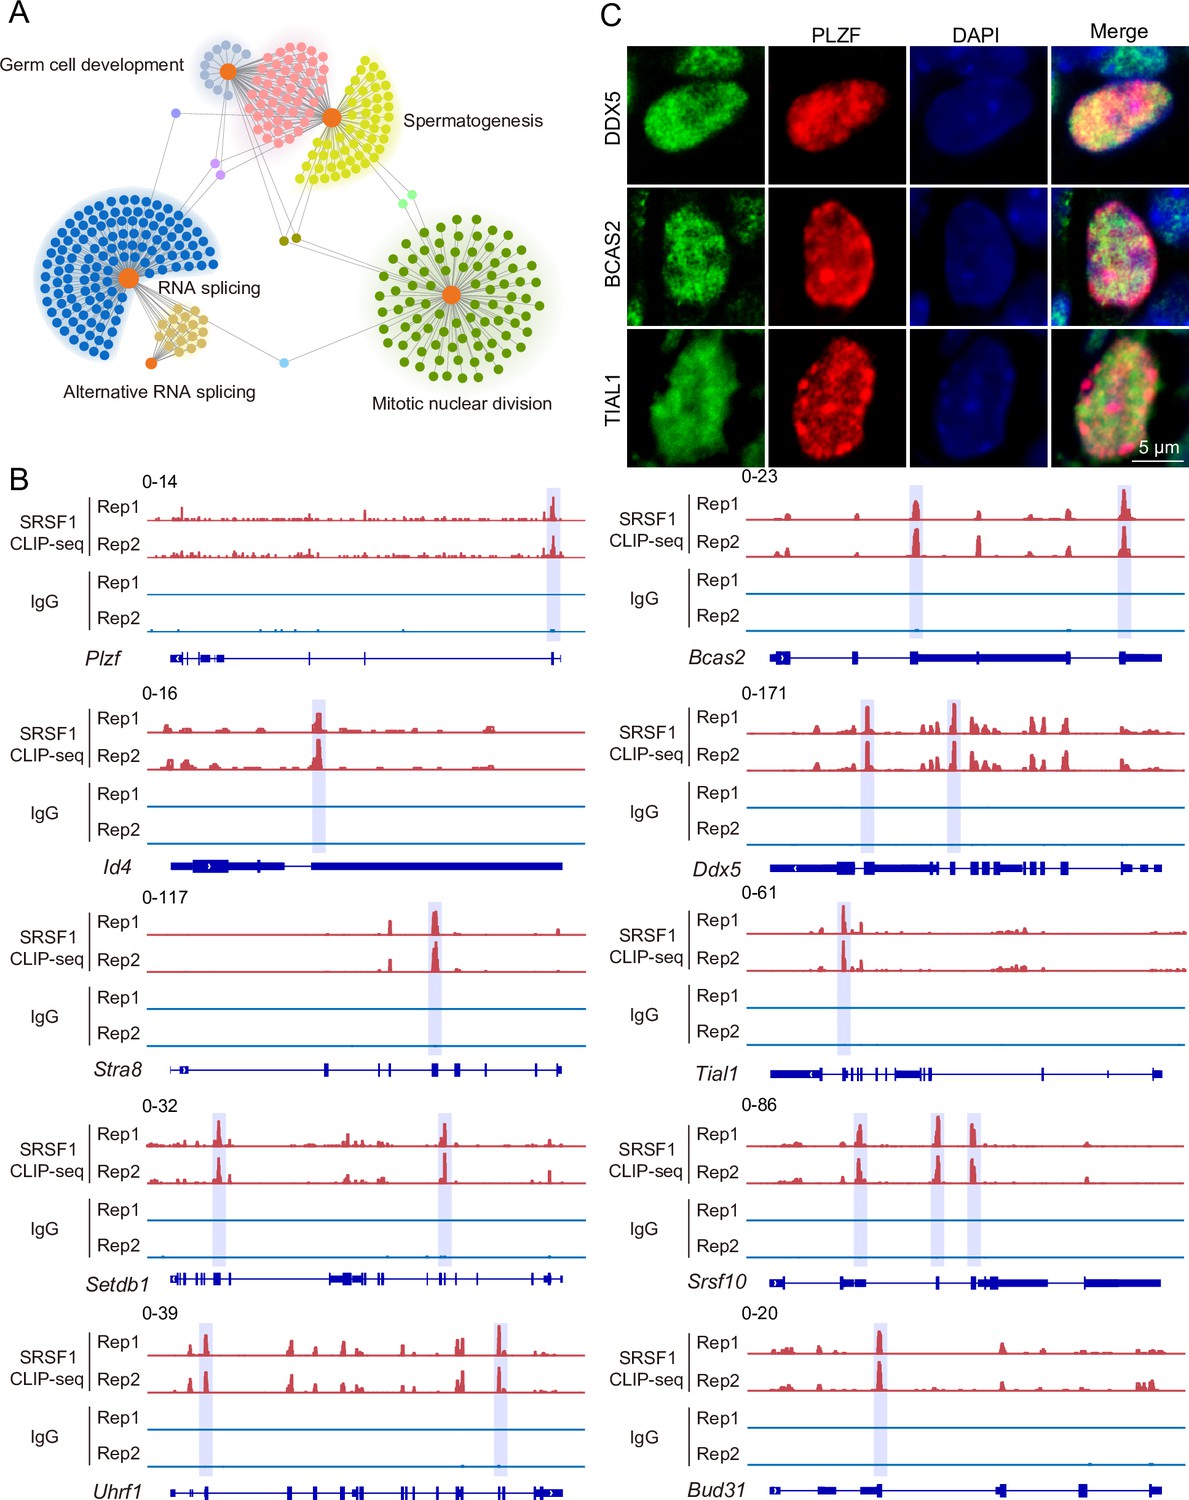
SRSF1-binding genes have an essential role in spermatogonia.
(A) Network showing Gene Ontology (GO) enrichment analyses of SRSF1-binding genes. (B) Representative genome browser views of spermatogonia-related gene transcripts bound by SRSF1. Higher peaks are marked by a lavender area. (C) Localisation of the spermatogonia-related proteins in mouse testes. Scale bar, 5 μm.
Figure 3
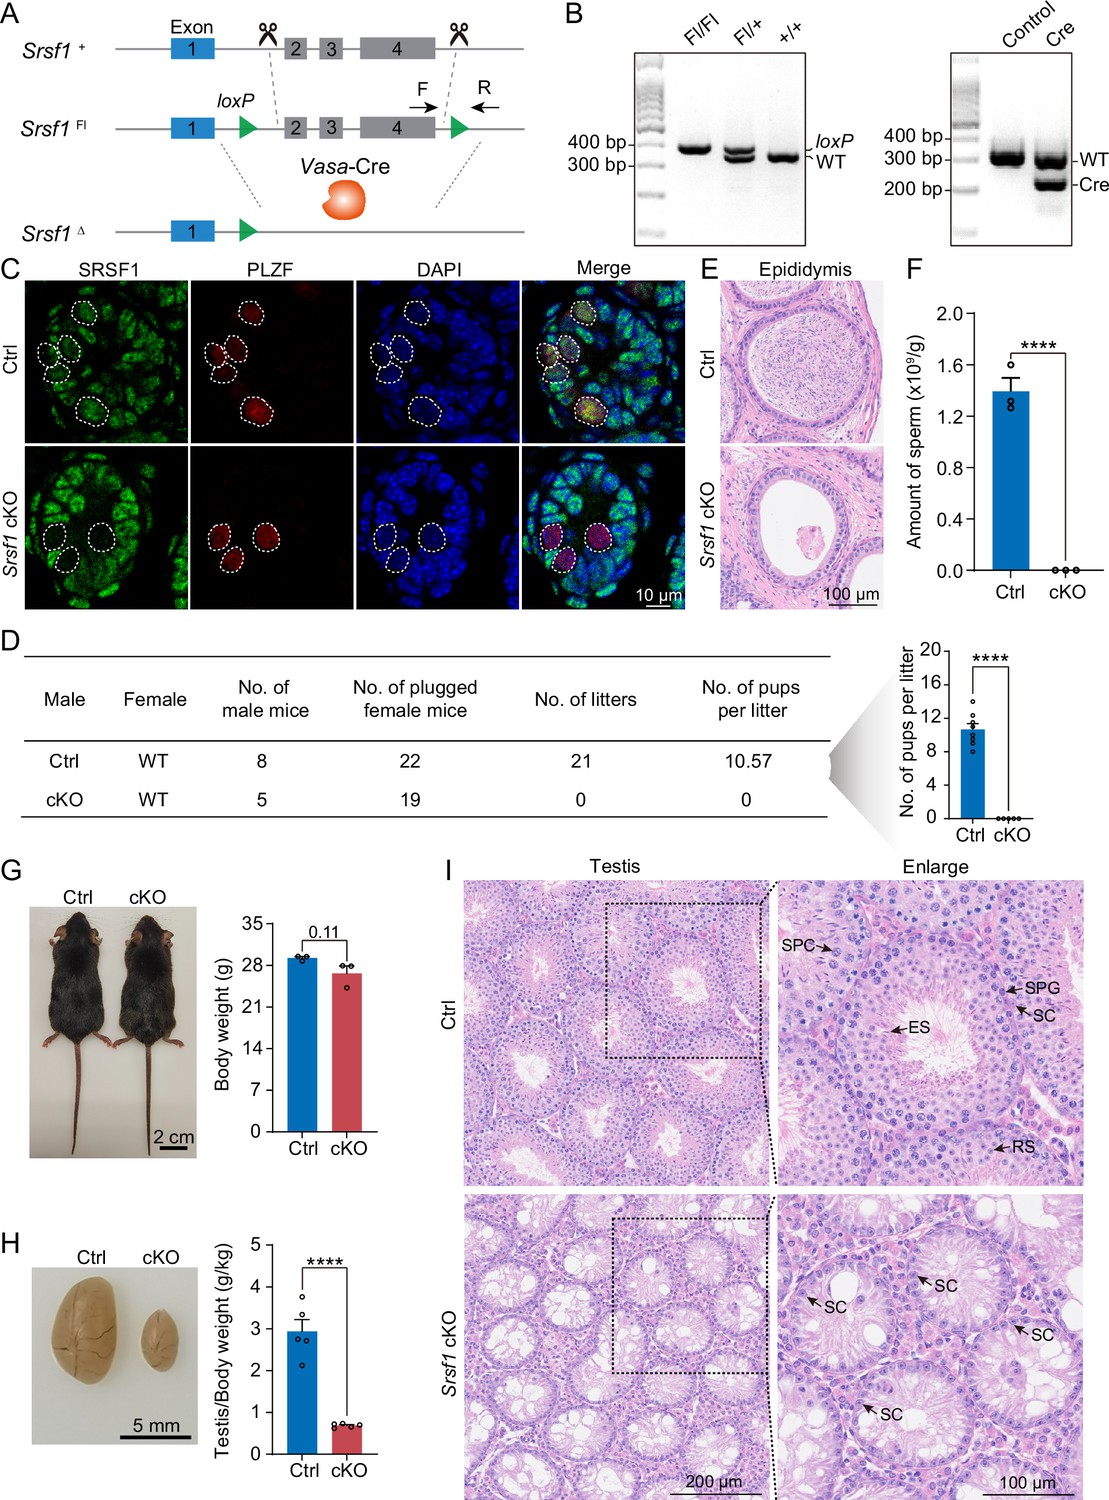
SRSF1 plays critical roles in spermatogenesis and male fertility.
(A) Vasa-Cre mice were crossed with Srsf1Fl/Fl mice to generate Srsf1 conditional knockout (cKO) mice. Cre-mediated deletion removed exons 2, 3, and 4 of Srsf1 and generated a null protein allele. (B) Genotyping PCR was performed using Vasa-Cre and Srsf1 primers. (C) Co-immunostaining of SRSF1 and PLZF in 7 days postpartum (dpp) control (Ctrl) and cKO testis. DNA was stained with DAPI. Scale bar, 10 μm. (D) Fertility test results showed a male infertility phenotype in the cKO mice (N=5) compared to the Ctrl mice (N=8). The number of pups per litter was determined in the cKO (N=5) and Ctrl (N=8) mice. (E) Haematoxylin-eosin-stained epididymis sections from adult Ctrl and cKO mice were obtained. Scale bar, 100 μm. (F) Cauda epididymal sperm counting was performed. N=3. (G) Normal body weight in cKO mice. The body sizes and weights of adult Ctrl and cKO mice are shown as the mean ± SEM. N=3. (H) Testis atrophy in adult cKO mice. Testis sizes and weights/body of adult Ctrl and cKO mice are shown as the mean ± SEM. N=5. (I) Haematoxylin-eosin-stained testis sections from adult Ctrl and cKO mice were obtained. Scale bar, left panel: 200 μm, right panel: 100 μm. SC, Sertoli cell; SPG, spermatogonium; SPC, spermatocyte; RS, round spermatid; ES, elongated spermatid. Unpaired Student’s t-test determined significance; exact p value p ≥ 0.05, ****p < 0.0001. The points and error bars represent the mean ± SEM.
-
Figure 3—source data 1
Genotyping PCR was performed using Vasa-Cre and Srsf1 primers.
- https://cdn.elifesciences.org/articles/89316/elife-89316-fig3-data1-v1.pdf
Figure 4
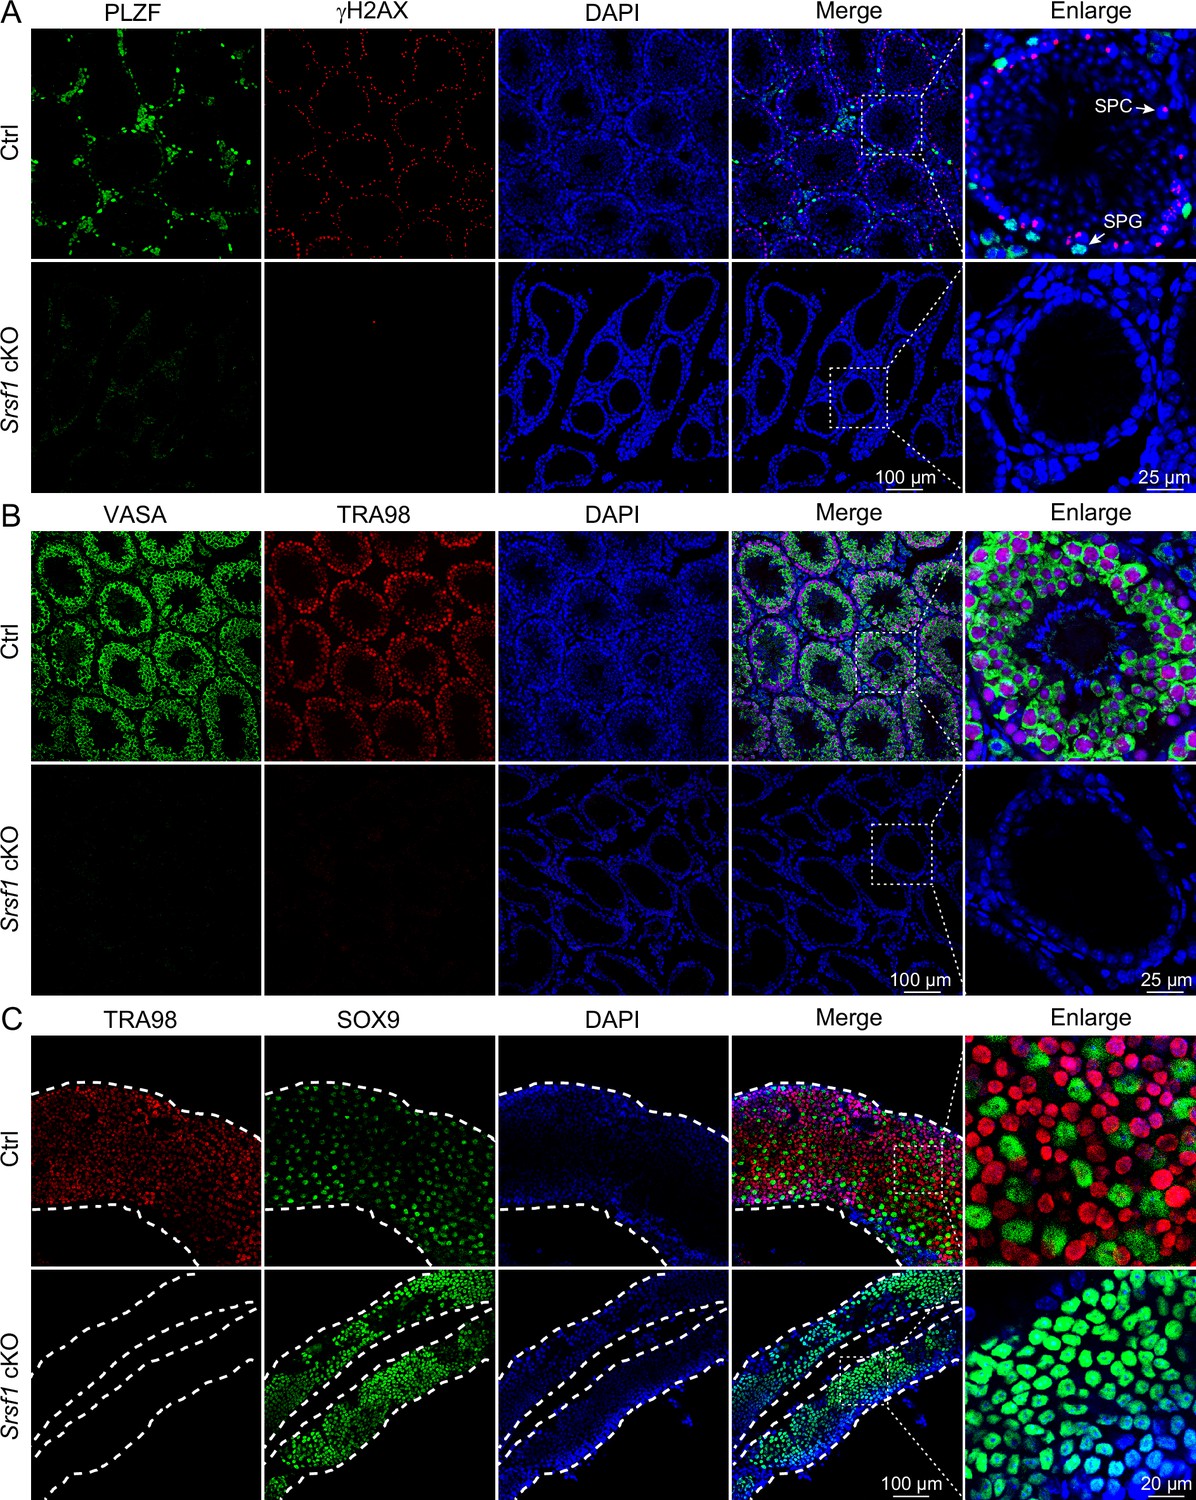
Loss of germ cells in adult conditional knockout (cKO) mouse testes.
(A) Co-immunostaining of PLZF and γH2AX in adult control (Ctrl) and cKO testis. DNA was stained with DAPI. Scale bar, right panel: 25 μm, other panels: 100 μm. (B) Co-immunostaining of VASA and TRA98 in adult Ctrl and cKO testis. DNA was stained with DAPI. Scale bar, right panel: 25 μm, other panels: 100 μm. (C) Whole-mount co-immunostaining of TRA98 and SOX9 in adult Ctrl and cKO testis. DNA was stained with DAPI. White dashed lines, boundary of the tubule. Scale bar, right panel: 20 μm, other panels: 100 μm.
Figure 5
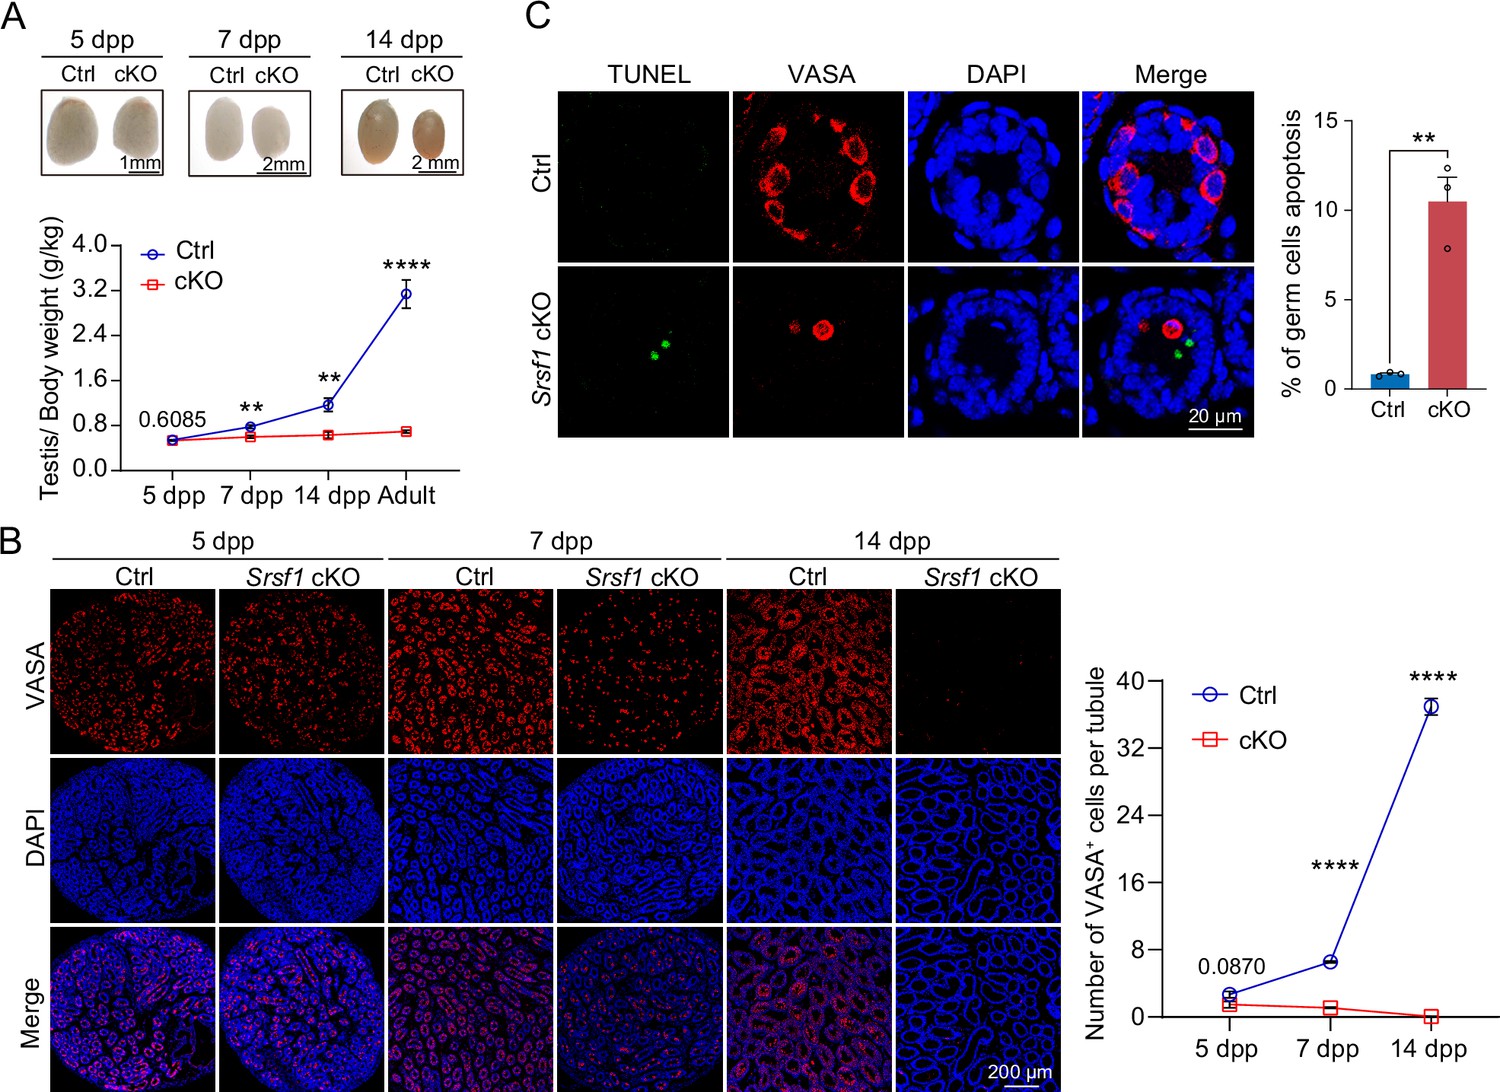
SRSF1 is required for spermatogonia survival.
(A) Testis sizes of 5 days postpartum (dpp), 7 dpp, and 14 dpp control (Ctrl) and conditional knockout (cKO) mice are shown. The testis/body weight ratios (g/kg) of 5 dpp, 7 dpp, 14 dpp, and adult Ctrl and cKO mice are shown as the mean ± SEM. N=4. (B) Immunostaining of VASA in 5 dpp, 7 dpp, and 14 dpp Ctrl and cKO testis. DNA was stained with DAPI. Scale bar, 200 μm. Number of VASA-positive cells per tubule is the mean ± SEM. N=3. (C) TUNEL apoptosis assay was performed on sections from 7 dpp Ctrl and cKO testis. DNA was stained with DAPI. Scale bar, 20 μm. Percentage of germ cells apoptosis is the mean ± SEM. N=3. Unpaired Student’s t-test determined significance; exact p value p ≥ 0.05, **p < 0.01, ****p < 0.0001. The points and error bars represent the mean ± SEM.
Figure 6
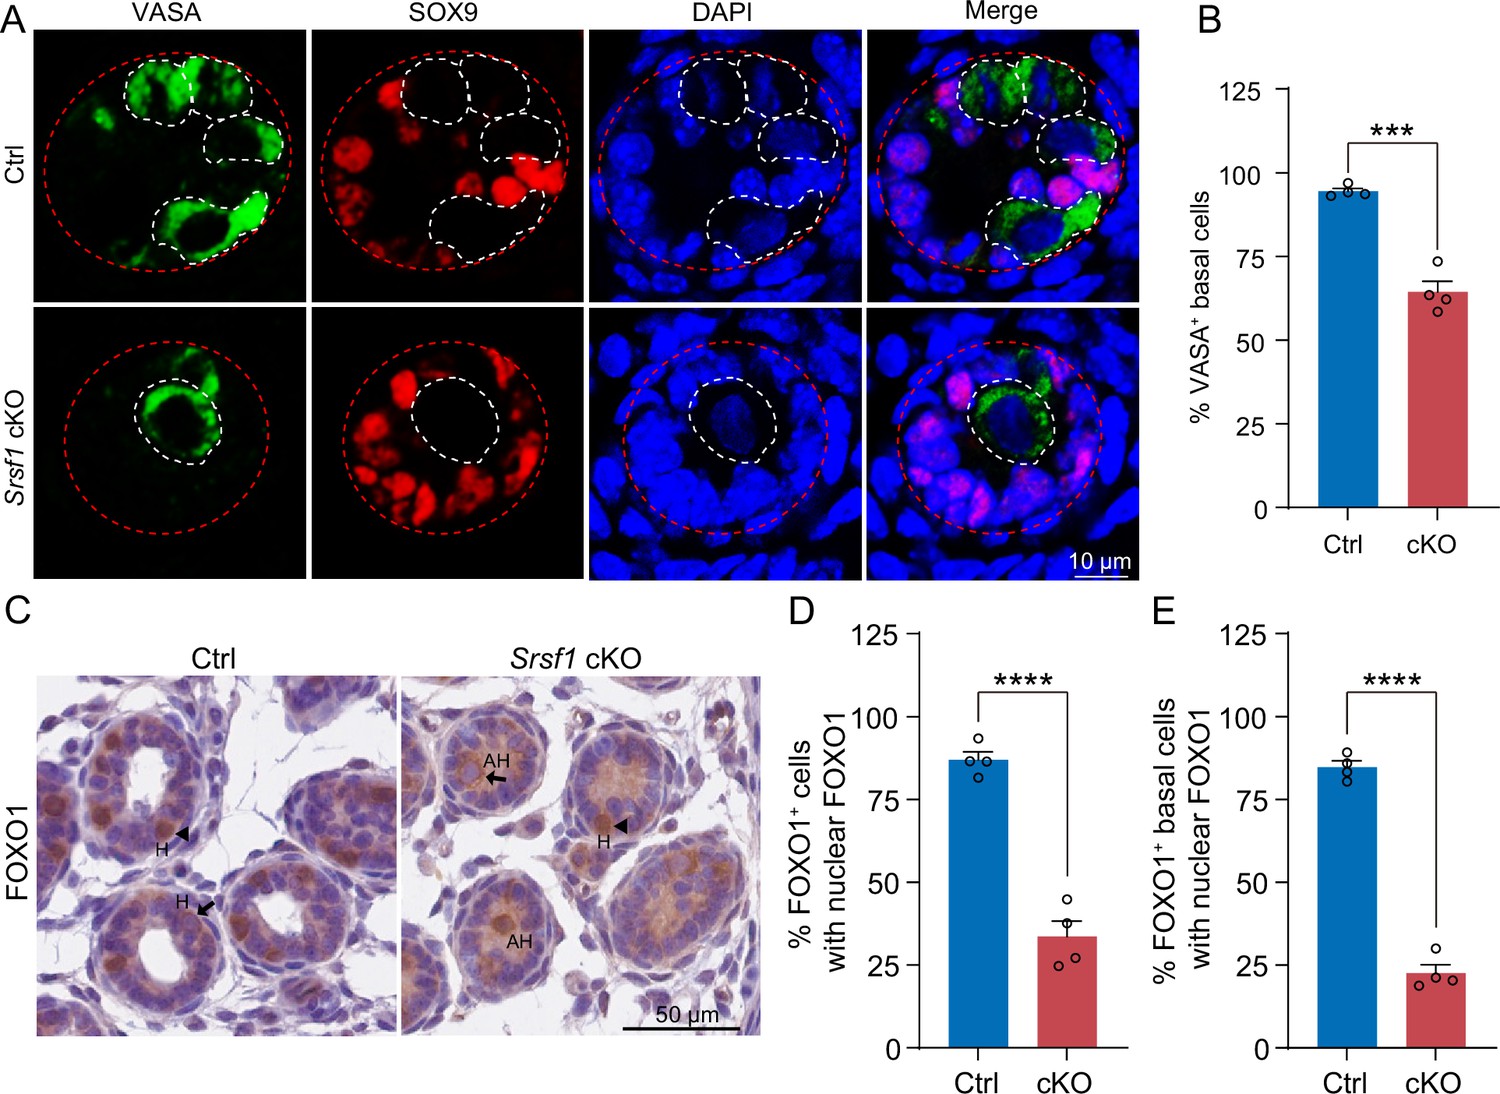
SRSF1 is required for homing of precursor spermatogonial stem cells (SSCs).
(A) Co-immunostaining of VASA and SOX9 in 5 days postpartum (dpp) control (Ctrl) and conditional knockout (cKO) testis. DNA was stained with DAPI. Scale bar, 10 μm. Red dashed circles, tubule. White dashed circles, germ cell. (B) The percentage of VASA-positive basal cells is shown as the mean ± SEM. N=4. (C) Immunohistochemical staining of FOXO1 in 5 dpp Ctrl and cKO testis. The nuclei were stained with haematoxylin. Scale bar, 10 μm. Arrowheads, FOXO1 in the nucleus. Arrows, FOXO1 in the cytoplasm. H, homing. AH, abnormal homing. (D) The percentage of FOXO1-positive cells with nuclear FOXO1 is shown as the mean ± SEM. 913 Ctrl germ cells and 592 cKO germ cells were obtained from four animals. (E) The percentage of FOXO1-positive basal cells with nuclear FOXO1 is shown as the mean ± SEM. 913 Ctrl germ cells and 592 cKO germ cells were obtained from four animals. Unpaired Student’s t-test determined significance; ***p < 0.001, ****p < 0.0001. The points and error bars represent the mean ± SEM.
Figure 7 with 1 supplement
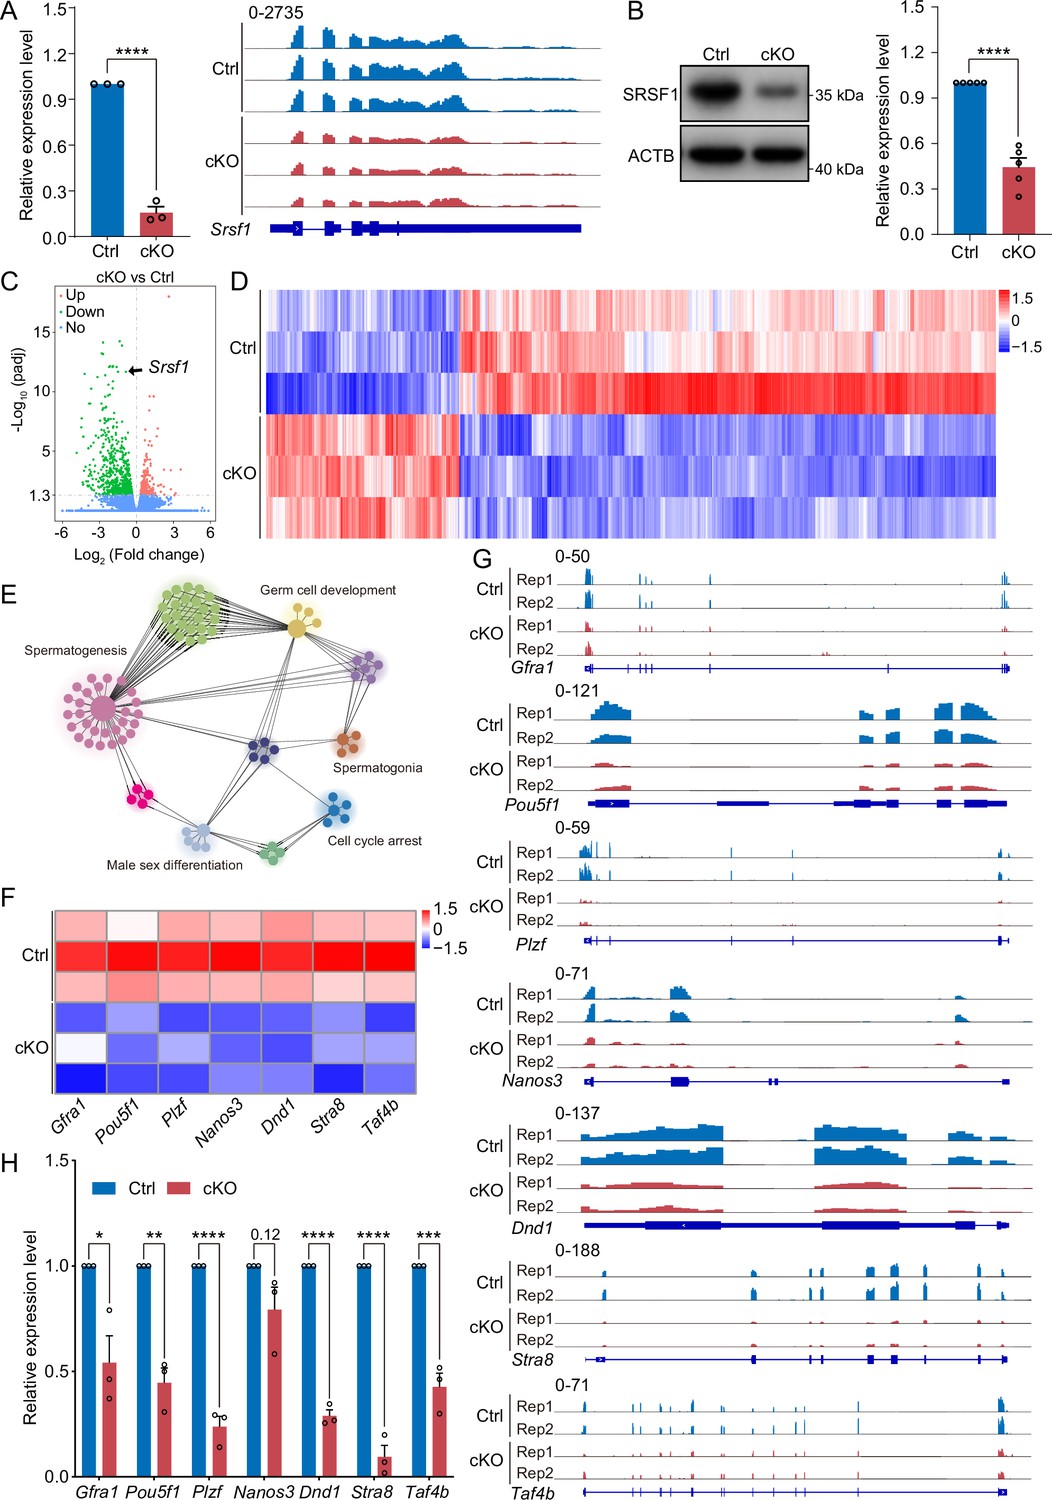
SRSF1 regulates the expression of spermatogonia-related genes.
(A) Expression of Srsf1 in 5 days postpartum (dpp) control (Ctrl) and conditional knockout (cKO) mouse testis. The RT-qPCR data were normalised to Gapdh. N=5. The expression of Srsf1 is shown as reading coverage in 5 dpp mouse testis. (B) Western blotting of SRSF1 expression in 5 dpp mouse testis. ACTB served as a loading control. The value in Ctrl testes was set as 1.0, and the relative values in cKO testis are indicated. N=5. (C) Volcano map displaying the distribution of differentially expressed genes from RNA-seq data. The abscissa in the figure represents the gene fold change in 5 dpp cKO and Ctrl mouse testis. |log2FoldChange|≥0. The ordinate indicates the significance of gene expression differences between 5 dpp cKO and Ctrl mouse testis. padj ≤0.05. Upregulated genes are shown as red dots, and downregulated genes are shown as green dots. (D) Cluster heatmap of differentially expressed genes. The ordinate is the genotype, and the abscissa is the normalised FPKM (fragments per kilobase million) value of the differentially expressed gene. Red indicates a higher expression level, while blue indicates a lower expression level. (E) Network showing Gene Ontology (GO) enrichment analyses of differentially expressed genes. (F) Heatmap of spermatogonia-related gene expression. (G) The expression of spermatogonia-related genes is shown as read coverage. (H) The expression of spermatogonia-related genes in 5 dpp cKO and Ctrl mouse testis. The RT-qPCR data were normalised to Gapdh. The value in the Ctrl group was set as 1.0, and the relative value in the cKO group is indicated. N=3. Unpaired Student’s t-test determined significance; exact p value p ≥ 0.05, *p < 0.05, **p < 0.01, ***p < 0.001, ****p < 0.0001. The points and error bars represent the mean ± SEM.
-
Figure 7—source data 1
Western blotting of SRSF1 expression in 5 days postpartum (dpp) mouse testes.
ACTB served as a loading control.
- https://cdn.elifesciences.org/articles/89316/elife-89316-fig7-data1-v1.pdf
Figure 7—figure supplement 1
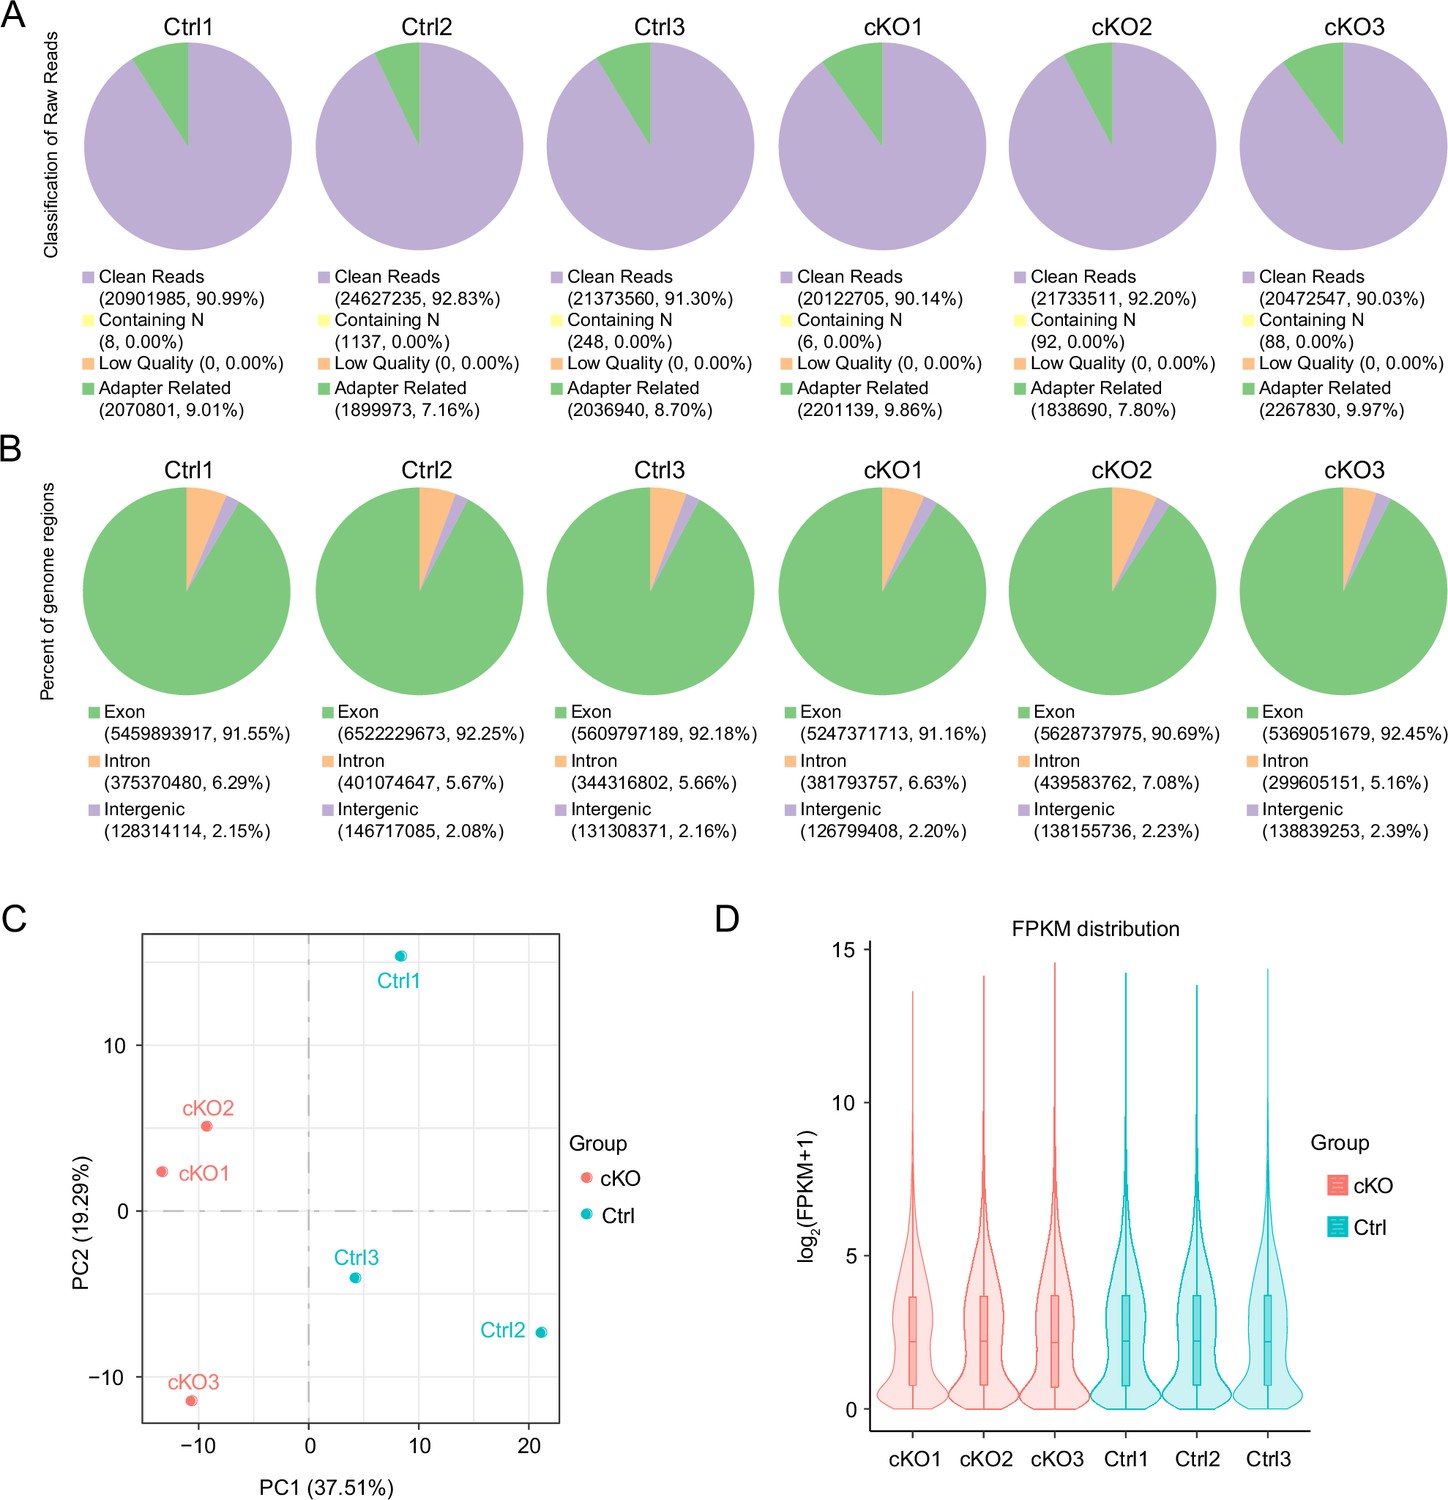
The libraries of RNA-seq are of good quality.
(A) Filtering of sequencing data per sample. (B) Distribution of sequenced reads across genomic regions for all samples. (C) Gene expression values (fragments per kilobase million [FPKM]) of all samples were subjected to principal component analysis (PCA). (D) The distribution of gene expression levels of different samples is demonstrated by violin plots as shown below. The horizontal coordinate of the graph is the name of the sample, and the vertical coordinate is log2 (FPKM + 1).
Figure 8 with 1 supplement
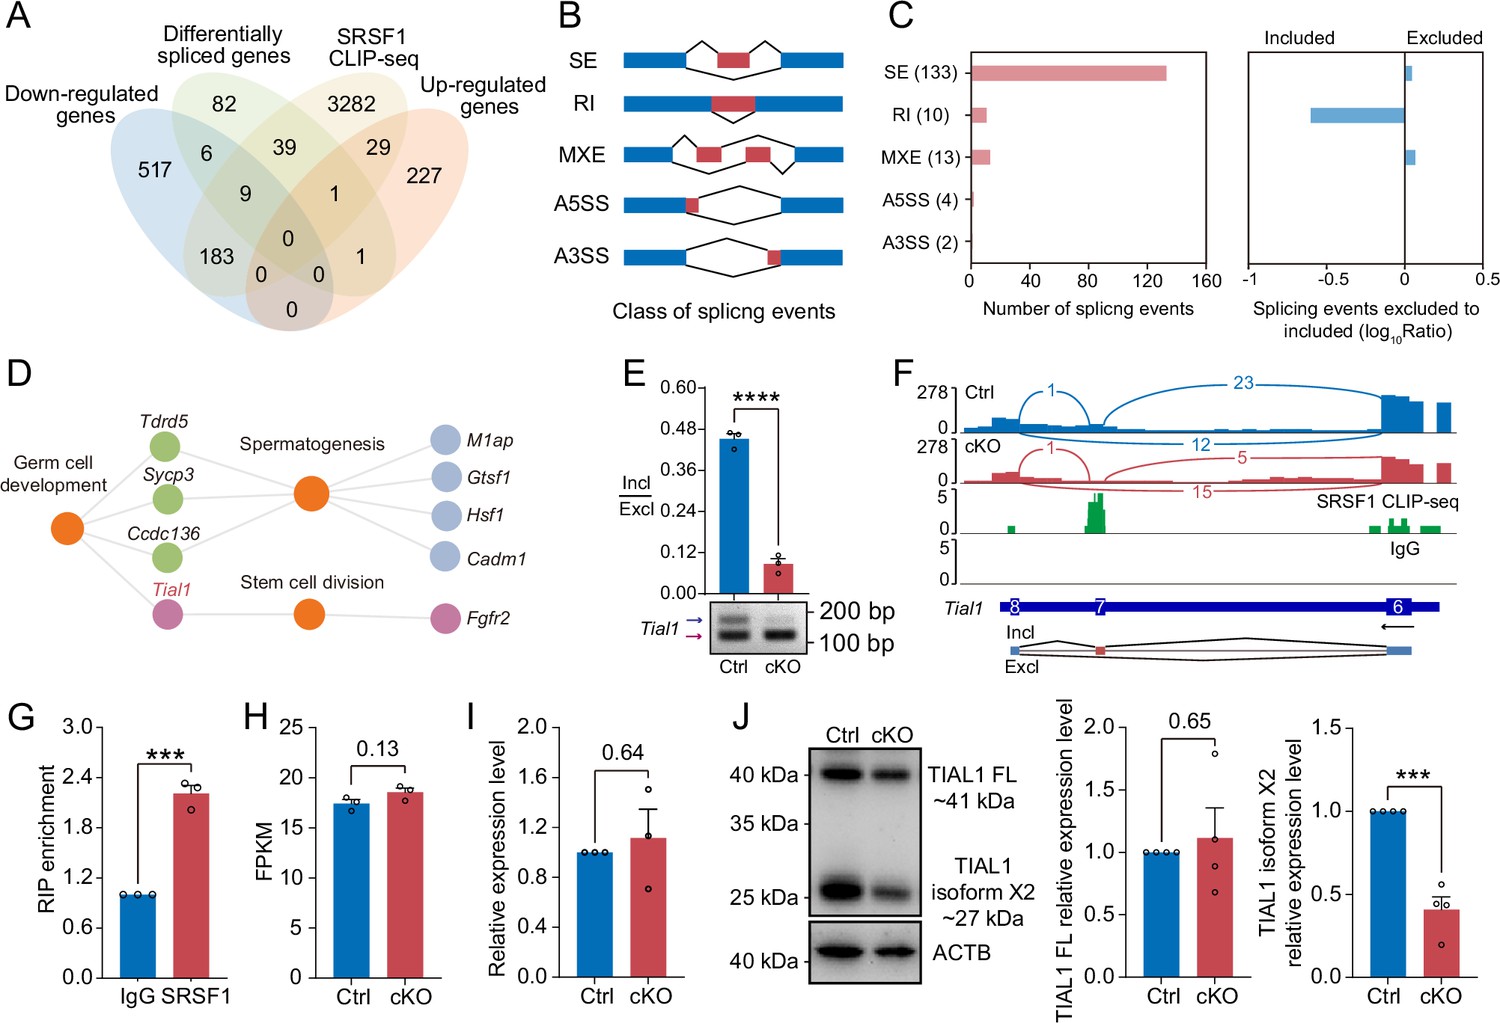
SRSF1 directly binds and regulates the expression and alternative splicing (AS) of Tial1/Tiar.
(A) Venn diagram showing the correlation among downregulated, upregulated, alternatively spliced, and SRSF1-binding genes. (B) Schematic diagram showing the classes of splicing events. (C) Splicing events were analysed by number, exclusion, and inclusion. (D) Network showing Gene Ontology (GO) enrichment analyses of AS genes. (E) The AS of Tial1/Tiar in 5 days postpartum (dpp) Ctrl and conditional knockout (cKO) mouse testes was analysed by RT-PCR. N=3. The ratio of inclusion (Incl) to exclusion (Excl) is shown accordingly. (F) Analyses of Tial1/Tiar expression and exon-exon junctions were performed. (G) SRSF1 directly binds the pre-mRNA of Tial1/Tiar by RNA immunoprecipitation (RIP)-qPCR in 5 dpp mouse testes. N=3. (H) The fragments per kilobase million (FPKM) of Tial1/Tiar in 5 dpp Ctrl and cKO mouse testes. (I) The expression of Tial1/Tiar in 5 dpp Ctrl and cKO mouse testes. The RT-qPCR data were normalised to Gapdh. The value in the Ctrl group was set as 1.0, and the relative value in the cKO group is indicated. N=3. (J) Western blotting of TIAL1/TIAR expression in 5 dpp mouse testes. ACTB served as a loading control. The FL/isoform X2 value of TIAL1/TIAR in the Ctrl group was set as 1.0, and the relative value in the cKO group is indicated. N=3. FL, full length. Unpaired Student’s t-test determined significance; exact p value p ≥ 0.05, ***p < 0.001, ****p < 0.0001. The points and error bars represent the mean ± SEM.
-
Figure 8—source data 1
The alternative splicing (AS) of Tial1/Tiar in 5 days postpartum (dpp) Ctrl and conditional knockout (cKO) mouse testes was analysed by RT-PCR.
- https://cdn.elifesciences.org/articles/89316/elife-89316-fig8-data1-v1.pdf
-
Figure 8—source data 2
Western blotting of TIAL1/TIAR expression in 5 days postpartum (dpp) mouse testes.
ACTB served as a loading control.
- https://cdn.elifesciences.org/articles/89316/elife-89316-fig8-data2-v1.pdf
Figure 8—figure supplement 1
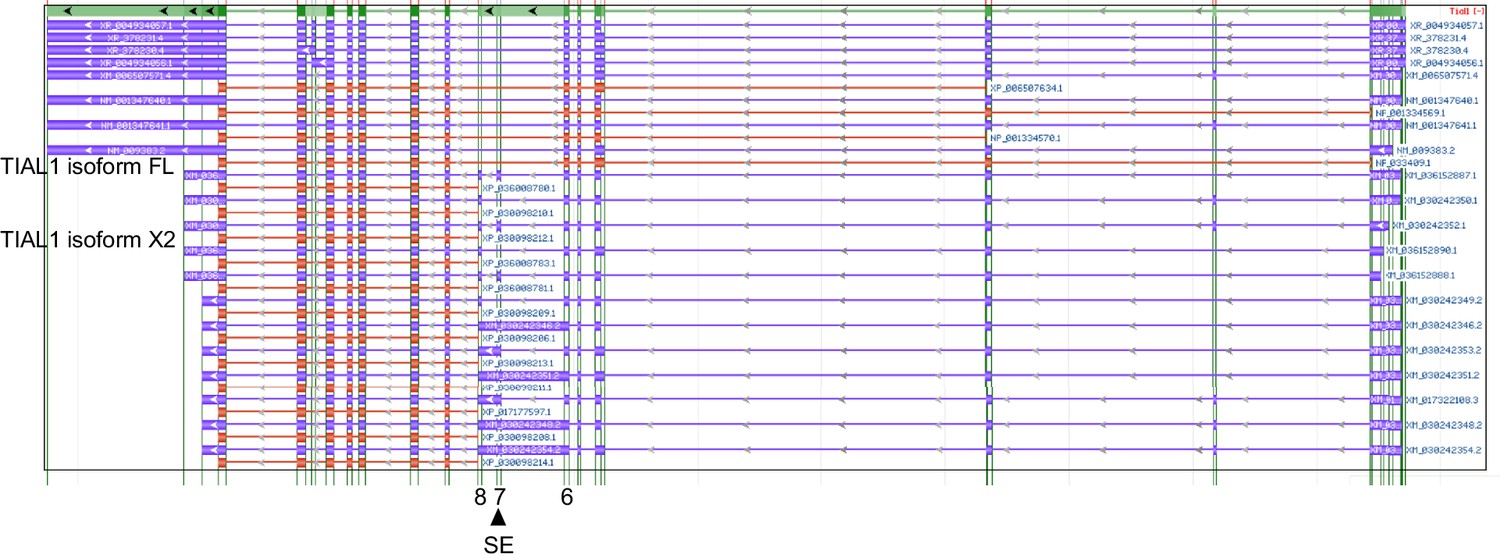
Transcription and translation information for Tial1/Tiar.
Transcription and translation information for Tial1/Tiar was obtained from genome data viewer.
Figure 9
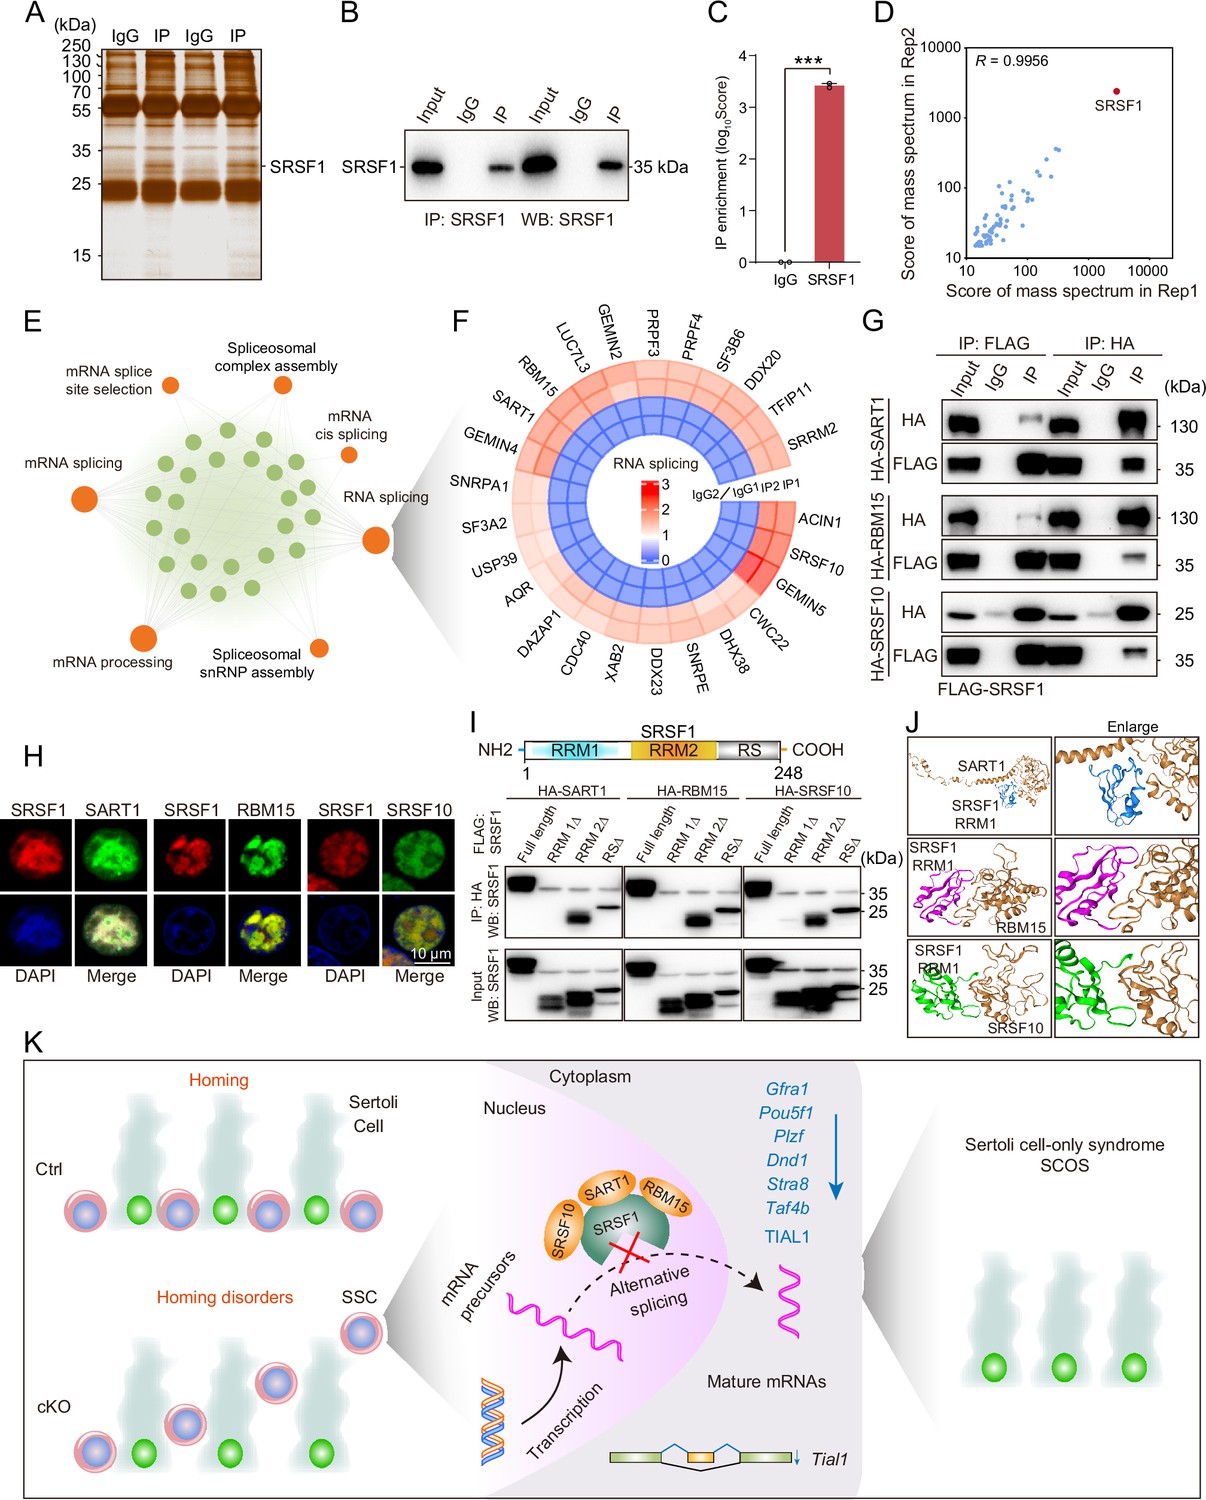
SRSF1 recruits alternative splicing (AS)-related proteins to modulate AS in testes.
(A) Silver-stained gel of SRSF1 and control immunoprecipitates from 5 days postpartum (dpp) mouse testis extracts. (B) IP experiment was performed in 5 dpp mouse testis extracts. (C) IP of SRSF1 from immunoprecipitation mass spectrometry (IP-MS) data. (D) Pearson’s correlation analysis showed the coefficient between the two samples for IP-MS data. (E) Network showing Gene Ontology (GO) enrichment analyses of SRSF1-binding proteins. (F) Circular heatmap of AS-related proteins. (G) Co-immunoprecipitation (Co-IP) experiment for detecting the SRSF1 association between SART1, RBM15, and SRSF10 in 293T cells. (H) SRSF1-mCherry cotransfected with SART1-eGFP, RBM15-eGFP, and SRSF10-eGFP 293T cells is shown. DNA was stained with DAPI. Scale bar, 10 μm. (I) Co-IP experiment for detecting the SRSF1-truncated protein association between SART1, RBM15, and SRSF10 in 293T cells. (J) A schematic diagram of protein interactions is shown. (K) Schematic illustration of the molecular mechanisms by which SRSF1 regulates homing of mouse precursor spermatogonial stem cells (SSCs).
-
Figure 9—source data 1
IP experiment was performed in 5 days postpartum (dpp) mouse testis extracts.
- https://cdn.elifesciences.org/articles/89316/elife-89316-fig9-data1-v1.pdf
-
Figure 9—source data 2
Co-immunoprecipitation (Co-IP) experiment for detecting the SRSF1 association between SART1, RBM15, and SRSF10 in 293T cells.
- https://cdn.elifesciences.org/articles/89316/elife-89316-fig9-data2-v1.pdf
-
Figure 9—source data 3
Co-immunoprecipitation (Co-IP) experiment for detecting the SRSF1-truncated protein association between SART1, RBM15, and SRSF10 in 293T cells.
- https://cdn.elifesciences.org/articles/89316/elife-89316-fig9-data3-v1.pdf
Additional files
-
Supplementary file 1
SRSF1 peak-containing genes identified through crosslinking immunoprecipitation and sequencing (CLIP-seq).
- https://cdn.elifesciences.org/articles/89316/elife-89316-supp1-v1.xlsx
-
Supplementary file 2
Differentially expressed genes were analysed in this study.
- https://cdn.elifesciences.org/articles/89316/elife-89316-supp2-v1.xls
-
Supplementary file 3
Alternative splicing (AS) events were analysed in conditional knockout (cKO) and Ctrl testes.
- https://cdn.elifesciences.org/articles/89316/elife-89316-supp3-v1.xlsx
-
Supplementary file 4
The SRSF1 interacting proteins were displayed through immunoprecipitation mass spectrometry (IP-MS).
- https://cdn.elifesciences.org/articles/89316/elife-89316-supp4-v1.xlsx
-
Supplementary file 5
Primer sequences were used in this study.
- https://cdn.elifesciences.org/articles/89316/elife-89316-supp5-v1.xlsx
-
Supplementary file 6
Antibodies were used in this study.
- https://cdn.elifesciences.org/articles/89316/elife-89316-supp6-v1.xlsx
-
Supplementary file 7
Mass spec data.
- https://cdn.elifesciences.org/articles/89316/elife-89316-supp7-v1.csv
-
MDAR checklist
- https://cdn.elifesciences.org/articles/89316/elife-89316-mdarchecklist1-v1.docx
Download links
A two-part list of links to download the article, or parts of the article, in various formats.
Downloads (link to download the article as PDF)
Open citations (links to open the citations from this article in various online reference manager services)
Cite this article (links to download the citations from this article in formats compatible with various reference manager tools)
Splicing factor SRSF1 is essential for homing of precursor spermatogonial stem cells in mice
eLife 12:RP89316.
https://doi.org/10.7554/eLife.89316.4


