Resident and recruited macrophages differentially contribute to cardiac healing after myocardial ischemia
- Medical Clinic I., Department of Cardiology, University Hospital, Ludwig Maximilian University, Germany
- Institute of Surgical Research at the Walter-Brendel-Centre of Experimental Medicine University, Germany
- DZHK (German Centre for Cardiovascular Research), Partner site Munich Heart Alliance, Germany
- Institut Pasteur, Unité Macrophages et Développement de l'Immunité, Département de Biologie du Développement et Cellules Souches, France
- LFE Bioinformatik, Department of Informatics, Ludwig Maximilian University, Germany
- Department of Neurology, Medical Faculty, Heinrich Heine University of Düsseldorf, Germany
- Institute of Pharmacology and Toxicology, Technical University Munich, Germany
- Immunology of Aging, Leibniz-Institute on Aging - Fritz-Lipmann-Institute (FLI), Germany
- Area of Cell & Developmental Biology, Centro Nacional de Investigaciones Cardiovasculares Carlos III, Spain
- Vascular Biology and Therapeutics Program and Department of Immunobiology, Yale University School of Medicine, United States
- Faculty of Biological Sciences, Friedrich-Schiller-University, Germany
- Department of Nuclear Medicine, Ludwig Maximilian University, Germany
- Simons Initiative for the Developing Brain, Centre for Discovery Brain Sciences, University of Edinburgh, United Kingdom
- University of Edinburgh Centre for Inflammation Research, The Queen's Medical Research Institute, United Kingdom
- Department of Immunopharmacology, Mannheim Institute for Innate Immunoscience (MI3), Medical Faculty Mannheim, Heidelberg University, Germany
Figures
Figure 1
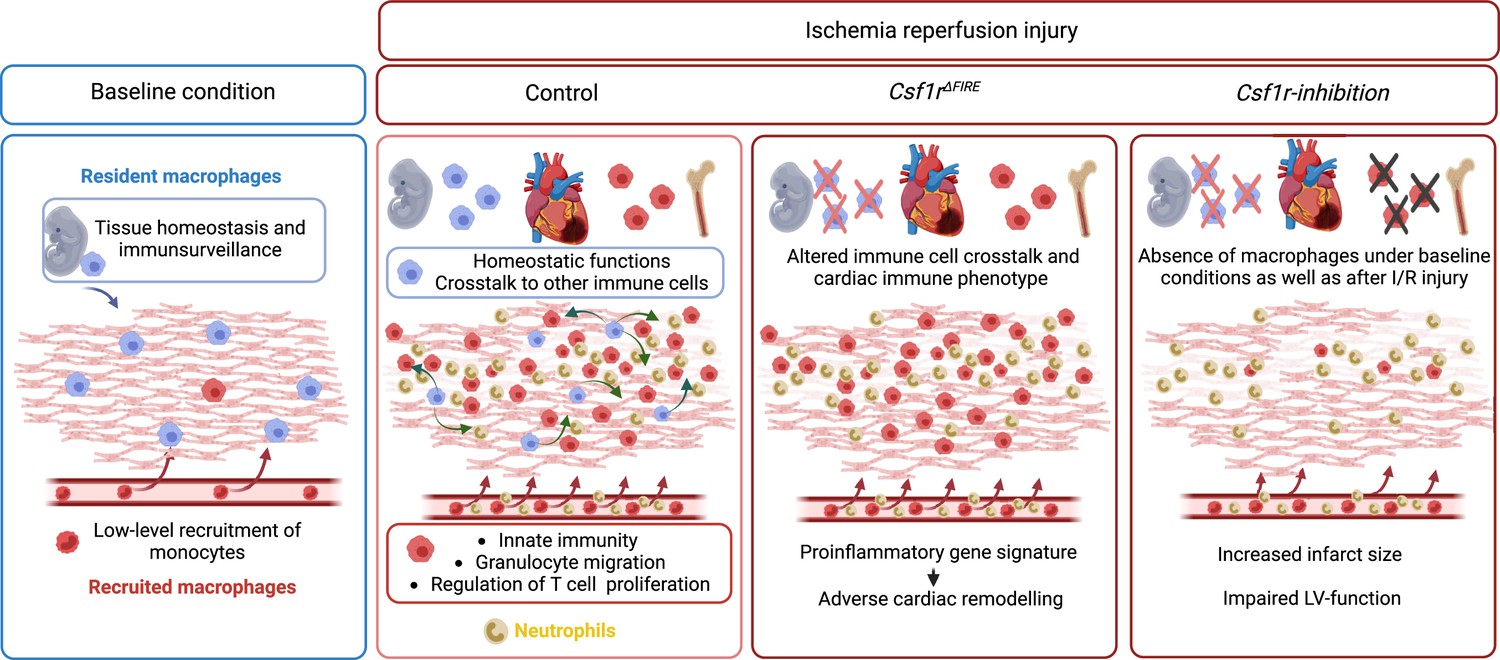
Graphical abstract.
Figure 2 with 2 supplements
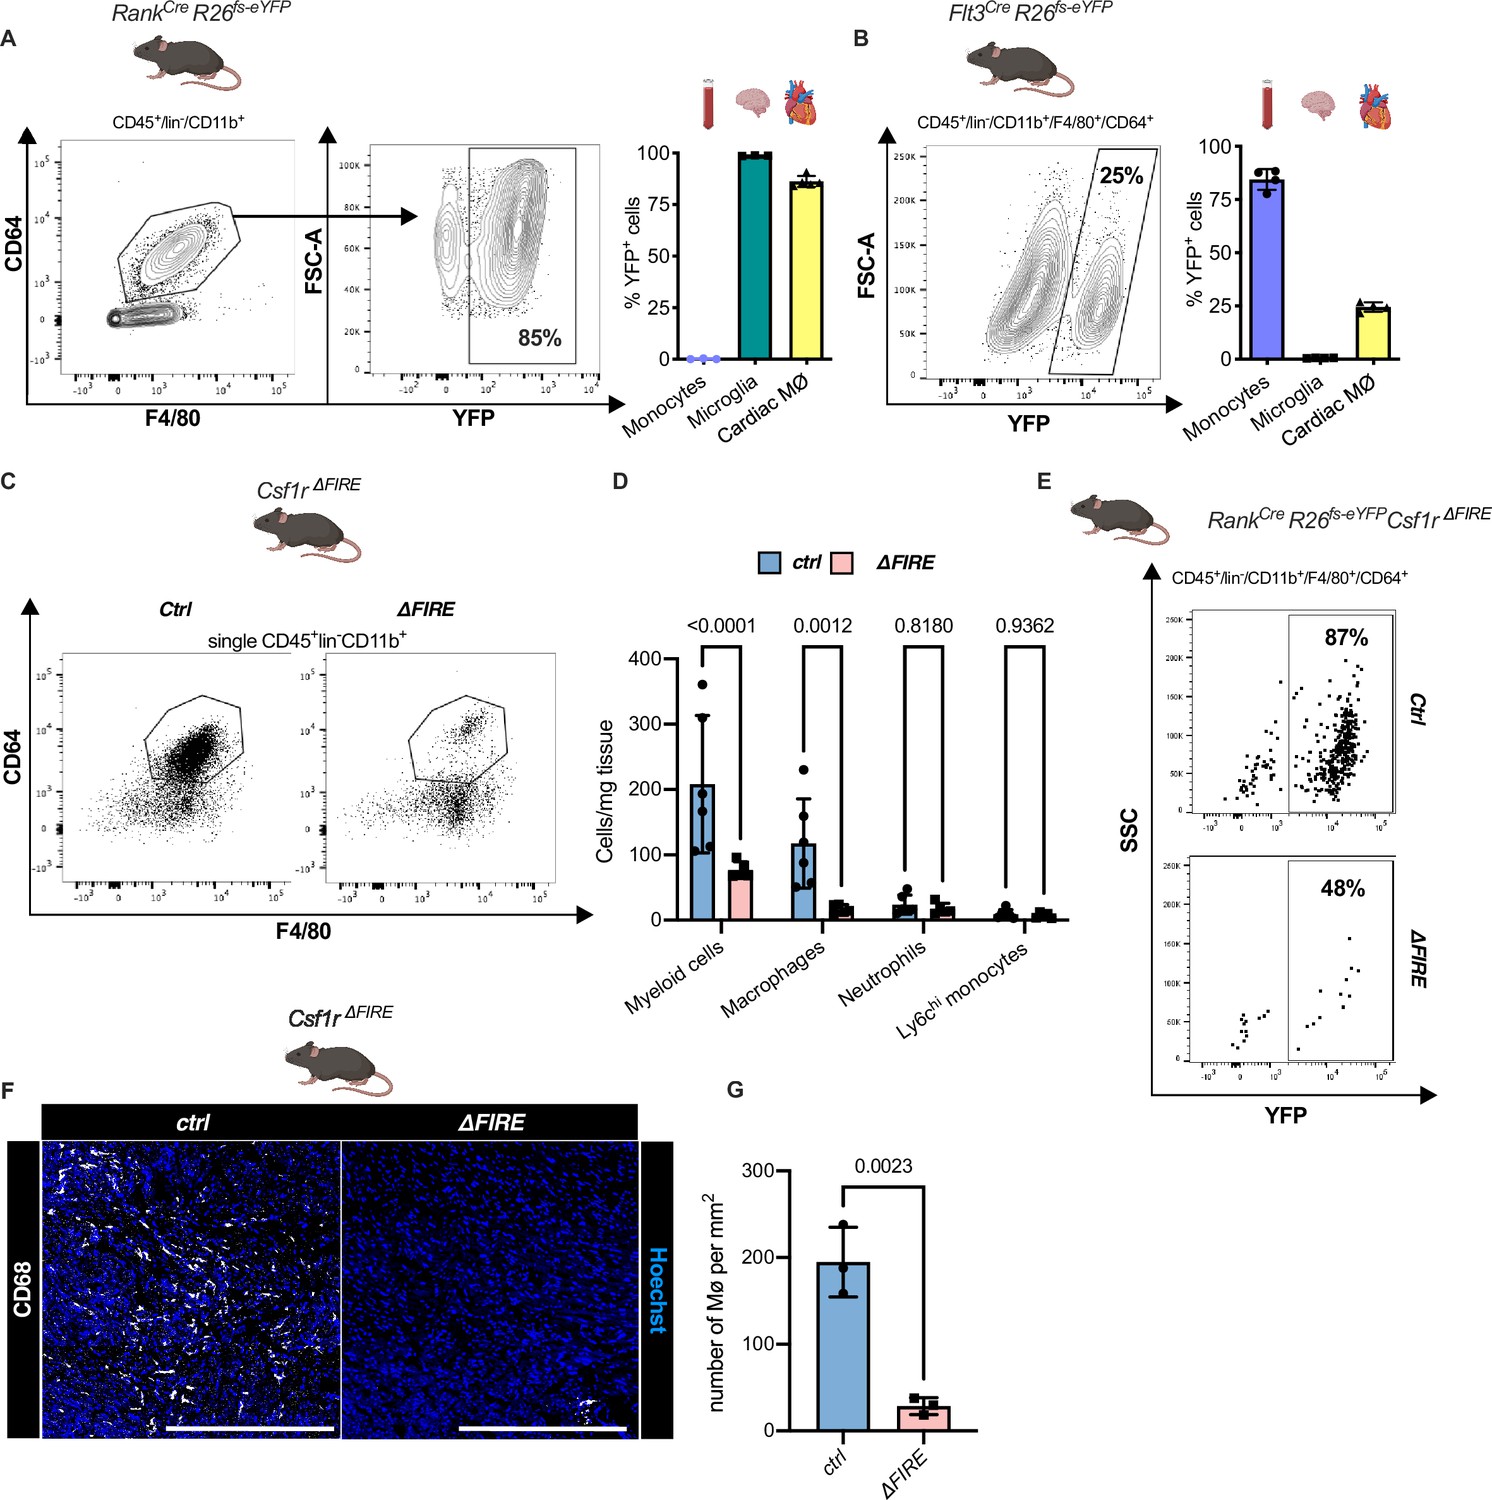
Absence of resident cardiac macrophages in Csf1r∆FIRE mice.
(A) Flow cytometry analysis of 3-month-old Tnfsf11aCreRosa26fs-eYFP mice, showing single/CD45+/lin-(CD11c, Ter119, Tcrß, Nk1.1)/CD11b+ cardiac cells, eYFP expression in macrophages (CD64+/F4/80+) and percentage of eYFP+ blood monocytes, microglia and cardiac macrophages (n = 3–5 each from an independent experiment). (B) Flow cytometry analysis of 3-month-old Flt3CreRosa26fs-eYFP mice, showing macrophage expression of eYFP and percentage of eYFP+ blood monocytes, microglia, and cardiac macrophages (n = 4 each from an independent experiment). (C) Representative flow cytometry analysis of cardiac macrophages in control and ∆FIRE mice. (D) Quantification of myeloid cells by flow cytometry (CD45+/lin−/CD11b+), macrophages (CD45+/lin−/CD11b+/CD64+/F4/80+), neutrophils (CD45+/lin−/CD11b+/CD64−/F4/80−/Ly6g+), and Ly6chi monocytes (CD45+/lin−/CD11b+/CD64−/F4/80−/Ly6g−/Ly6chi) (n = 6 for control and n = 5 for ∆FIRE mice, each single experiments). (E) Representative flow cytometry analysis of cardiac macrophages and their expression of eYFP in Csf1rΔFIRE/+Tnfsf11aCreRosa26fs-eYFP and Csf1rΔFIRE/ΔFIRETnfsf11aCreRosa26fs-eYFP. (F) Representative immunohistological images showing macrophages (CD68+ cells in white and Hoechst in blue) in control and ∆FIRE hearts in 3-month-old mice at baseline conditions (scale bars represent 500 µm). (G) Quantification of macrophages by histology (n = 3 for control and ∆FIRE mice). Either Fisher's Least Significant Difference (LSD) test or unpaired t-test was performed and mean ± standard deviation (SD) is shown.
Figure 2—figure supplement 1
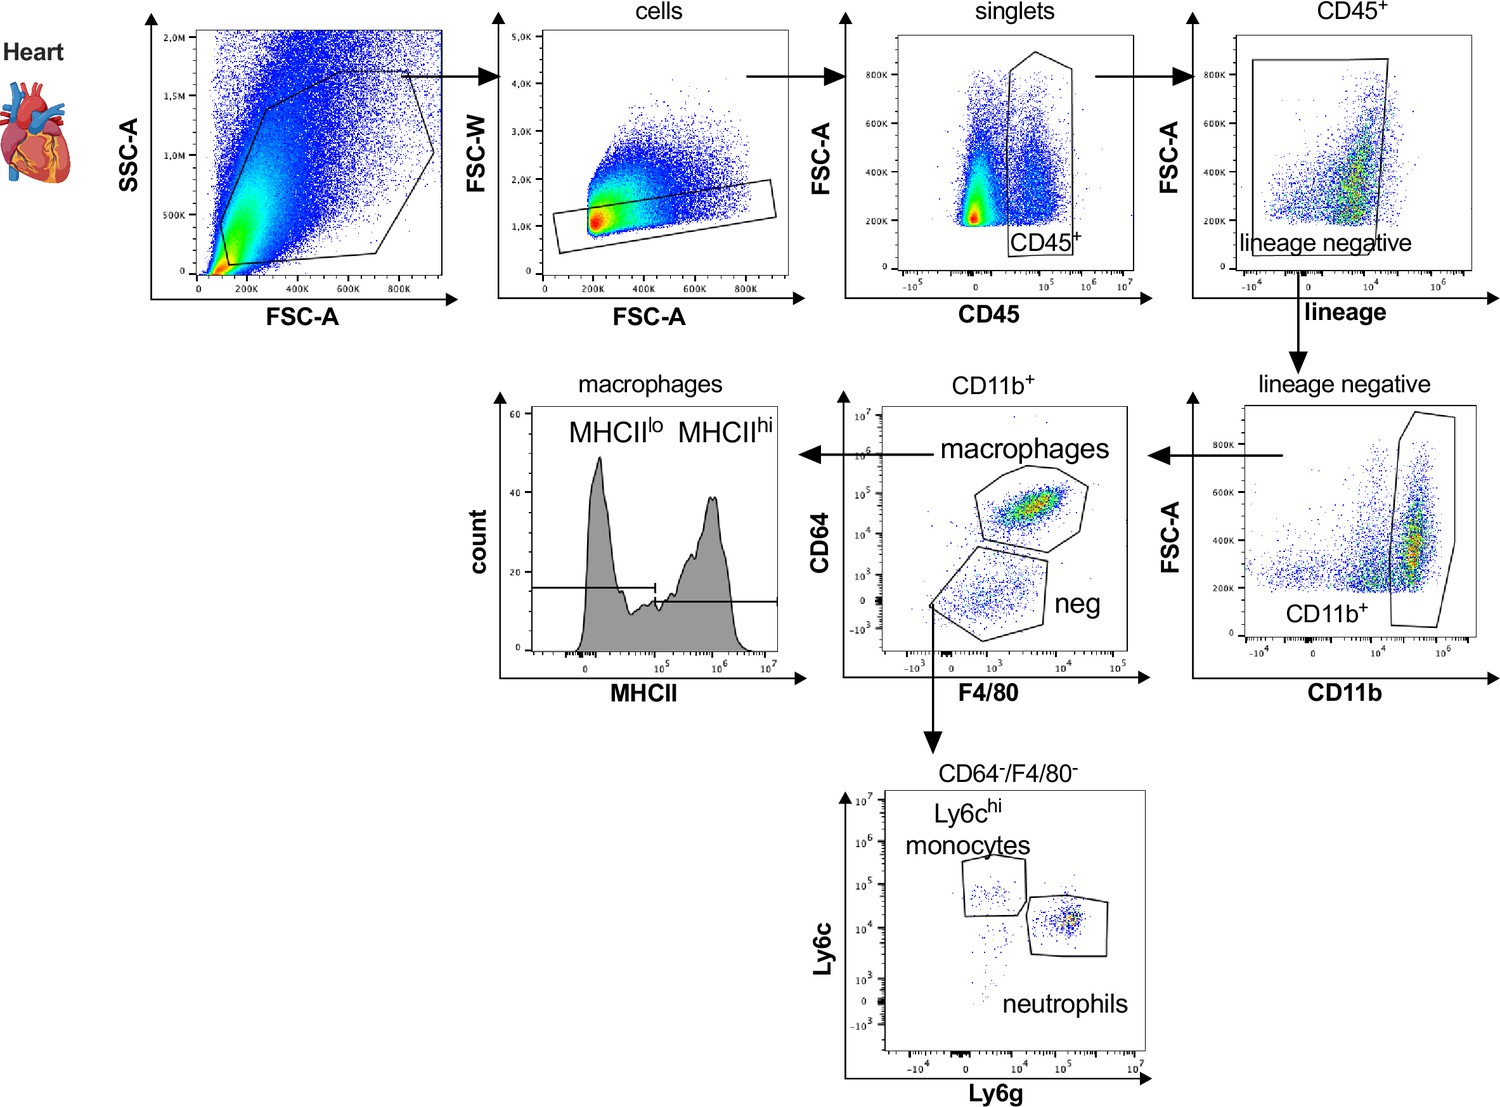
Gating strategy for cardiac myeloid immune cells.
Cardiac myeloid immune cells are gated as single, CD45+, lin− (CD11c, Ter119, Tcrß, Nk1.1), CD11b+ cells. Macrophages are further characterized as CD64+, F4/80+ cells with either high or low expression of MHCII, neutrophils as CD64−, F4/80−, Ly6g+, and Ly6chi, monocytes as CD64−, F4/80−, Ly6g−, Ly6chi.
Figure 2—figure supplement 2
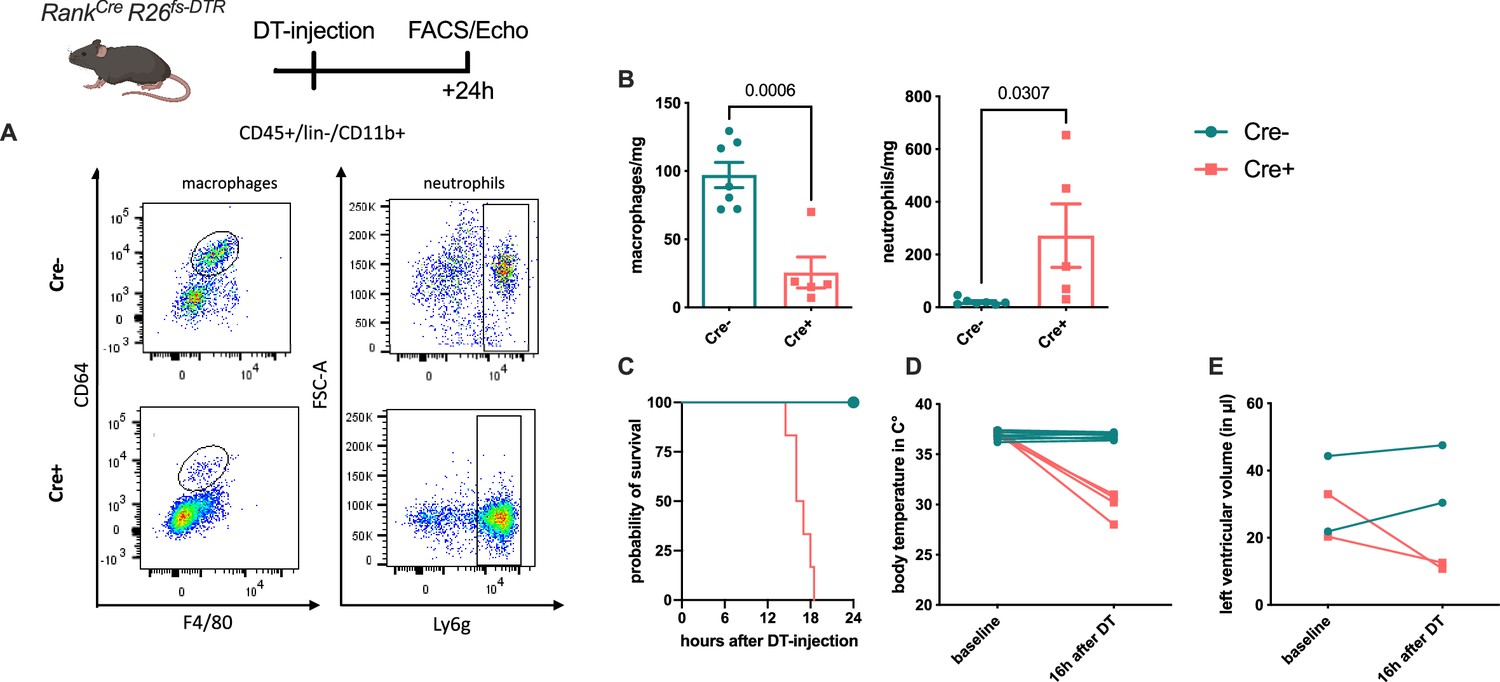
Diphtheria toxin (DT)-mediated depletion of erythro-myeloid progenitor (EMP)-derived macrophages in Tnfsf11aCreRosa26fs-DTR mice.
EMP-derived macrophages were depleted using a single DT-injection and analyzed after reaching the termination criteria determined in the ethical regulations (e.g. activity, body score). (A, B) Macrophages and neutrophils were gated as single, CD45+, lin−, CD11b+, and CD64+/F4/80+ or Ly6g+ cells, respectively. (C) Survival curve of Cre− (n = 4) and Cre+ (n = 6) mice after DT-injection. (D) Body temperature and (E) left ventricular diastolic volume at baseline and 16 hr after DT-injection in Cre− and Cre+ mice.
Figure 3 with 3 supplements
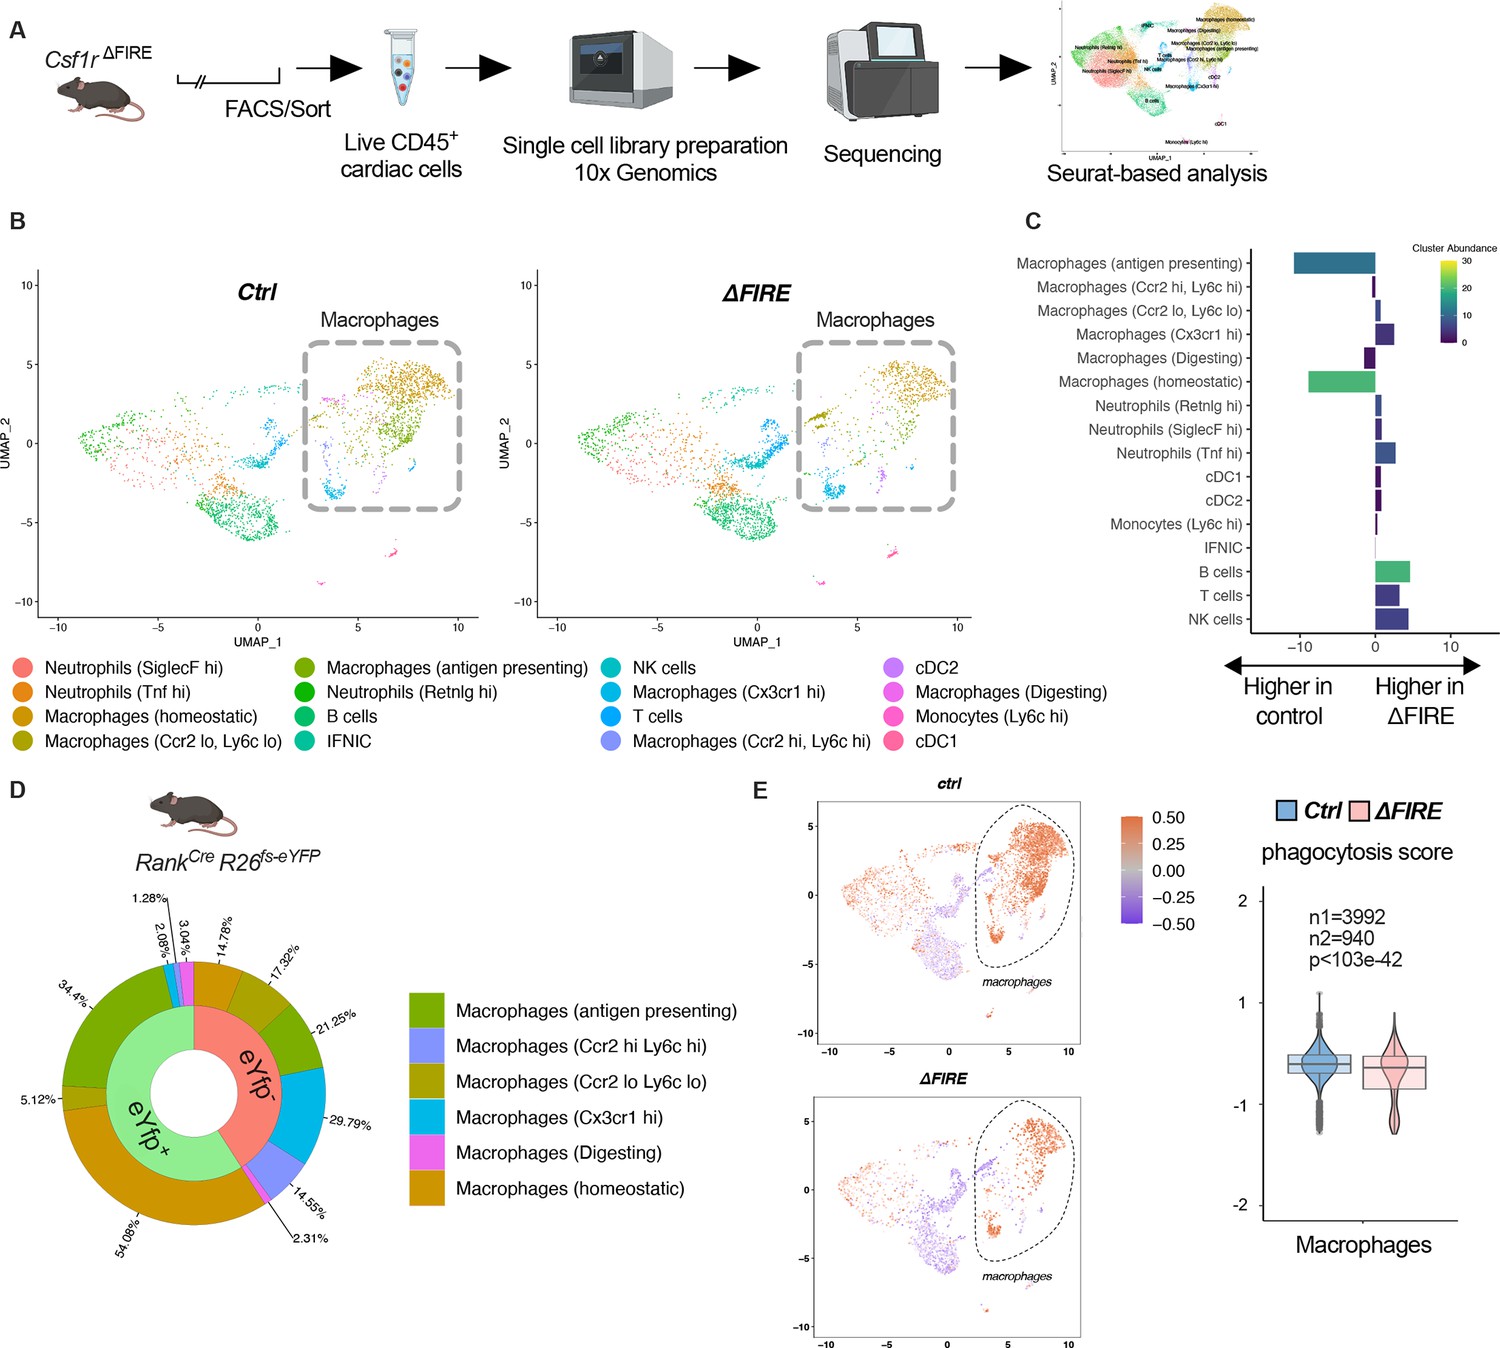
Changes in the cardiac immune phenotype in Csf1rΔFIRE mice in baseline conditions.
(A) Experimental setup to analyze cardiac immune cells using scRNA-seq of sorted CD45+/live cells. (B) UMAPs (Uniform Manifold Approximation and Projection) of control and ∆FIRE in baseline conditions (n = 3 for control and ∆FIRE). (C) Absolute difference (percentage points) in cluster abundance between control and ∆FIRE. (D) Contribution of erythro-myeloid progenitor (EMP)-derived (eYfp expressing) macrophages to the different macrophage clusters analyzed by scRNA-seq analysis of immune cells harvested from a Tnfsf11aCreRosa26fs-eYFP mouse. (E) Phagocytosis score projected on a UMAP displaying control and ∆FIRE immune cell subsets. Violin and box plots show the computed phagocytosis score combined in all macrophage clusters (n1/n2 represents number of cells from control/∆FIRE mice).
Figure 3—figure supplement 1
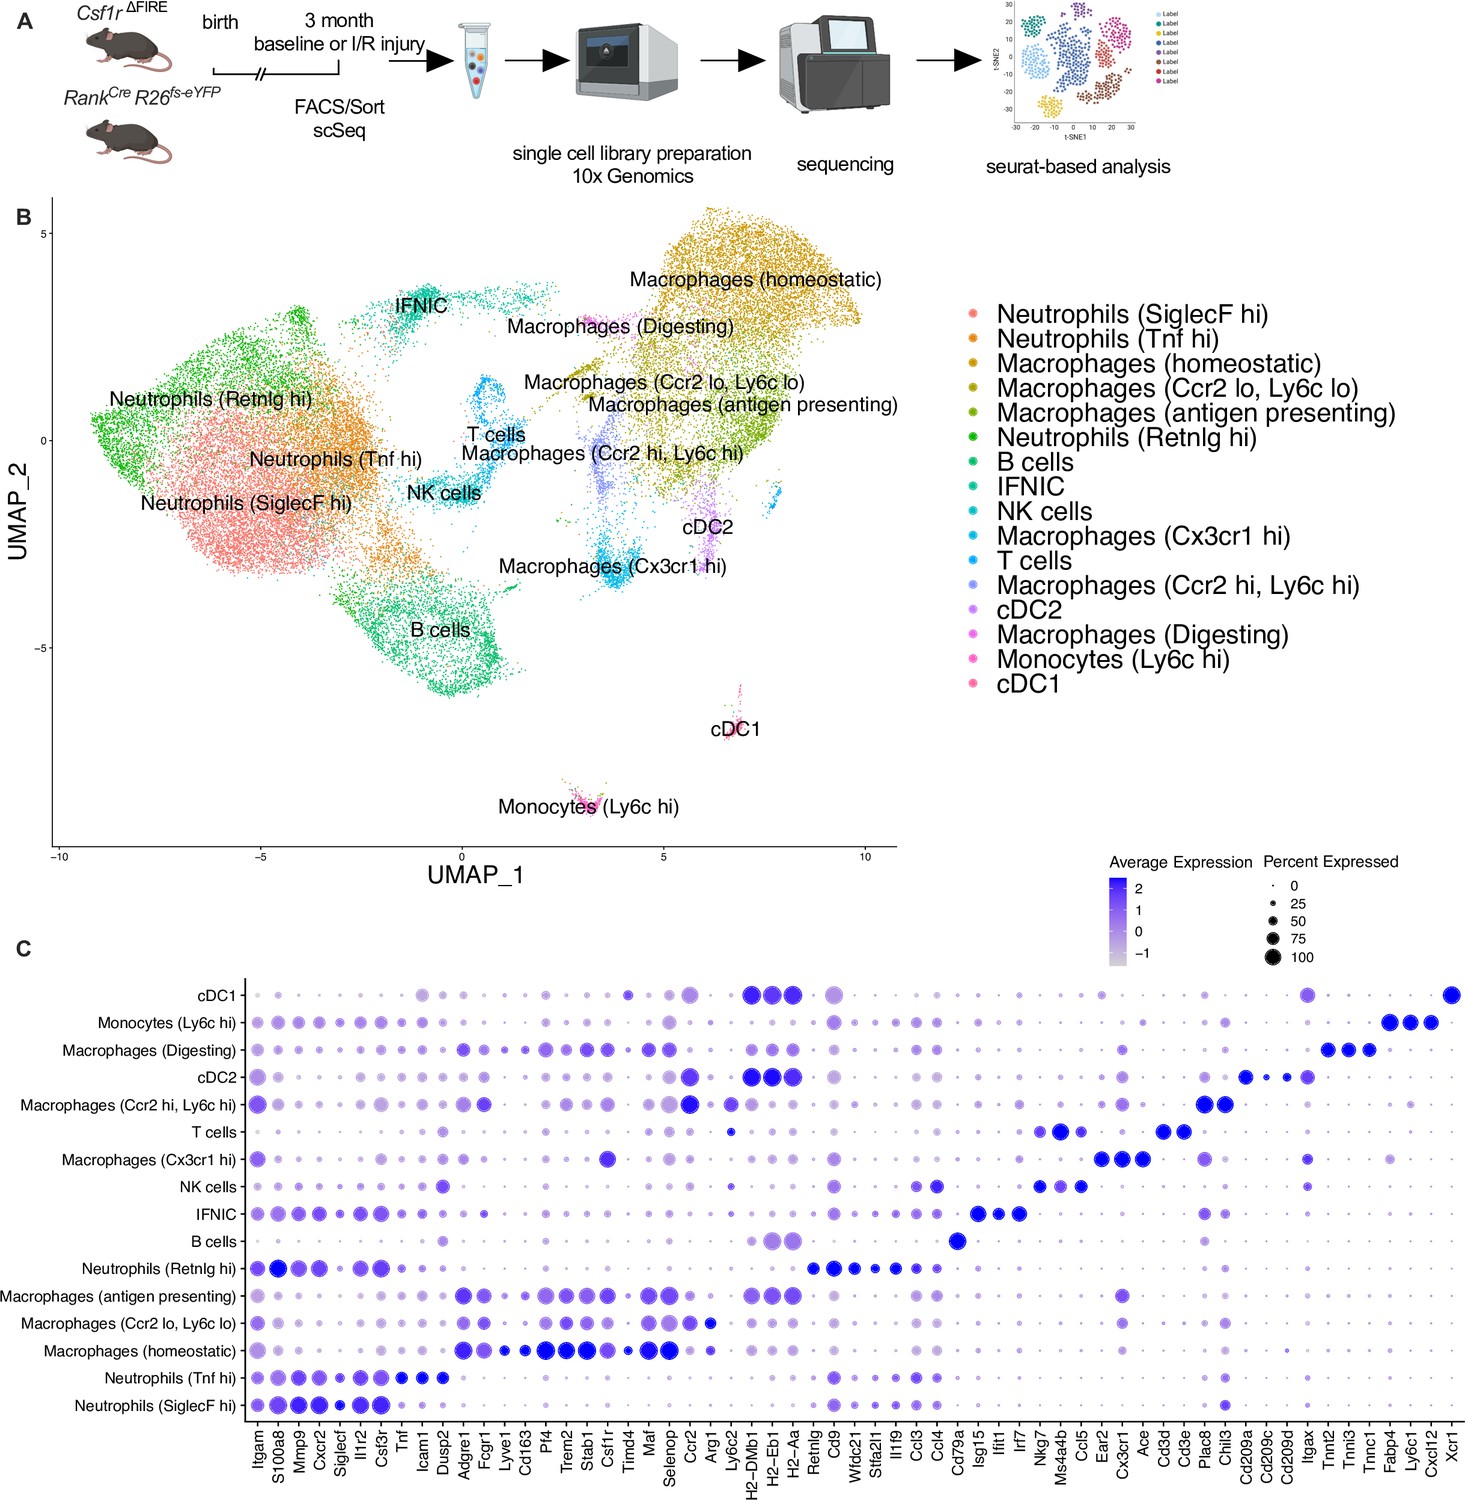
Clustering of cardiac immune cells in single-cell RNA analysis.
(A) The whole cardiac immune cell population (single/live/CD45+ cells) of Csf1rΔFIRE and Tnfsf11aCreRosa26fs-eYFP mice were sorted using fluorescence-activated cell sorting (FACS) and single-cell library preparation was performed on the 10× platform (n = 3 for Csf1r∆FIRE/+ and Csf1r∆FIRE/∆FIRE in baseline conditions; n = 1 for Tnfsf11aCreRosa26fs-eYFP in baseline conditions; n = 3 for Csf1r∆FIRE/+ and Csf1r∆FIRE/∆FIRE 2 days after ischemia/reperfusion (I/R) injury; in mice subjected to I/R injury macrophages were harvested from the ischemic tissue). (B) In total 35,759 cells (13,148 cells in baseline and 22,611 cells after I/R injury d2) were analyzed. Using Seurat-based clustering we identified 16 different immune clusters. Marker genes for each individual cluster are depicted in (C).
Figure 3—figure supplement 2
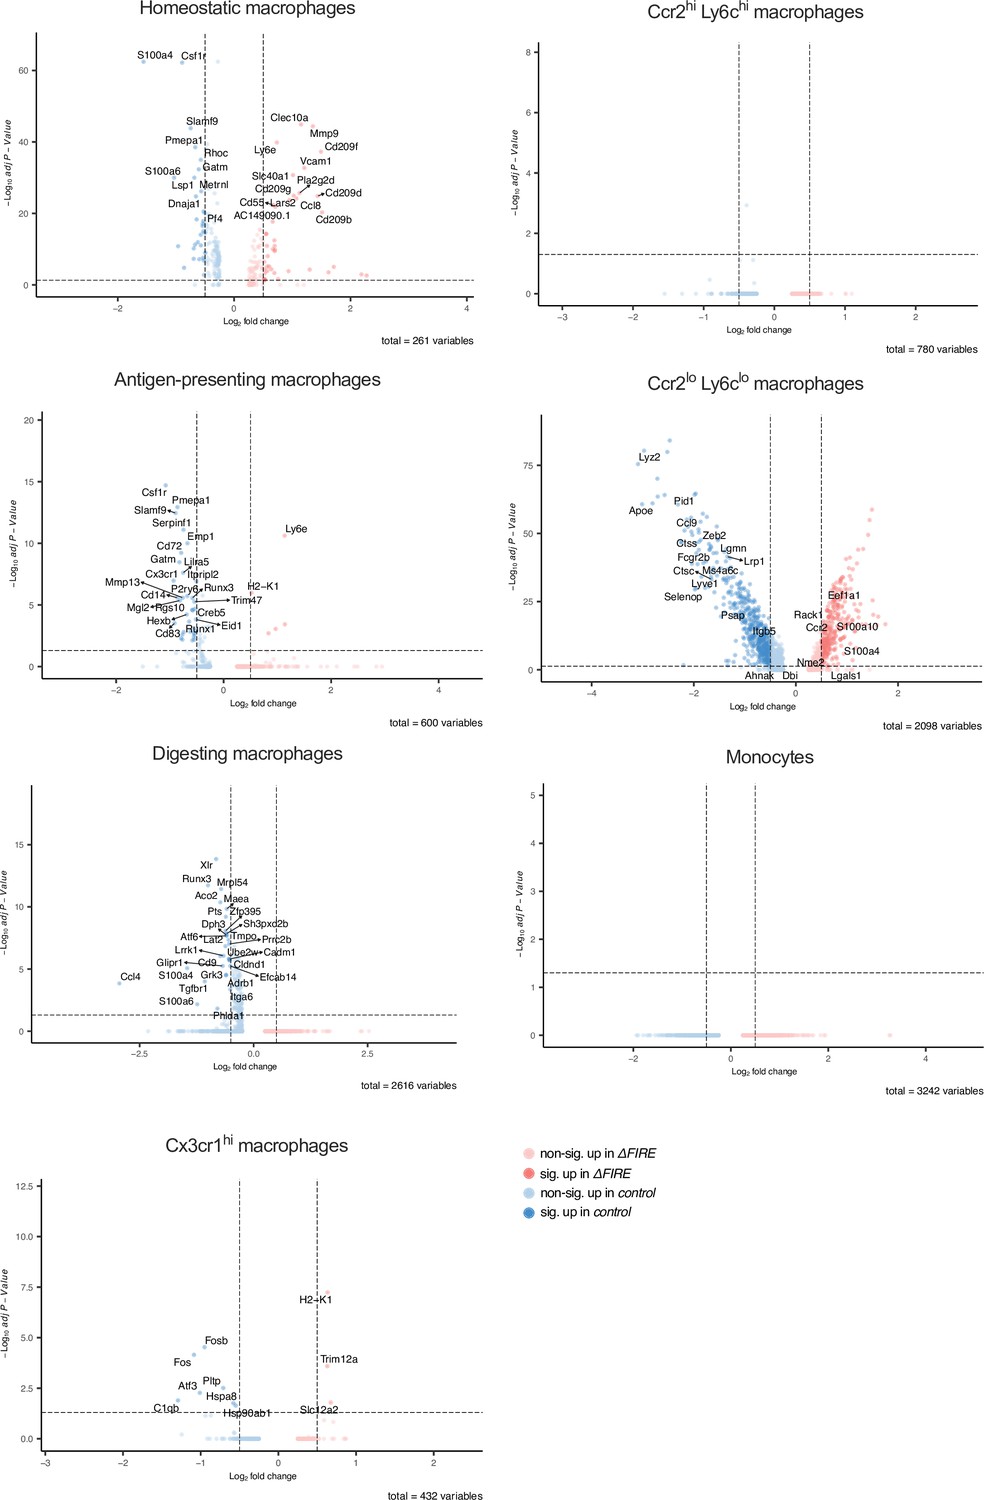
Differential gene expression in monocyte and macrophage clusters in baseline conditions in control and ΔFIRE mice.
Figure 3—figure supplement 3
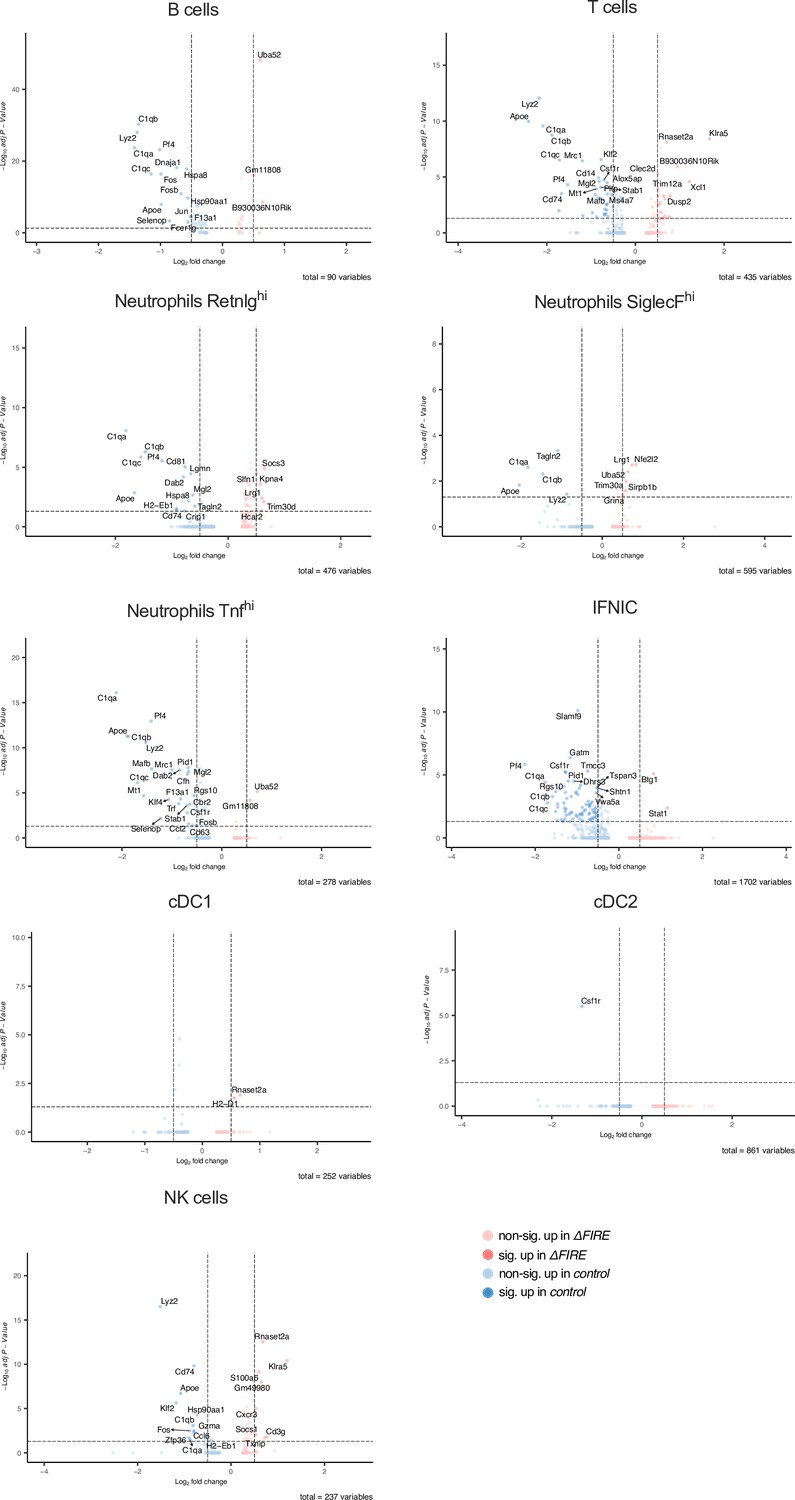
Differential gene expression in non-macrophage clusters in baseline conditions in control and ΔFIRE mice.
Figure 4
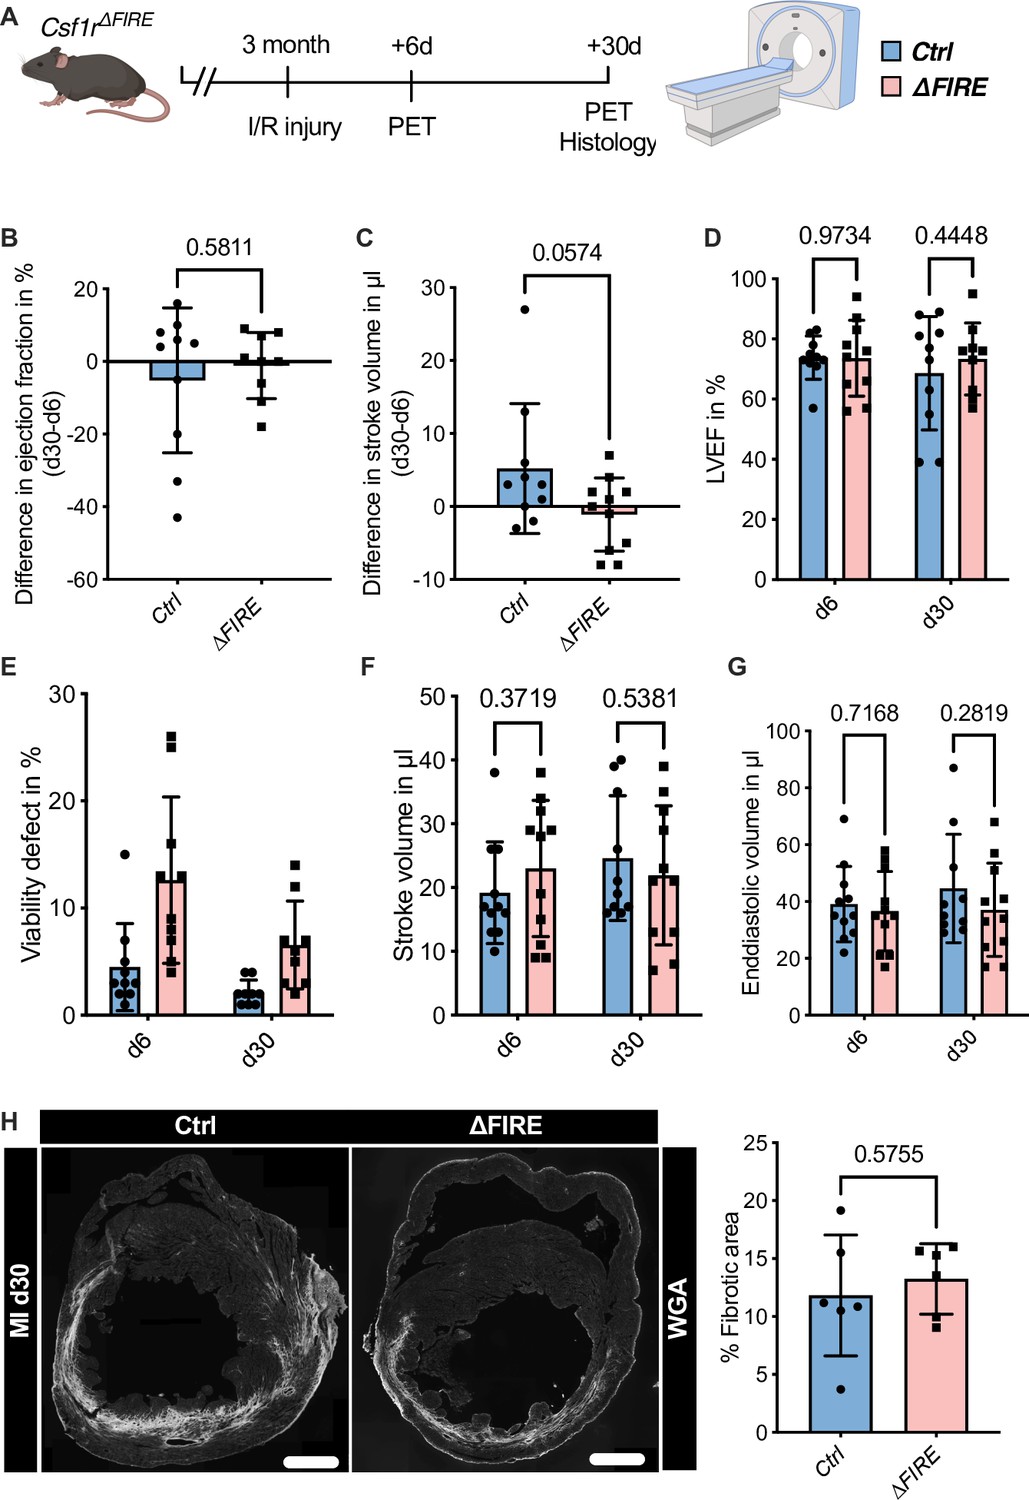
Adverse cardiac remodeling in Csf1r∆FIRE mice after ischemia/reperfusion (I/R) injury.
(A) Schematic of the sequential analysis of cardiac function, dimensions, and viability using positron emission tomography 6 and 30 days after I/R injury in control and ∆FIRE with (B, C) showing the intraindividual changes in each parameter from d6 to d30 and (D–G) the individual time points on d6 and d30 (d6: n = 11 for control and ∆FIRE, d30: n = 10 for control and n = 11 for ∆FIRE). (B, D) left ventricular ejection fraction (LVEF), (C, E) percentage of the viability defect, (F) stroke volume, and (G) left ventricular end-diastolic volume. (H) Representative immunohistological images showing the fibrotic area (WGA+ area) in hearts from control and ΔFIRE mice 30 days after I/R injury. Right panel shows the percentage of fibrotic area in the respective groups (n = 6 for each group). Student’s t-test was performed and mean ± standard deviation (SD) is shown.
Figure 5
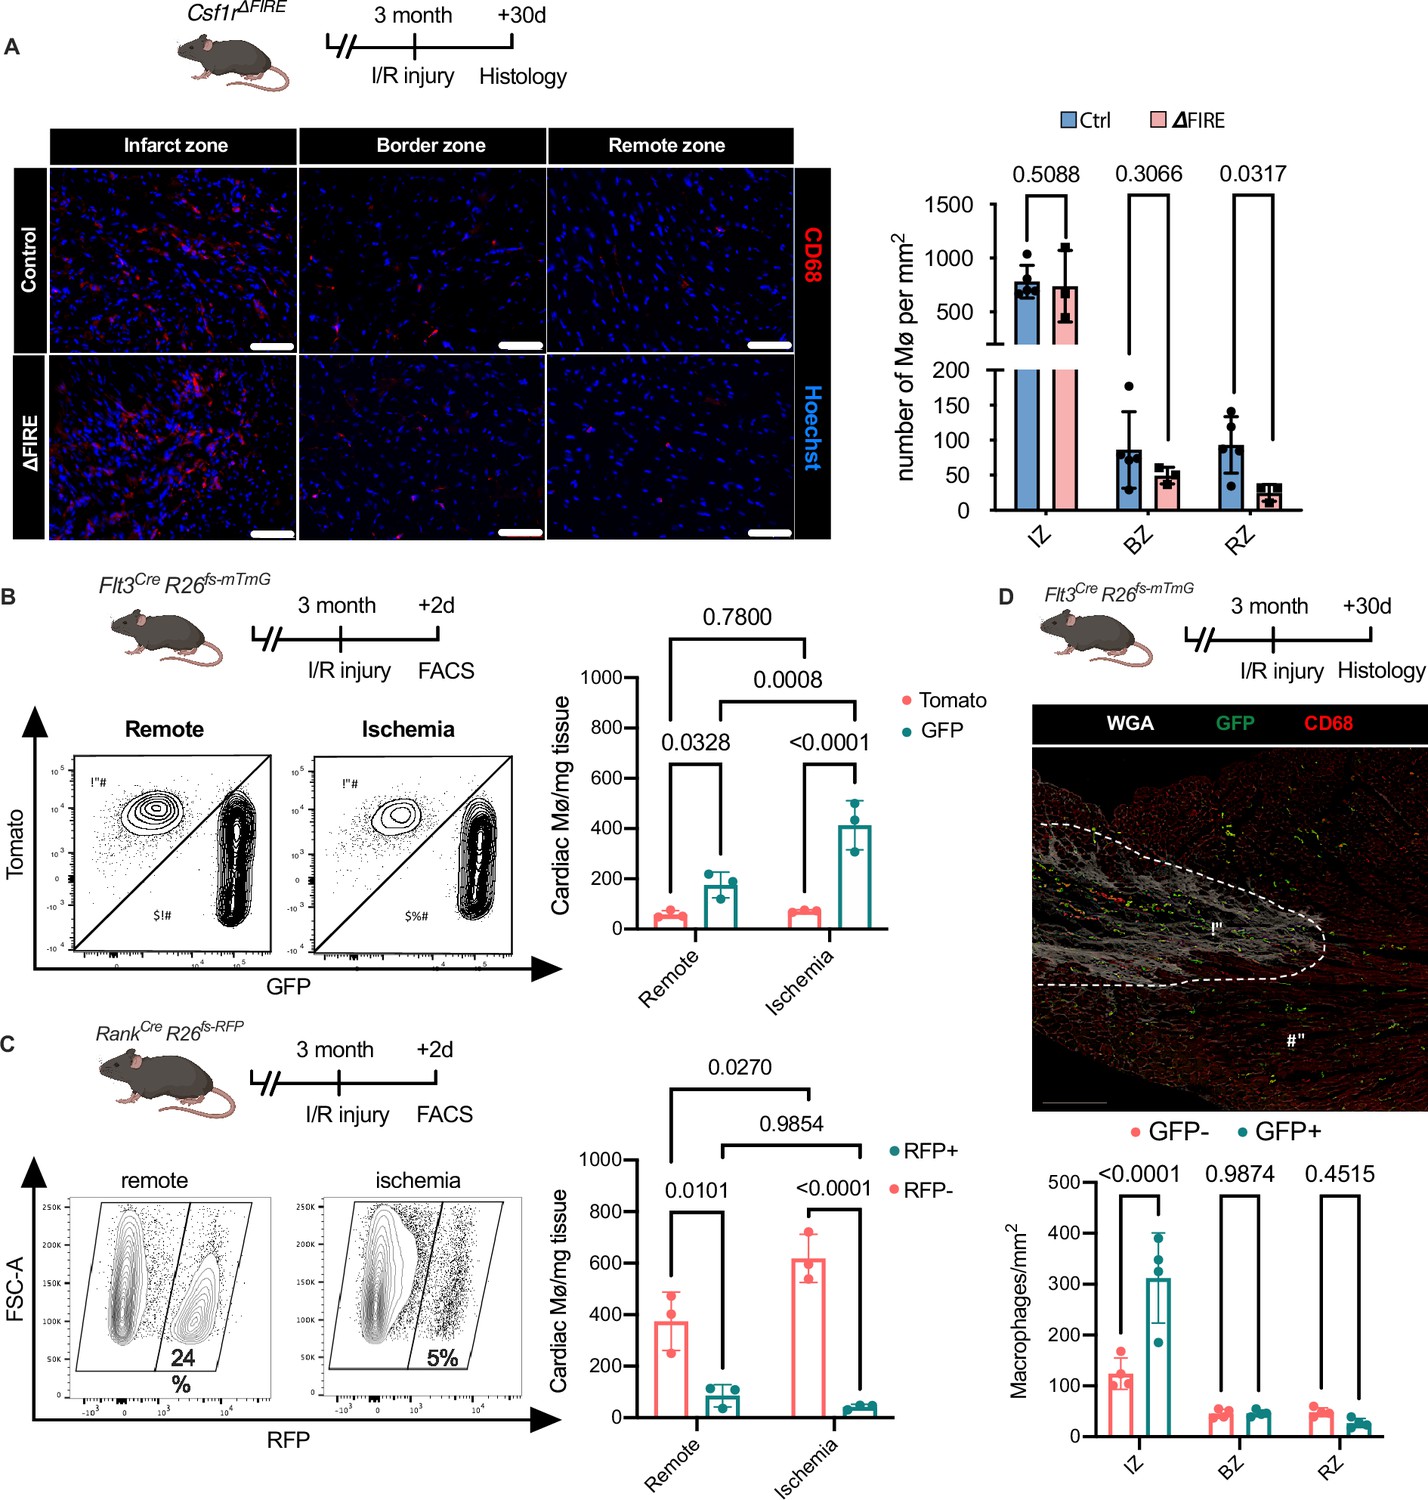
Recruitment of BM-derived macrophages into infarct zone of Csf1r∆FIRE mice.
(A) Representative immunohistology of hearts from ∆FIRE mice 30 days after ischemia/reperfusion (I/R) injury showing macrophages (CD68+ cells in red and Hoechst in blue) in the infarct, border and remote zone. Right panel shows number of cardiac macrophages in the respective area (n = 5 control and n = 3 for ∆FIRE). (B) Flow cytometry analysis of Flt3CreRosa26fs-mT/mG mice 2 days after I/R injury, (left) representative flow cytometry showing expression of tomato and GFP in macrophages in the remote and ischemic myocardium and (right) number of tomato+ and GFP+ cardiac macrophages in the respective area (n = 3, each individual experiment). (C) Flow cytometry analysis of Tnfsf11aCreRosa26RFP mice 2 days after I/R injury, (left) representative flow cytometry showing expression of RFP in macrophages in the remote and ischemic myocardium and (right) number of RFP− and RFP+ cardiac macrophages in the respective area (n = 3, each individual experiment). (D) Histological analysis of Flt3CreRosa26fs-mT/mG mice 30 days after I/R injury in the infarct, border, and remote zones, (left) representative immunohistology of the infarct and border zones and (right) number of GFP− and GFP+ cardiac macrophages in the respective areas (n = 4). Fisher’s Fisher's Least Significant Difference (LSD) test was performed for all experiments and mean ± standard deviation (SD) is shown.
Figure 6
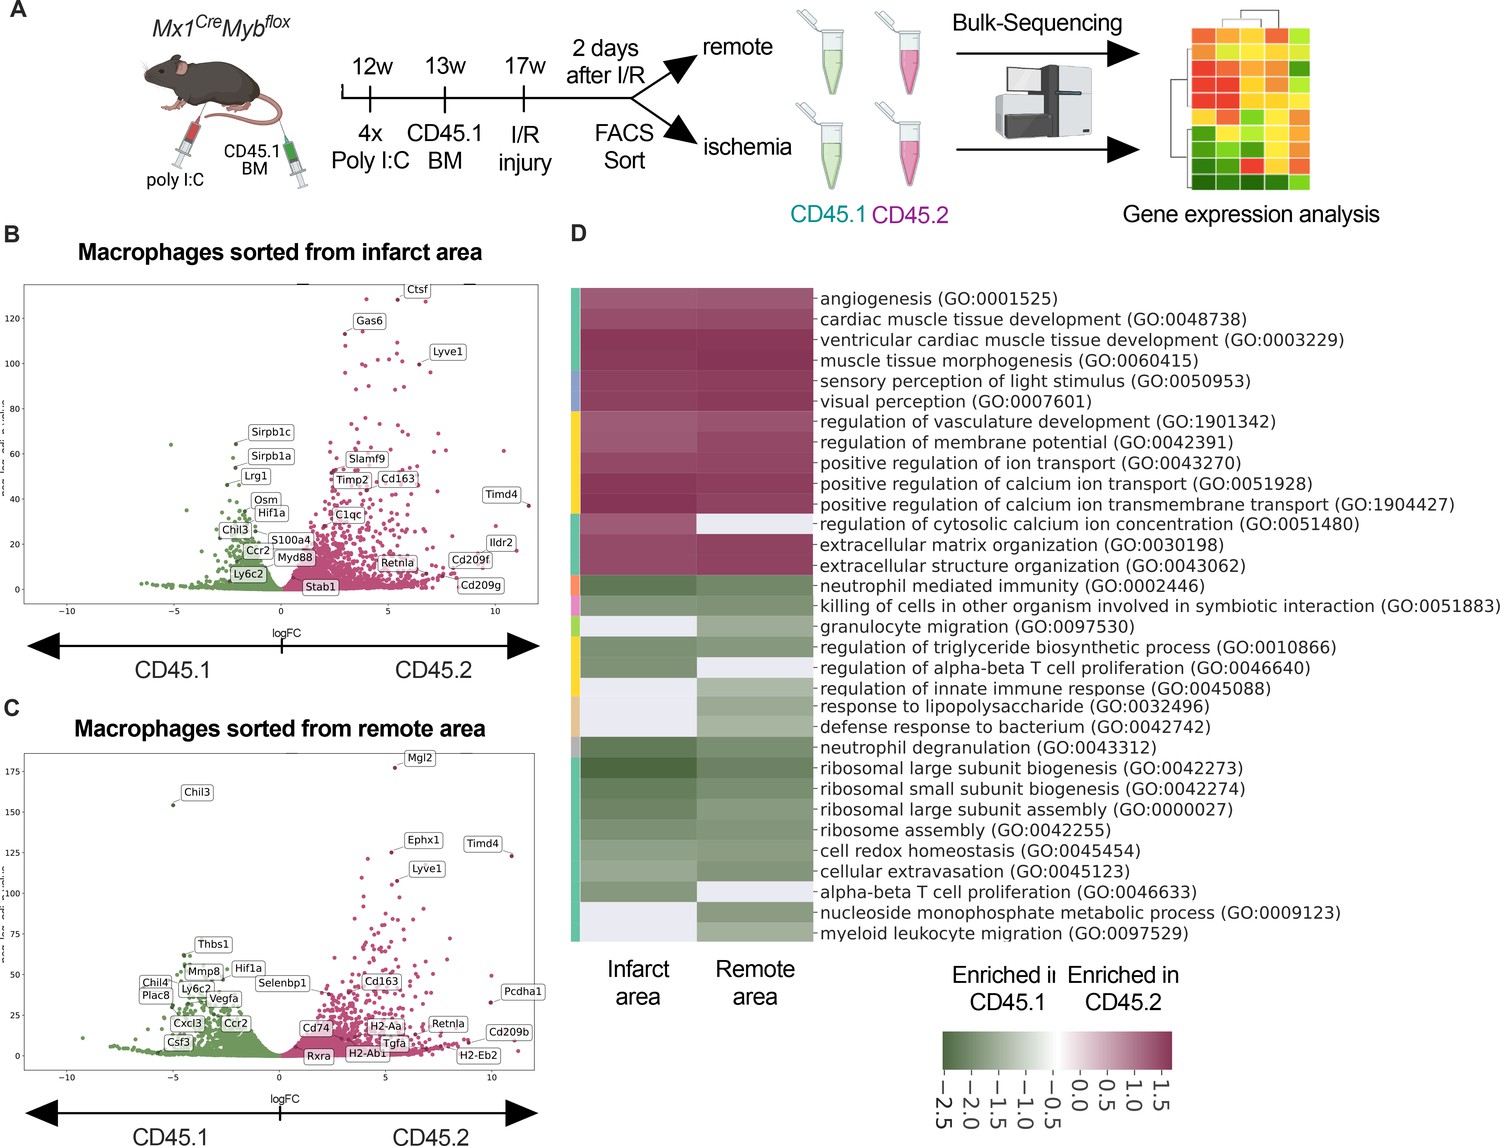
Transcriptional landscape of resident versus recruited macrophages in ischemia/reperfusion (I/R) injury.
(A) Experimental setup to generate non-irradiation BM chimera using CD45.2 Mx1CreMybflox/flox and transplantation of CD45.1 BM. I/R injury was induced 4 weeks after BM transplantation and CD45.1+ and CD45.2+ macrophages were sorted from the remote and ischemic myocardium 2 days after I/R injury and RNA-sequencing was performed on bulk cells (n = 3). Volcano plot showing differential gene expression analysis results of recruited CD45.1 versus resident CD45.2 macrophages in the (B) remote and (C) ischemic zones. (D) Gene ontology enrichment analysis showing specific biological processes enriched in CD45.1 and CD45.2 macrophages in the ischemic and remote zones.
Figure 7 with 5 supplements
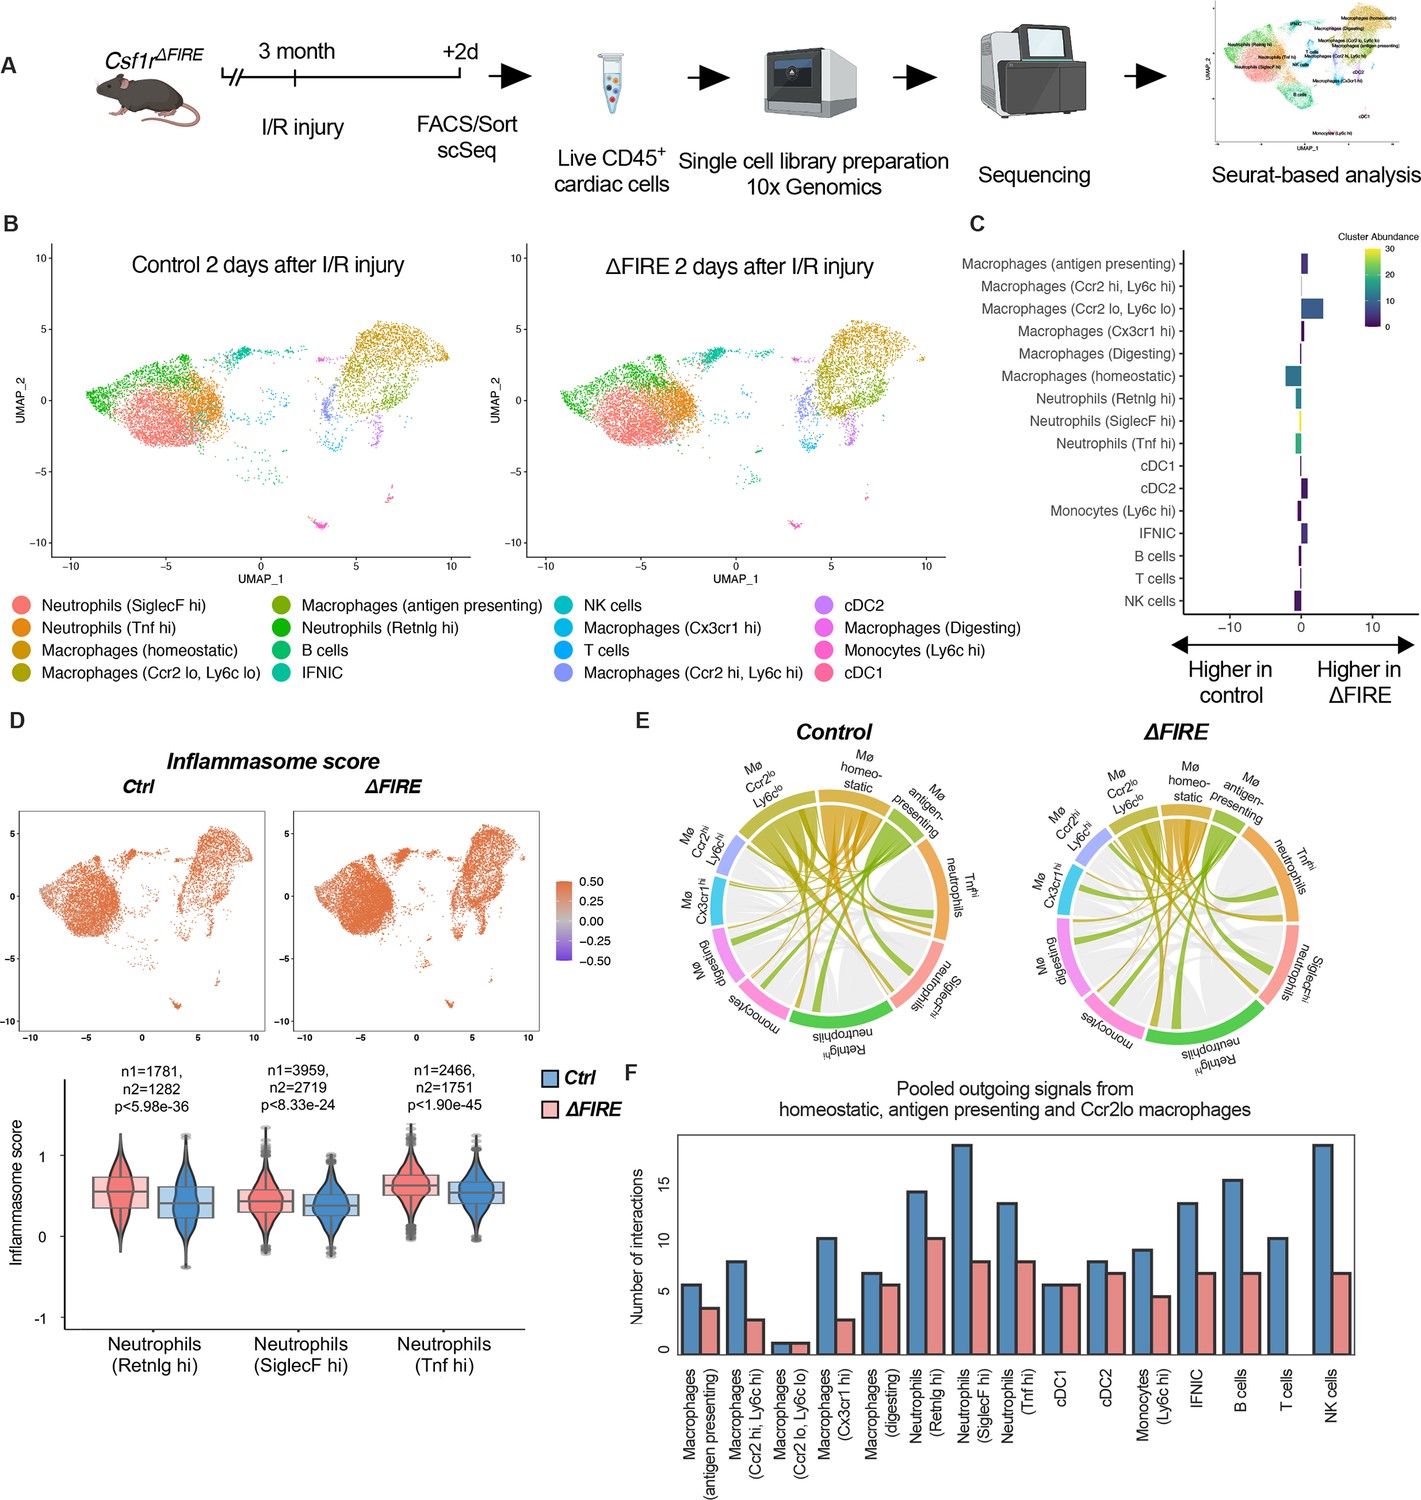
Altered inflammatory patterns and immune cell communication in Csf1r∆FIRE mice.
(A) Experimental setup to analyze transcriptional changes in cardiac immune cells on a single-cell level 2 days after ischemia/reperfusion (I/R) injury in ΔFIRE mice. (B) UMAPs of control and ∆FIRE 2 days after I/R injury (n = 2 for control and ∆FIRE). (C) Absolute difference (percentage points) in cluster abundance between control and ∆FIRE. (D) Inflammasome score projected on a UMAP displaying control and ∆FIRE immune cell subsets after I/R injury. Violin and box plots show the computed inflammasome score in neutrophil clusters (n1/n2 represents number of cells from control/ ∆FIRE mice). (E) Ligand–receptor interactions of antigen-presenting, Ccr2lo ly6clo and homeostatic macrophages (highlighted) with other immune cell clusters. Shown are the aggregated communication scores (width of interactions) for all cell types. Only communication scores larger than 6 are considered. (F) Number of interactions (with communication score >6) outgoing from homeostatic, antigen-presenting and Ccr2lo macrophages to other immune cell clusters.
Figure 7—figure supplement 1
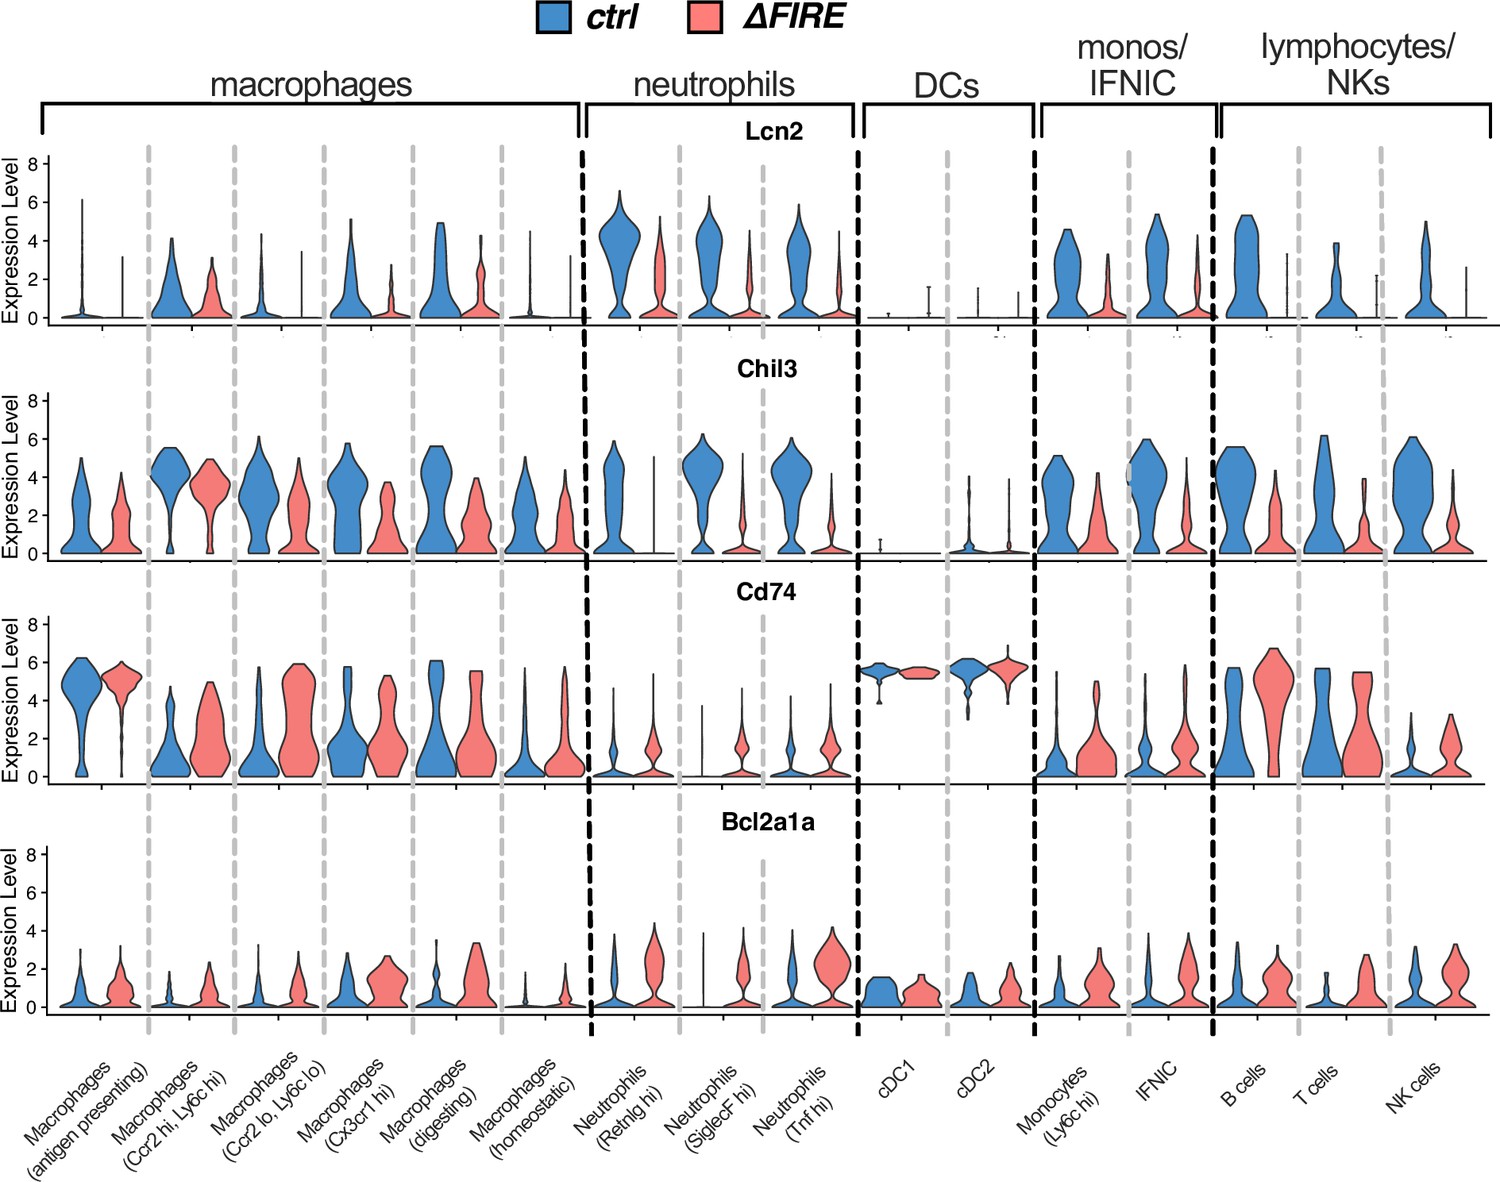
Violin plots comparing expression of Lcn2, Chil3, Cd74, and Bcl2a1a in the different immune cell clusters after ischemia/reperfusion (I/R) in control and ∆FIRE mice.
Figure 7—figure supplement 2
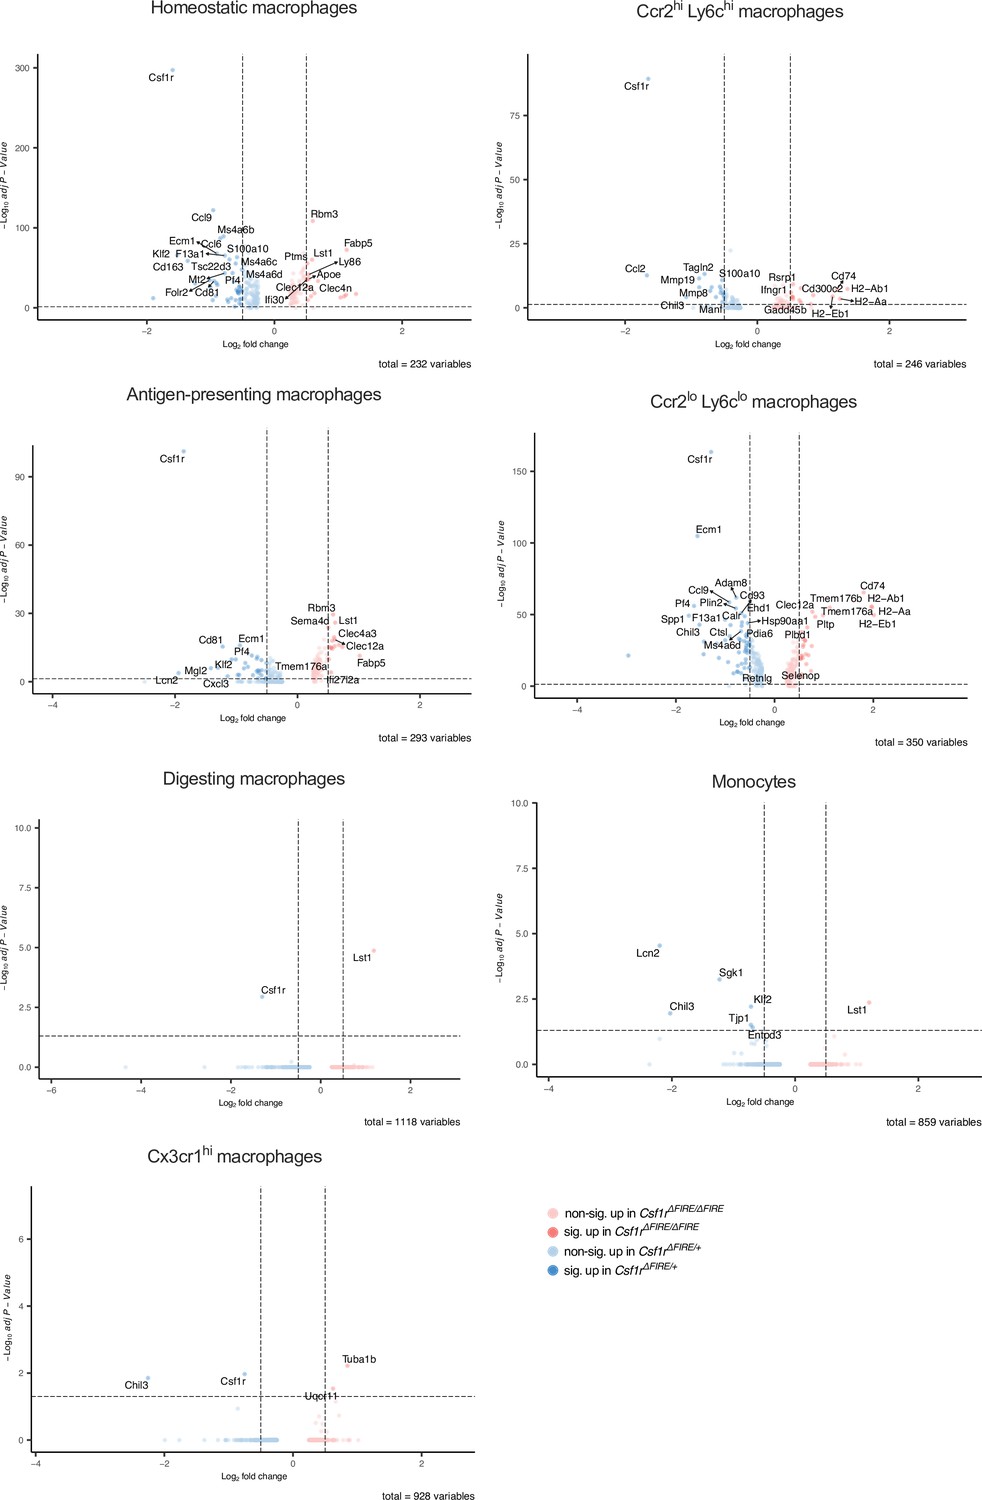
Differential gene expression in monocyte and macrophage clusters after ischemia/reperfusion (I/R) in control and ΔFIRE mice.
Figure 7—figure supplement 3
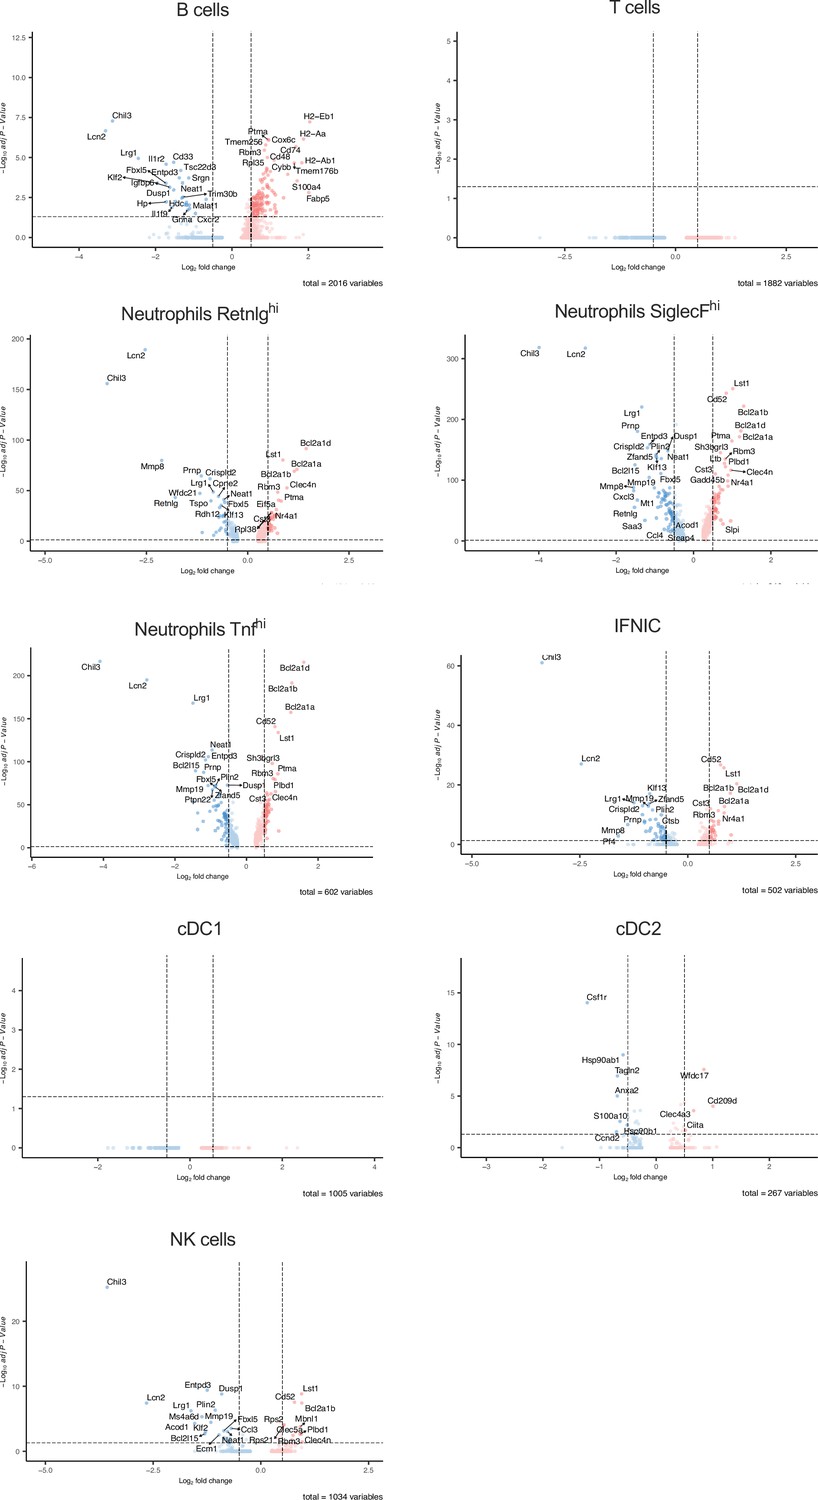
Differential gene expression in non-macrophage clusters after ischemia/reperfusion (I/R) in in control and ΔFIRE mice.
Figure 7—figure supplement 4
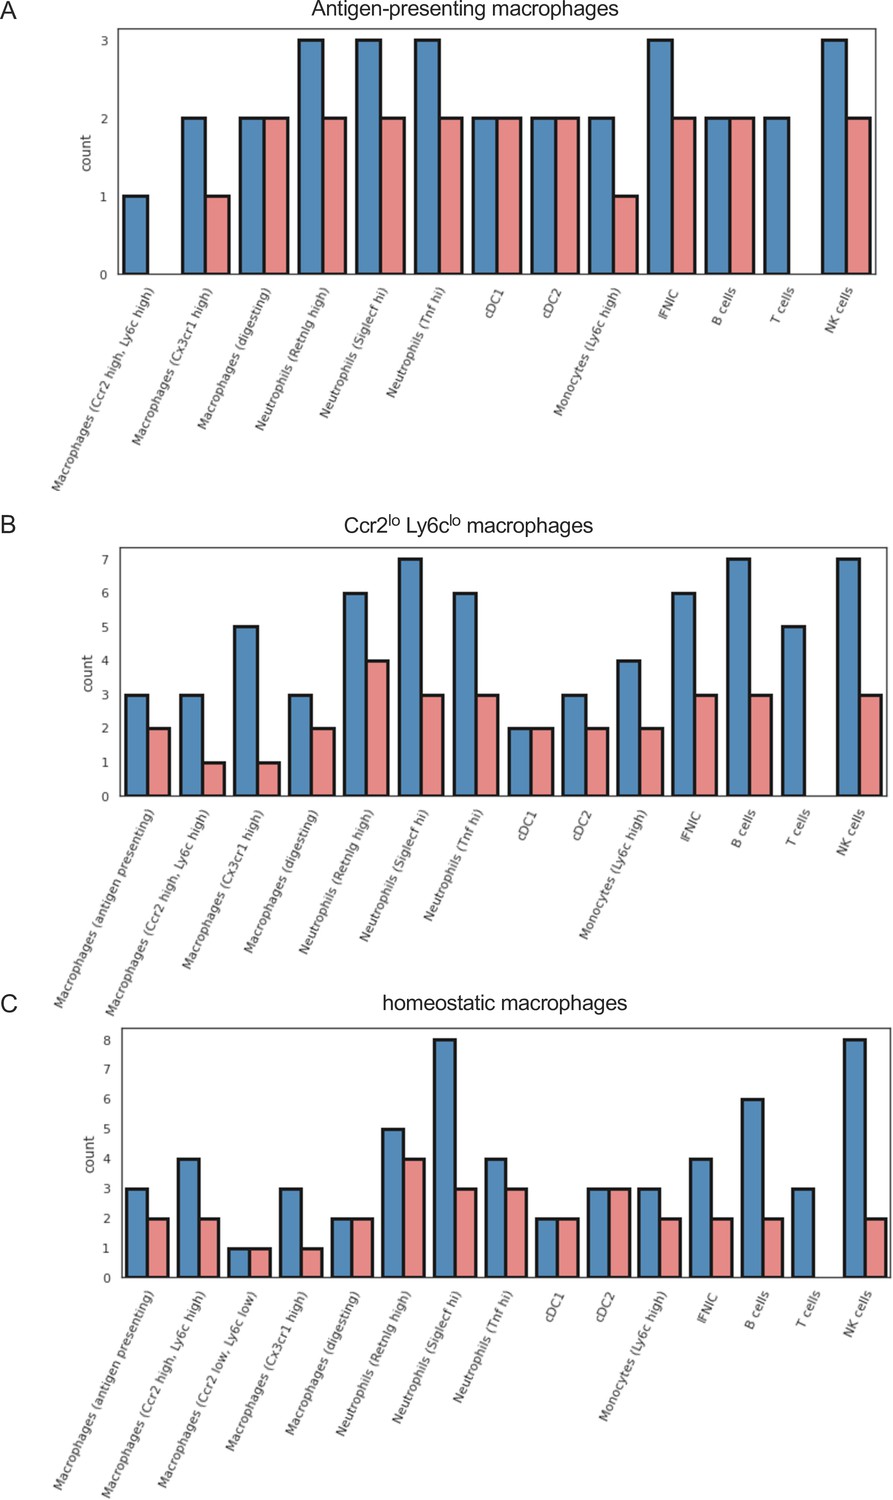
Different outgoing signals in macrophage subpopulations in ischemia/reperfusion (I/R) injury in Csf1rΔFIRE/+ and Csf1rΔFIRE/ΔFIRE mice.
Number of cell–cell interactions (with communication score >6) outgoing from (a) antigen-presenting macorphages, (b) Ccr2 lo, Ly6c lo macrophages, and (c) homeostatic macrophages to other immune cell clusters.
Figure 7—figure supplement 5
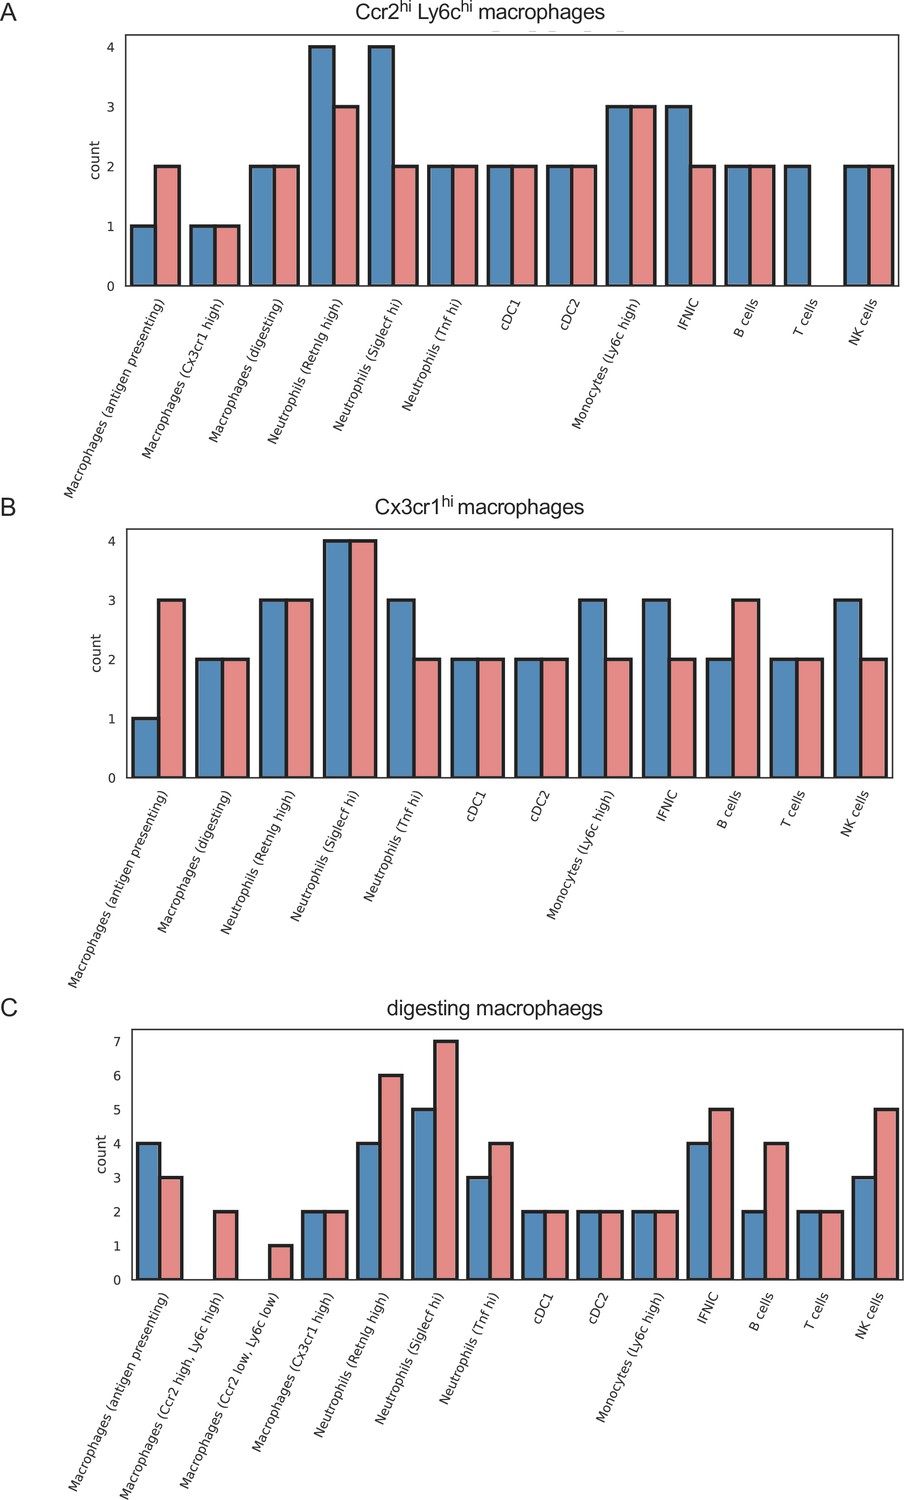
Similar outgoing signals in macrophage subpopulations in ischemia/reperfusion (I/R) injury in Csf1rΔFIRE/+ and Csf1rΔFIRE/ΔFIRE mice.
Number of cell–cell interactions (with communication score >6) outgoing from (a) Ccr2 hi, Ly6c high macrophages, (b) Cx3cr1 high macrophages, and (c) digesting macrophages to other immune cell clusters.
Figure 8 with 1 supplement
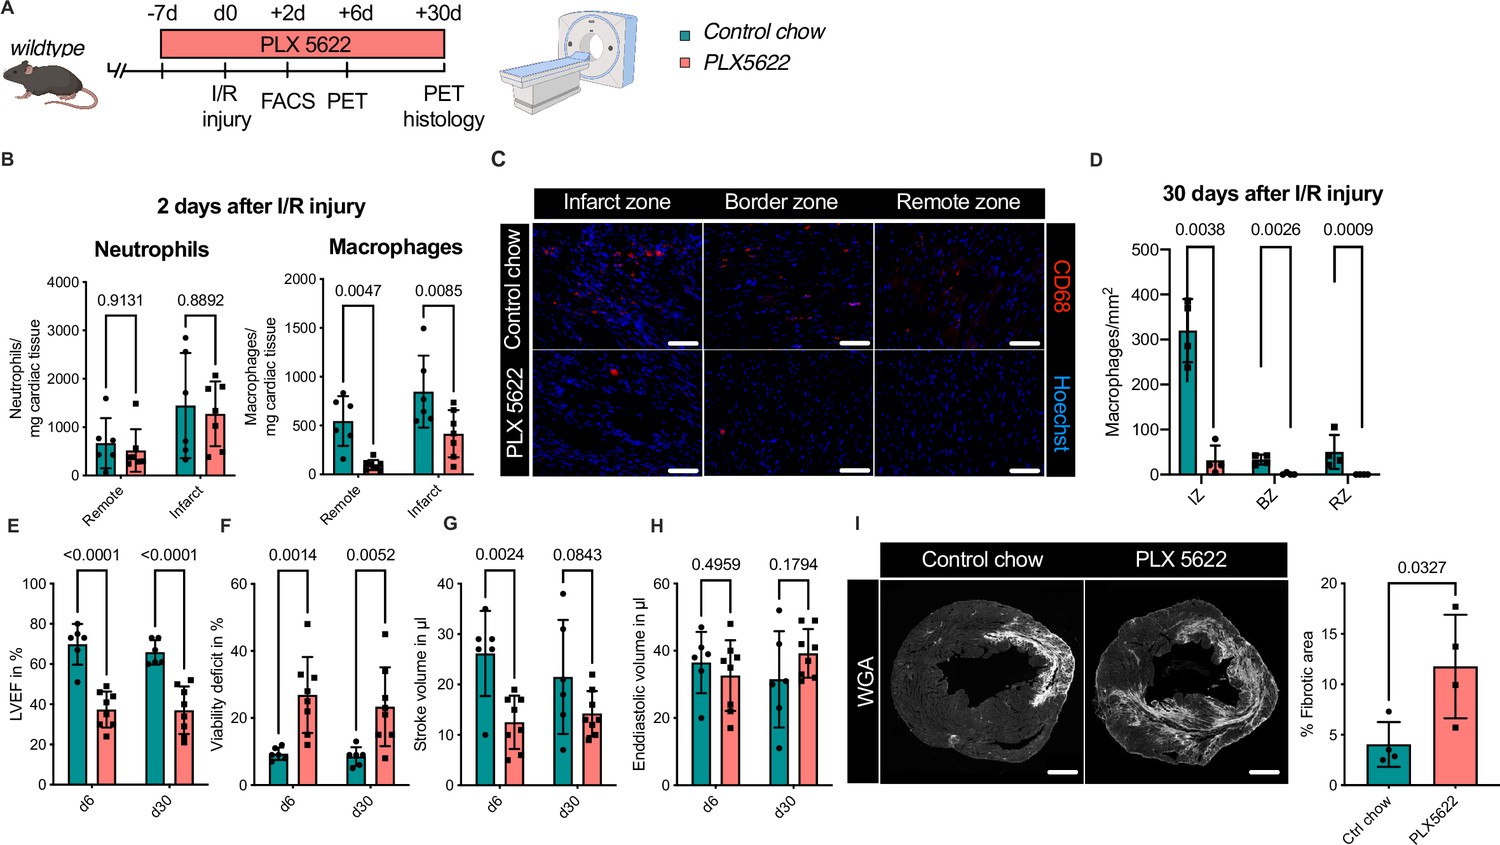
Ablation of resident and recruited macrophages severely impacts on cardiac healing after ischemia/reperfusion (I/R) injury.
(A) Schematic of the analysis of cardiac function and infarct size in mice treated with PLX5622 7 days prior and 30 days after I/R injury. (B) Number of cardiac macrophages and neutrophils in the remote and ischemic myocardium 2 days after I/R injury in mice fed control chow (n = 6) or PLX5622 (n = 7). (C) Representative immunohistology of hearts 30 days after I/R injury showing macrophages (CD68+ cells in red and Hoechst in blue) in the infarct, border, and remote zones and (D) number of cardiac macrophages in the respective area (n = 4 for control chow and n = 4 for PLX5622). (E) Left ventricular ejection fraction (LVEF), (F) viability deficit, (G) stroke volume, and (H) end-diastolic volume measured using positron emission tomography 6 and 30 days after I/R injury (n = 6 for control chow, n = 8 for PLX5622). (I) Representative immunohistological images showing the fibrotic area (WGA+ area) in hearts 30 days after I/R injury from mice fed control chow or PLX5622. Percentage of fibrotic area in the respective groups (n = 4 for each group). Student’s t-test or Fisher’s Fisher's Least Significant Difference (LSD) test was performed and mean ± standard deviation (SD) is shown.
Figure 8—figure supplement 1
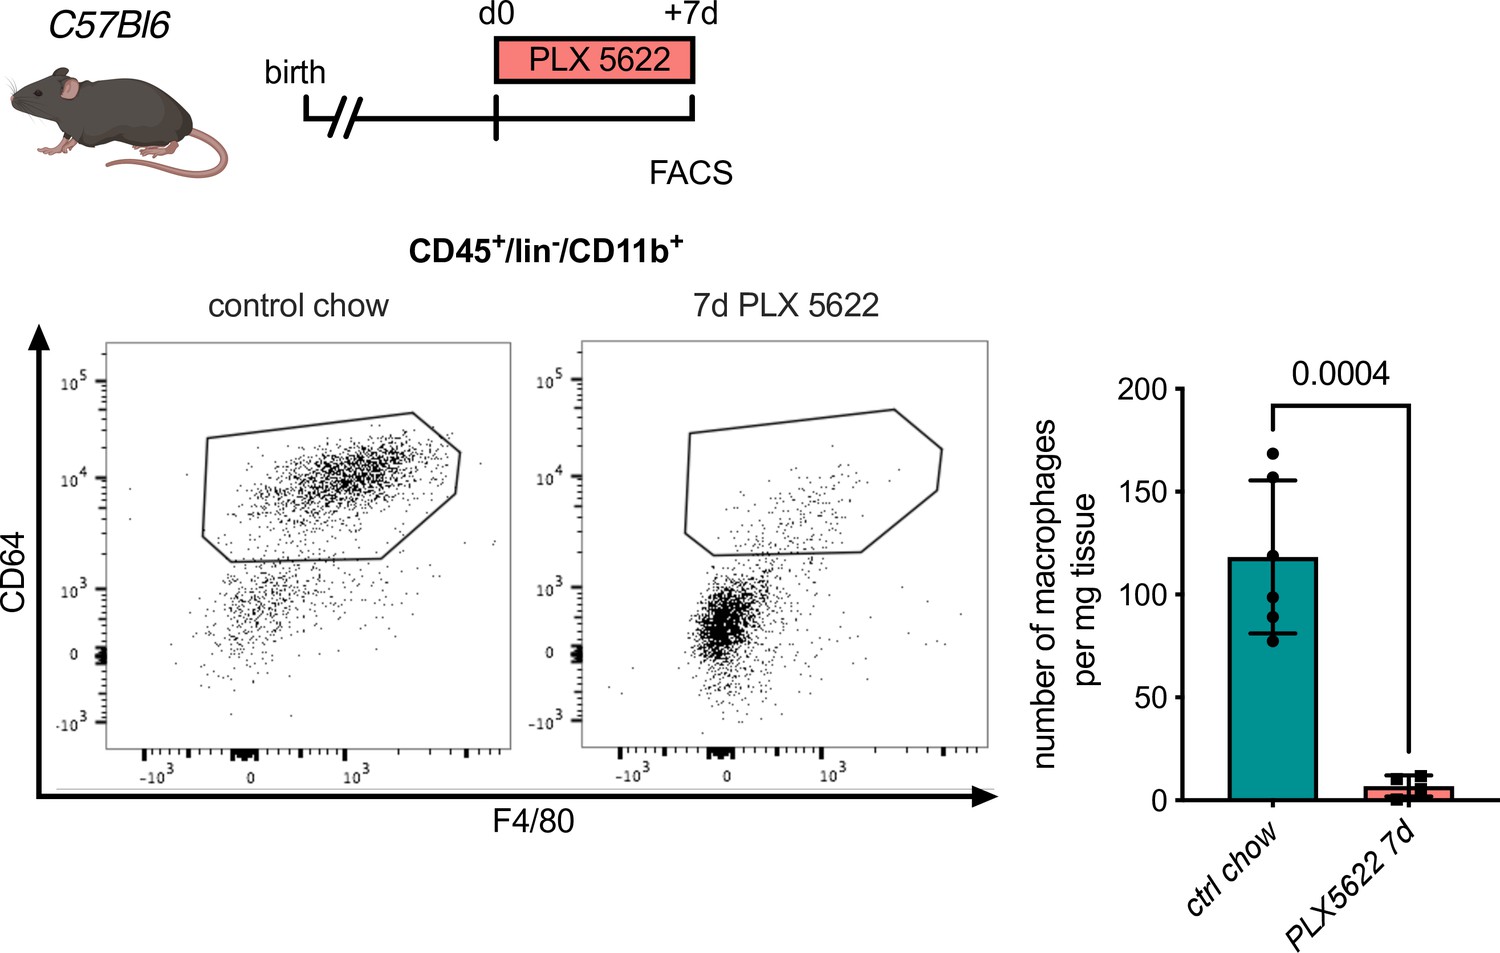
Macrophage depletion using the Csf1r-inhibitor PLX5622.
Flow cytometry analysis of hearts from C57Bl6 mice treated with PLX5622 for 7 days, (left) representative flow cytometry showing cardiac macrophages (CD45+/lin−/CD11b+/F4/80+/CD64+ cells) and (right) number of cardiac macrophages in animals fed control chow or PLX5622 (n = 6 for control chow and n = 4 for PLX5622, each individual experiment).
Additional files
Download links
A two-part list of links to download the article, or parts of the article, in various formats.
Downloads (link to download the article as PDF)
Open citations (links to open the citations from this article in various online reference manager services)
Cite this article (links to download the citations from this article in formats compatible with various reference manager tools)
Resident and recruited macrophages differentially contribute to cardiac healing after myocardial ischemia
eLife 12:RP89377.
https://doi.org/10.7554/eLife.89377.4


