A spatial threshold for astrocyte calcium surge
- Department of Neuroscience, University of Minnesota, United States
- Instituto Cajal, CSIC, Spain
- Experimental Neurophysiology Group, Hospital Nacional de Parapléjicos SESCAM, Spain
Figures
Figure 1 with 1 supplement
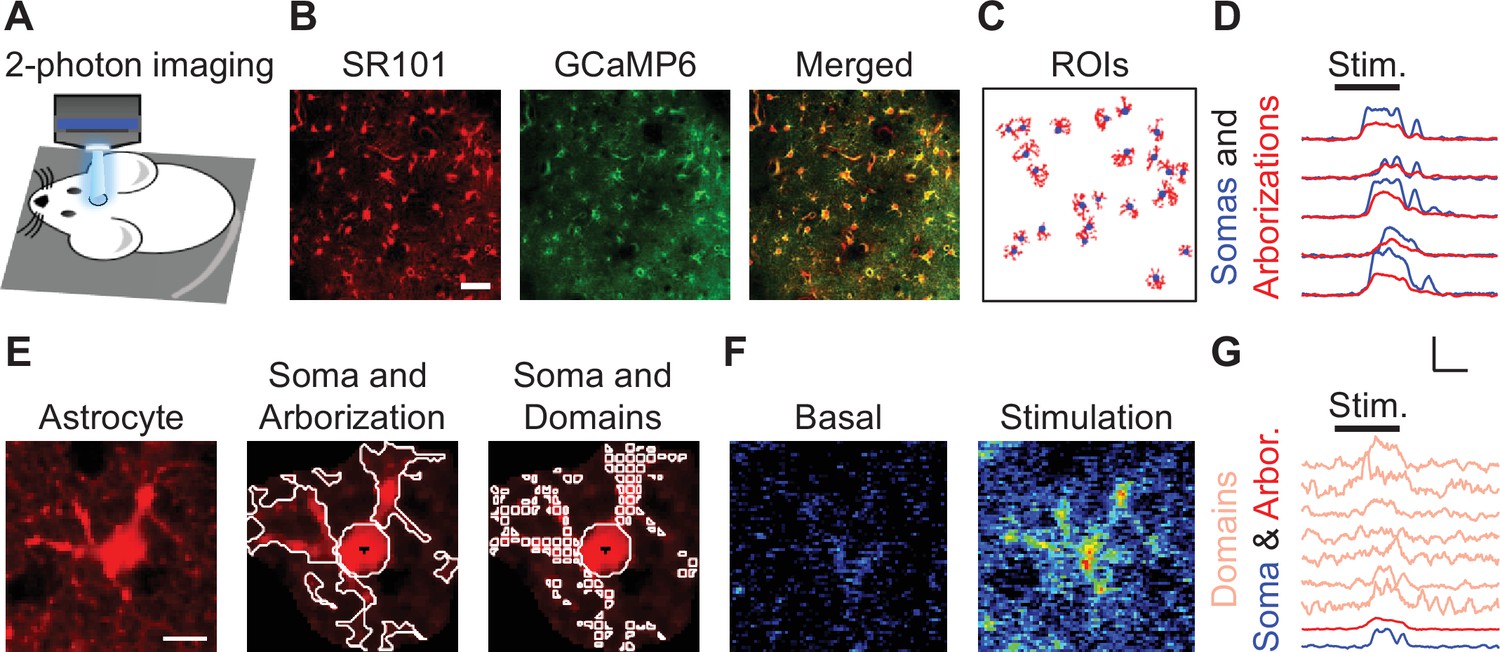
Imaging astrocyte structure and function simultaneously in vivo.
(A) Scheme of in vivo preparation to image astrocyte Ca2+ and structure. (B) Sulforhodamine 101 (SR101)-stained astrocyte structure, GCaMP6 to monitor astrocyte Ca2+ signal, and merge. Scale bar = 50 µm. (C) Regions of interest (ROIs) from SR101-stained structure of somas (blue) and arborizations (red). (D) Ca2+ traces from B from somas (blue) and arborizations (red). Scale = F/Fo, 10 s. (E) SR101-stained astrocyte (left), ROIs outlining soma and arborization (center) and ROIs defining the soma and domains (right). Scale bar = 10 µm. (F) Pseudocolor Ca2+ image during basal (left) and hindpaw electrical stimulation (right). (G) Ca2+ traces from F from domains (salmon), arborization (red), and soma (blue). Scale = F/Fo, 10 s.
Figure 1—figure supplement 1
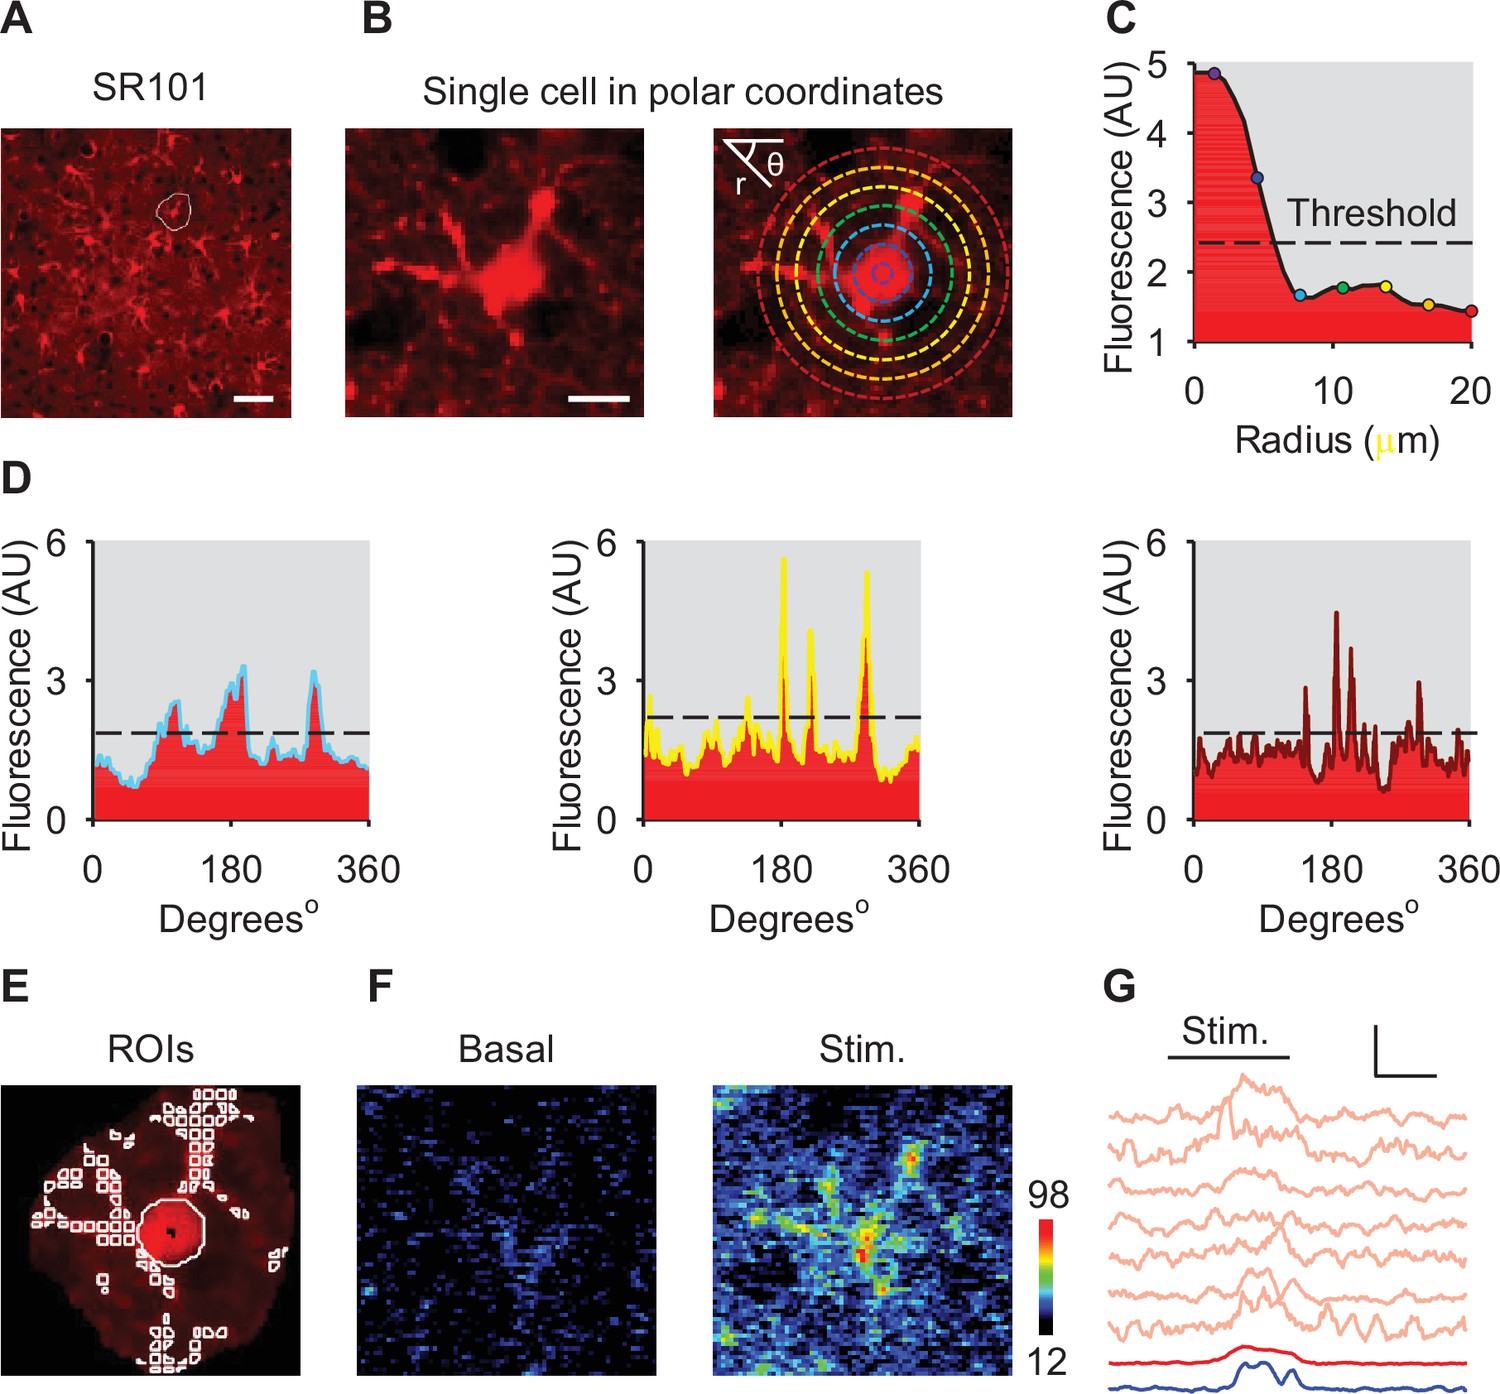
Semi-automatic method for the segmentation of astrocyte morphology.
(A) Sulforhodamine 101 (SR101)-stained astrocyte population with an outlined cell. Scale bar = 50 µm. (B) Selected astrocyte placed in polar coordinates with rings overlaid to assess structural fluorescence. Scale bar = 10 µm. (C) Average fluorescence of rings centered on astrocyte soma as radius is extended outward. Note, overlay of values from rings in B. (D) Fluorescence of rings in panel B as a function of angle. (E) Regions of interest (ROIs) from algorithm. (F) Calcium pseudocolor image during basal and stimulation. (G) Calcium traces from F during stimulation. Scale = F/Fo, 10 s.
Figure 2
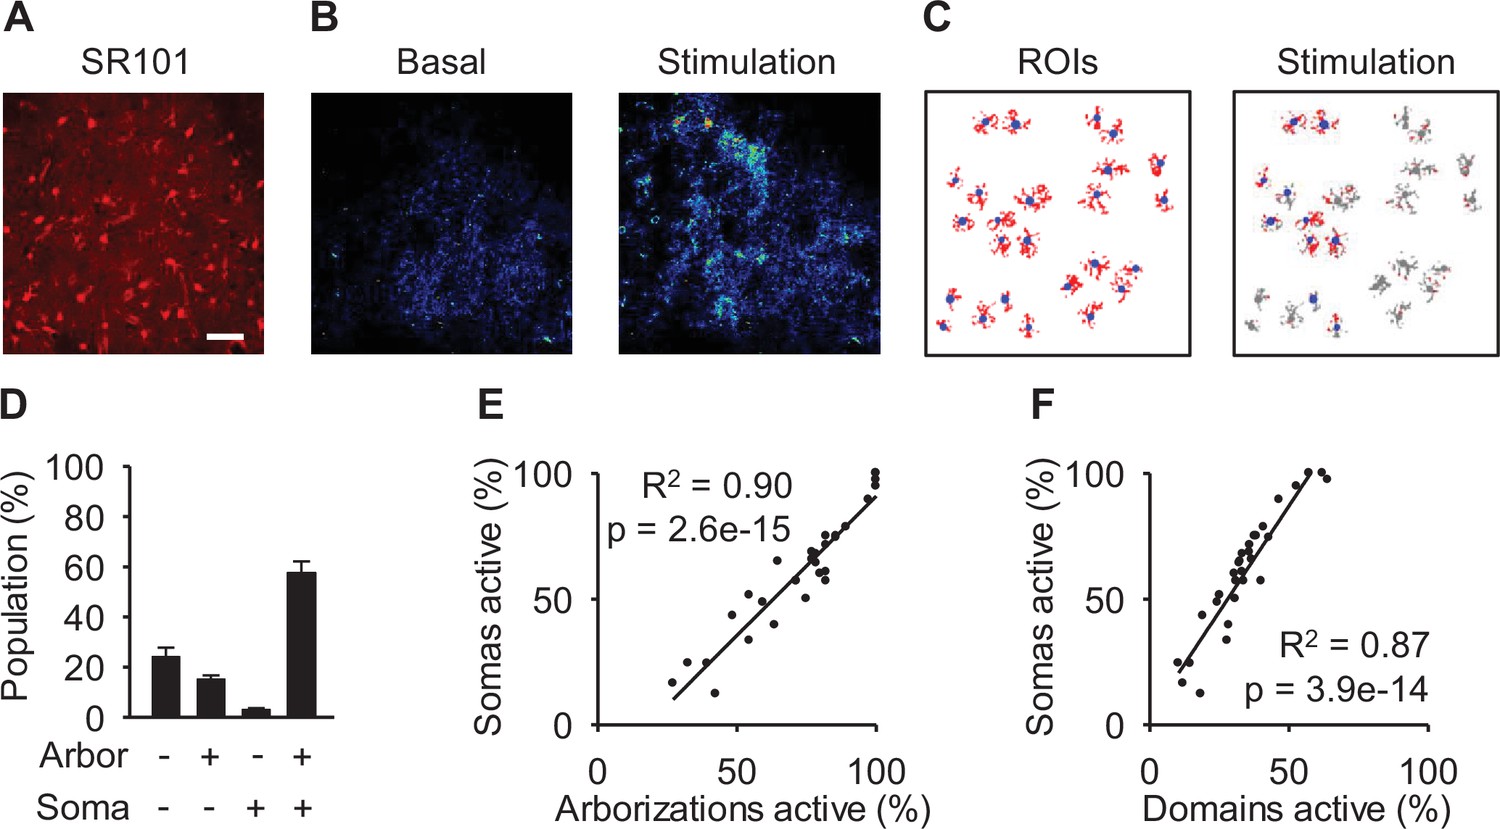
Population arborization calcium is correlated to population soma activity.
(A) Sulforhodamine 101 (SR101) staining. Scale bar = 50 µm. (B) Pseudocolor Ca2+ images at basal and stimulation. (C) Regions of interest (ROIs) of soma and arborizations/domains along with activity during stimulation. (D) Proportion of subcellular responses to stimulation. (E) Percentage of active arborizations vs percent of somas active. (F) Percentage of domains active vs percent of somas active. Mean ± SEM. Pearson correlation.
Figure 3 with 1 supplement
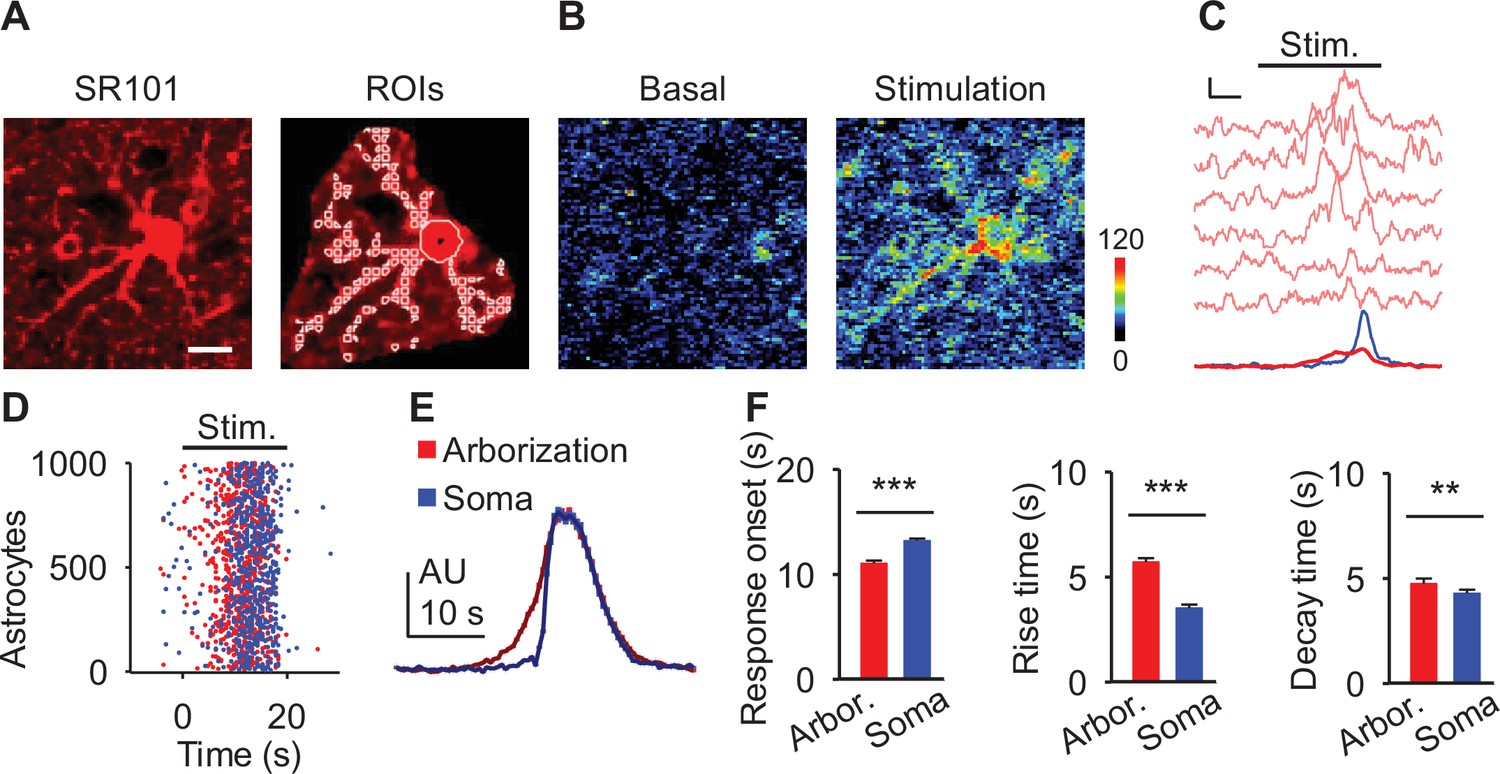
Astrocyte calcium responses originate in the arborization before the soma.
(A) Astrocyte with regions of interest (ROIs). Scale bar = 10 µm. (B) Pseudocolor Ca2+ image. (C) Ca2+ traces in B from domains (pink), arborization (red), and the soma (blue). Scale = F/Fo, 5 s. (D) Raster plot of astrocyte somas (blue) and arbors (red) in response to stimulation (gray). (E) Average calcium traces from somas (blue) and arborizations (red) aligned to their respective soma onset. (F) Soma and arbor latency to response (left), event rise time (center), and event decay time (right). n = 995 astrocyte reponses. Mean ± SEM. ‘**’ ≡ p<0.01 and ‘***’ ≡ p<0.001 using paired Student’s t-test.
Figure 3—figure supplement 1
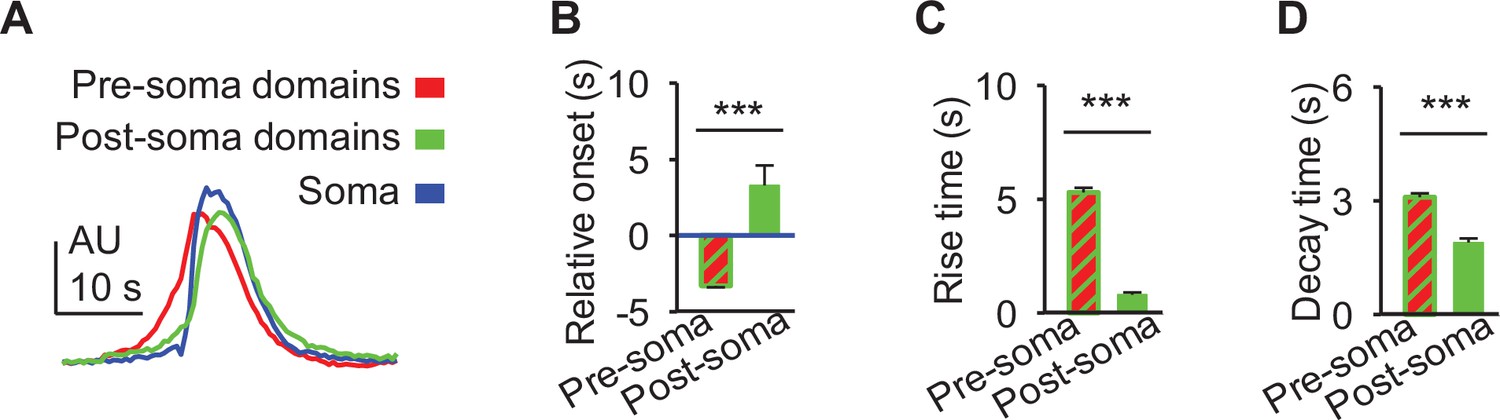
Distinct dynamics of domains before and after soma onset.
(A) Average calcium traces from somas (blue) and domains activating before the soma (pre-soma; green) and after the soma (post-soma; pink) aligned to their respective soma onset. (B) Pre-soma and post-soma latency to response relative to their respective soma onset. (C) Event rise time. (D) Event decay time. n = 995 astrocyte reponses. Mean ± SEM. ‘***’ ≡ p<0.001 using paired Student’s t-test.
Figure 4
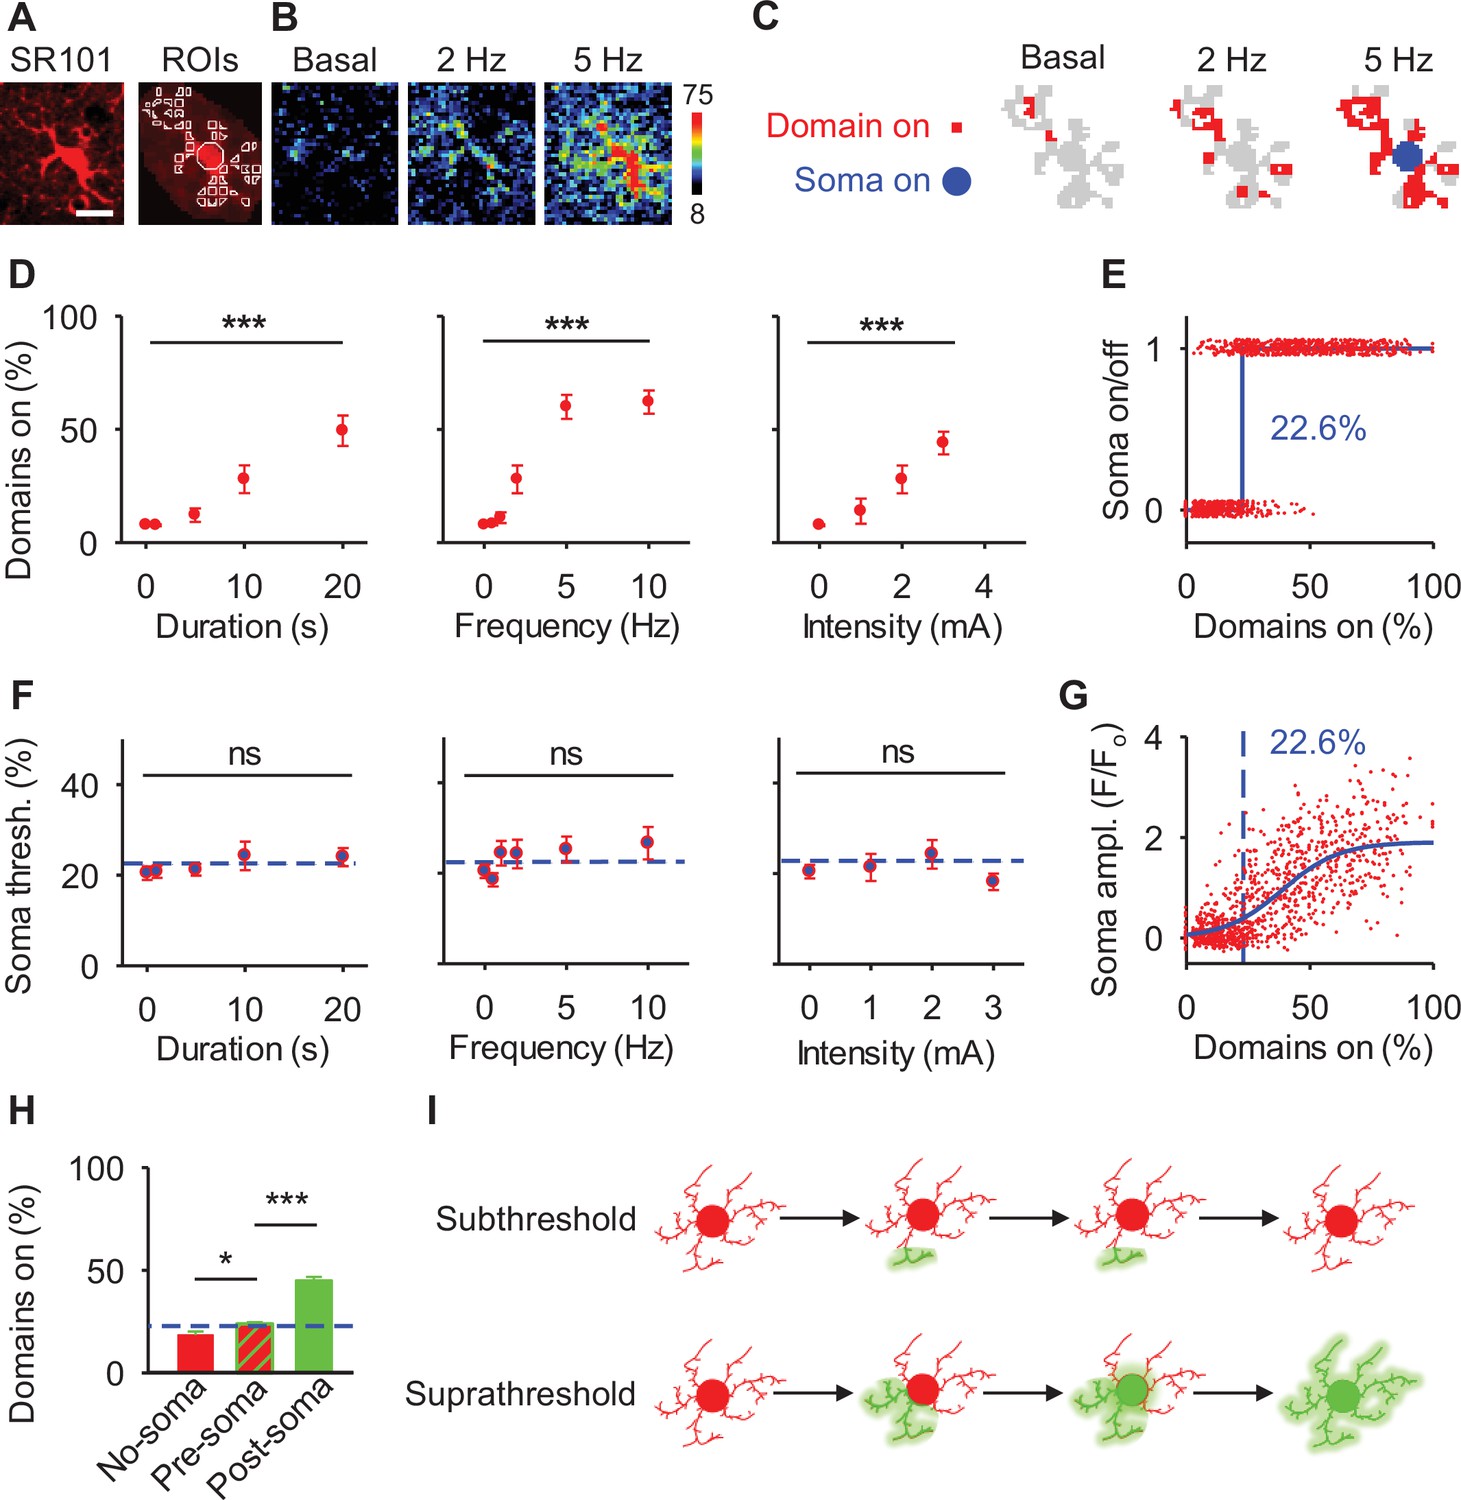
A spatial threshold for astrocyte calcium in the soma to reach astrocyte calcium surge.
(A) Astrocyte and regions of interest (ROIs). Scale bar = 10 µm. (B) Pseudocolor Ca2+ images during basal and different frequency of stimulations. (C) Scheme of domains (red) and soma (blue) Ca2+ activity from B. (D) Percentage of active domains vs stimulus duration, intensity, and frequency. n = 11 populations. (E) Active state of soma for individual astrocytes vs percentage of active domains (red). Data were fit to a Heaviside step function (blue dotted line). (F) Percentage of active domains necessary to elicit soma activation vs stimulus duration, intensity, and frequency. Blue dotted lines denote 22.6% spatial threshold. n = 11 populations. (G) Soma fluorescence vs percentage of active domains (red). Data were fit to a sigmoidal function (blue) and a blue dotted line denotes 22.6% spatial threshold. (H) Percentage of active domains in the absence of soma activation vs active domains before and after soma activation. Blue line denotes 22.6% spatial threshold. (I) Schematic showing subthreshold and suprathreshold astrocyte calcium activity. Mean ± SEM. ‘***’ ≡ p<0.001 and ‘ns’ ≡ p>0.05 using one-way ANOVA or Student’s t-test.
Figure 5
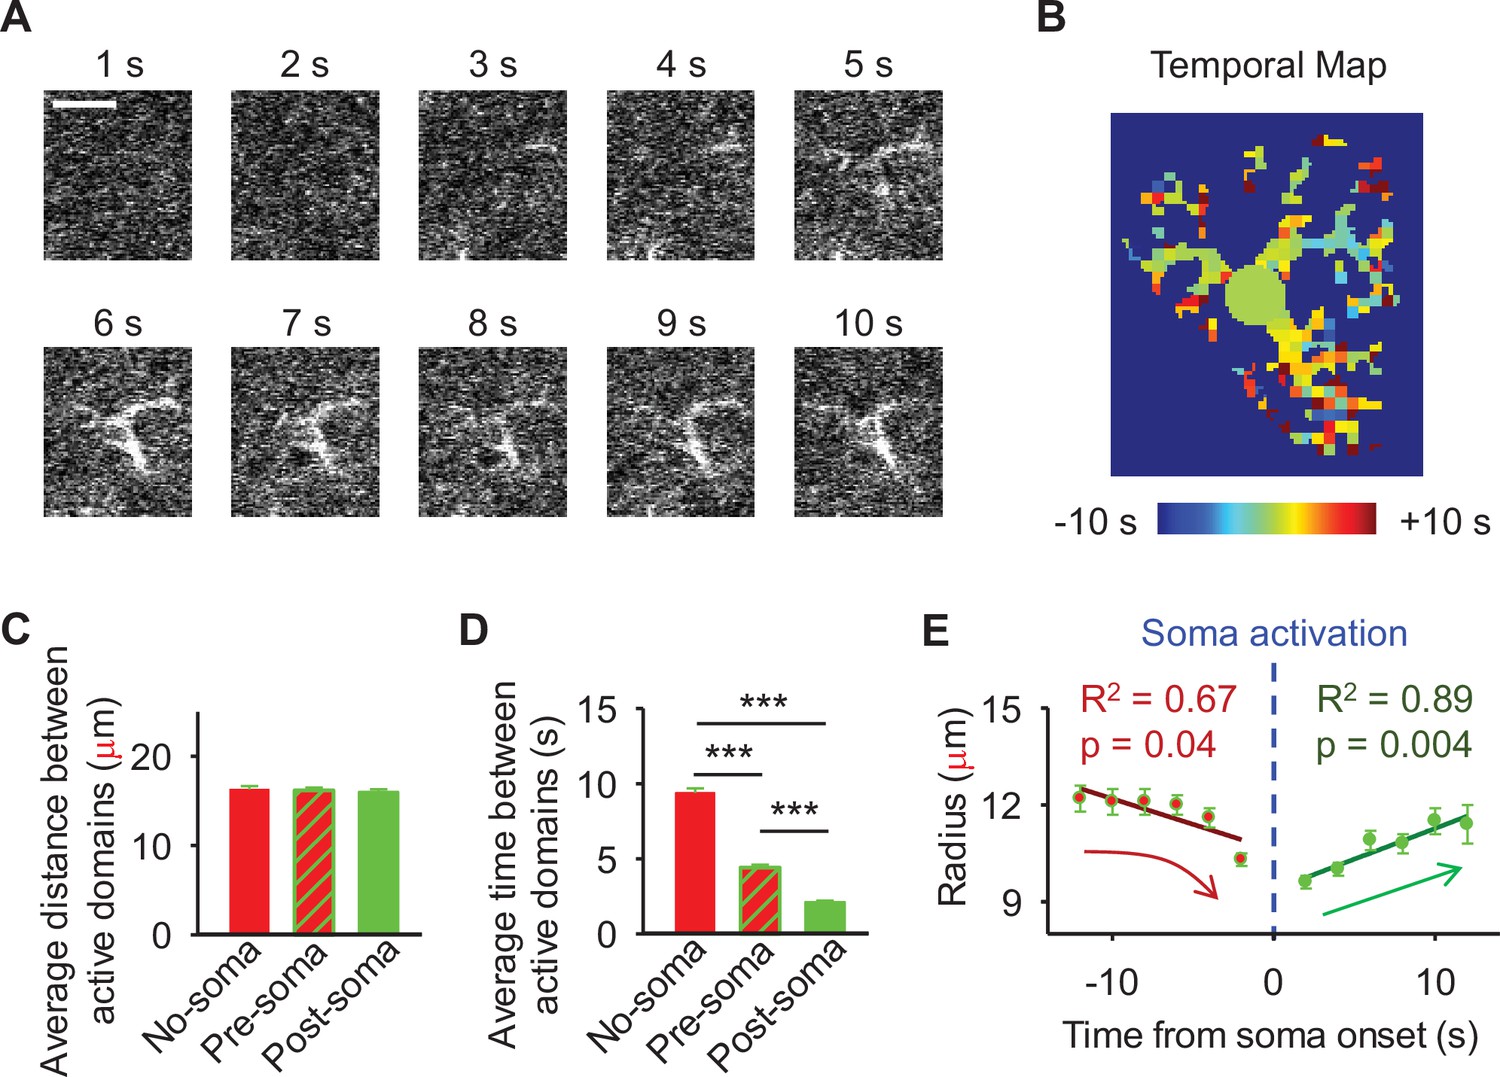
The spatiotemporal properties of astrocyte calcium surge.
(A) The time course of calcium surge following sensory stimulation. The average of 10 sequential frames (2 s) ending on the time from stimulation onset in seconds. Scale bar = 10 µm. (B) Temporal map of domain temporal order relative to soma activation from A. (C) Average distance between pairs of active domains in the absence of soma activation vs before and after soma activation. n = 286 cells without soma activation, and 326 cells with soma activation. (D) Average time between pairs of active domains in the absence of soma activation vs before and after soma activation. Mean ± SEM. (E) Comparison between activated domain onset relative to soma activation vs radius from the center of the soma. ‘***’ ≡ p<0.001 using paired and unpaired Student’s t-test. Pearson correlation.
Figure 6

The spatial activation of domain Ca2+ remains below the spatial threshold in mice lacking the IP3 receptor type-2.
(A) Sulforhodamine 101 (SR101) staining. Scale bar = 50 µm. (B) Pseudocolor Ca2+ images at basal and stimulation. (C) Traces from astrocytes in B. Scale = F/Fo, 10 s. (D) Percentage of domains (left), arborizations (center), and somas (left) active at basal (open) and stimulation (hashed) in Itpr2-/- mice. (E) Percentage of domains active in wildtype (filled) and Itpr2-/- mice (hashed). Blue line denotes 22.6% spatial threshold. (F) Probability of soma activation in wildtype (filled) and Itpr2-/- mice (hashed). n = 30 populations in WT and 5 populations in knockout mice. Mean ± SEM. ‘***’ ≡ p<0.001 using paired and unpaired Student’s t-test.
Figure 7
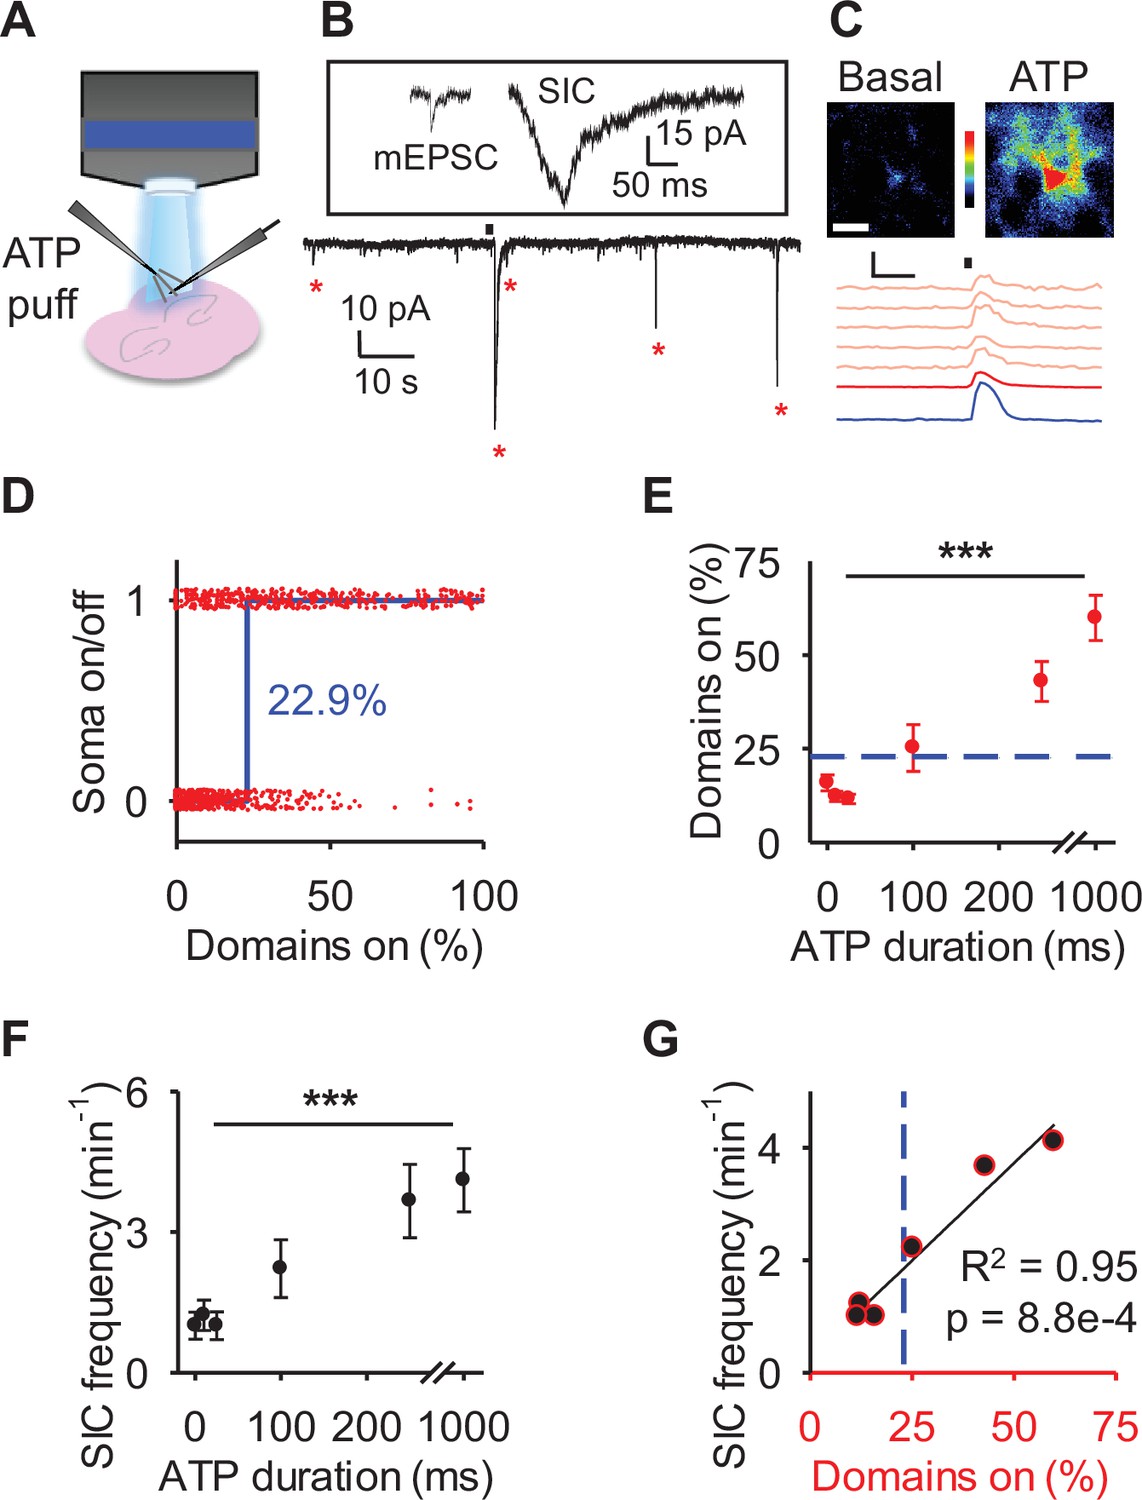
Increases in slow inward currents (SICs) occur with astrocyte calcium surge.
(A) Scheme of cortical brain slice experiments to image astrocyte Ca2+ and record SICs with adenosine triphosphate (ATP) application. (B) Example traces of a miniature excitatory post synaptic current (mEPCS) and an SIC (upper) and SICs following ATP puff (black bar) (lower). (C) Pseudocolor Ca2+ images at basal and ATP with traces of responses to puff (black bar) in the soma (blue), arbor (red), and domains (salmon). Scale bar = 10 µm. Scale = F/Fo, 10 s. (D) Active state of soma for individual astrocytes vs percentage of active domains (red), with fit to a Heaviside step function (blue line). (E) Percentage of domains active in response to ATP puff. Blue dotted line denotes spatial threshold from D. n = 11 populations. (F) SIC frequency in response to ATP puff. n = 9 neurons. (G) Pearson correlation between percent active domains vs SIC frequency. Blue dotted line denotes spatial threshold from D. Mean ± SEM. ‘***’ ≡ p<0.001 using one-way ANOVA and t-test of Pearson correlation.
Tables
Key resources table
| Reagent type (species) or resource | Designation | Source or reference | Identifiers | Additional information |
|---|---|---|---|---|
| Strain, strain background (Mus musculus) | B6.Cg-Tg(Gfap-cre)77.6Mvs/2J | Jackson Laboratories | 024098 | Crossed with GCaMP6f mice to create Gfap-GCaMP6f transgenic mice. |
| Strain, strain background (M. musculus) | B6J.Cg-Gt(ROSA)26Sortm95.1 (CAG-GCaMP6f)Hze/MwarJ | Jackson Laboratories | 028865 | Crossed with GFAP-cre mice to create GFAP-GCaMP6f transgenic mice. |
| Strain, strain background (M. musculus) | Itpr2−/− mice | Ju Chen Kab | ||
| Chemical compound, drug | Urethane | Sigma-Aldrich | U2500 | |
| Chemical compound, drug | Sulforhodamine 101 | Sigma-Aldrich | S7635 | |
| Software, algorithm | MATLAB | Mathworks | RRID:SCR_001622 | |
| Recombinant DNA reagent | AAV5-GfaABC1d-22 GCaMP6f | UNC Vector Core |
Additional files
Download links
A two-part list of links to download the article, or parts of the article, in various formats.
Downloads (link to download the article as PDF)
Open citations (links to open the citations from this article in various online reference manager services)
Cite this article (links to download the citations from this article in formats compatible with various reference manager tools)
A spatial threshold for astrocyte calcium surge
eLife 12:RP90046.
https://doi.org/10.7554/eLife.90046.3


