Cas phosphorylation regulates focal adhesion assembly
- Fred Hutchinson Cancer Center, United States
Figures
Figure 1 with 3 supplements
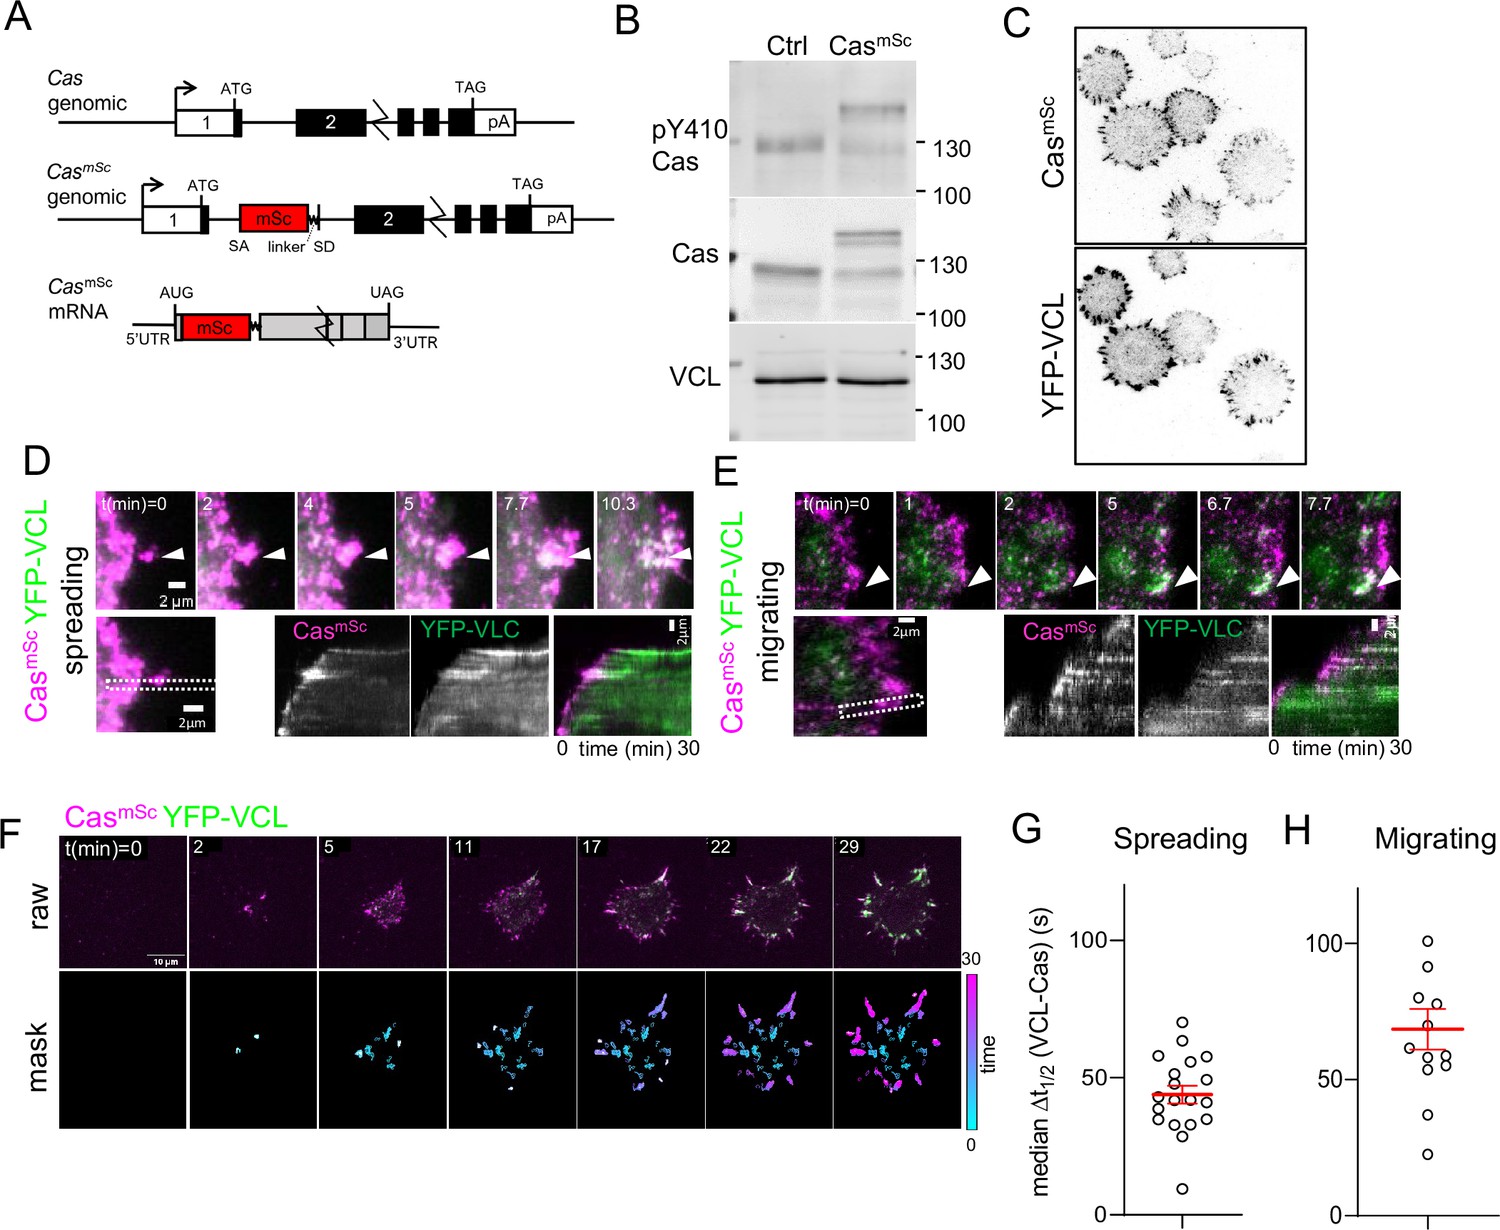
Cas clusters before vinculin during focal adhesion assembly.
(A) Cas wildtype and CasmSc genomic organization and CasmSc mRNA structure. An artificial exon encoding mScarlet (mSc) and a 8-residue linker were inserted in intron 1. (B) Representative immunoblot showing the pY410Cas, total Cas and vinculin (VCL) in control (Ctrl) and CasmSc MCF10A cells. (C) CasmSc co-localization with YFP-VCL. CasmSc MCF10A cells expressing YFP-VCL were plated on COLI for 30 min and visualized by total internal reflection (TIRF) microscopy. (D–H) CasmSc clusters form before vinculin clusters. TIRF microscopy of CasmSc YFP-VCL cells. Individual time frames and kymographs from (D) spreading or (E) migrating cells. Arrowheads indicate a CasmSc clusters (magenta) that are later joined by YFP-VCL (green). (F) Pipeline for tracking regions of interest (ROIs). Upper panels: raw images. Lower panels: masks showing tracked ROIs, color coded by time of onset. (G) Median Δt1/2 (VCL-Cas) of multiple ROIs from n = 19 spreading cells. Error bars show mean (43.8 s) and standard error of the mean (SEM) (3 s). (H) Median Δt1/2 (VCL-Cas) of multiple ROIs from n = 13 spreading cells. Error bars show mean (68.5 s) and SEM (7 s).
Figure 1—figure supplement 1
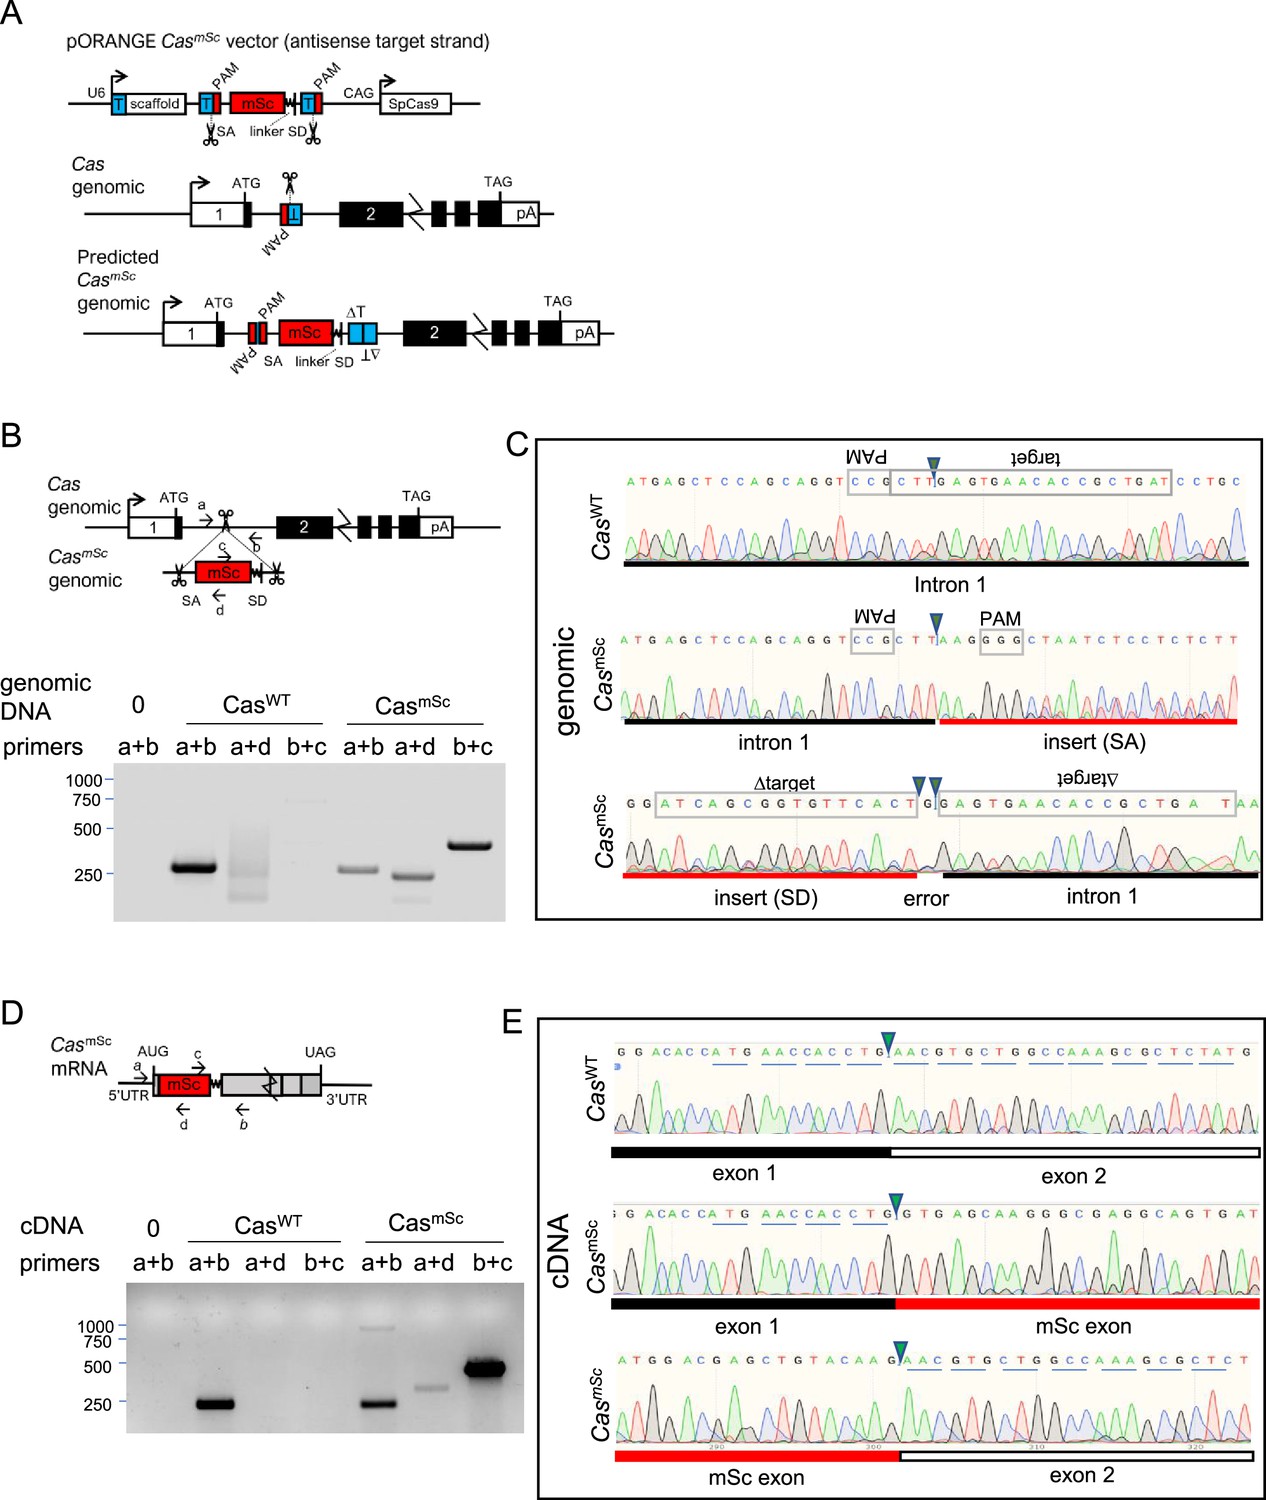
Vector design and validation of CasmSc tagging.
(A) Overview of modified pORANGE-based approach for N-terminal tagging endogenous Cas by inserting an artificial exon. T, target sequence; PAM, protospacer adjacent motif; SA, splice acceptor; SD, splice donor, SpCas9, Streptococcus pyogenes Cas9; linker, GGMDELYK. (B) Primer positions and PCR products amplified from CasWT and CasmSc genomic DNA. (C) Sanger sequencing of CasWT (amplified with primers a+b) and 5′ and 3′ junctions of CasmSc (amplified with a+d and c+b, respectively) genomic DNA from the polyclonal population of mScarlet-expressing cells isolated by fluoresecence-activated cell sorter (FACS). Note poor sequencing and inserted base indicative of varied indels at the insertion site. (D) Primer positions and PCR products amplified from CasWT and CasmSc cDNA. (E) Sanger sequencing of reverse transcriptase (RT)-PCR amplified products from exon–exon junctions of CasWT (primers a+b) and CasmSc (primers a+d and c+b, respectively) cDNA. Note in-frame mSc sequence between Cas codons 4 and 5, showing that splicing has corrected indels at the insertion site.
Figure 1—figure supplement 2

Tagging Cas and vinculin does not alter focal adhesion size or number.
(A) Representative images (ventral section) of control and CasmSc MCF10A cells fixed and stained with pY410Cas and vinculin antibodies after 30 min of spreading. (B) Quantification of mean cell area, cluster area, mean pY410Cas intensity, and mean vinculin intensity of individual Cas and vinculin clusters. Error bars show mean and standard error of the mean (SEM) for n = 13–68 cells from three biological repeats. ns, non-significant; by Kruskal–Wallis followed by Dunn’s multiple comparison test.
Figure 1—figure supplement 3

Pipeline for tracking Cas and vinculin cluster assembly.
(A) Normalized intensity profiles of multiple YFP-VCL and CasmSc regions of interest (ROIs) tracked over 30 min of spreading in a single cell. Frame interval ~20 s. Each line tracks mean intensity of an ROI ≥20 pixels (0.5 μm2) in area. (B) Paired intensity profiles for YFP-VCL and CasmSc in a single tracked ROI. Δt1/2 for each ROI was calculated by subtracting t1/2 of normalized intensity for YFP-VCL from t1/2 for CasmSc. (C) Δt1/2 (VCL-Cas) for 90 ROIs in a single spreading CasmSc YFP-VCL MCF10A cell. Error bars indicate median (54.8 s) and 95% CI (23–105 s). (D) Δt1/2 (VCL-Cas) for 73 ROIs in a single migrating CasmSc YFP-VCL MCF10A cell. Error bars indicate median (58.1 s) and 95% CI (23–105 s). (E) Δt1/2 (VCL-Cas) for 37 ROIs in a single spreading CasmSc YFP-VCL HeLa cell. Error bars indicate median (66.2 s) and 95% CI (21–114 s). (F) Median Δt1/2 (VCL-Cas) for n = 13 spreading CasmSc YFP-VCL HeLa cells. Error bar indicates mean (48.06 s) and standard error of the mean (SEM) (9 s).
Figure 2 with 1 supplement
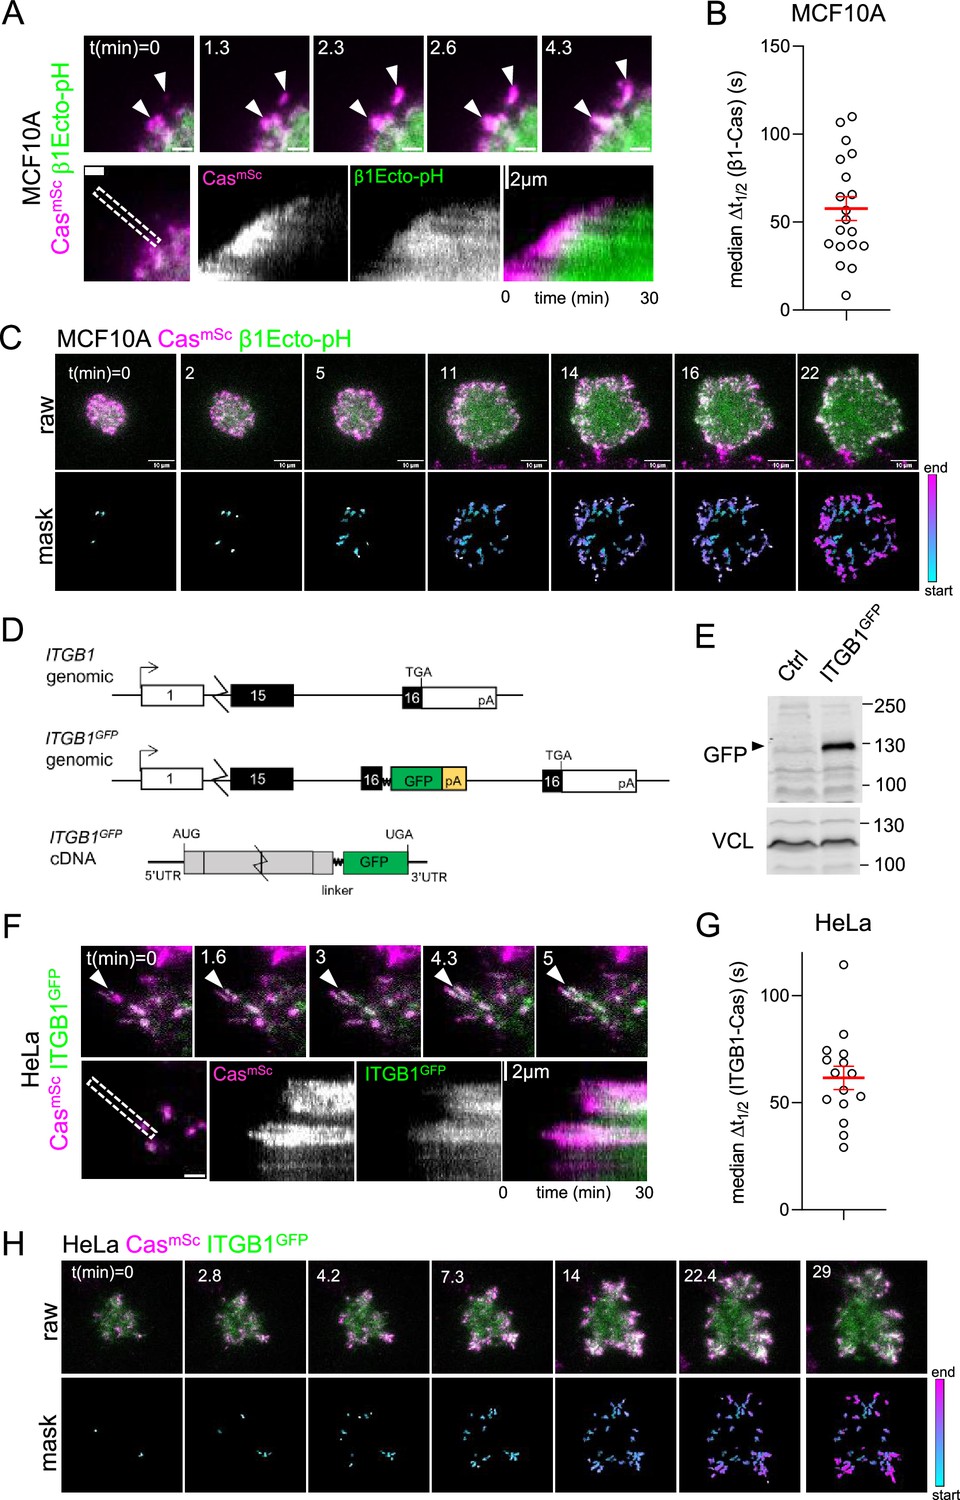
Cas clusters before integrin β1 during focal adhesion assembly.
(A) CasmSc MCF10A cells were transduced to express β1Ecto-pH, plated on COLI and imaged 30 min by total internal reflection (TIRF) microscopy. Upper panels: individual time frames. Arrowheads indicate a CasmSc cluster (magenta) that is later joined by β1Ecto-pH (green). Lower panels: kymographs. (B) Median Δt1/2 (β1-Cas) of multiple regions of interest (ROIs) from 19 spreading CasmSc β1Ecto-pH MCF10A cells. Error bars show mean (57.7 s) and standard error of the mean (SEM) (6.7 s). (C) Upper panels: raw images. Lower panels: masks showing tracked ROIs, color coded by time of onset. (D) ITGB1 wildtype and ITGB1GFP genomic organization and ITGB1GFP mRNA structure. An artificial exon encoding the ITGB1 C-terminus, linker, GFP, and polyA signal was inserted in intron 15. (E) Immunoblot showing expression of ITGB1GFP protein in CasmSc ITGB1GFP HeLa cells. (F) CasmSc clusters form before ITGB1GFP clusters. TIRF microscopy of CasmSc ITGB1GFP HeLa cells. Upper panels: individual time frames. Arrowheads indicate a CasmSc cluster (magenta) that is later joined by ITGB1GFP (green). Lower panels: kymographs. (G) Median Δt1/2 (ITGB1-Cas) of multiple ROIs from 15 spreading CasmSc ITGB1GFP HeLa cells. Error bars show mean (61.06 s) and standard error of the mean (SEM) (5.4 s). (H) Upper panels: raw images. Lower panels: masks showing tracked ROIs, color coded by time of onset.
Figure 2—figure supplement 1
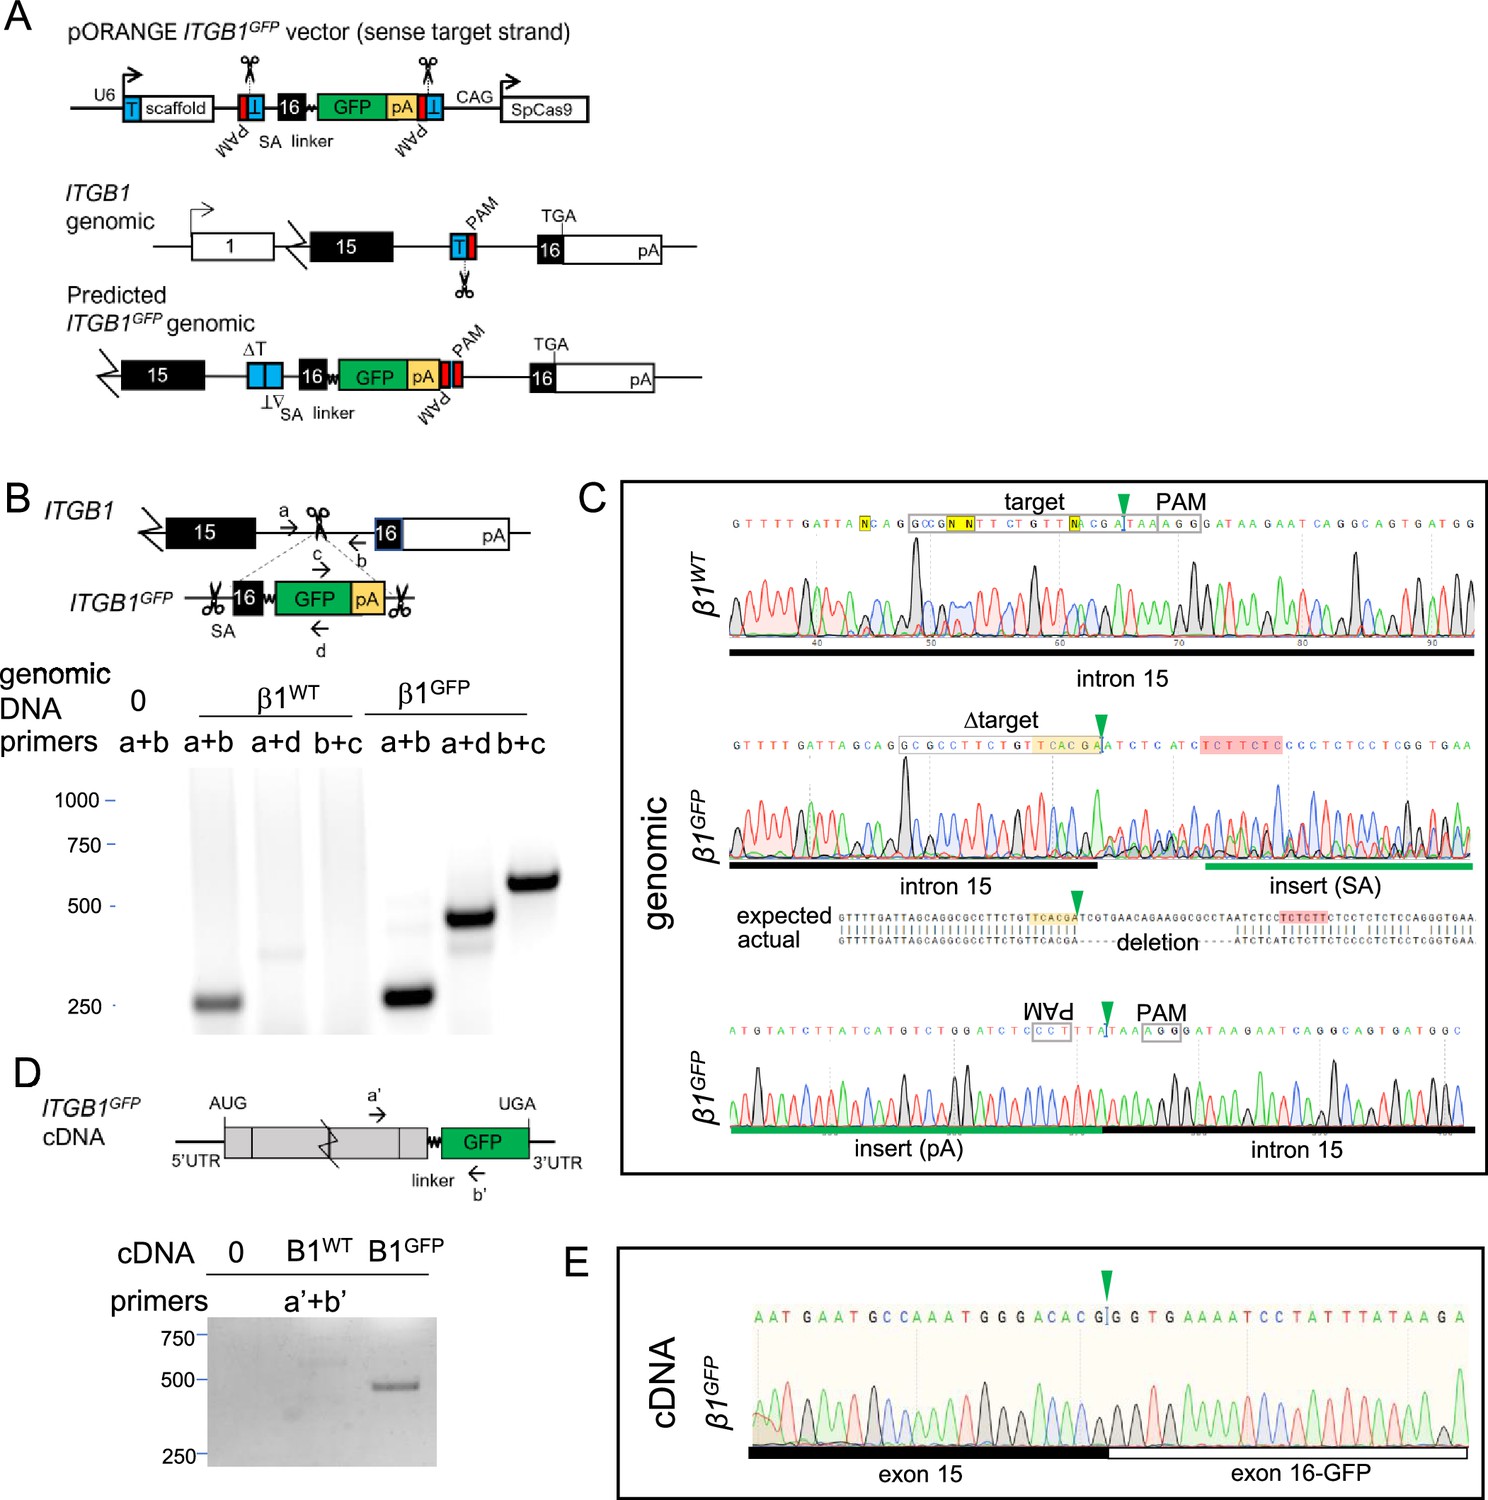
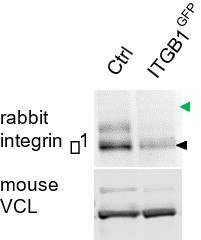
Vector design and validation of ITGB1GFP tagging.
(A) Overview of approach for C-terminal tagging endogenous ITGB1 by inserting an artificial exon and 3′ poly A signal. T, target sequence; PAM, protospacer adjacent motif; SA, splice acceptor; SD, splice donor; SpCas9, Streptococcus pyogenes Cas9; pA, SV40 poly A signal sequence; linker, 18-residue sequence from Parsons et al., 2008. (B) Primer positions and PCR products amplified from ITGB1WT and ITGB1GFP genomic DNA. (C) Sanger sequencing of ITGB1WT (amplified with primers a+b) and 5′ and 3′ junctions of ITGB1GFP (amplified with a+d and c+b, respectively) genomic DNA. Note poor sequencing and deletion indicative of indels at insertion site. (D) Primer positions and PCR products amplified from ITGB1WT and ITGB1GFP cDNA. (E) Sanger sequencing of RT-PCR amplified product from exon–exon junction of ITGB1GFP (primers a′+b′) cDNA. Note in-frame ITGB1 sequence between exon 15 and the introduced exon 16-GFP fusion.
Figure 3 with 1 supplement

Cas and Crk cluster together.
(A) CrkWT and CrkmGL genomic organization and CrkmGL mRNA structure. An artificial exon encoding the Crk C-terminus, linker, mGreenLantern (mGL), and polyA signal was inserted in intron 2. (B) Immunoblot showing expression of CrkmGL protein in CasmSc CrkmGL HeLa cells. (C) CrkmGL clusters form shortly after CasmSc clusters. Total internal reflection (TIRF) micrographs of CasmSc CrkmGL HeLa cells. Upper panels: individual time frames. Arrowheads indicate a CasmSc cluster (magenta) that is rapidly joined by CrkmGL (green). Lower panels: kymographs. (D) Median Δt1/2 (Crk-Cas) of multiple regions of interest (ROIs) from 10 to 21 spreading CasmSc CrkmGL HeLa control and eCF506-treated cells. Error bars show mean and standard error of the mean (SEM). ***,p < 0.001 by Mann–Whitney U-test. (E) Upper panels: raw images. Lower panels: masks showing tracked ROIs, color coded by time of onset.
Figure 3—figure supplement 1
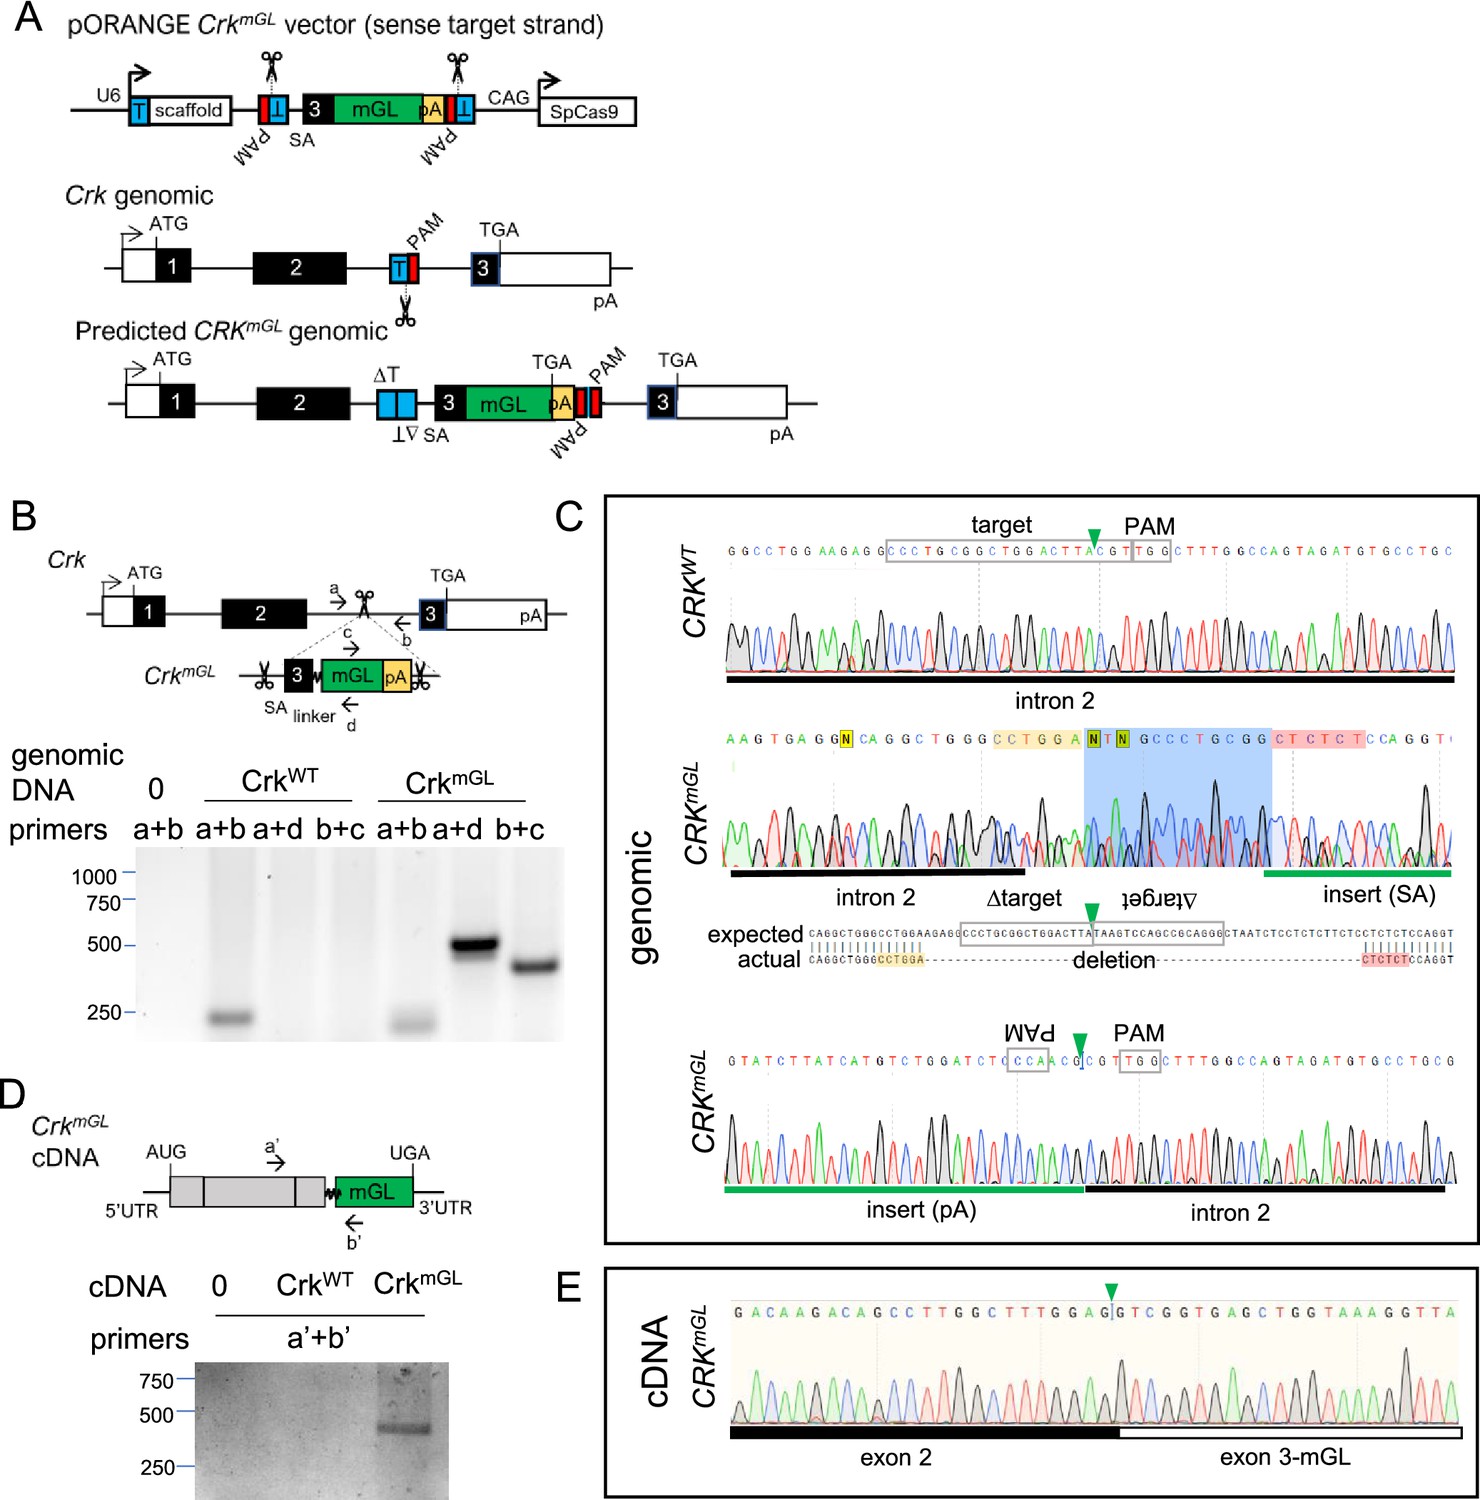
Vector design and validation of CrkmGL tagging.
(A) Overview of approach for C-terminal tagging endogenous Crk by inserting an artificial exon and 3′ poly A signal. T, target sequence; PAM, protospacer adjacent motif; SA, splice acceptor; SD, splice donor, SpCas9, Streptococcus pyogenes Cas9; pA, SV40 poly A signal sequence; linker, GGGS sequence. (B) Primer positions and PCR products amplified from CrkWT and CrkmGL genomic DNA. (C) Sanger sequencing of CrkWT (amplified with primers a+b) and 5′ and 3′ junctions of CrkmGL (amplified with a+d and c+b, respectively) genomic DNA. Note poor sequencing and deletion indicative of imprecise insertion. (D) Primer positions and PCR products amplified from CrkWT and CrkmGL cDNA. (E) Sanger sequencing of RT-PCR amplified product from exon–exon junction of CrkmGL (primers a′+b′) cDNA. Note in-frame Crk sequence between exon 2 and the introduced exon 3 mGL fusion.
Figure 4 with 4 supplements
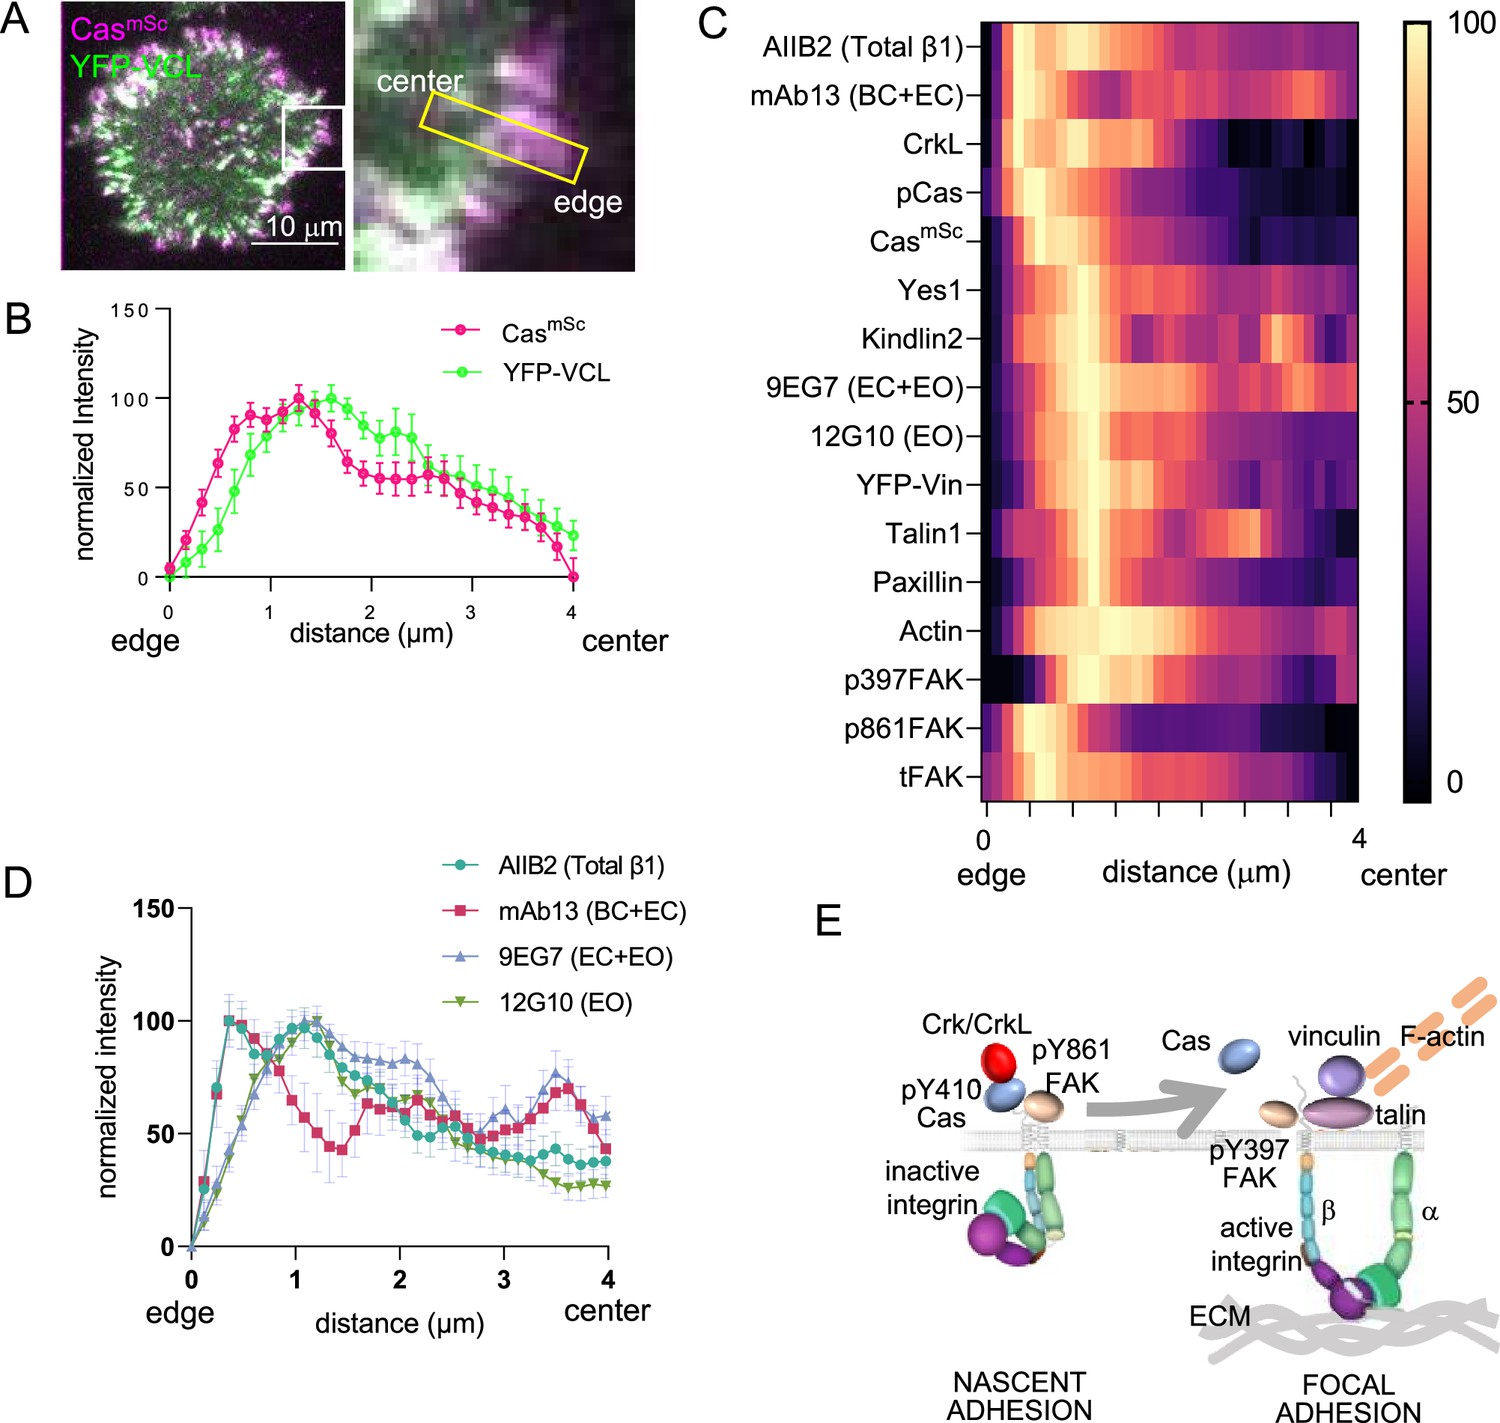
Spatial distribution of proteins in focal adhesions.
(A) Representative image of spreading CasmSc YFP-VCL MCF10A cells illustrating quantification approach. Inset shows 4 × 0.8 μm region of interest (ROI) used to quantify intensity against distance from cell edge. (B) Normalized intensity profiles of CasmSc and YFP-VCL across ≥20 ROIs from several cells. Error bars indicate mean and standard error of the mean (SEM). (C) Heat map of normalized intensity profiles for various antigens in CasmSc cell adhesions stained with indicated antibodies. (D) Normalized intensity profiles using conformation-sensitive integrin β1 antibodies; AIIB2, total integrin β1; mAb13, bent closed (BC) and extended closed (EC) conformations; 9EG7, EC and extended open (EO) conformations; 12G10, EO conformation. (E) Model showing inferred progression from nascent adhesions or focal complexes containing high levels of pY410Cas, inactive integrin and pY861FAK, to focal adhesions containing low levels of Cas and high levels of active integrin, vinculin, pY397FAK, F-actin, talin, paxillin, and kindlin.
Figure 4—figure supplement 1
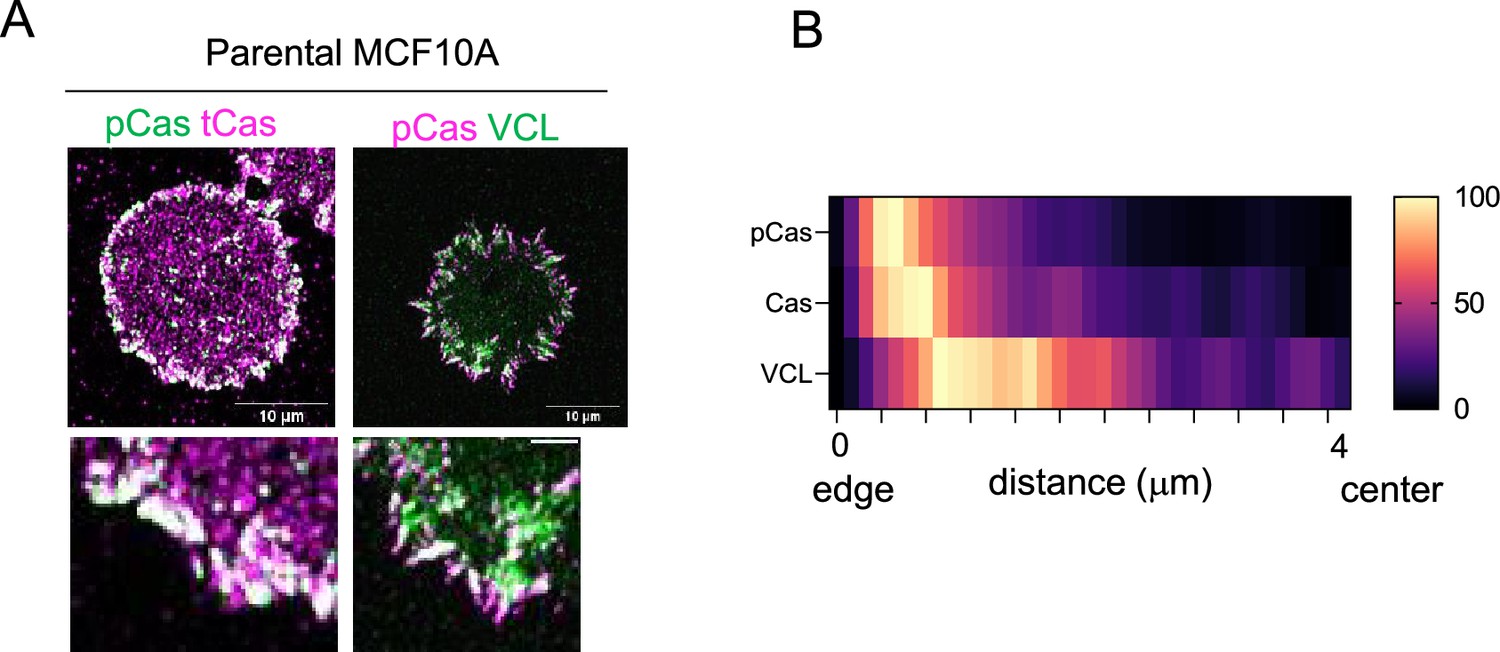
Spatial distribution of endogenous untagged Cas and vinculin in focal adhesions of parental MCF10A cells.
(A) Parental MCF10A cells stained for pY410Cas and total Cas (left), or pY410Cas and vinculin (right). (B) Heat map of normalized mean immunofluorescence intensity against distance pY410Cas, Cas and vinculin in parental MCF10A.
Figure 4—figure supplement 2
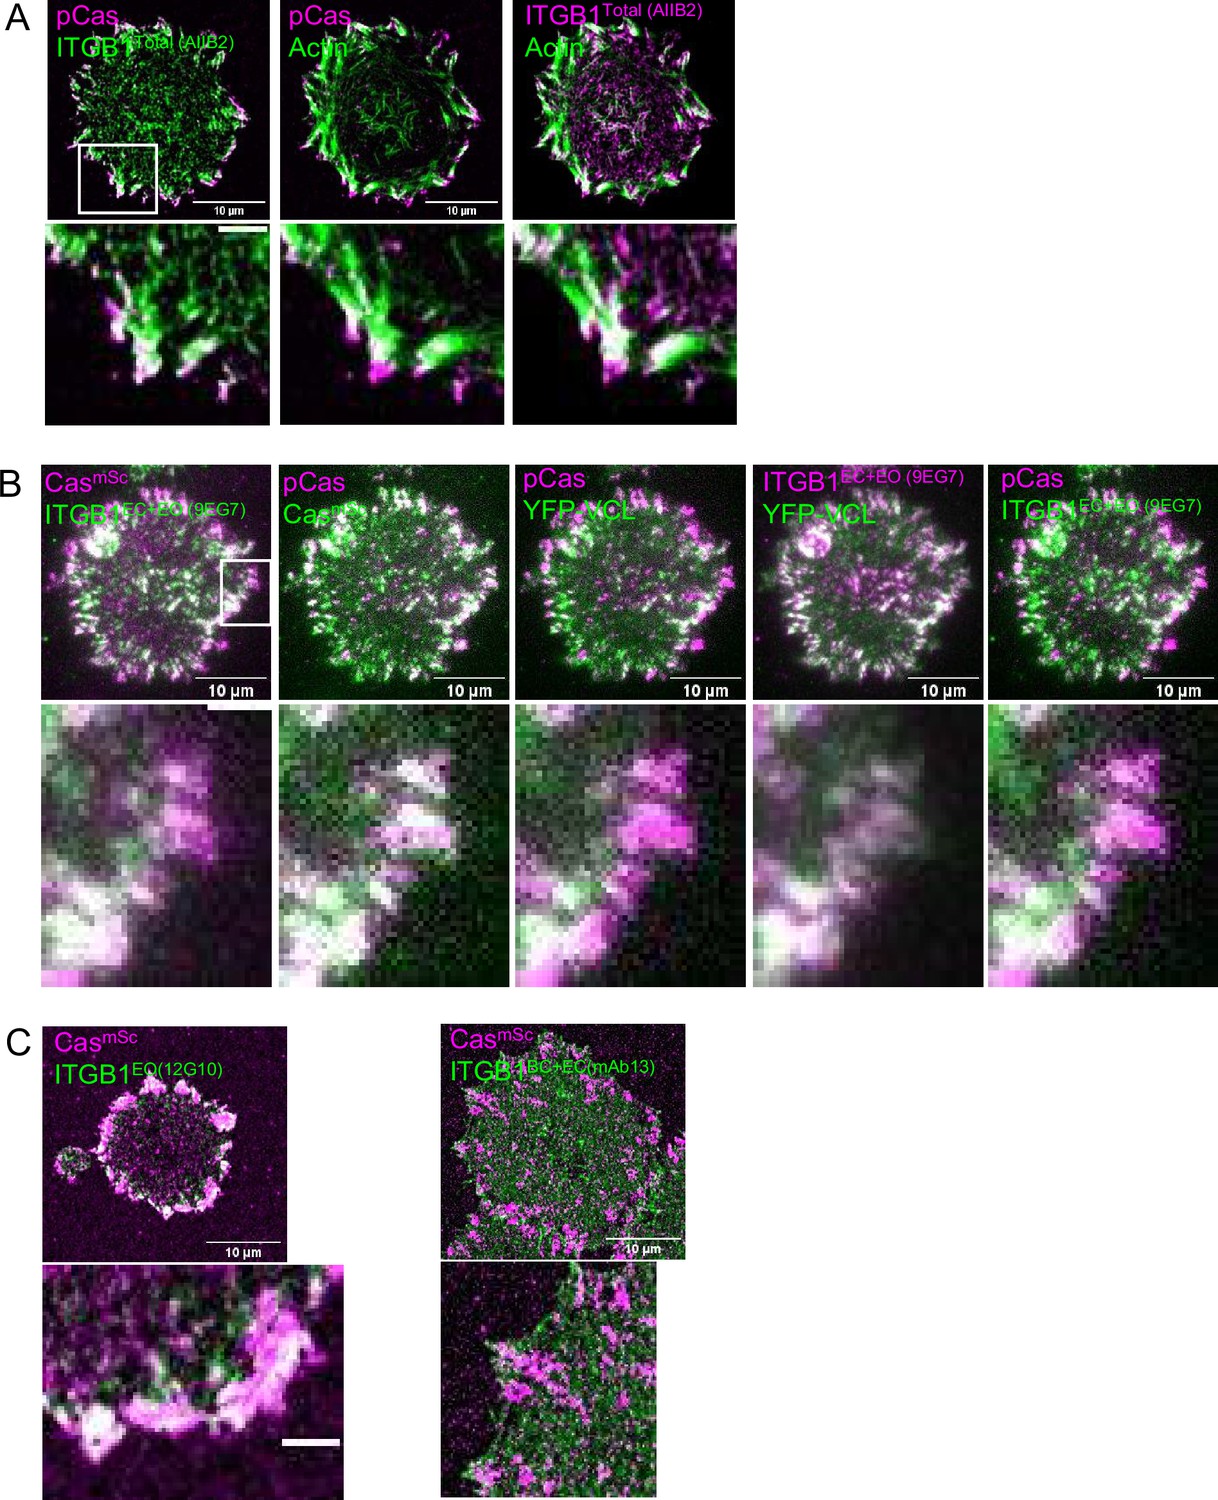
Representative images quantified for Figure 4.
(A) CasmSc MCF10A cell stained for pY410Cas, Total integrin β1 (AIIB2), and F-actin. (B) CasmSc YFP-VCL MCF10A cell stained for pY410Cas and EC + EO integrin β1 (9EG7). (C) CasmSc MCF10A cells stained for EO integrin β1 (12G10) and BC + EC integrin β1 (mAb13).
Figure 4—figure supplement 3
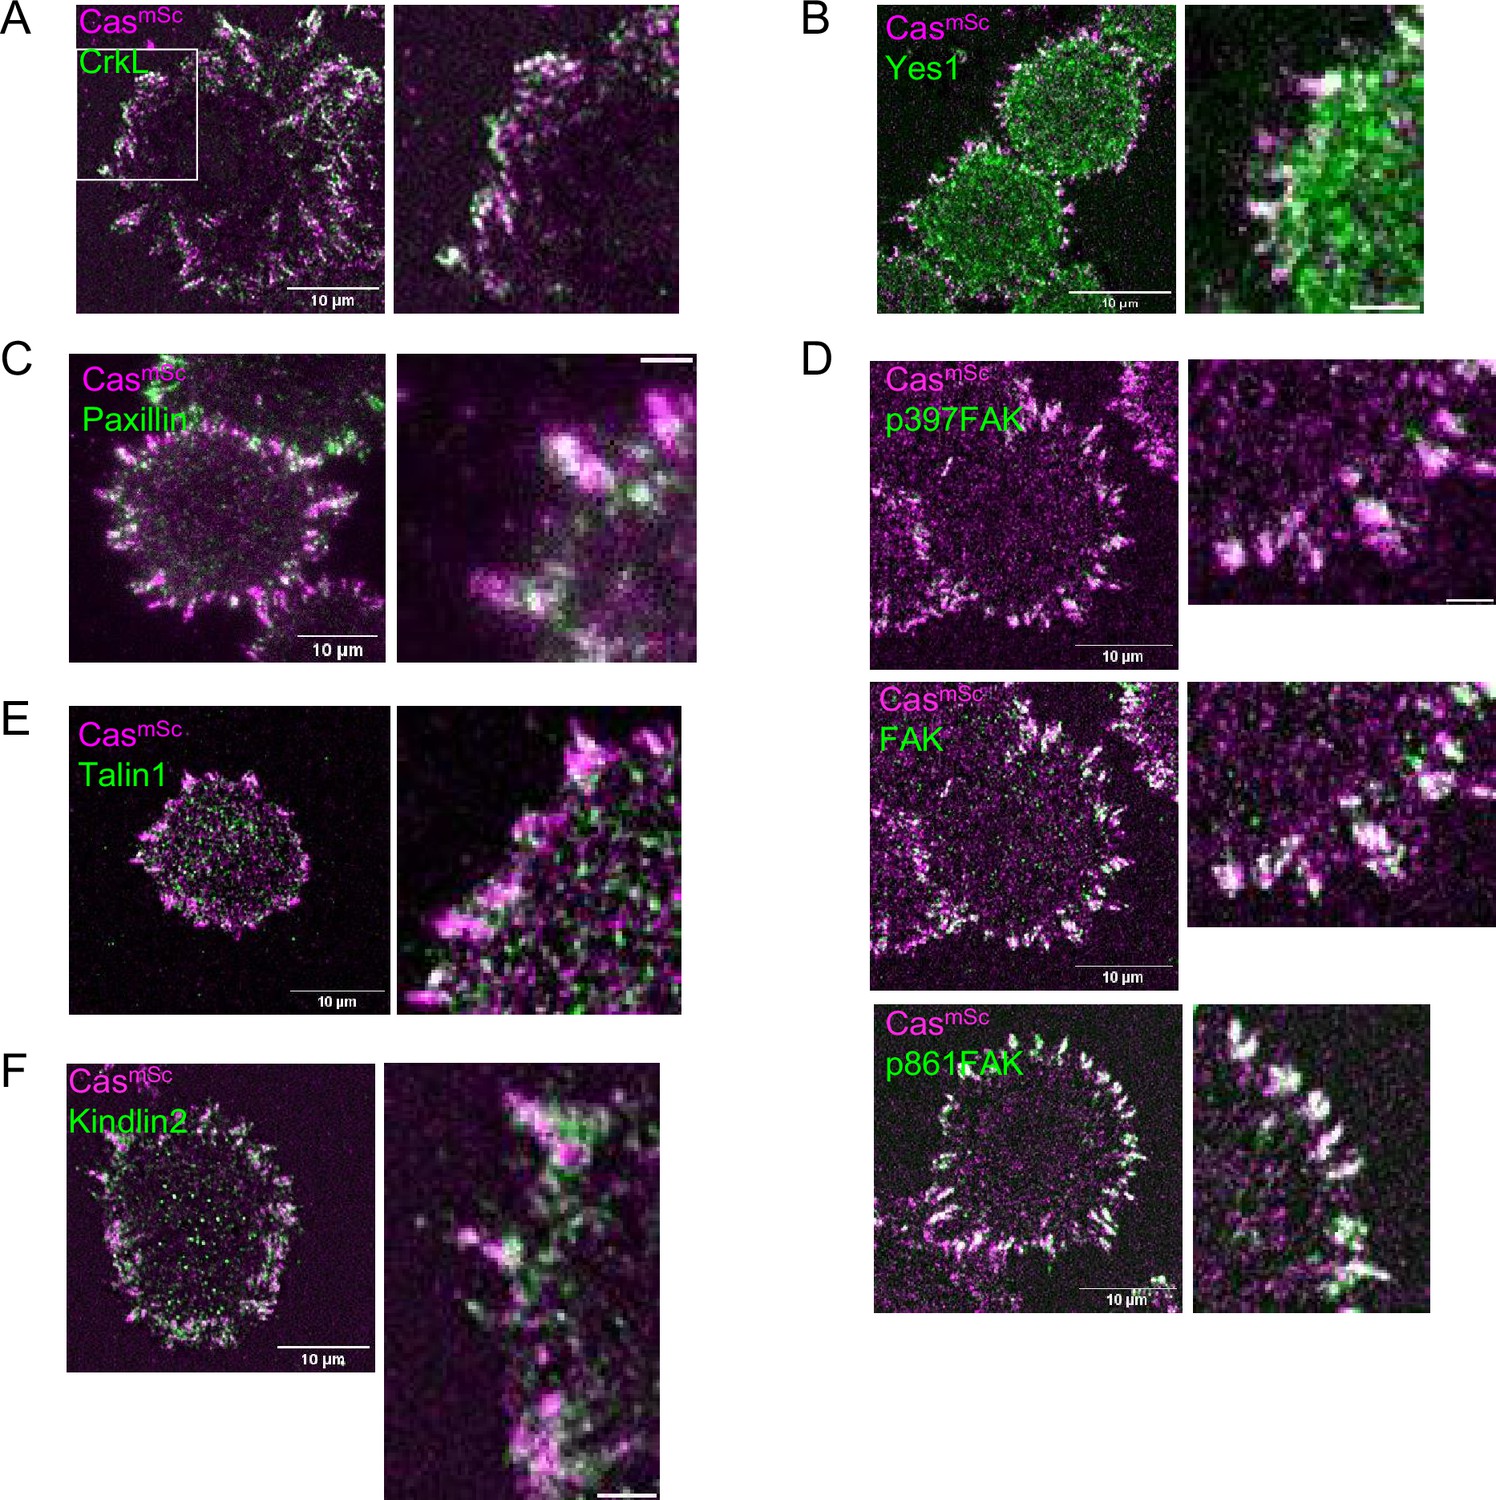
Representative images quantified for Figure 4.
(A) CasmSc MCF10A cell stained for CrkL. (B) CasmSc MCF10A cell stained for Yes1. (C) CasmSc MCF10A cell stained for Paxillin. (D) CasmSc MCF10A cell stained for p397FAK, FAK, p861FAK. (E) CasmSc MCF10A cell stained for Talin1. (F) CasmSc MCF10A cell stained for Kindlin2.
Figure 4—figure supplement 4
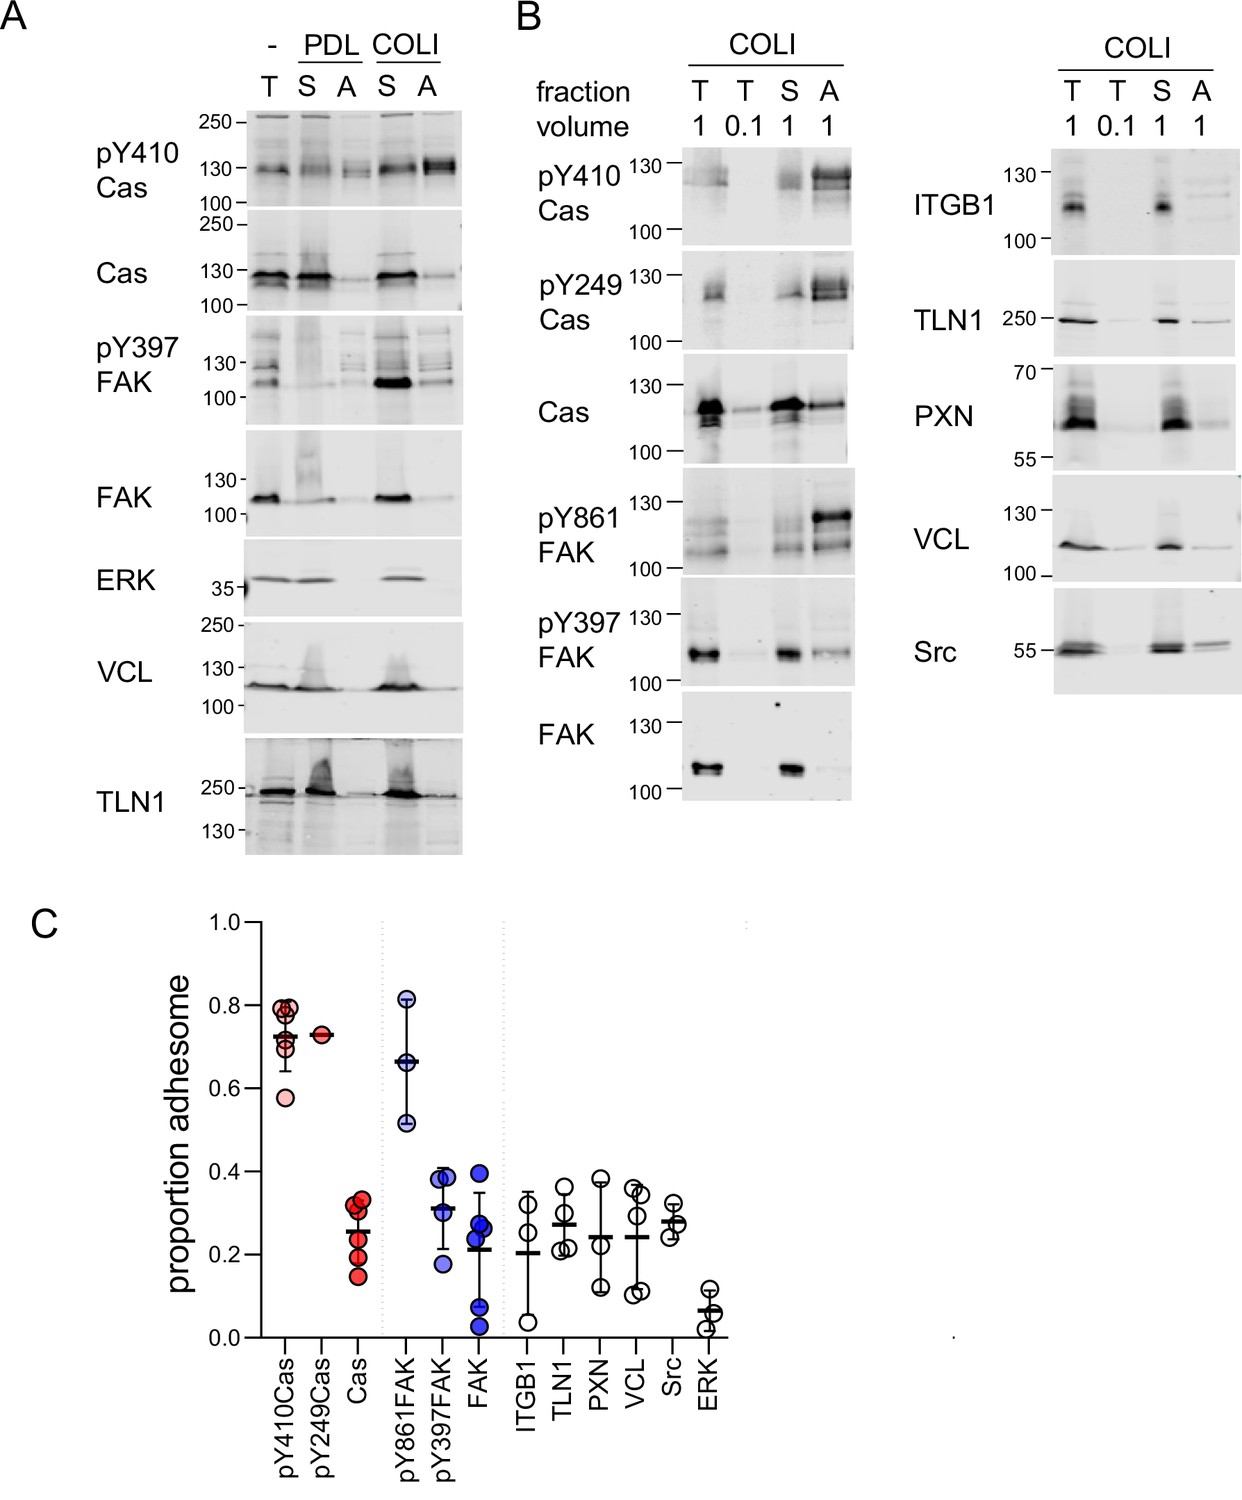
Enrichment of phosphorylated Cas in the adhesome.
(A, B) Representative results from two independent experiments. Western blots of total (T), supernatant (S), and adhesome (A) fractions from cells plated on different extracellular matrix (ECM) for 60 min were probed with the indicated antibodies. PDL, poly-D-lysine; COLI, collagen-I. (C) Quantification of multiple independent experiments. Proportion adhesome was calculated from A/(S + A). Error bars indicate mean and standard deviation (SD).
Figure 5 with 5 supplements

Cas is required for focal adhesion assembly.
(A) Representative images (ventral section) of CasmSc MCF10A cells treated with control, Cas, or vinculin siRNA and fixed and stained with vinculin antibodies after 30 min of spreading on COLI. (B) Quantification of mean cell area and the number and mean intensities of Cas and/or vinculin clusters. Error bars show mean and standard error of the mean (SEM) for n = 10–50 cells from three biological repeats. (C) Median Δt1/2 (VCL-Cas) of multiple regions of interest (ROIs) from 8 to 20 spreading CasmSc YFP-VCL MCF10A cells treated with Ctrl, Crk, CrkL, and Crk + CrkL siRNA. Error bars show mean and SEM. (D) Median Δt1/2 (VCL-Cas) from 13 to 16 time-lapse dual-color total internal reflection (TIRF) micrographs of spreading CasmSc YFP-VCL MCF10A cells treated with DMSO or SFK inhibitor eCF506. (E) Mean cluster intensity of pY410Cas, CasmSc and YFP-VCL in CasmSc YFP-VCL MCF10A cells treated with control, Src, Fyn, or Yes1 siRNA and fixed after 30 min of spreading. Error bars show mean and SEM from n = 7–10 cells from three biological repeats. (F) Cas requirement for outside-in signaling. YFP-VCL MCF10A cells were treated with control or Cas siRNA and allowed to attach in the absence or presence of Mn2+ for 30 min. Graphs show the mean cell spread area and mean intensity of YFP-VCL clusters. Error bars show mean and SEM for n = 6–20 cells from two biological repeats. ns, not significant; *p < 0.05; **p < 0.01; ***p < 0.001; ****p < 0.0001 by Kruskal–Wallis followed by Dunn’s multiple comparison test (A–E) or pairwise Mann–Whitney U-tests (F).
Figure 5—figure supplement 1
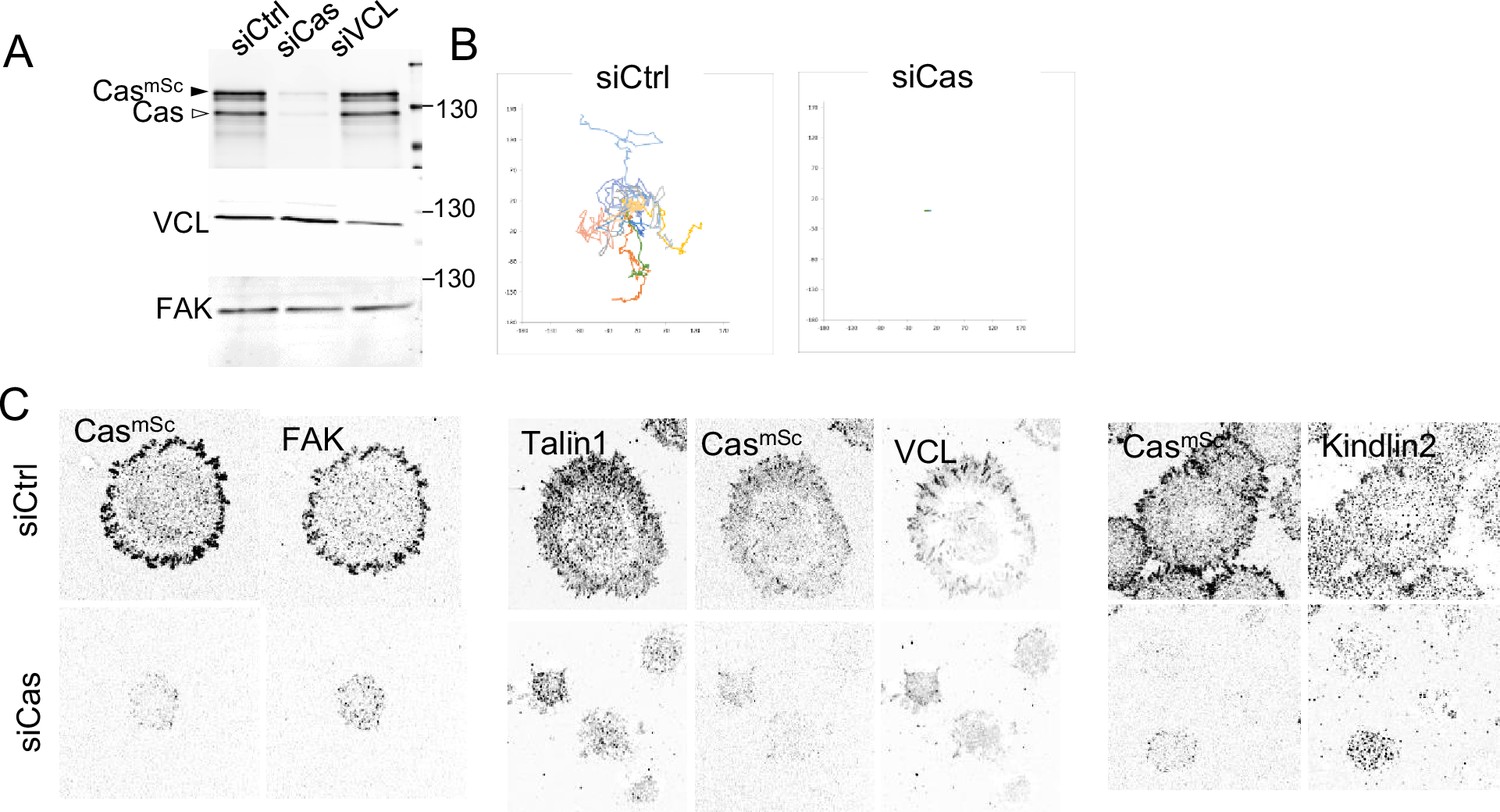
Cas depletion inhibits cell migration, spreading, and formation of adhesions containing focal adhesion kinase (FAK), talin1, and kindlin2.
(A) Immunoblot of cell lysates harvested from CasmSc MCF10A cells treated with control, Cas, or VCL siRNA. (B) Wind-rose plots depicting total path traveled (12 hr) for cells treated with control or Cas siRNA. (C) Representative images (ventral section), of CasmSc YFP-VCL MCF10A cells treated with control or Cas siRNA and stained with indicated antibodies.
Figure 5—figure supplement 2
Cell spreading and adhesion assembly require Cas phosphorylation sites.
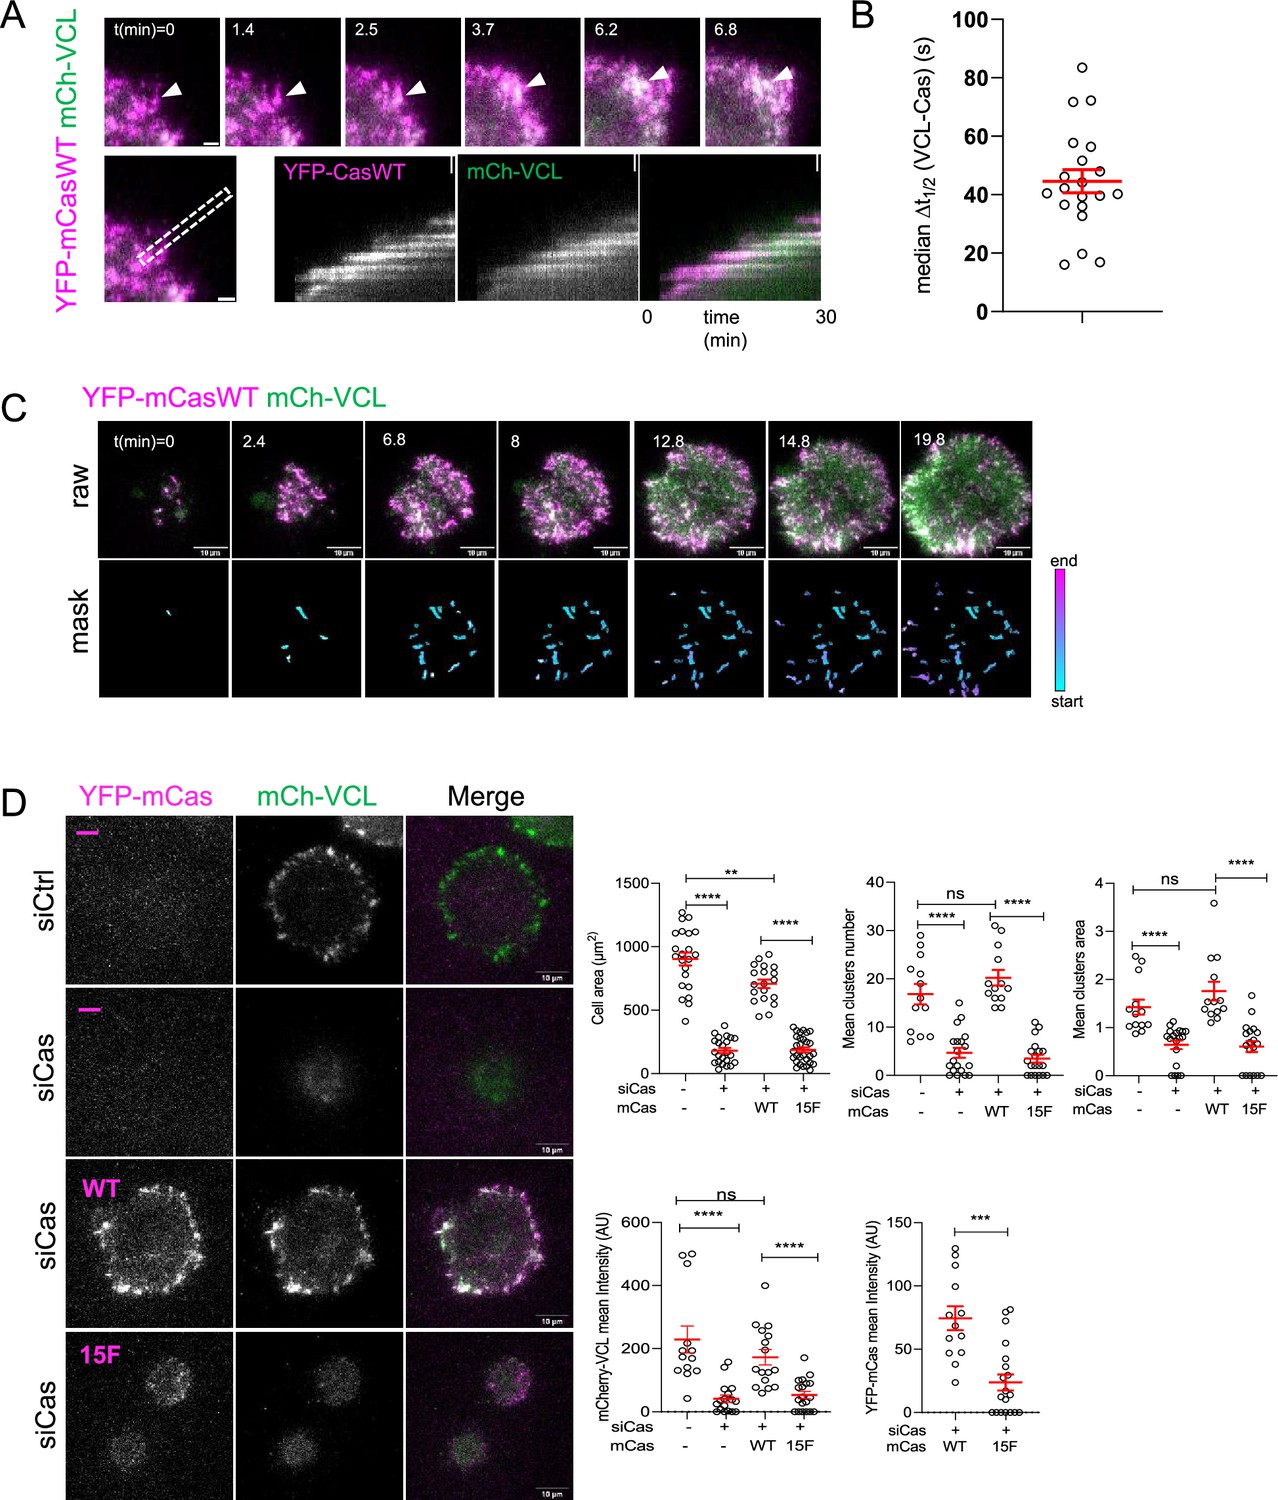
(A–C) MCF10A cells were transduced to express mCherry-VCL and wildtype (WT) YFP-mouse (m) Cas, were plated on COLI, and imaged. (A) Individual time frames and kymographs. (B) Median Δt1/2 (VCL-Cas) of multiple regions of interest (ROIs) from 20 spreading cells. Error bar shows mean (44.6 s) and standard error of the mean (SEM) (4 s). (C) Representative images. Upper panels: raw images. Lower panels: masks showing tracked ROIs, color coded by time of onset. (D) mCas rescues Cas knockdown depending on the YxxP sites. Representative images of mCherry-VCL MCF10A cells re-expressing vector (−) or wildtype (WT) or 15F mutant YFP-mCas treated with control or Cas siRNA. Quantification of mean cell area, cluster number and area, mean mCherry-VCL intensity, and mean YFP-mCas intensity of individual clusters. Error bars show mean and SEM for n = 16–30 cells from three biological repeats. ns, non-significant; **p < 0.01; ***p < 0.001; ****p < 0.0001 by Kruskal–Wallis followed by Dunn’s multiple comparison test.
Figure 5—figure supplement 3
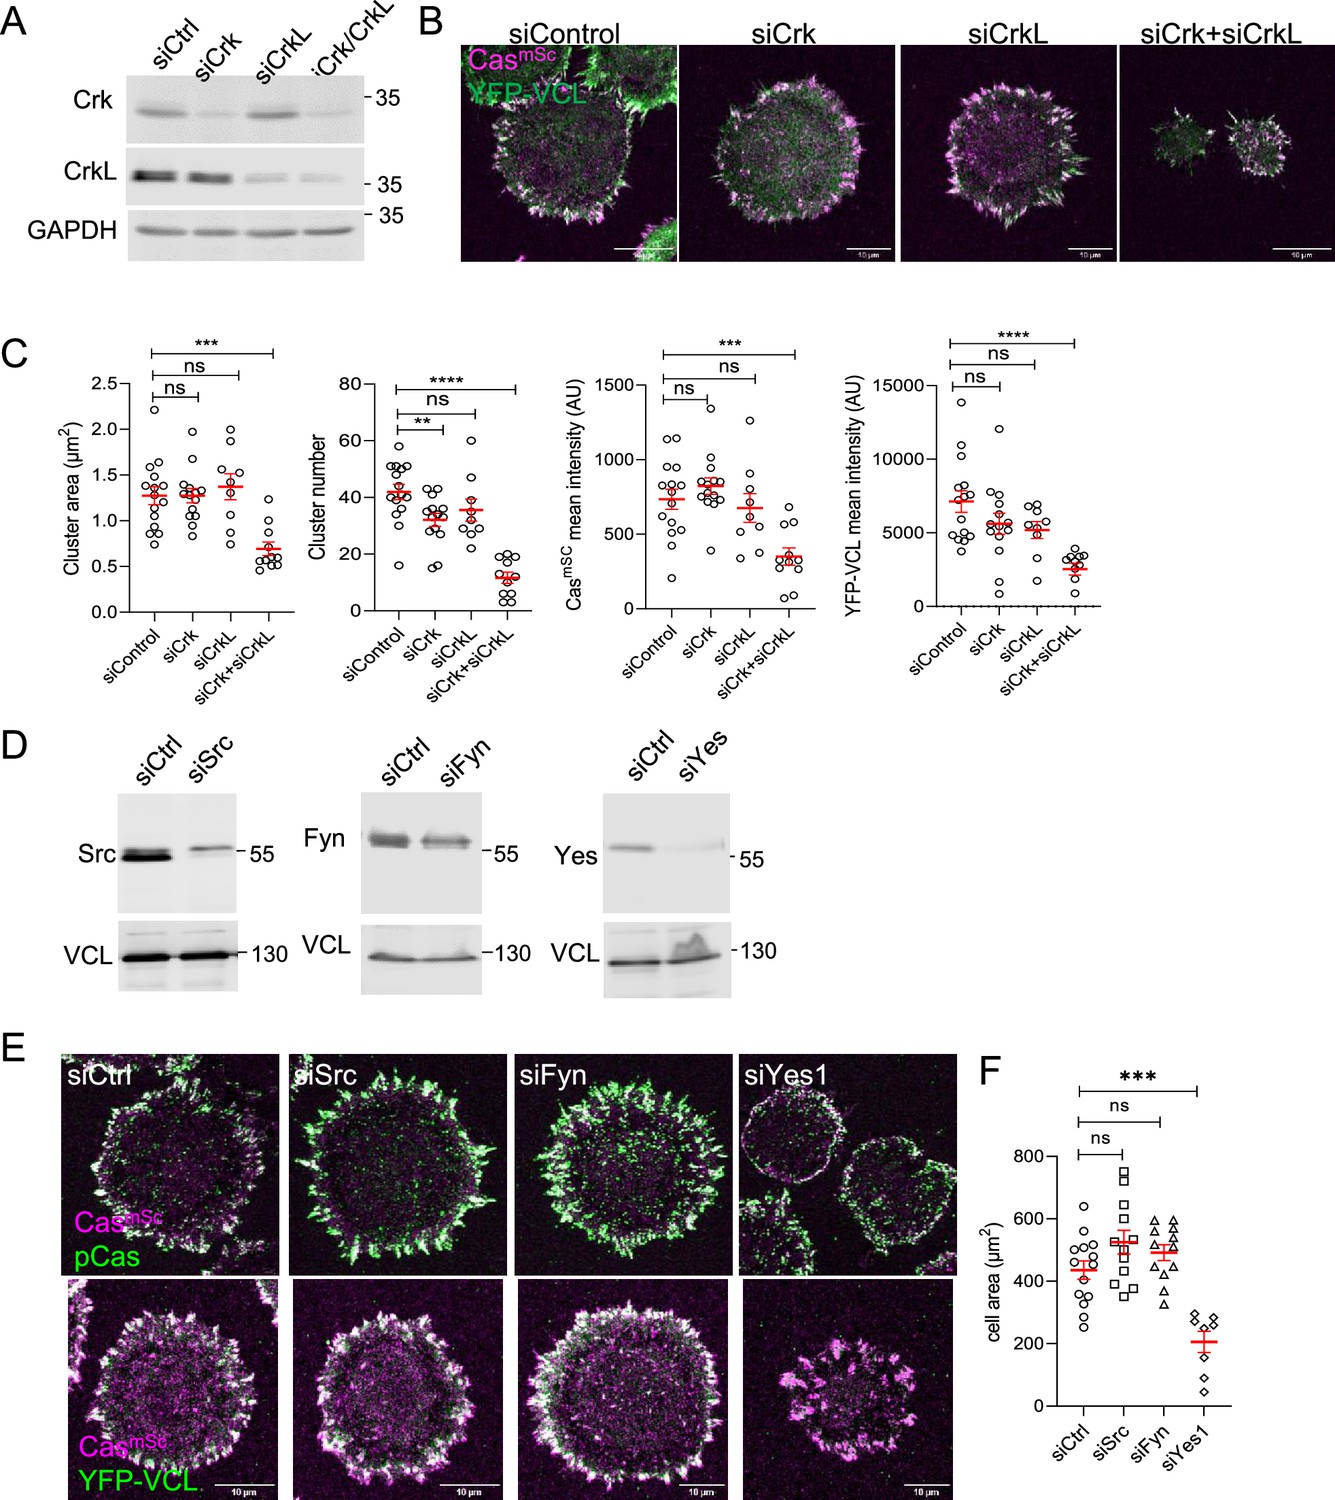
SFK–Cas–Crk–Rac1 signaling regulates adhesion assembly.
(A–C) Crk/CrkL knockdown. (A) Representative immunoblots, (B) images, and (C) quantification of Cas–vinculin cluster area, number, and mean intensity following treatment with control, Crk, CrkL, or Crk/CrkL siRNA. Error bars show mean and standard error of the mean (SEM) for n = 9–15 cells from three biological repeats. (D–F) SFK knockdown. (D) Representative immunoblots, (E) images, and (F) quantification following treatment with control, Src, Fyn, or Yes1 siRNA. ns, non-significant; *p < 0.05; **p < 0.01; ***p < 0.001; ****p < 0.0001 by Kruskal–Wallis followed by Dunn’s multiple comparison test.
Figure 5—figure supplement 4
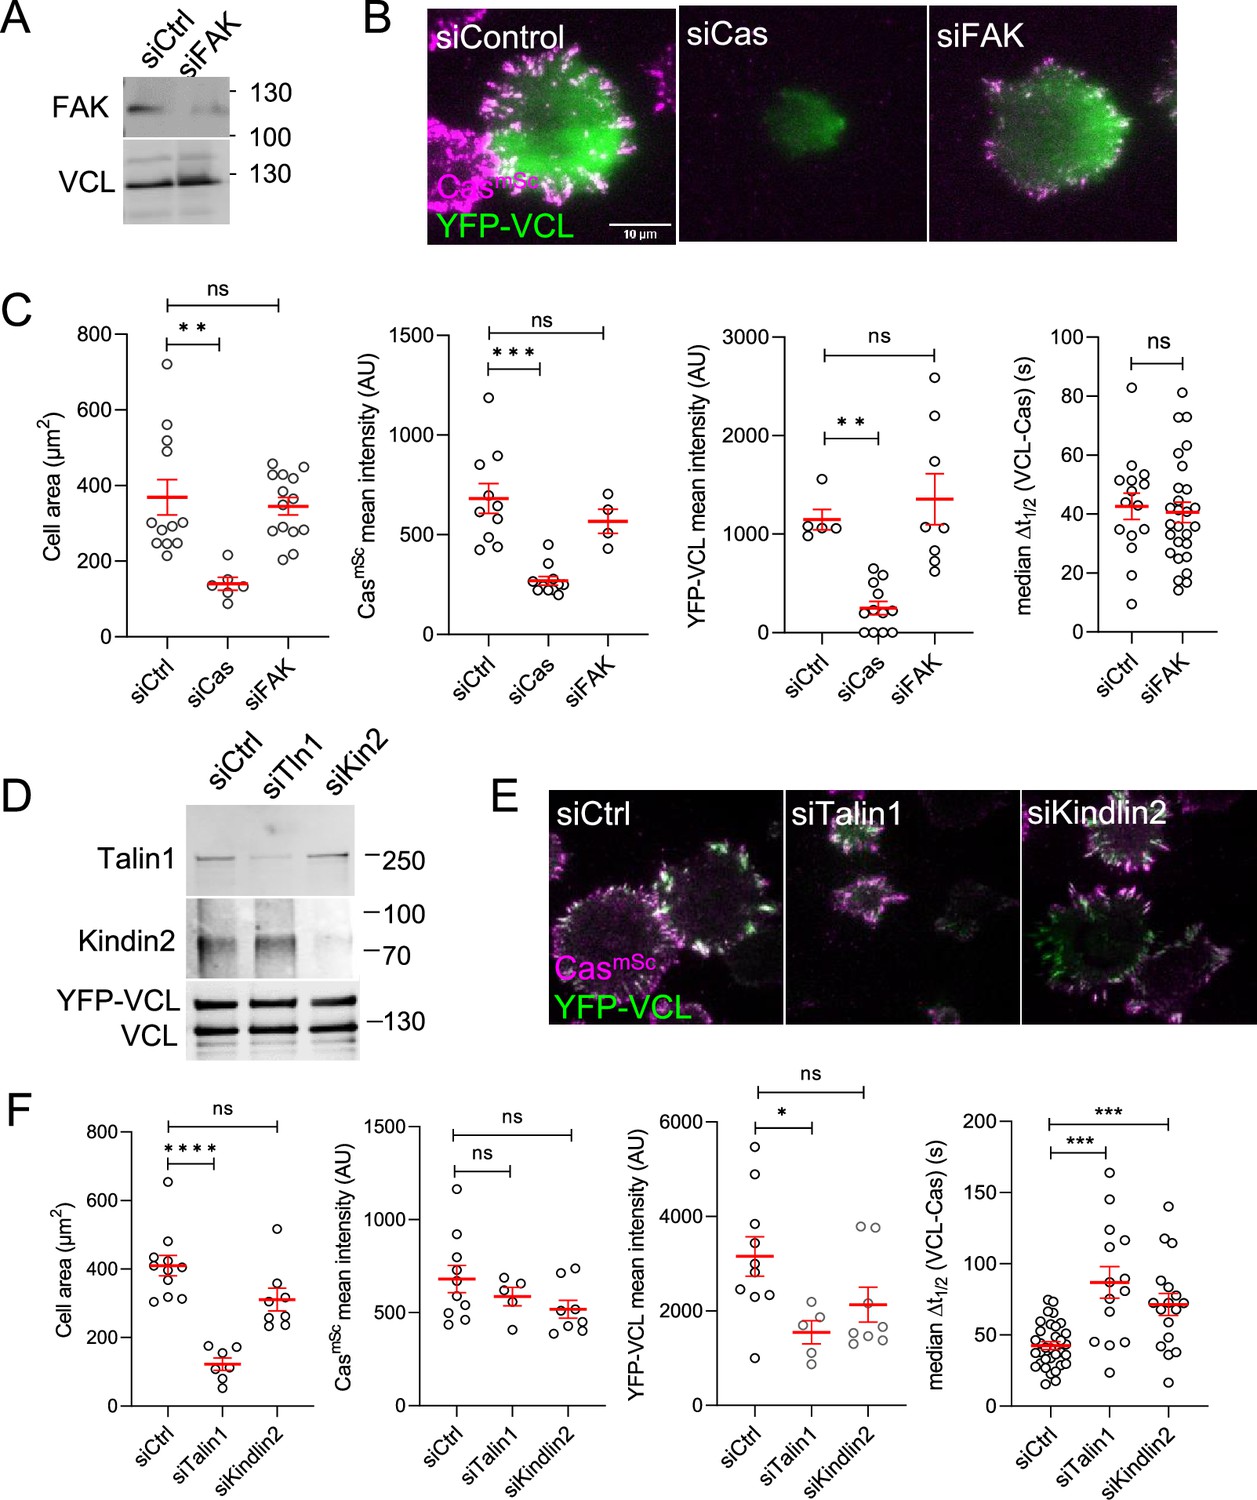
Focal adhesion kinase (FAK), talin1, and kindlin2 do not regulate Cas clusters.
(A–C) FAK knockdown. (A) Representative immunoblots, (B) images, and (C) quantification of cell area, Cas and vinculin mean intensity, and median time delay between Cas and vinculin recruitment for cells treated with control, Cas, or FAK siRNA. 9–27 cells were analyzed in three biological replicates. (D–F) Talin1 and Kindlin2 knockdown. (D) Representative immunoblots, (E) images, and (F) quantification of cell area, Cas and vinculin mean intensity, and median time delay between Cas and vinculin recruitment for cells treated with control, talin1, or kindlin2 siRNA. 5–34 cells were analyzed in three biological replicates. ns, non-significant; *p < 0.05; **p < 0.01; ***p < 0.001; ****p < 0.0001 by Kruskal–Wallis followed by Dunn’s multiple comparison test.
Figure 5—figure supplement 5
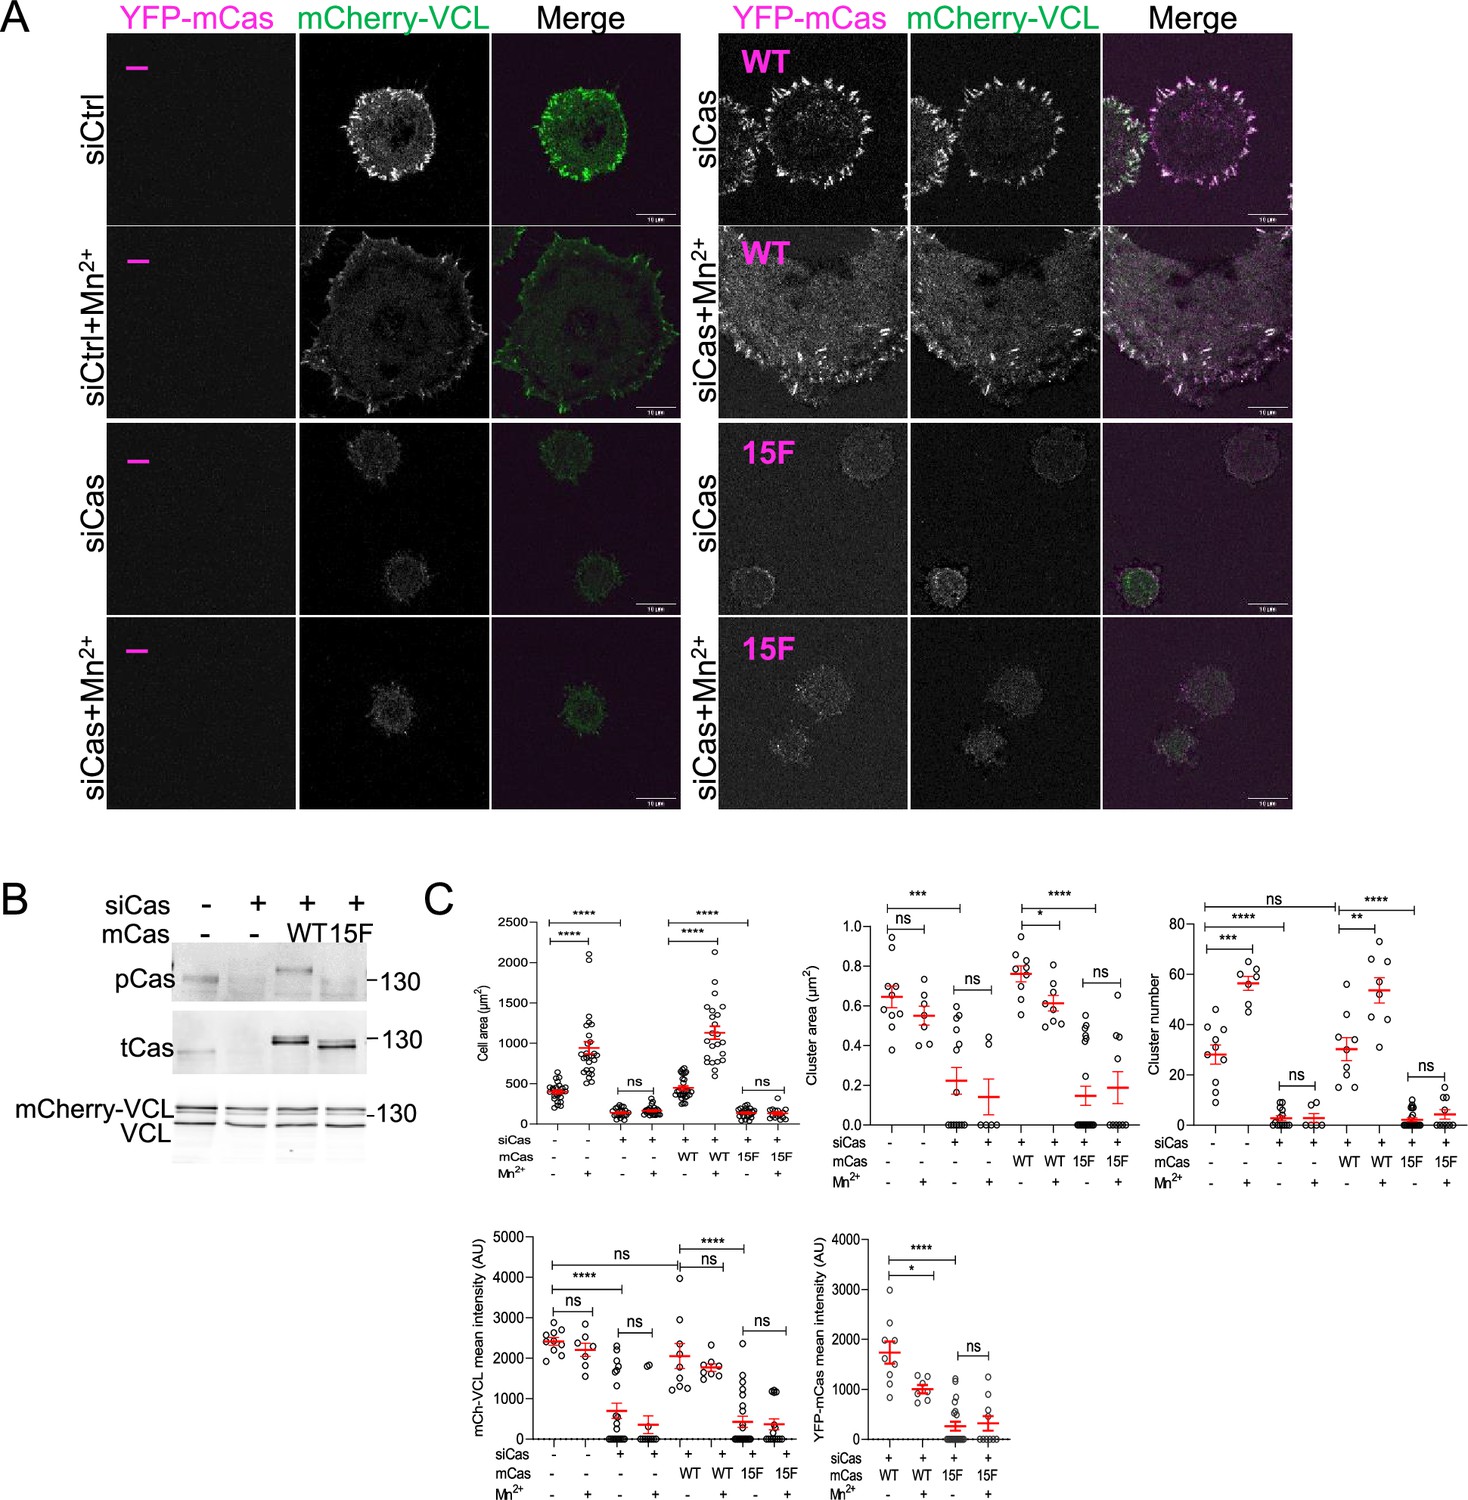
Outside-in integrin activation requires Cas phosphorylation sites.
mCherry-VCL MCF10A cells expressing vector, YFP-mCasWT or 15F as indicated were treated with control or human-specific Cas siRNA and plated on COLI for 30 min in the presence of absence of Mn2+. (A) Images. (B) Immunoblot. (C) Mean cell area and mean number, area, and intensities of Cas–vinculin clusters of 7–29 cells in two biological repeats. ns, not significant; *p < 0.05; **p < 0.01; ***p < 0.001; ****p < 0.0001 by Kruskal–Wallis followed by Dunn’s multiple comparison test.
Figure 6 with 2 supplements

Cas is required for MCF10A and human foreskin fibroblast (HFF) cell spreading and adhesion assembly on different extracellular matrix (ECM).
(A) MCF10A cells plated for 30 min on COLI- or fibronectin (FN)-coated surfaces after control or Cas siRNA treatment. Mean cell area, mean VCL intensity, mean cluster area and number of 7–41 cells in two biological repeats. (B) Median Δt1/2 (VCL-Cas) of CasmSc YFP-VCL MCF10A cells spreading on FN or COLI. Error bars indicate mean and standard error of the mean (SEM). n = 23–25. ns, non-significant by Mann–Whitney test. (C) HFF cells plated for 30 min on COLI- or FN-coated surface after control or Cas siRNA treatment. Mean cell area, mean VCL intensity, mean cluster number, and area, of 6–9 cells in two biological repeats. ns, non-significant; *p < 0.05; **p < 0.01; ***p < 0.001; ****p < 0.0001 by Kruskal–Wallis followed by Dunn’s multiple comparison test.
Figure 6—figure supplement 1
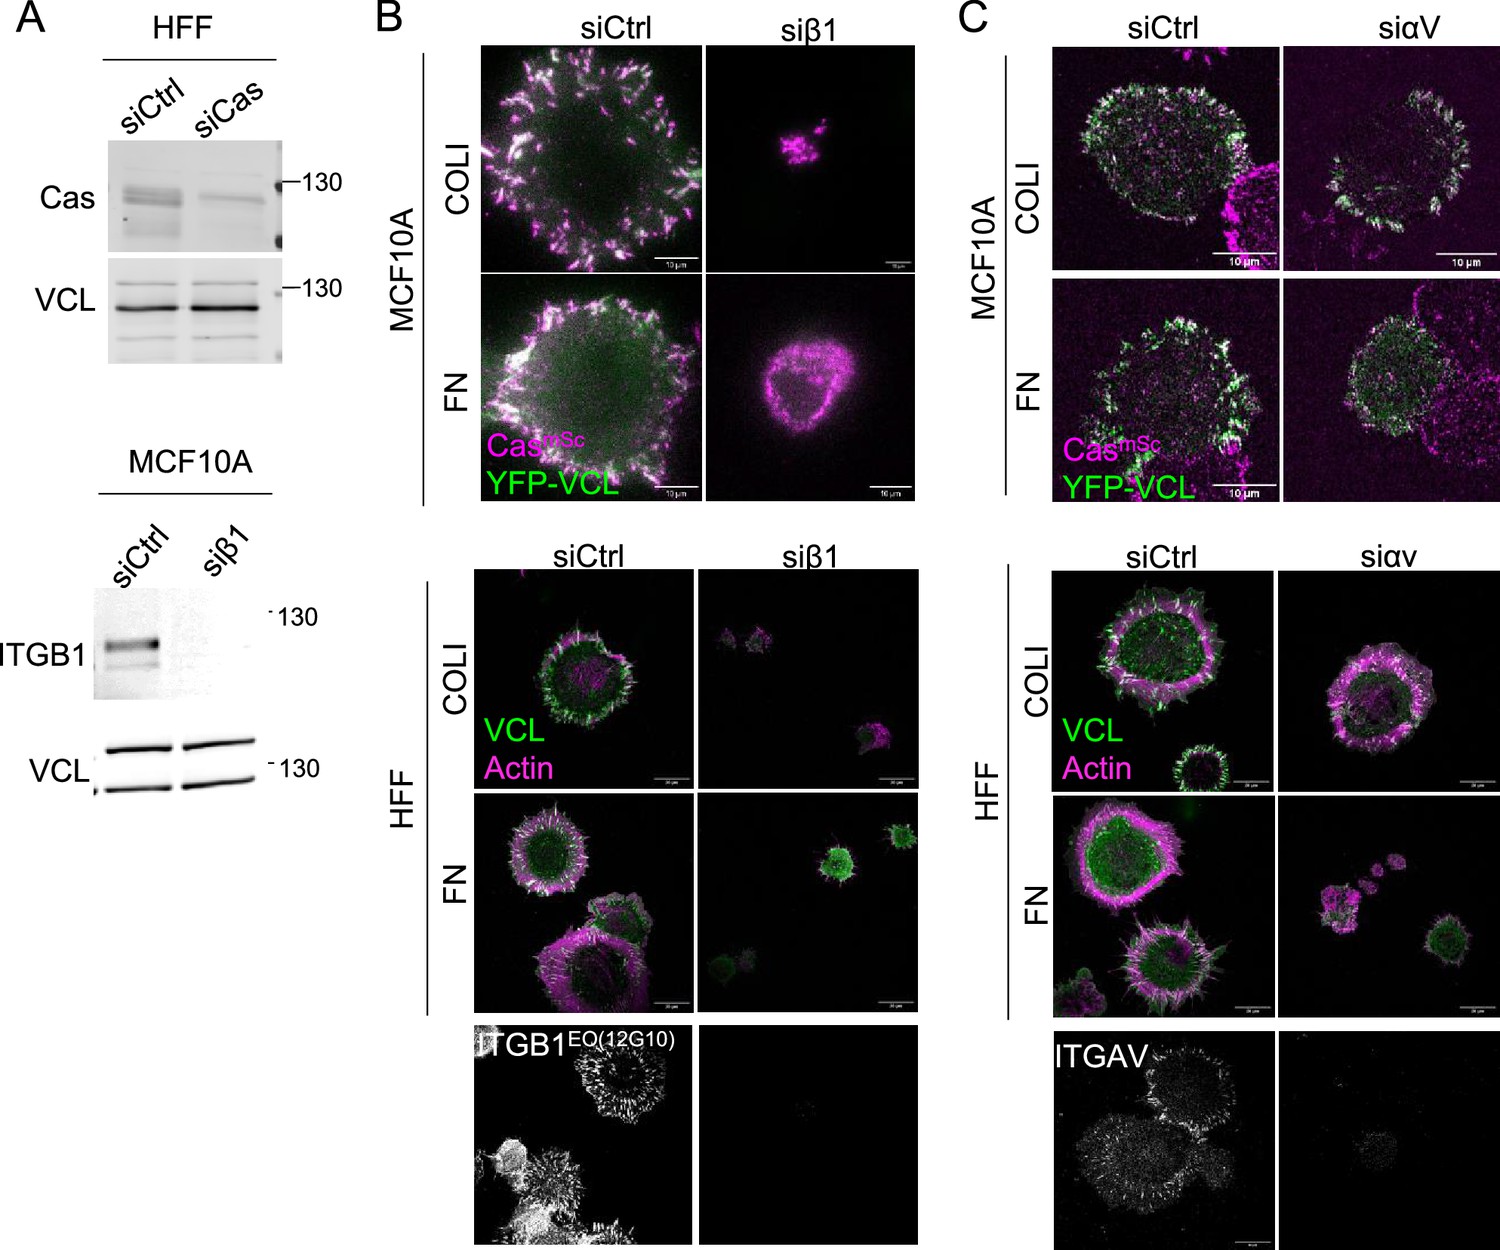
β1 integrin is required for adhesion on both COLI and fibronectin (FN), while αv is required for adhesion on FN.
(A) Representative immunoblots of cell lysates from human foreskin fibroblast (HFF) cells treated with control and Cas siRNA (upper panels), and of CasmSc YFP-VCL MCF10A cells treated with control and ITGB1 siRNA (bottom panels). Images of CasmSc YFP-VCL MCF10A or HFF cells treated with control or ITGB1 (B) and control or ITGAV (C) siRNA. Bottom panels show knockdown efficiency.
Figure 6—figure supplement 2
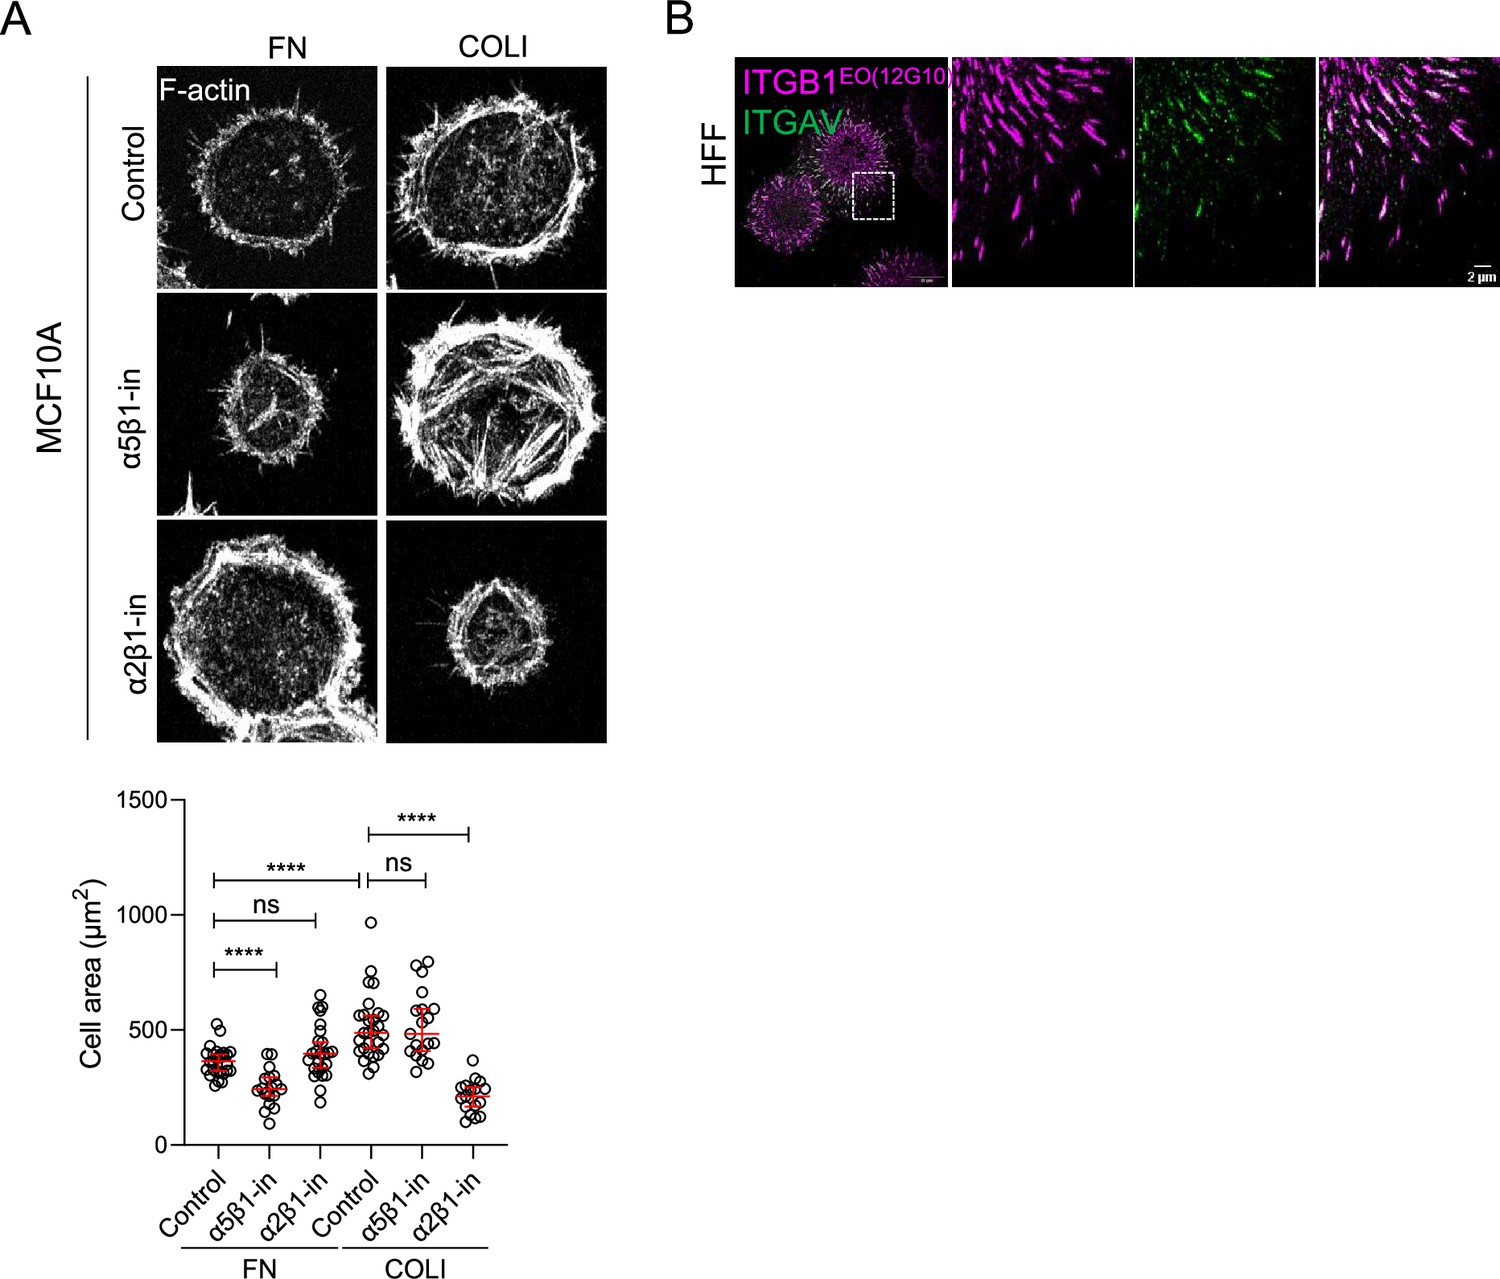
Requirements and organization of specific integrins.
(A) Identification of β1 integrins required for attachment to fibronectin (FN) and COLI. CasmSc MCF10A cells were treated with blocking antibodies α5β1 (P8D4) and α2β1 (P1E6) during spreading on FN- or COLI-coated glass for 30 min. Cells were then fixed and stained with phalloidin to visualize F-actin. Areas of 19–28 cells. ns, non-significant; ****p < 0.0001 by Kruskal–Wallis followed by Dunn’s multiple comparison test. (B) Organization of β1 and αv integrin adhesions on FN. Human foreskin fibroblast (HFF) cells were plated on FN for 30 min, fixed, and stained as indicated.
Figure 7
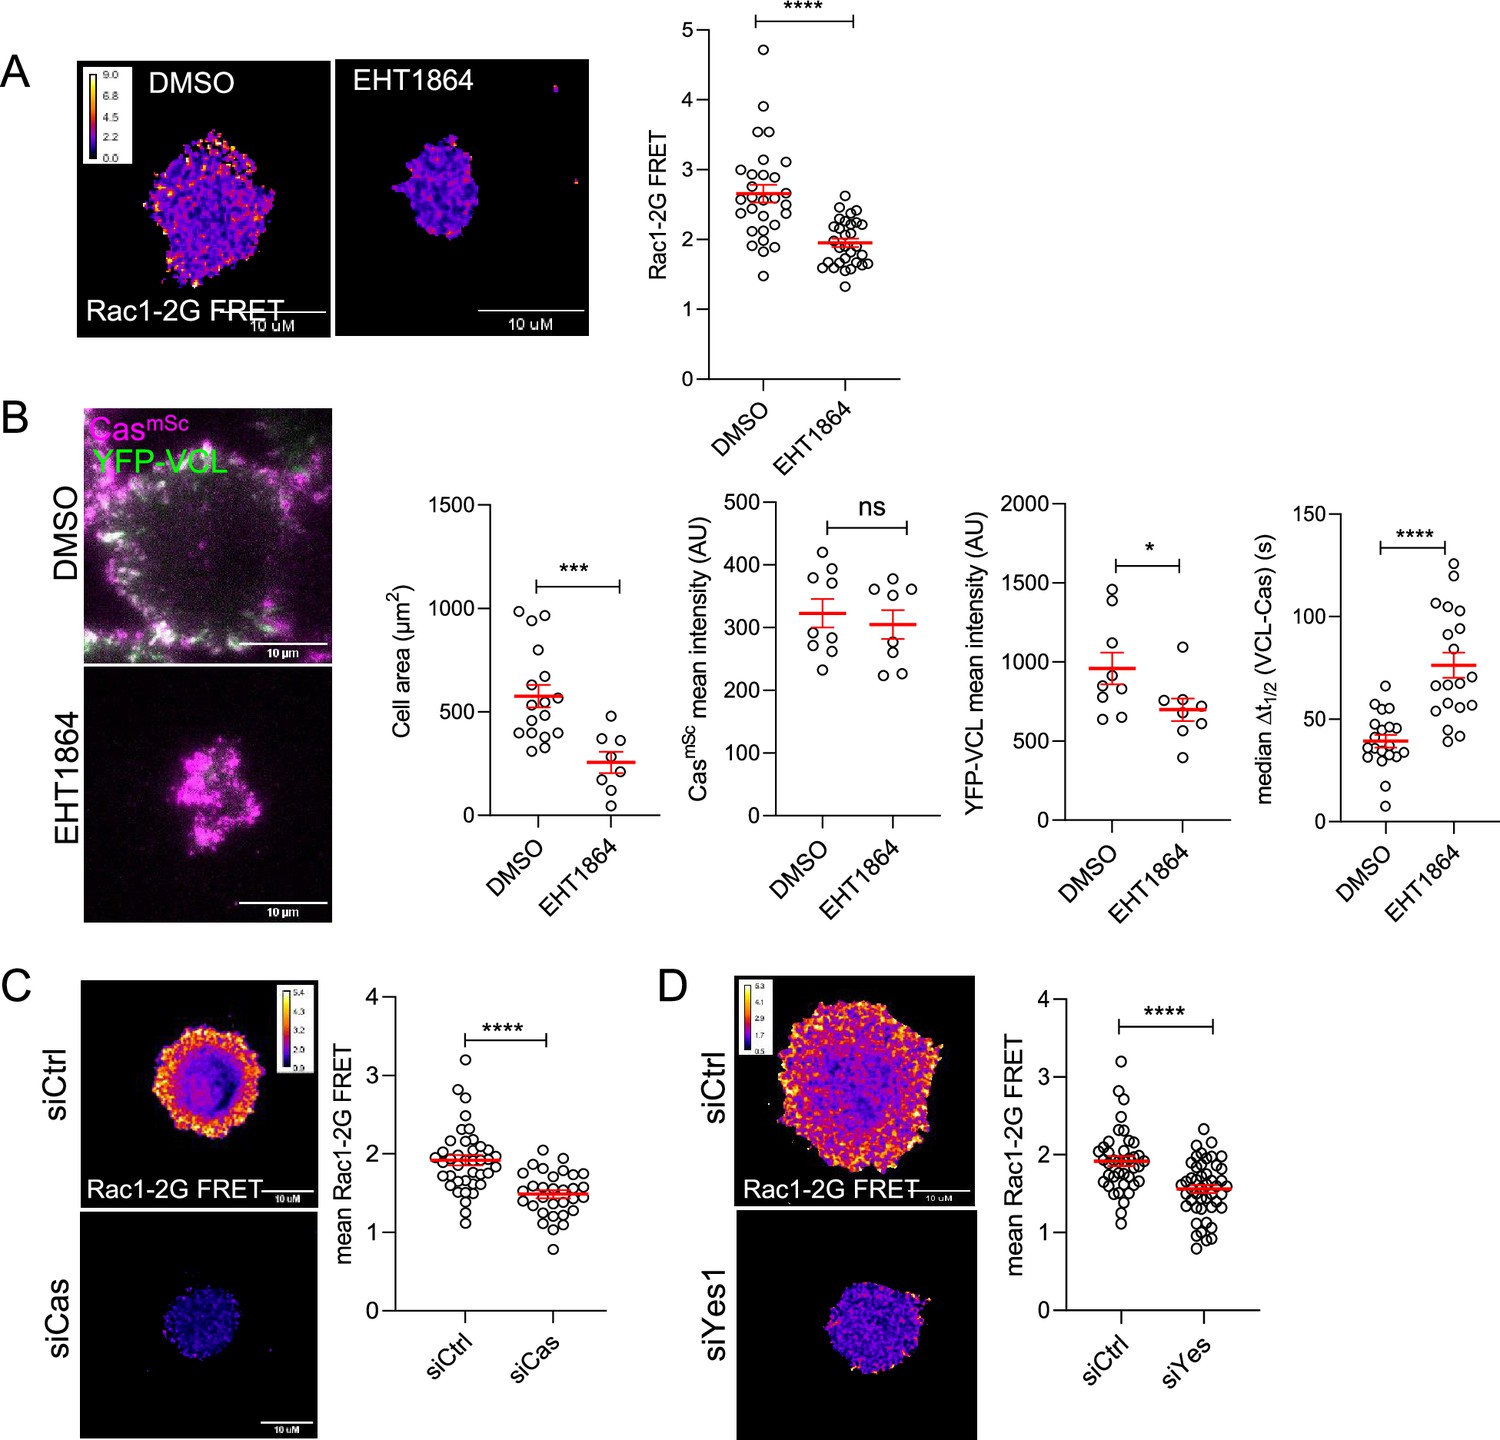
Rac1 mediates Cas-dependent cell spreading and adhesion assembly.
(A) Allosteric inhibitor EHT1864 inhibits Rac1 activation during cell attachment. FRET ratio images (left) and quantification (right) of Rac1-2G MCF10A cells treated with DMSO or EHT1864 and imaged after 30 min attachment. (B) Cell spreading and vinculin but not Cas recruitment requires Rac1. Images and quantification of spreading CasmSc YFP-VCL MCF10A cells treated with DMSO or EHT1864. Error bars show mean and standard error of the mean (SEM) of 8–20 cells in three biological repeats. (C, D) Rac1 activation requires Cas and Yes1. FRET ratio images (left) and quantification (right) of Rac1-2G MCF10A cells treated with (C) control or Cas, or (D) control or Yes1 siRNA. Error bars show mean and SEM from >30 cells from three biological replicates. ns, not significant; *p < 0.05; ***p < 0.001; ****p < 0.0001 by Mann–Whitney U-tests.
Figure 8
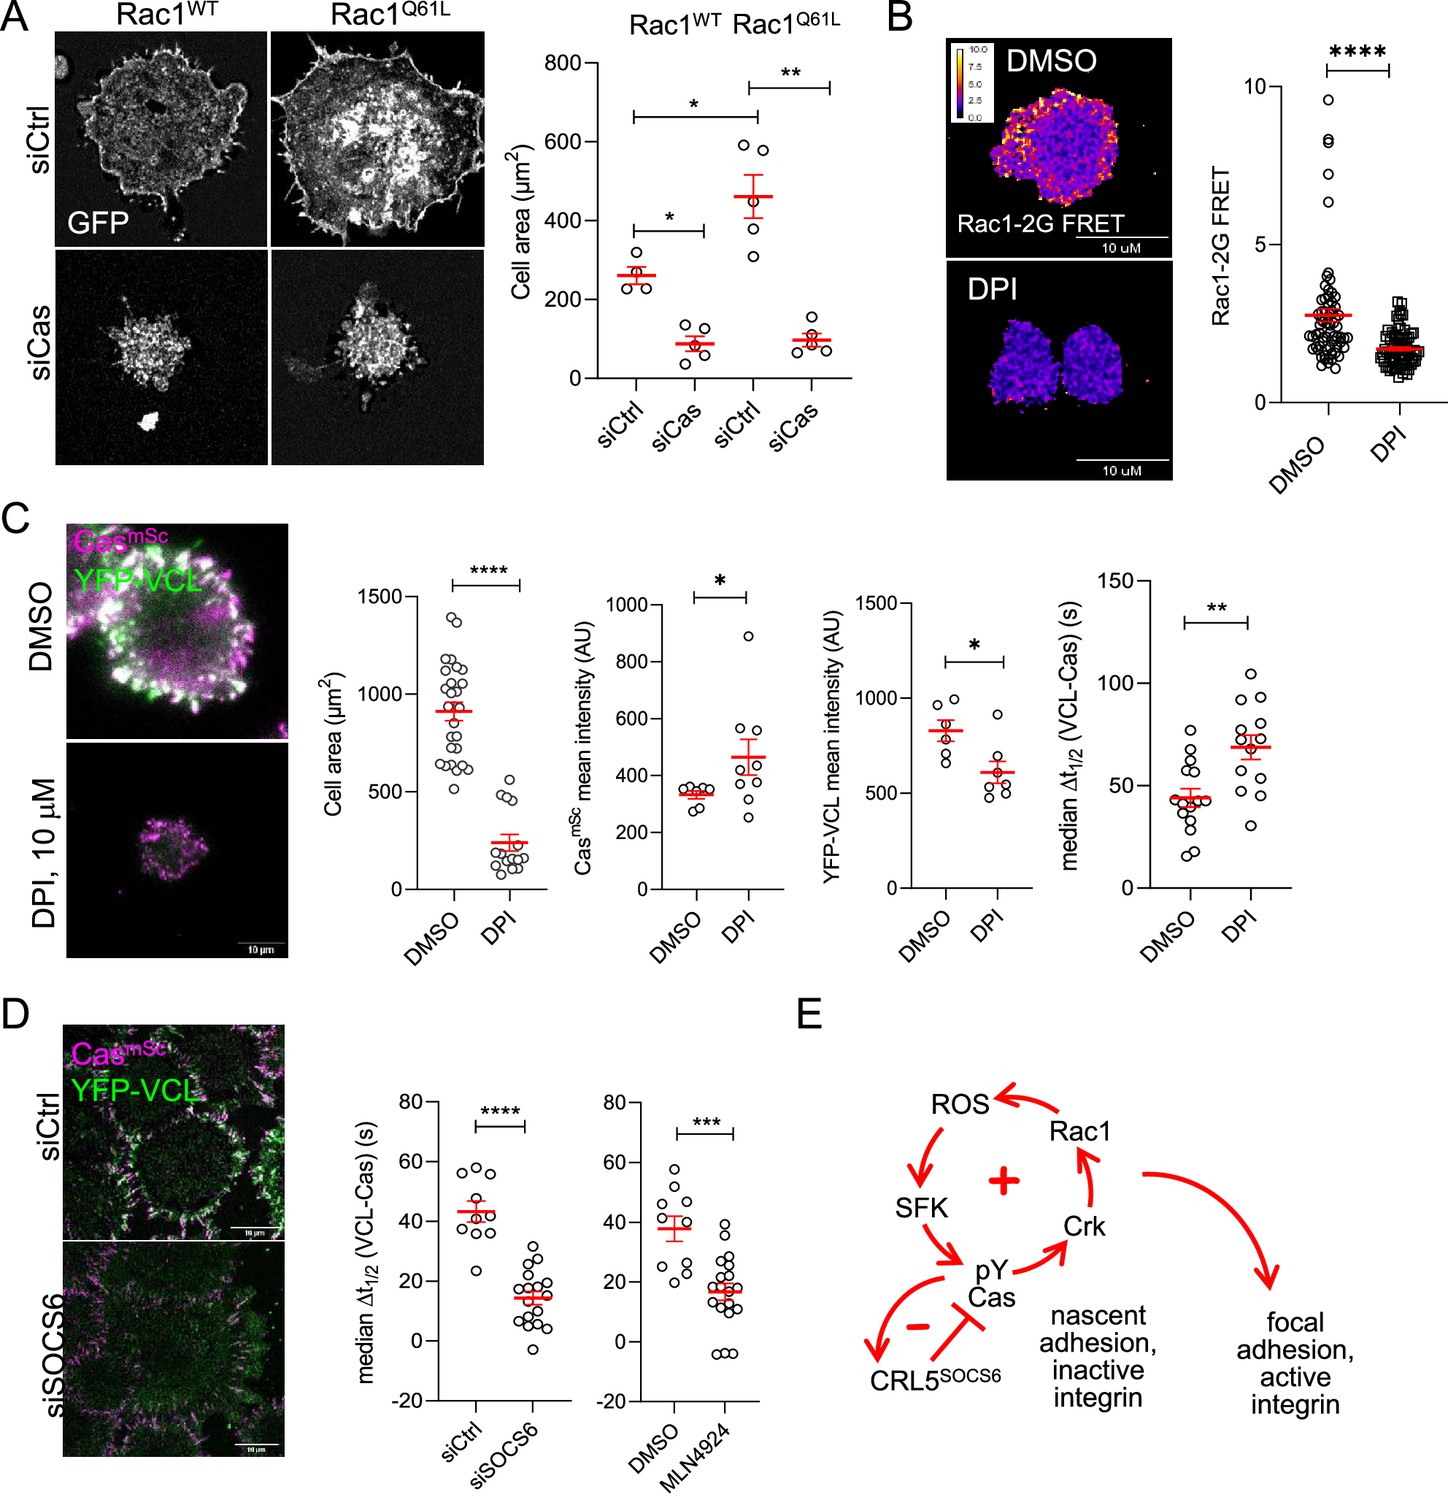
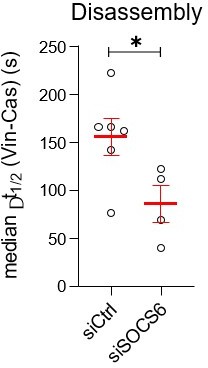
Positive and negative feedback regulates focal adhesion assembly.
(A) Rac1 requires Cas to induce cell spreading. Images and quantification of MCF10A cells expressing EGFP-Rac1WT or -Rac1Q61L that were treated with control or Cas siRNA and fixed after 30 min of spreading. (B, C) Reactive oxygen species (ROS) regulates Rac1 activation, Rac1 activation, cell spreading and vinculin recruitment to Cas clusters. (B) FRET images and quantification of Rac1-2G MCF10A cells treated with DMSO or NADPH-dependent oxidase inhibitor diphenylamineiodonium (DPI) and fixed after 30 min of spreading. (C) Images and quantification of CasmSc YFP-VCL MCF10A cells treated with DMSO or DPI. Graphs show mean cell area, mean CasmSc and YFP-VCL intensity, and median Δt1/2 (VCL-Cas) from 7 to 12 cells in three biological repeats. (D) Inhibiting Cullins accelerates vinculin recruitment to Cas clusters. Images and quantification of CasmSc YFP-VCL MCF10A cells treated with control or SOCS6 siRNA or with DMSO or Cullin Neddylation inhibitor MLN4924. Graphs show median Δt1/2 (VCL-Cas) from 8 to 12 cells in three biological repeats. All error bars represent mean and standard error of the mean (SEM) and all p values by Mann–Whitney U-tests. (E) Two-step model. In the first step, co-clustering of Cas with inactive integrin leads to SFK-dependent phosphorylation of Cas, recruitment of Crk/CrkL, activation of Rac1, ROS production, and positive feedback that strengthens and maintains signaling to form a nascent adhesion. Positive feedback is opposed by negative feedback resulting from CRL5SOCS6. In a second step, integrin β1 is activated and talin1, kindlin2, vinculin, actin, and other proteins are recruited to form a focal adhesion. The second step may be triggered by growth of the nascent adhesion to a critical size, or by decreased occupancy with Cas. See Discussion for details.
Author response image 1
Author response image 2
Videos
Video 1
Cas (magenta) and vinculin (green) dynamics during attachment and spreading of a CasmSc YFP-VCL MCF10A cell on collagen.
15 s time intervals.
Video 2
Cas (magenta) and vinculin (green) dynamics during lamellipodia extension by a migrating CasmSc YFP-VCL MCF10A cell.
15 s time intervals.
Video 3
Quantification of Cas and vinculin cluster dynamics.
MCF10A CasmSc YFP-VCL MCF10A cell spreading on collagen. (Left) Raw data. (Right) Regions of interest defined as regions of 20 pixels (0.5 μm2) or greater in which either or both channel intensities exceed threshold in three consecutive frames. Regions are color coded according to the first frame in which the region is first detected, from cyan to magenta. 20 s time intervals.
Video 4
Integrin clustering.
Cas (magenta) and integrin (green) dynamics during attachment and spreading. Left: CasmScβ1Ecto-pH MCF10A cell (20 s time intervals). Right: CasmSc ITGB1GFP HeLa cell (15 s time intervals).
Video 5
Cas–Crk dynamics.
Cas (magenta) and Crk (green) dynamics during attachment and spreading of CasmSc CrkmGL HeLa cells in presence of dimethylsulfoxide (DMSO) (left) or SFK inhibitor eCF506 (right). 20 s time intervals.
Video 6
Vinculin dynamics in control (left) and Cas-depleted (right) CasmSc YFP-VCL cells, 24 hr after plating on collagen.
20 s time intervals.
Video 7
Crk/CrkL and SFK requirement.
CasmSc YFP-VCL MCF10A cells treated with siCtrl (upper left), siCrk, siCrkL, or siCrkL/CrkL (upper right) or with DMSO (bottom left) or eCF506 (bottom right). 20 s time intervals.
Video 8
Effect of extracellular matrix (ECM).
Cas (magenta) and vinculin (green) dynamics during attachment and spreading on COLI (left) and fibronectin (FN; right). 20 s time intervals.
Video 9
Rac1 and reactive oxygen species (ROS) requirement.
CasmSc YFP-VCL MCF10A cells treated with DMSO (top left) or EHT1864 (top right) or with DMSO (bottom left) or diphenylamineiodonium (DPI) (bottom right). 20 s time intervals.
Video 10
Stimulation of vinculin recruitment and spreading in SOCS6-depleted cells.
CasmSc YFP-VCL MCF10A cells treated with control (left) or SOCS6 (right) siRNA. 15 s time intervals.
Additional files
Download links
A two-part list of links to download the article, or parts of the article, in various formats.
Downloads (link to download the article as PDF)
Open citations (links to open the citations from this article in various online reference manager services)
Cite this article (links to download the citations from this article in formats compatible with various reference manager tools)
Cas phosphorylation regulates focal adhesion assembly
eLife 12:e90234.
https://doi.org/10.7554/eLife.90234


