The deubiquitinase Ubp3/Usp10 constrains glucose-mediated mitochondrial repression via phosphate budgeting
- Institute for Stem Cell Science and Regenerative Medicine (DBT-inStem), India
- Manipal Academy of Higher Education, India
Figures
Figure 1 with 1 supplement
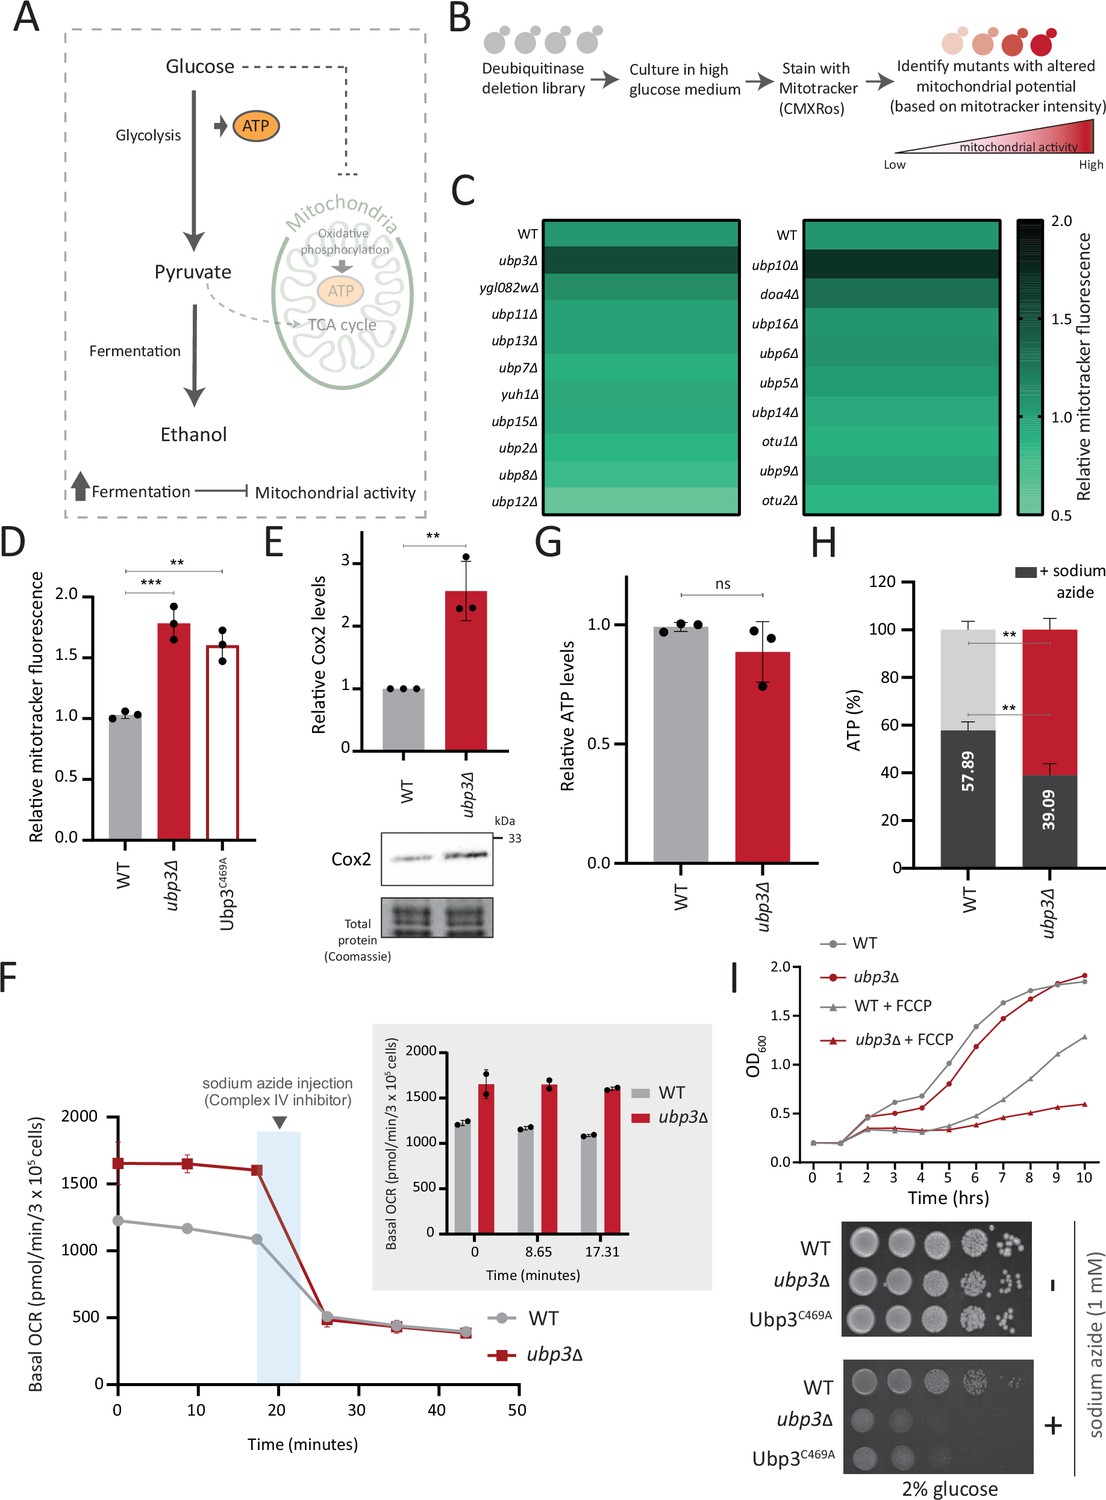
A deubiquitinase (DUB) deletion screen identifies Ubp3 as a regulator of glucose-mediated mitochondrial repression.
(A) Schematic depicting glucose-mediated mitochondrial repression (Crabtree effect). (B) Schematic describing the screen with a yeast DUB knockout (KO) library to identify regulators of Crabtree effect. (C) Identifying DUB knockouts with altered mitochondrial potential. Heat map shows relative mitochondrial membrane potential of 19 DUB deletions in high glucose, from two biological replicates. Also see Figure 1—figure supplement 1A and B. (D) The DUB activity of Ubp3 and repression of mitochondrial membrane potential. Wild-type (WT), ubp3Δ, and Ubp3C469A were grown in high glucose and relative mitochondrial membrane potential was measured. Data represent mean ± SD from three biological replicates (n=3). Also see Figure 1—figure supplement 1D. (E) Effect of loss of Ubp3 on electron transport chain (ETC) complex IV subunit Cox2. WT and ubp3Δ were grown in high glucose, and Cox2 was measured (western blot using an anti-Cox2 antibody). A representative blot (out of three biological replicates, n=3) and their quantifications are shown. Data represent mean ± SD. (F) Basal oxygen consumption rate (OCR) in high glucose in ubp3Δ. WT and ubp3Δ were grown in high glucose, and OCR was measured. Basal OCR corresponding to ~3×10⁵ cells, from two independent experiments (n=2), normalized to the OD600 is shown. Bar graph representations are shown in the inset. Data represent mean ± SD. (G) Total ATP levels in ubp3Δ and WT. WT and ubp3Δ were grown in high glucose, and total ATP were measured. Data represent mean ± SD from three biological replicates (n=3). (H) Dependence of ubp3Δ on mitochondrial ATP. WT and ubp3Δ cells were grown in high glucose, and treated with 1 mM sodium azide for 45 min. Total ATP levels in sodium azide treated and untreated cells were measured. Data represent mean ± SD (n=3). (I) Requirement for mitochondrial respiration in high glucose in ubp3Δ. A growth curve of WT and ubp3Δ in high glucose in the presence of oxidative phosphorylation (OXPHOS) uncoupler FCCP (10 µM), and serial dilution growth assay in high glucose in the presence/absence of sodium azide (1 mM) are shown. Data represent mean ± SD (n=2). Also see Figure 1—figure supplement 1H and I. Data information: **p<0.01, ***p<0.001.
-
Figure 1—source data 1
Uncropped and labeled gels and blots for Figure 1.
- https://cdn.elifesciences.org/articles/90293/elife-90293-fig1-data1-v1.zip
-
Figure 1—source data 2
Raw unedited gels and blots for Figure 1.
- https://cdn.elifesciences.org/articles/90293/elife-90293-fig1-data2-v1.zip
Figure 1—figure supplement 1
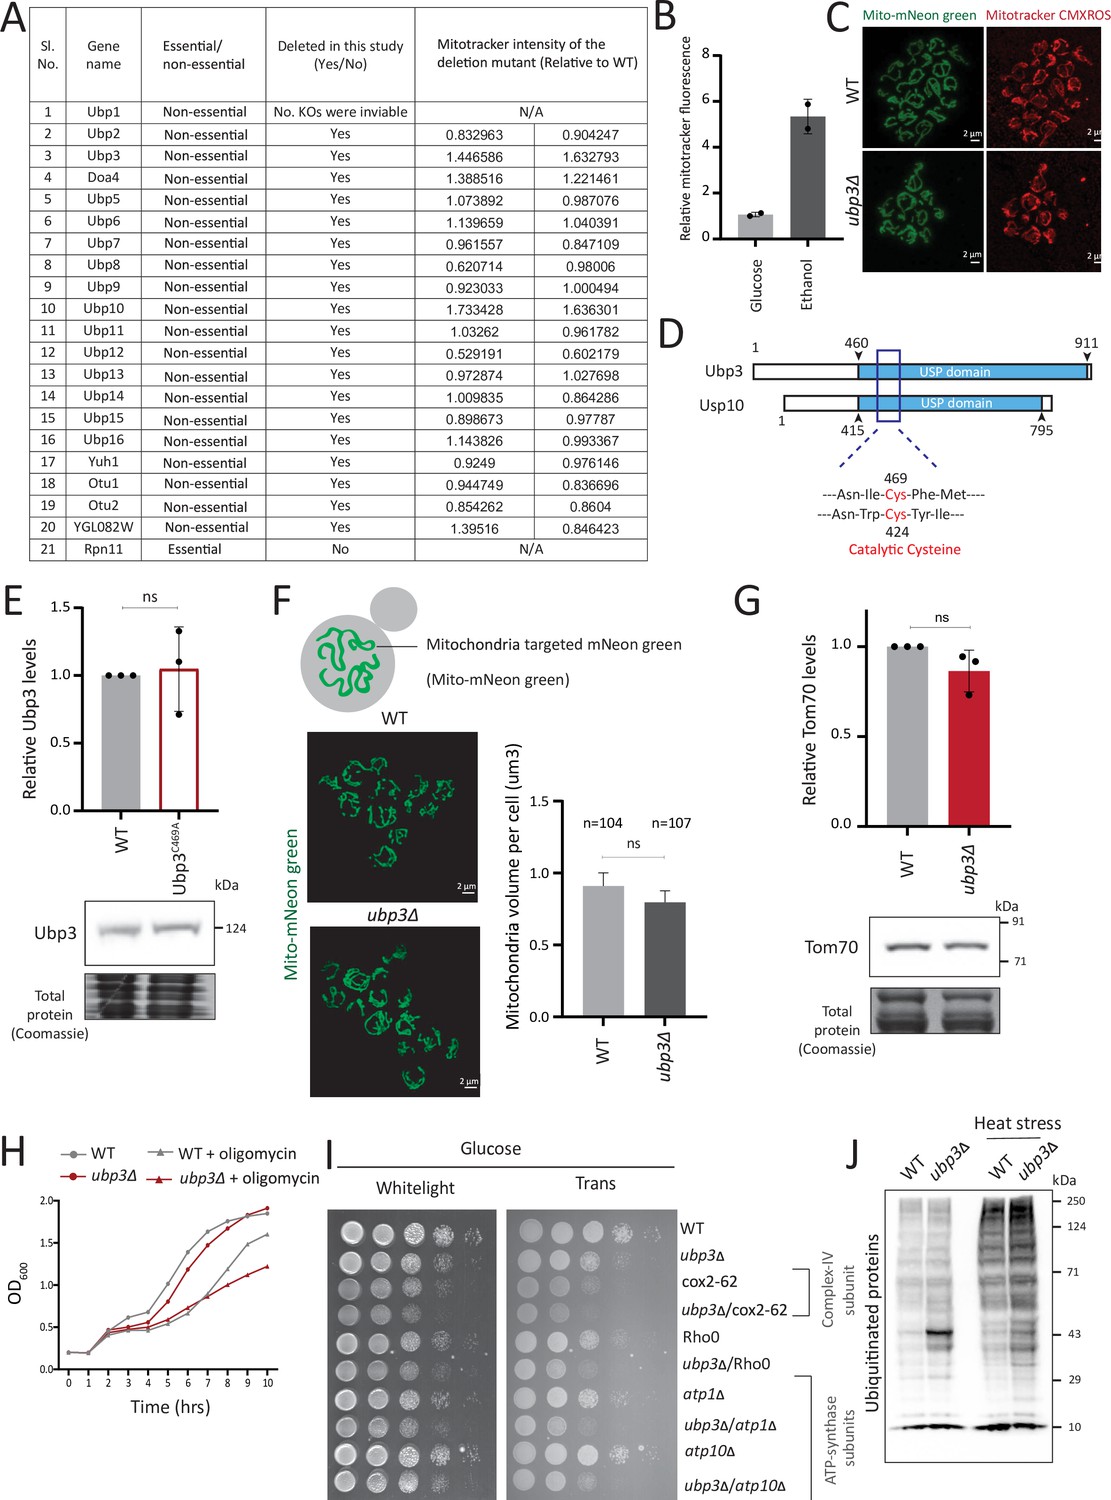
Deubiquitinase (DUB) screen details and further characterization of Ubp3 functions.
(A) A list of the known/identified S. cerevisiae DUB enzymes is shown. The DUBs which were used in this study and the mitotracker intensity of two biological replicates (n=2) relative to wild-type (WT) are shown. (B) WT cells grown in a respiratory, ethanol medium and mitotracker fluorescence intensity compared to glucose medium. WT cells were grown in high glucose medium (2% glucose) and ethanol medium (2% ethanol), and the mitochondrial membrane potential was measured. Data from two independent experiments (n=2) is shown. Data represent mean ± SD. (C) Representative images of WT and ubp3Δ cells treated with mitotracker red CMXROS. (D) Schematic representation of the conserved domains of Ubp3 and its mammalian ortholog Usp10. The catalytic cysteine of Usp10 and Ubp3 is highlighted. (E) The catalytically inactive mutant of Ubp3, Ubp3C469A does not have altered Ubp3 protein levels. WT and Ubp3C469A cells containing endogenous Ubp3 tagged with 3x FLAG (C terminus) were grown in high glucose and the protein levels of Ubp3 were measured. A representative blot (out of three biological replicates, n=3) and their quantification are shown. Data represent mean ± SD. (F) The total mitochondrial volume does not change in ubp3Δ cells. WT and ubp3Δ cells with mitochondria targeted mNeon green were imaged, and the total mitochondrial volume per cell (n=104 for WT, n=107 for ubp3Δ) was calculated. A representative image and quantification are shown. Data represent mean ± SD. (G) Tom70 protein amounts do not change in ubp3Δ cells. WT and ubp3Δ cells containing endogenous Tom70 tagged at the C terminus with a 3x FLAG epitope were grown in high glucose and the protein levels of Tom70 were measured by western blot. A representative blot (out of three biological replicates, n=3) and their quantification are shown. Data represent mean ± SD. (H) Dependence of ubp3Δ on mitochondrial respiration. WT and ubp3Δ cells were grown in high glucose with or without mitochondrial inhibitor oligomycin (25 µM), and the OD600 was measured at different time points. Data represent mean ± SD (n=2). (I) Dependence of ubp3Δ on functional mitochondrial respiration. Ubp3 deletions were done in respiration defective strains - Rho0, cox2-62, atp1Δ, and atp10Δ, and serial dilution growth assay was done in high glucose. The results after 24 hr of incubation at 30°C are shown. (J) Changes in global ubiquitination state in WT and ubp3Δ. WT and ubp3Δ cells were grown in high glucose with or without heat stress (42°C/1 hr), and the changes in global total ubiquitination was estimated by western blotting using an anti-ubiquitin antibody.
-
Figure 1—figure supplement 1—source data 1
Uncropped and labeled gels and blots for Figure 1—figure supplement 1.
- https://cdn.elifesciences.org/articles/90293/elife-90293-fig1-figsupp1-data1-v1.zip
-
Figure 1—figure supplement 1—source data 2
Raw unedited gels and blots for Figure 1—figure supplement 1.
- https://cdn.elifesciences.org/articles/90293/elife-90293-fig2-figsupp2-data2-v1.zip
Figure 2 with 2 supplements
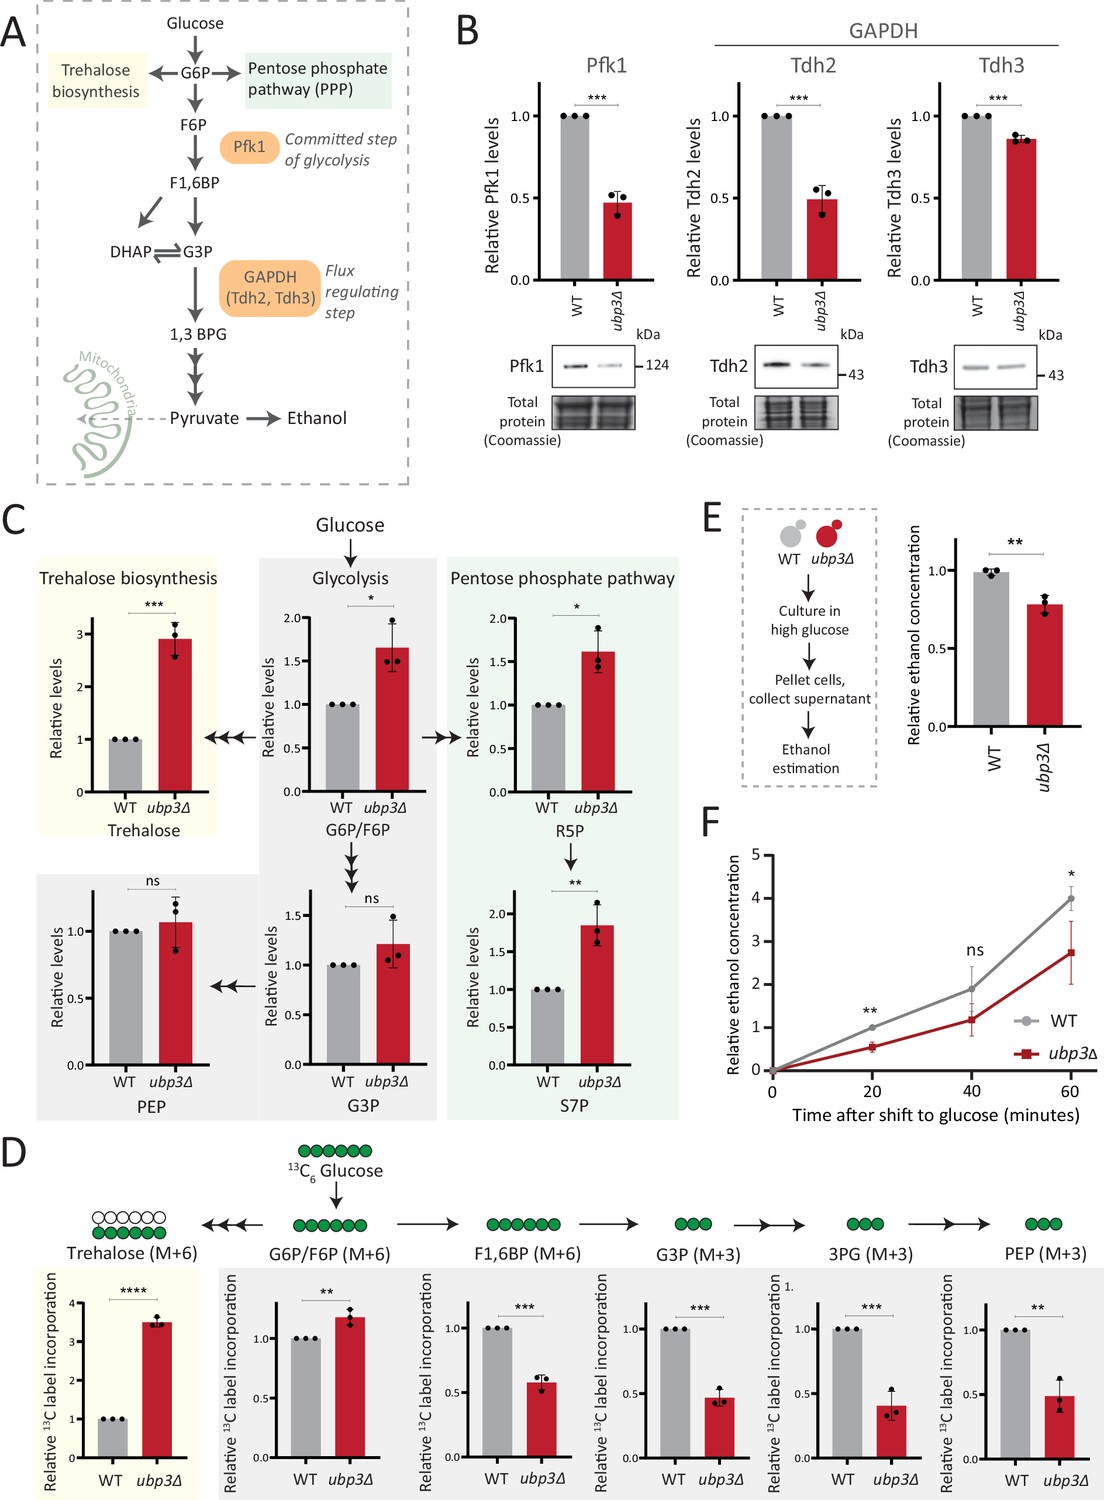
Key glycolytic enzymes decrease and glucose flux is rerouted in ubp3Δ cells.
(A) A schematic illustrating directions of glucose-6 phosphate (G6P) flux in cells. Glucose is converted to G6P, a precursor for trehalose, the pentose phosphate pathway (PPP), and glycolysis. (B) Effect of loss of Ubp3 on key glycolytic enzymes. Wild-type (WT) and ubp3Δ were grown in high glucose and the Pfk1, Tdh2, and Tdh3 levels were measured by western blot using an anti-FLAG antibody. A representative blot (out of three biological replicates, n=3) and their quantification are shown. Data represent mean ± SD. Also see Figure 2—figure supplement 1A. (C) Steady-state metabolite amounts in WT and ubp3Δ in high glucose. Relative steady-state levels of trehalose, major glycolytic, and PPP intermediates were estimated in WT and ubp3Δ. Data represent mean ± SD from three biological replicates (n=3). Also see Appendix 1—table 3. (D) Relative glycolytic and trehalose synthesis flux in WT and ubp3Δ. Relative 13C-label incorporation into trehalose and glycolytic intermediates, after a pulse of 1% 13C6 glucose is shown. Data represent mean ± SD from three biological replicates (n=3). Also see Appendix 1—table 3, Figure 2—figure supplement 1D and E. (E) Ethanol production in ubp3Δ. WT and ubp3Δ were grown in high glucose and ethanol in the media was measured. Data represent mean ± SD from three biological replicates (n=3). (F) Relative rate of ethanol production in WT vs ubp3Δ. WT and ubp3Δ were grown in high glucose (to OD600~0.6), equal numbers of cells were shifted to fresh medium (high glucose) and ethanol concentration in the medium was measured temporally. Data represent mean ± SD from three biological replicates (n=3). Data information: *p<0.05, **p<0.01, ***p<0.001.
-
Figure 2—source data 1
Uncropped and labeled gels and blots for Figure 2.
- https://cdn.elifesciences.org/articles/90293/elife-90293-fig2-data1-v1.zip
-
Figure 2—source data 2
Raw unedited gels and blots for Figure 2.
- https://cdn.elifesciences.org/articles/90293/elife-90293-fig2-data2-v1.zip
Figure 2—figure supplement 1
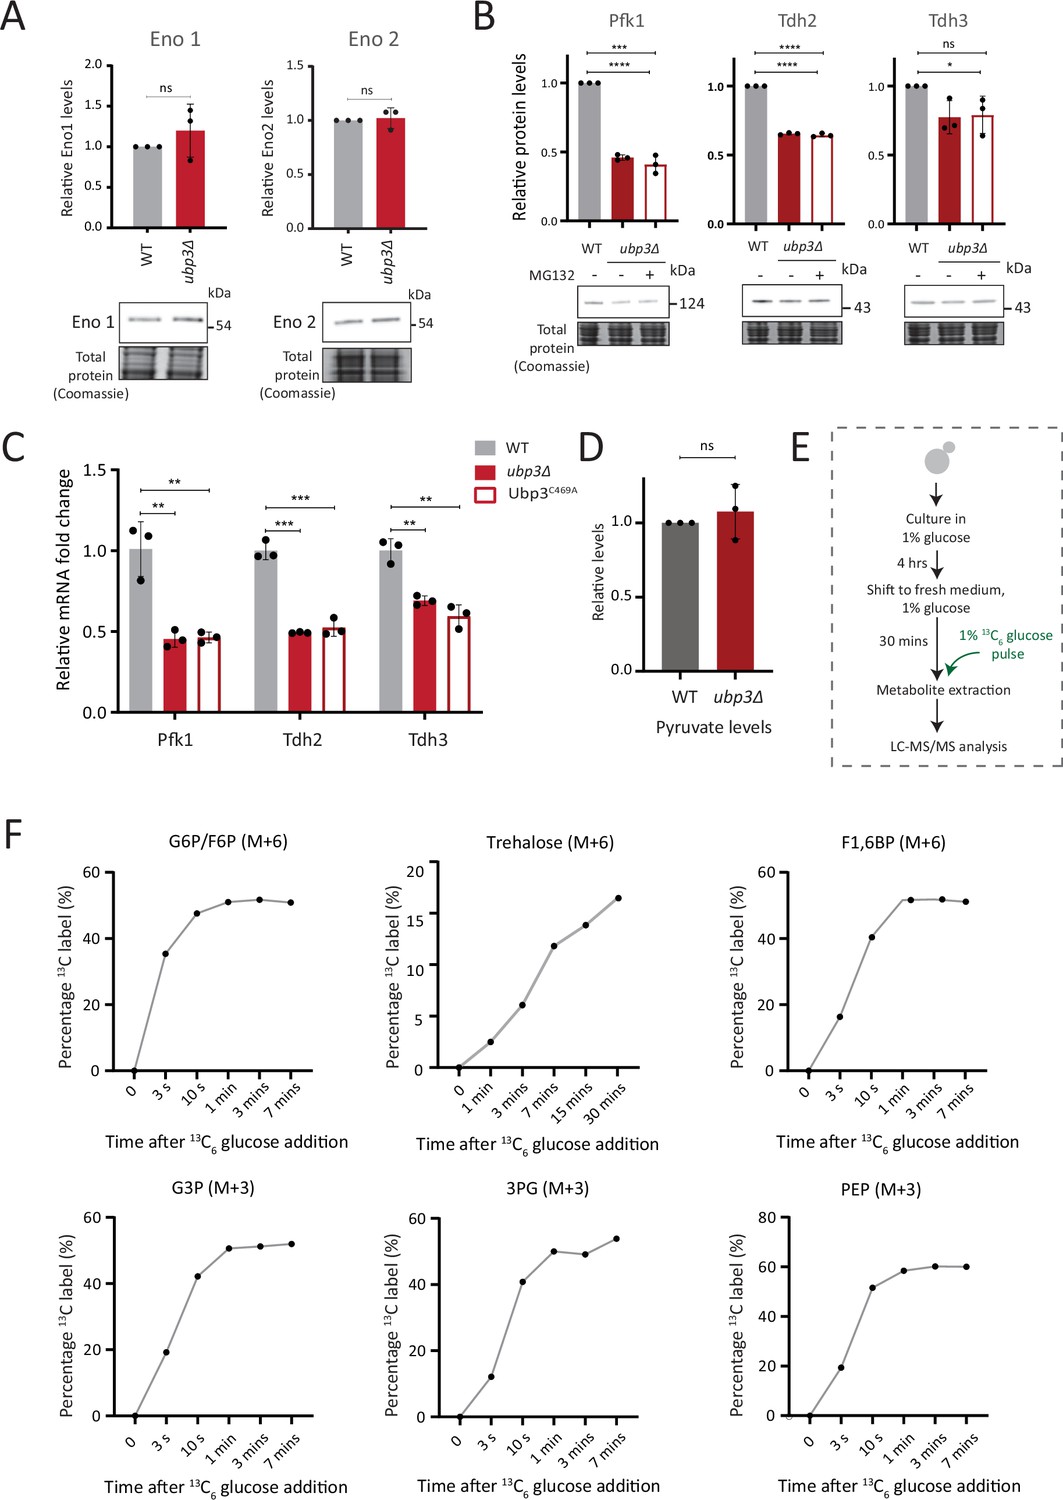
Further estimates of glycolytic enzymes and flux.
(A) Loss of Ubp3 does not change the protein levels of enolase isozymes Eno1 and Eno2. Wild-type (WT) and ubp3Δ cells containing Eno1 and Eno2 C terminus endogenously tagged with a 3x FLAG epitope were grown in high glucose and protein amounts were estimated. A representative blot (out of three biological replicates, n=3) is shown in the lower panel, quantifications shown in the upper panel. Data represent mean ± SD. (B) The decreased levels of glycolytic enzymes in ubp3Δ cells is not because of proteasomal degradation. WT and ubp3Δ were grown in high glucose and ubp3Δ cells were treated with or without MG132 (100 μM) for 30 min. Pfk1, Tdh2, and Tdh3 levels were measured by western blot using an anti-FLAG antibody. A representative blot (out of three biological replicates, n=3) and their quantification are shown. Data represent mean ± SD. (C) Loss of Ubp3 results in decreased transcription of PFK1, TDH2, and TDH3 genes. WT, ubp3Δ, and Ubp3C469A cells were grown in high glucose and the mRNA levels of PFK1, TDH2, and TDH3 were analyzed by RT-qPCR. The fold changes in mRNA levels are shown. Data represent mean ± SD. (D) Steady-state pyruvate levels in WT and ubp3Δ in high glucose. Data represent mean ± SD from three biological replicates (n=3). Also see e Appendix 1—table 3. (E) Schematic showing the experimental design for measuring 13C label incorporation into glycolytic intermediates and trehalose using a 13C6 glucose pulse. (F) Changes in 13C label incorporation into glycolytic intermediates and trehalose with time, and linearity of label incorporation after a pulse of 1% 13C6 glucose is shown. Data information: *p<0.05, **p<0.01, ***p<0.001, ****p<0.0001.
-
Figure 2—figure supplement 1—source data 1
Uncropped and labeled gels and blots for Figure 2—figure supplement 1.
- https://cdn.elifesciences.org/articles/90293/elife-90293-fig3-figsupp3-data3-v1.zip
-
Figure 2—figure supplement 1—source data 2
Raw unedited gels and blots for Figure 2—figure supplement 1.
- https://cdn.elifesciences.org/articles/90293/elife-90293-fig4-figsupp4-data4-v1.zip
Figure 2—figure supplement 2
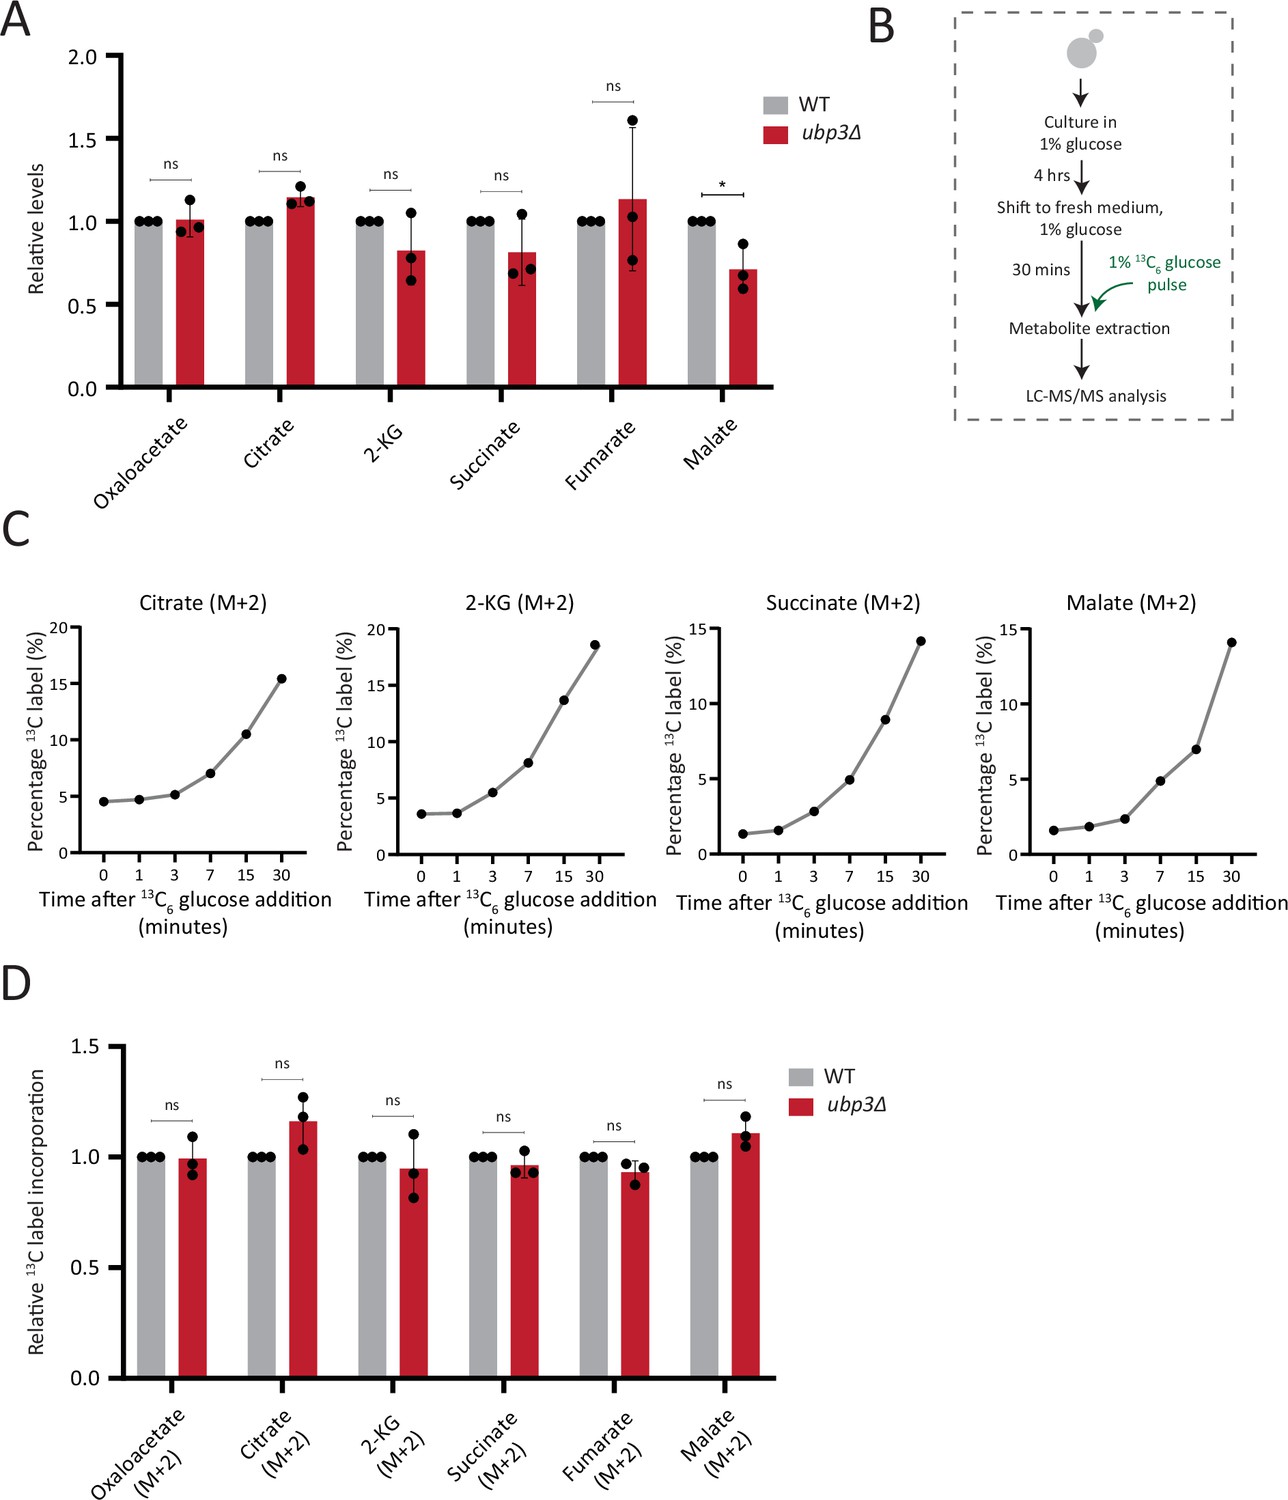
Estimation of steady-state levels and flux of trichloroacetic acid (TCA) cycle intermediates.
(A) Steady-state TCA metabolite amounts in wild-type (WT) and ubp3Δ in high glucose. Relative steady-state levels of TCA cycle intermediates were estimated in WT and ubp3Δ. Data represent mean ± SD from three biological replicates (n=3). Also see Appendix 1—table 3. (B) Schematic showing the experimental design for measuring 13C label incorporation into TCA cycle intermediates using a 13C6 glucose pulse. (C) Changes in 13C label incorporation into TCA cycle intermediates with time, and linearity of label incorporation after a pulse of 1% 13C6 glucose is shown. (D) Relative TCA cycle flux in WT and ubp3Δ. Relative 13C-label incorporation into TCA cycle intermediates, after a pulse of 1% 13C6 glucose is shown. Data represent mean ± SD from three biological replicates (n=3). Also see Appendix 1—table 3. Data information: *p<0.05.
Figure 3 with 1 supplement
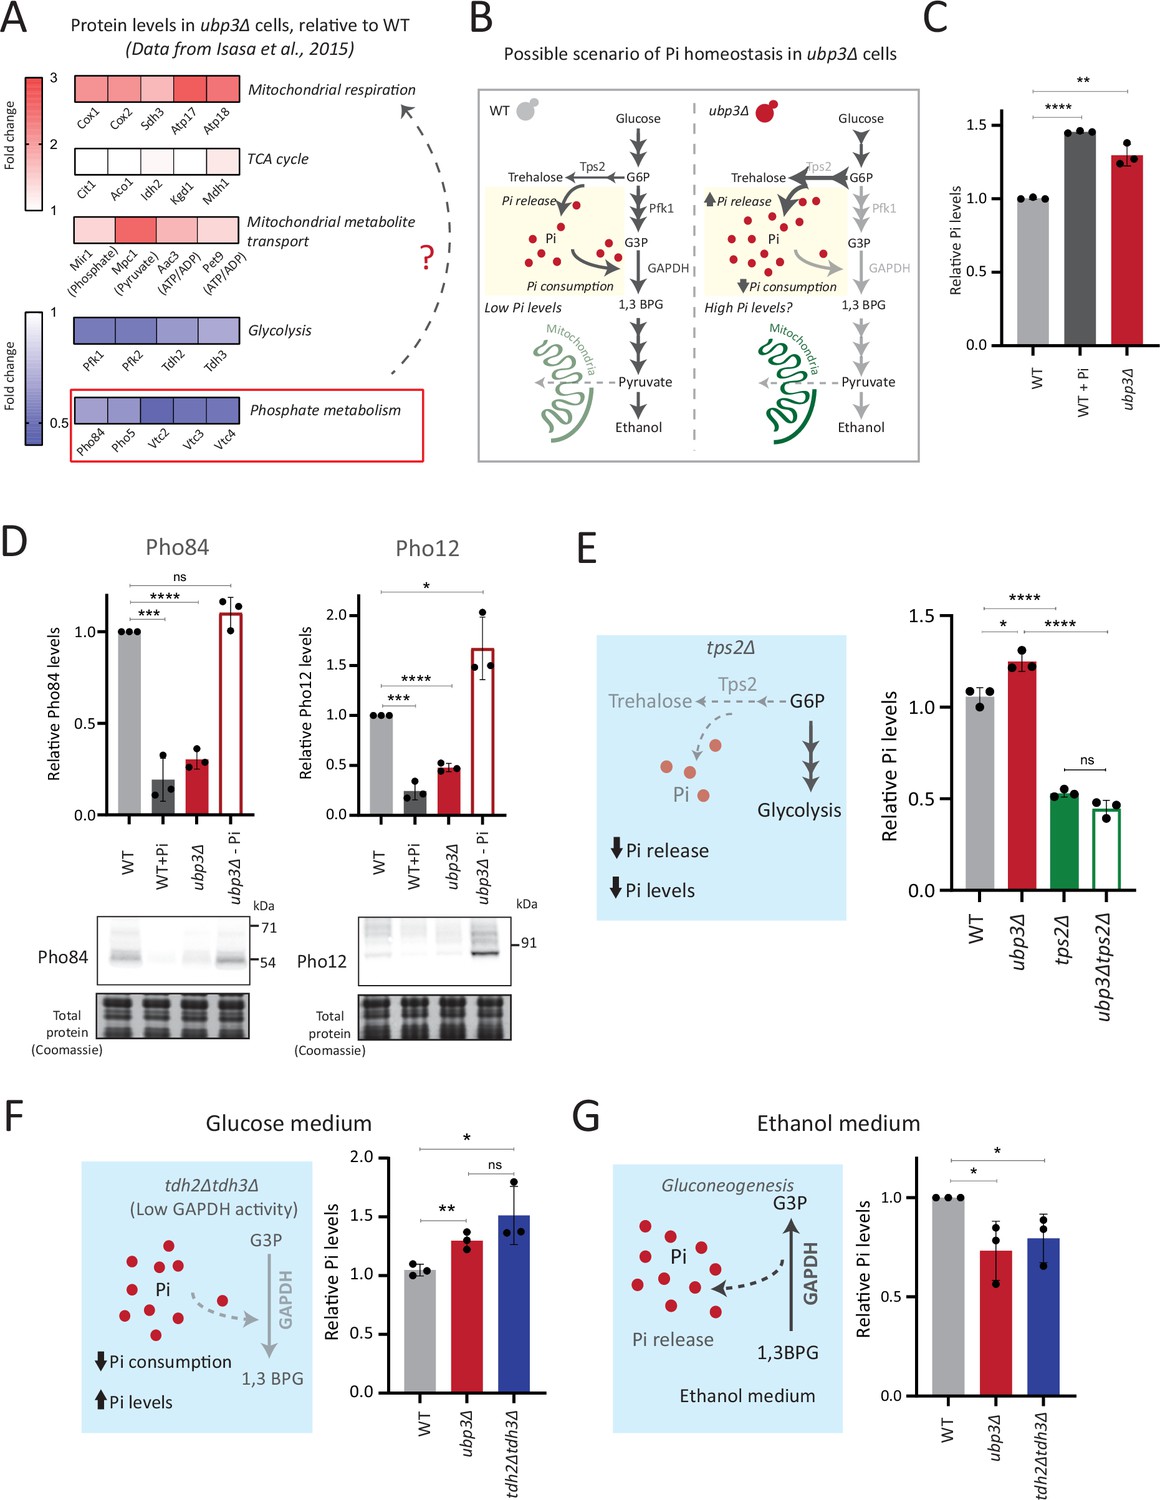
Rerouted glucose flux results in inorganic phosphate (Pi) accumulation.
(A) Changes in protein levels in ubp3Δ (dataset from Isasa et al., 2015). ubp3Δ cells have an increase in proteins involved in mitochondrial respiration and decrease in proteins involved in glucose and phosphate metabolism. (B) Schematic showing maintenance of Pi balance during glycolysis. Trehalose synthesis from glucose-6 phosphate (G6P) releases Pi, and the conversion of G3P to 1,3BPG by GAPDH consumes Pi. In ubp3Δ, trehalose biosynthesis (which releases Pi) increases. ubp3Δ have decreased GAPDH, which will decrease Pi consumption. This increase in Pi release along with decreased Pi consumption could increase cytosolic Pi. (C) Intracellular Pi levels in wild-type (WT) and ubp3Δ. WT and ubp3Δ were grown in high glucose and the total free phosphate (Pi) levels were estimated. WT in high Pi (2% glucose, 10 mM Pi) was a positive control. Data represent mean ± SD from three biological replicates (n=3). Also see Figure 3—figure supplement 1A. (D) Pho regulon responses in WT and ubp3Δ. Protein levels of Pho84-FLAG and Pho12-FLAG were compared between WT grown in high glucose and in high Pi, ubp3Δ in high glucose with or without a shift to a no-Pi medium for 1 hr, by western blot. A representative blot (out of three biological replicates, n=3) and their quantifications are shown. Data represent mean ± SD. (E) Contribution of trehalose synthesis as a Pi source. WT, tps2Δ, ubp3Δ, and ubp3Δtps2Δ were grown in high glucose and the total Pi levels were estimated. Data represent mean ± SD from three biological replicates (n=3). Also see Figure 3—figure supplement 1B. (F) Loss of GAPDH isozymes Tdh2 and Tdh3 and effect on Pi. WT, ubp3Δ, and tdh2Δtdh3Δ were grown in high glucose and total Pi was estimated. Data represent mean ± SD from three biological replicates (n=3). (G) Pi levels in ubp3Δ and tdh2Δtdh3Δ cells in ethanol medium. WT, ubp3Δ, and tdh2Δtdh3Δ cells were grown in ethanol medium and the total Pi levels were estimated. Data represent mean ± SD from three biological replicates (n=3). Data information: *p<0.05, **p<0.01, ***p<0.001, ****p<0.0001.
-
Figure 3—source data 1
Uncropped and labeled gels and blots for Figure 3.
- https://cdn.elifesciences.org/articles/90293/elife-90293-fig3-data1-v1.zip
-
Figure 3—source data 2
Raw unedited gels and blots for Figure 3.
- https://cdn.elifesciences.org/articles/90293/elife-90293-fig3-data2-v1.zip
Figure 3—figure supplement 1
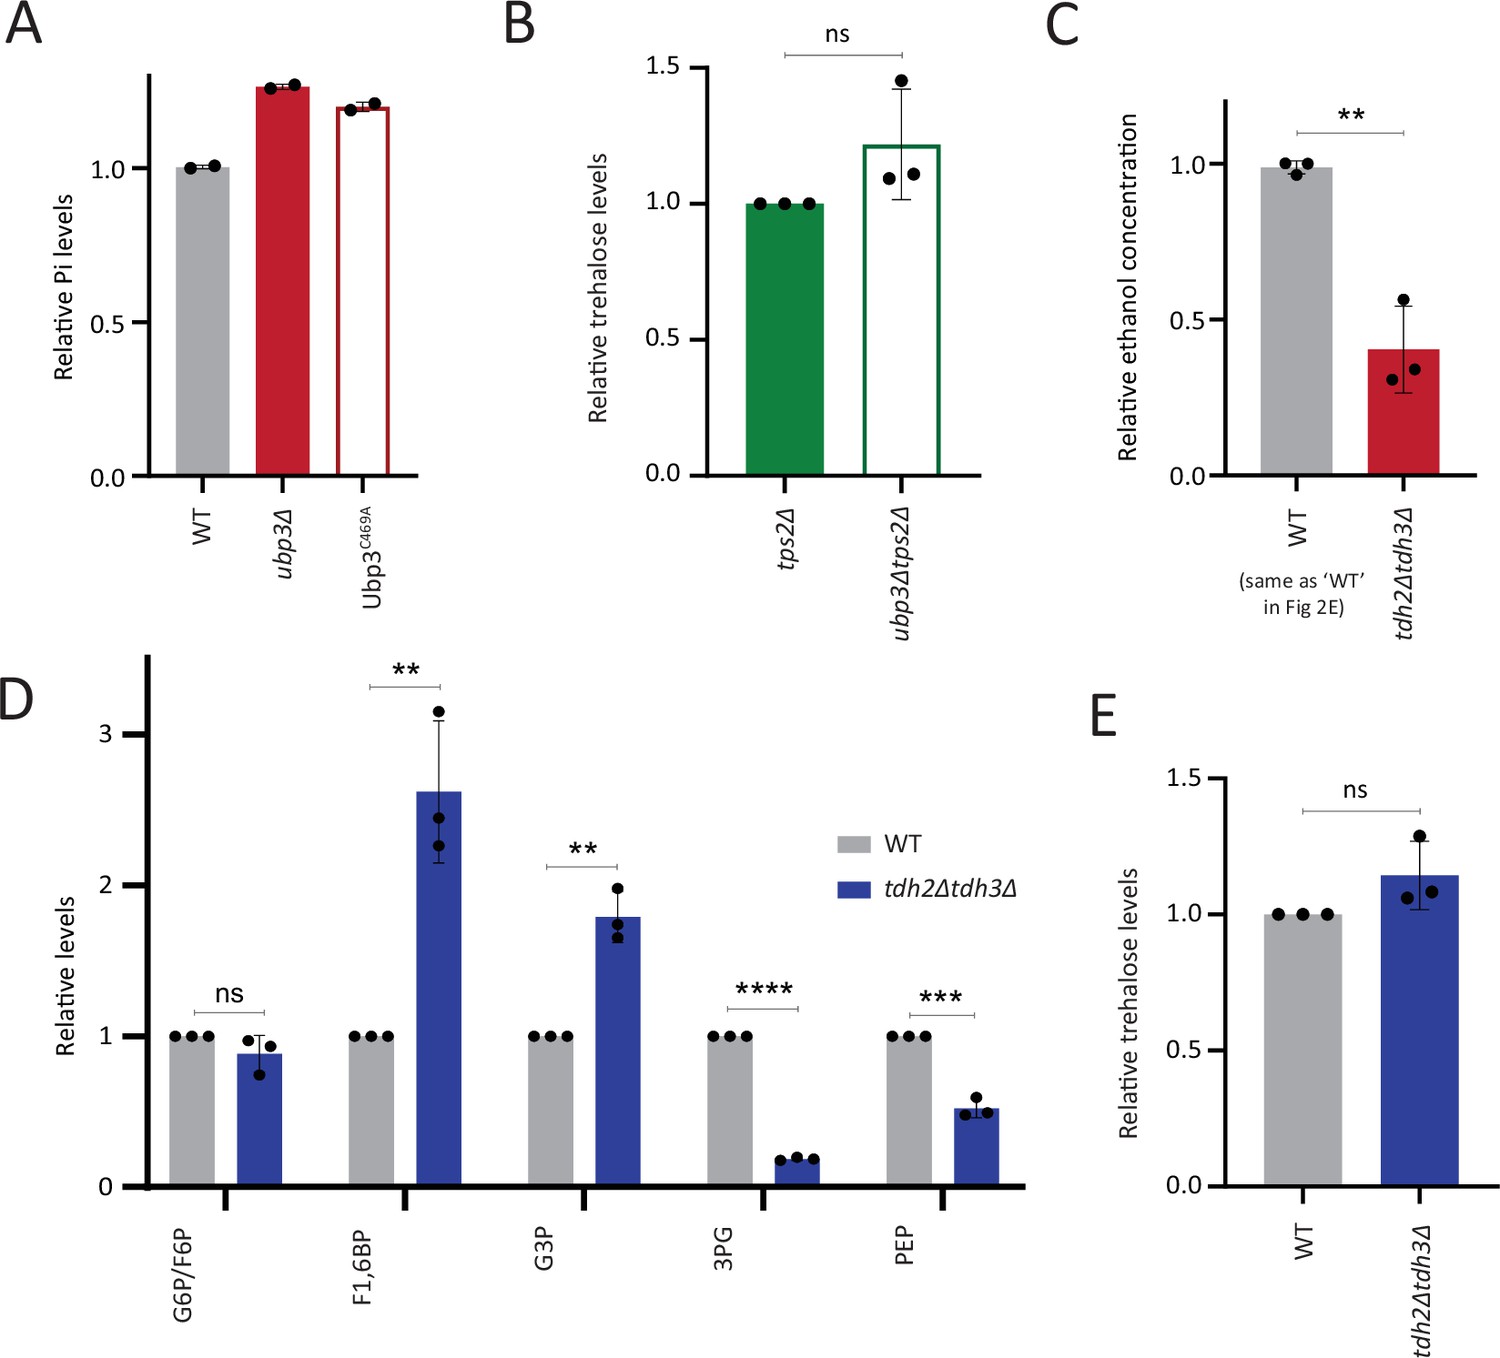
Comparisons of phosphate, ethanol, and other metabolites in wild-type (WT), ubp3Δ and GAPDH mutants.
(A) Loss of Ubp3 deubiquitinase activity and inorganic phosphate (Pi) levels. WT, ubp3Δ, and Ubp3C469A cells were grown in high glucose and the total free phosphate (Pi) levels were estimated. Data from two independent experiments (n=2) is shown. Data represent mean ± SD. (B) Trehalose levels in WT and ubp3Δ cells in the absence of Tps2. tps2Δ and ubp3Δtps2Δ cells were grown in high glucose, and the trehalose levels were estimated using targeted LC-MS/MS. Data represent mean ± SD from three biological replicates (n=3). (C) Loss of GAPDH isozymes Tdh2 and Tdh3 and ethanol production. WT and tdh2Δtdh3Δ cells were grown in high glucose and the ethanol concentration in the medium was measured. Data are represented as mean ± SD from three biological replicates (n=3). Note: The WT shown here is same as the WT in Figure 2E, the ethanol assays in Figure 2E and (C) were done together and a common WT control was used. (D) Steady-state levels of glycolytic intermediates: tdh2Δtdh3Δ cells have unaltered steady-state levels of glucose-6/fructose-6 phosphate (G6P/F6P), increased levels of F1,6BP, and G3P and decreased levels of 3PG and PEP. WT and tdh2Δtdh3Δ cells were grown in high glucose and the steady-state amounts of glycolytic intermediates were estimated using targeted LC-MS/MS. Data represent mean ± SD from three biological replicates (n=3). Also see Appendix 1—table 3. (E) Trehalose levels in tdh2Δtdh3Δ cells. WT and tdh2Δtdh3Δ cells were grown in high glucose and trehalose amounts were estimated using targeted LC-MS/MS. Data represent mean ± SD from three biological replicates (n=3). Data information: *p<0.05, **p<0.01.
Figure 4 with 1 supplement
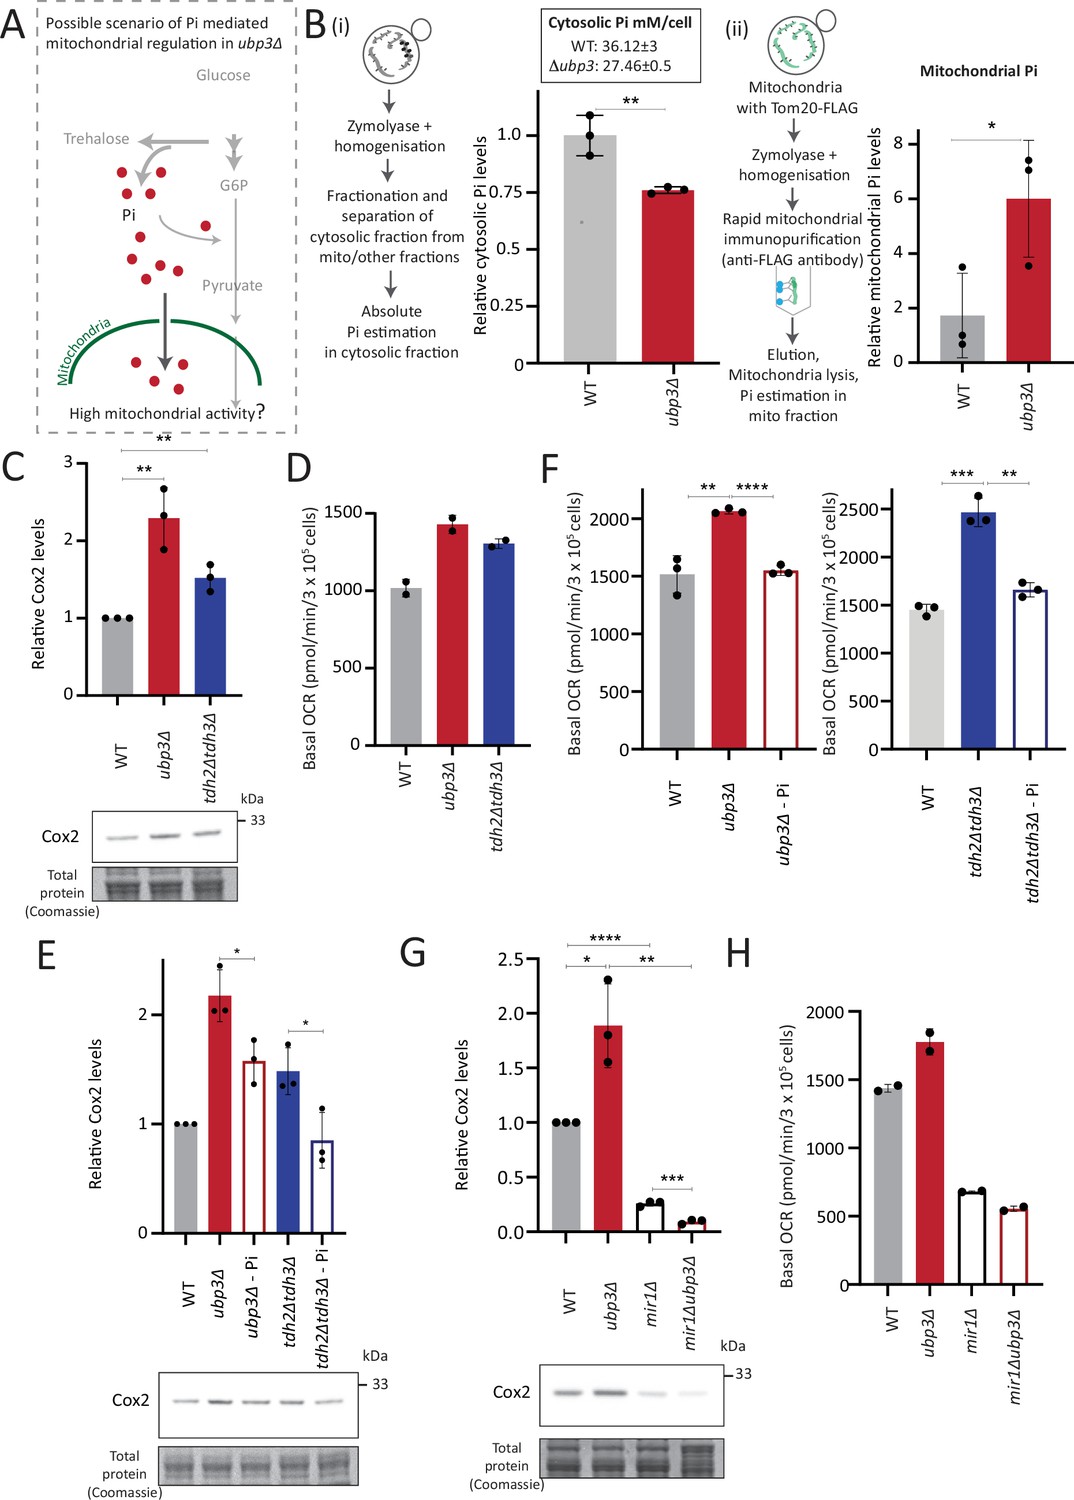
Mitochondrial inorganic phosphate (Pi) availability correlates with mitochondrial activity in ubp3Δ.
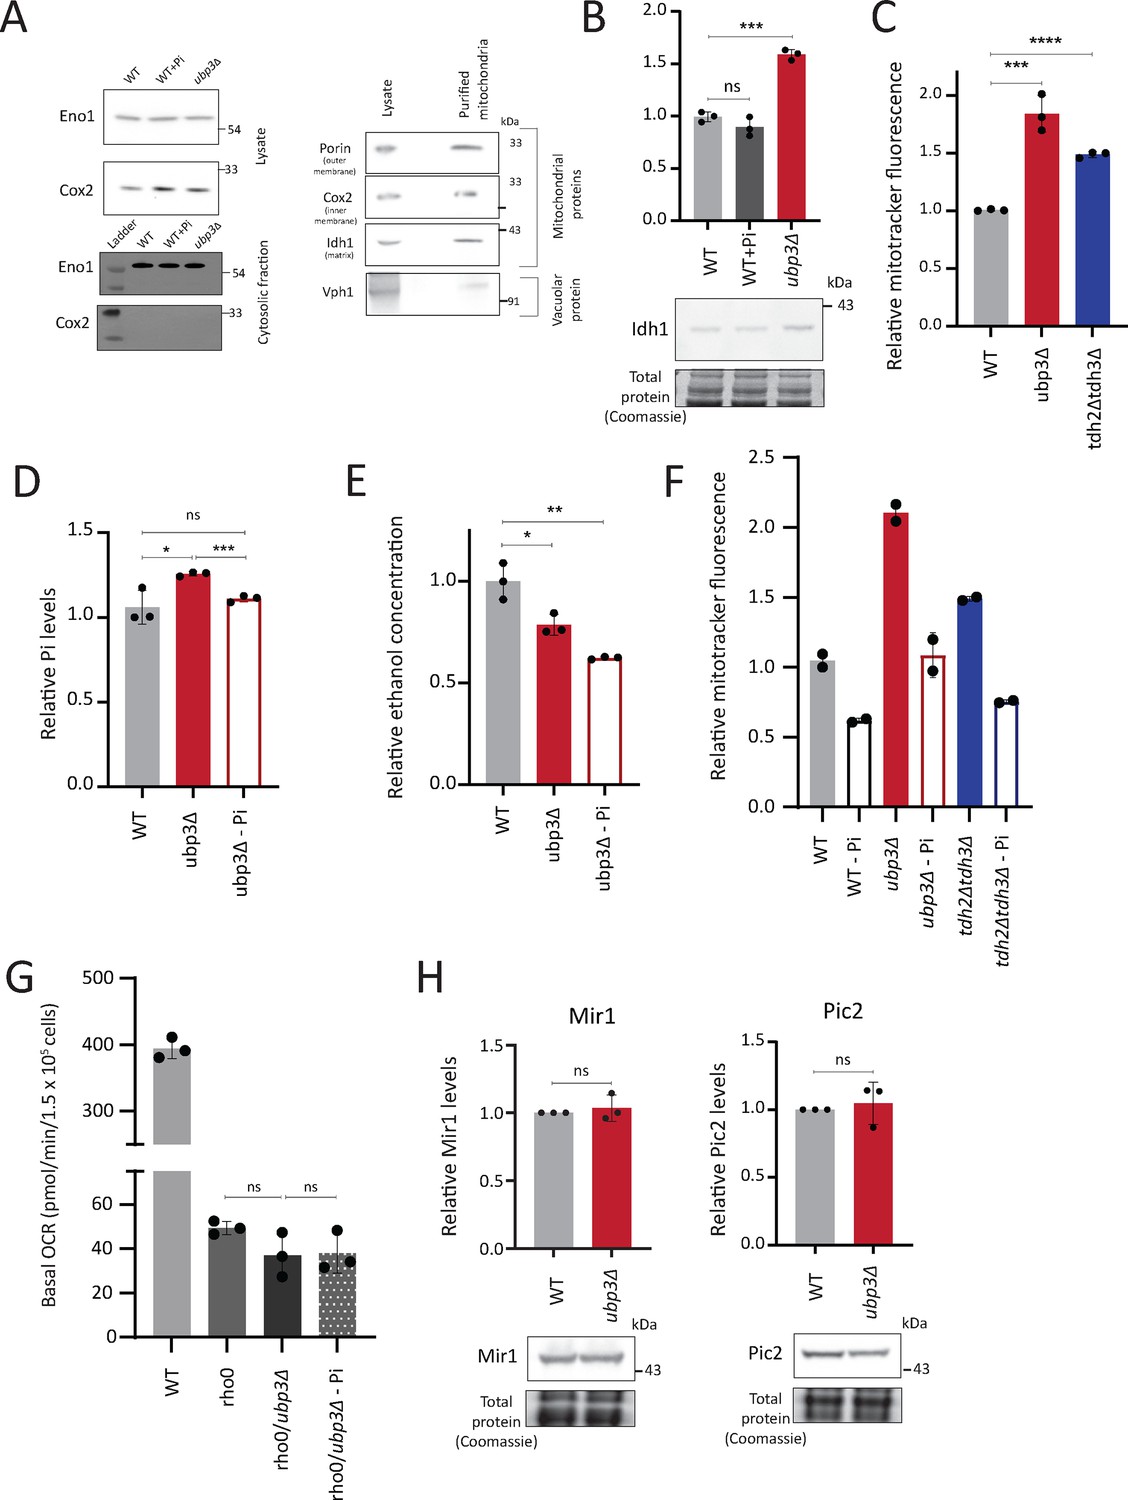
(A) A hypothetical mechanism of cytosolic free Pi controlling mitochondrial activity by regulating mitochondrial Pi availability. (B) Cytosolic and mitochondrial Pi amounts in wild-type (WT) vs ubp3Δ. The cytosolic fraction was isolated by centrifugation (see Appendix 1), and in separate experiments, mitochondria were isolated by immunoprecipitation from WT and ubp3Δ and mitochondrial Pi estimated. (i) Cytosolic Pi levels (relative as well as absolute) and (ii) mitochondrial Pi levels (normalized to Idh1) are shown. Data represent mean ± SD from three biological replicates (n=3) respectively for the cytosolic and mitochondrial measurements. Also see Figure 4—figure supplement 1A and B. (C) Cox2 protein in tdh2Δtdh3Δ. WT, ubp3Δ, and tdh2Δtdh3Δ were grown in high glucose and Cox2 protein was estimated. A representative blot (out of three biological replicates, n=3) and their quantifications are shown. Data represent mean ± SD. (D) Basal oxygen consumption rate (OCR) levels in tdh2Δtdh3Δ. WT, ubp3Δ, and tdh2Δtdh3Δ were grown in high glucose and basal OCR was measured from two independent experiments (n=2). Data represent mean ± SD. Also see Figure 4—figure supplement 1C. (E) Comparative Pi amounts and Cox2 levels in ubp3Δ, tdh2Δtdh3Δ, WT cells. WT cells were grown in high glucose, ubp3Δ and tdh2Δtdh3Δ were grown in high glucose and low Pi, and Cox2 protein was estimated. A representative blot (out of three biological replicates, n=3) and their quantifications are shown. Data represent mean ± SD. Also see Figure 4—figure supplement 1D and F. (F) Pi amounts and basal OCR in ubp3Δ and tdh2Δtdh3Δ vs WT cells. WT cells were grown in high glucose, ubp3Δ and tdh2Δtdh3Δ were grown in high glucose and low Pi, and basal OCR was measured from three independent experiments (n=3). Data represent mean ± SD. (G) Effect of loss of mitochondrial Pi transporter Mir1 on Cox2 protein. WT, ubp3Δ, mir1Δ, and mir1Δubp3Δ were grown in high glucose and Cox2 amounts compared. A representative blot (out of three biological replicates, n=3) and their quantifications are shown. Data represent mean ± SD. (H) Relationship of mitochondrial Pi transport and basal OCR in WT vs ubp3Δ. WT, ubp3Δ, mir1Δ, and mir1Δubp3Δ cells were grown in high glucose and basal OCR was measured from two independent experiments (n=2). Data represent mean ± SD. Data information: *p<0.05, **p<0.01, ****p<0.0001.
-
Figure 4—source data 1
Uncropped and labeled gels and blots for Figure 4.
- https://cdn.elifesciences.org/articles/90293/elife-90293-fig4-data1-v1.zip
-
Figure 4—source data 2
Raw unedited gels and blots for Figure 4.
- https://cdn.elifesciences.org/articles/90293/elife-90293-fig4-data2-v1.zip
Figure 4—figure supplement 1
Mitochondrial inorganic phosphate (Pi) estimation characterizations and correlations of mitochondrial activity with Pi availability.
(A) Isolation of cytosolic fraction by centrifugation and lack of vacuolar contamination in mitochondria isolated by immunoprecipitation. Cytosolic fraction was isolated from wild-type (WT) cells grown in high glucose with or without excess Pi and ubp3Δ cells. Eno1 was used as a cytosolic marker and Cox2 as mitochondrial marker to ensure purity of the cytosolic fractions. Mitochondria were isolated from WT cells grown in high glucose and the protein levels of Tom20, Cox2, Idh1, and Vph1 and were measured in cell lysate and immunoprecipitated mitochondria by western blot. (B) Idh1 levels in ubp3Δ cells and WT cells grown in high Pi. WT cells were grown in high glucose, or high glucose and high Pi medium (10 mM Pi) and ubp3Δ cells were grown in high glucose, and the Idh1 protein levels were estimated by western blot. A representative blot (out of three biological replicates, n=3) is shown in the lower panel. Quantification is shown in the upper panel. Data represent mean ± SD. (C) Mitochondrial membrane potential in tdh2Δtdh3Δ cells. WT, ubp3Δ, and tdh2Δtdh3Δ cells were grown in high glucose and the mitochondrial membrane potential was measured. Data represent mean ± SD from three biological replicates (n=3). (D) Pi levels in ubp3Δ cells grown in low Pi (1 mM Pi) vs WT cells. WT cells were grown in high glucose and ubp3Δ cells were grown in high glucose or high glucose-low Pi, and the total Pi levels were estimated. Data represent mean ± SD from three biological replicates (n=3). (E) Ethanol production in ubp3Δ cells grown in a low Pi medium. WT cells were grown in high glucose and ubp3Δ cells were grown in high glucose or high glucose-low Pi, and the ethanol concentration in the medium was measured. Data represent mean ± SD from three biological replicates (n=3). (F) Pi amounts and mitochondrial membrane potential in WT, ubp3Δ, and tdh2Δtdh3Δ cells. The cells were grown in high glucose or high glucose-low Pi, and the mitochondrial membrane potential was measured. Data from two independent experiments (n=2) is shown. Data represent mean ± SD. (G) The Pi-mediated change in basal oxygen consumption rate (OCR) in ubp3Δ is dependent on mitochondrial respiration. WT and Rho0 cells were grown in high glucose, Rho0/ubp3Δ were grown in high glucose and low Pi, and basal OCR was measured from three independent experiments (n=3). Data represent mean ± SD. (H) The protein levels of mitochondrial Pi transporters Mir1 and Pic2 in ubp3Δ cells. WT and ubp3Δ cells containing endogenously tagged Mir1 and Pic2 at their C terminus with a 6x HA epitope tag were grown in high glucose and Mir1 and Pic2 proteins were measured by western blot. A representative blot (out of three biological replicates, n=3) is shown in the lower panel. Quantification is shown in the upper panel. Data represent mean ± SD. Data information: *p<0.05, **p<0.01, ***p<0.001.
-
Figure 4—figure supplement 1—source data 1
Uncropped and labeled gels and blots for Figure 4—figure supplement 1.
- https://cdn.elifesciences.org/articles/90293/elife-90293-fig5-figsupp5-data5-v1.zip
-
Figure 4—figure supplement 1—source data 2
Raw unedited gels and blots for Figure 4—figure supplement 1.
- https://cdn.elifesciences.org/articles/90293/elife-90293-fig6-figsupp6-data6-v1.zip
Figure 5 with 1 supplement
Mitochondrial inorganic phosphate (Pi) availability constrains mitochondrial activity under high glucose.
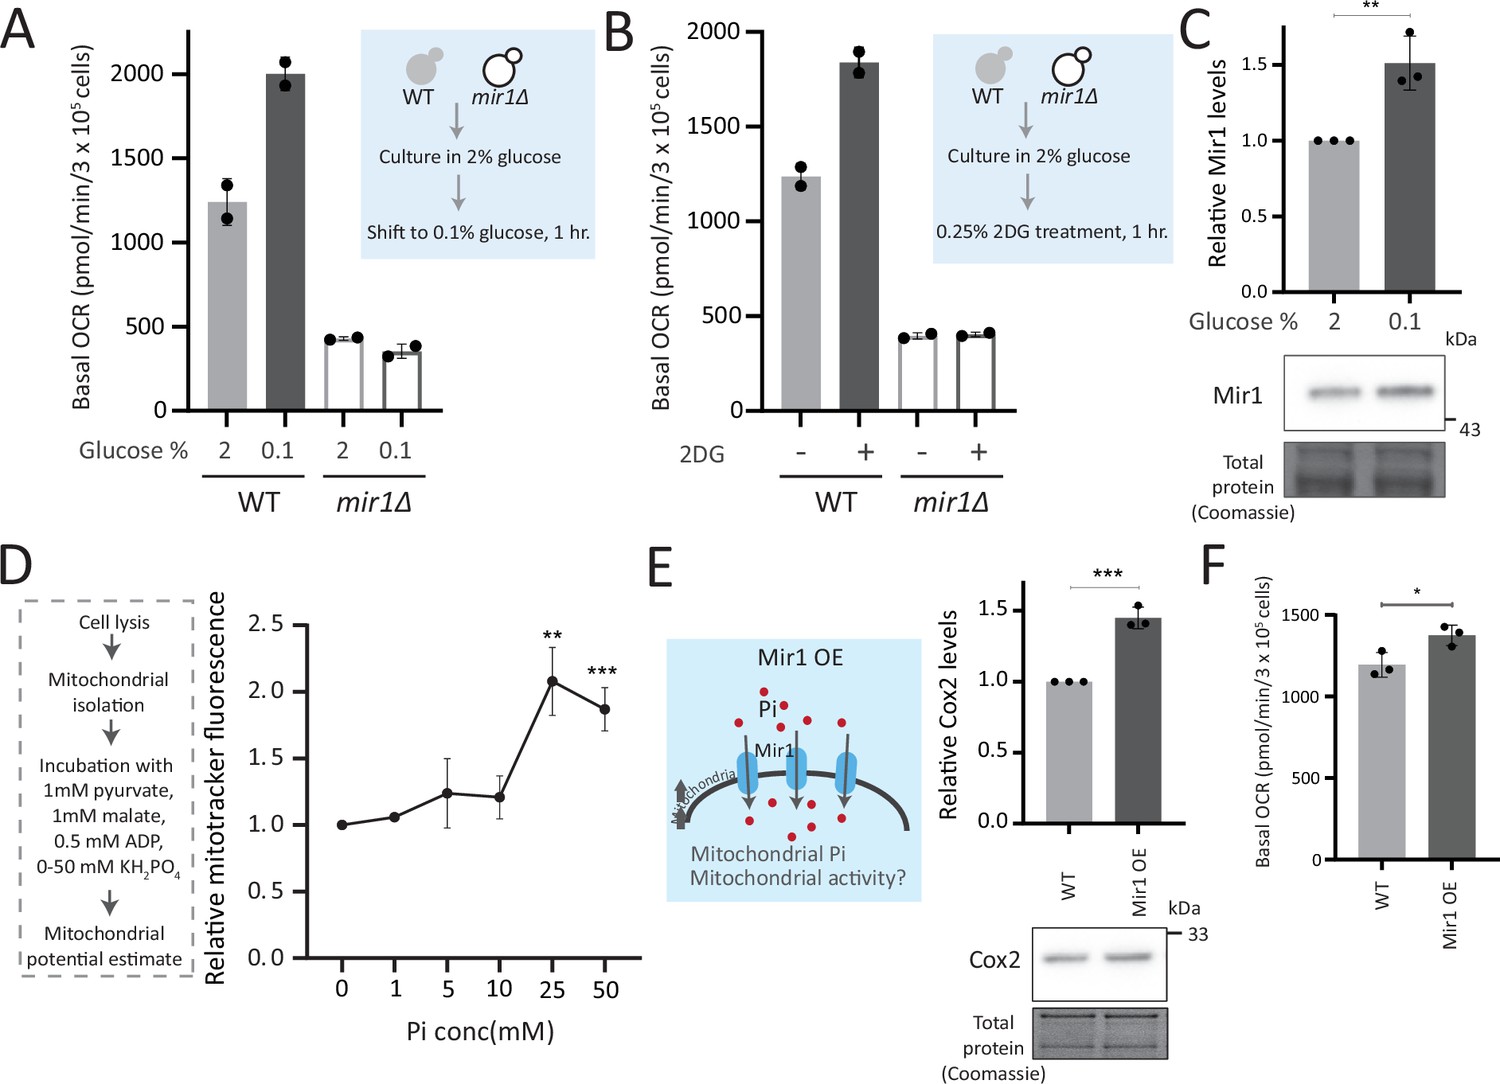
(A) Relationship of mitochondrial Pi transport and respiration after glucose removal. Wild-type (WT) and mir1Δ cells were cultured in high (2%) glucose and shifted to low (0.1%) glucose for 1 hr. The normalized basal oxygen consumption rate (OCR) from two independent experiments (n=2) are shown. Data represent mean ± SD. (B) Requirement of mitochondrial Pi transport for switch to respiration upon glycolytic inhibition by 2-deoxyglucose (2DG). WT and mir1Δ cells were cultured in high glucose and treated with or without 0.25% 2DG for 1 hr. Basal OCR was measured from two independent experiments (n=2). Data represent mean ± SD. Also see Figure 5—figure supplement 1A. (C) Glucose-dependent regulation of Mir1. Cells (with Mir1-HA) were grown in high glucose and shifted to low glucose (0.1% glucose) for 1 hr, and Mir1 levels compared. A representative blot (out of three biological replicates, n=3) and their quantifications are shown. Data represent mean ± SD. Also see Figure 5—figure supplement 1B. (D) Increasing Pi concentrations and mitochondrial activity in isolated mitochondria. Mitochondria were isolated from WT cells grown in high glucose, incubated with 1 mM pyruvate, 1 mM malate, 0.5 mM ADP, and 0–50 mM KH2PO4. The mitochondrial activity was estimated by mitotracker fluorescence intensity, and intensities relative to the sample with 0 mM KH2PO4 is shown. Data represent mean ± SD from three biological replicates (n=3). (E) Effect of overexpressing Mir1 on Cox2 protein. WT (containing empty vector) and Mir1 overexpressing (Mir1OE) cells were grown in high glucose and Cox2 levels were estimated. A representative blot (out of three biological replicates, n=3) and their quantifications are shown. Data represent mean ± SD. Also see Figure 5—figure supplement 1G. (F) Effect of overexpressing Mir1 on basal OCR. The basal OCR in WT (containing empty vector) and Mir1OE in high glucose was measured from three independent experiments (n=3). Data represent mean ± SD. Data information: *p<0.05, **p<0.01, ***p<0.001.
-
Figure 5—source data 1
Uncropped and labeled gels and blots for Figure 5.
- https://cdn.elifesciences.org/articles/90293/elife-90293-fig5-data1-v1.zip
-
Figure 5—source data 2
Raw unedited gels and blots for Figure 5.
- https://cdn.elifesciences.org/articles/90293/elife-90293-fig5-data2-v1.zip
Figure 5—figure supplement 1
Mitochondrial phosphate and pyruvate transport relationships with mitochondrial activity.
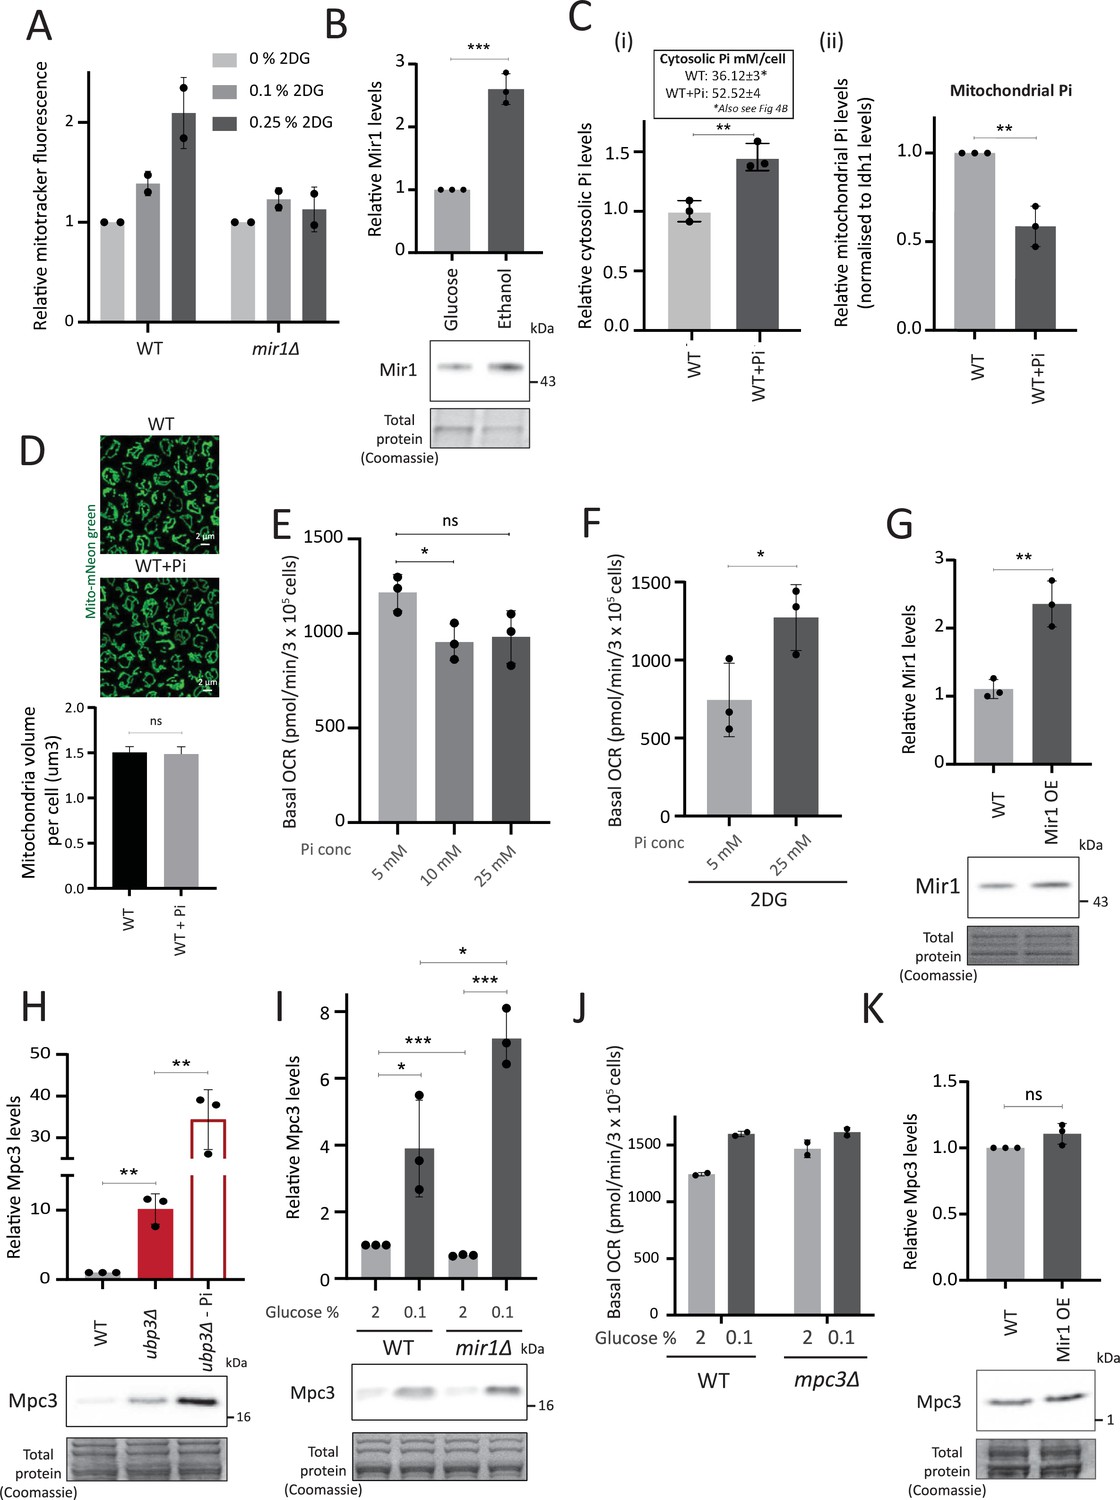
(A) Requirement of Mir1 for switching to increased mitochondrial activity upon 2-deoxyglucose (2-DG) treatment. Wild-type (WT) and mir1Δ cells were grown in high glucose and treated with 0.1% and 0.25% 2-DG for 1 hr. The mitochondrial membrane potential was measured from two independent experiments (n=2). Data represent mean ± SD. (B) Mir1 protein levels and glucose repression. Cells containing Mir1 endogenously tagged at the C terminus with a 6x HA epitope tag were grown in high glucose or a respiratory medium (2% ethanol). Mir1 protein was estimated by western blot. A representative blot (out of three biological replicates, n=3) is shown in the lower panel. Quantification is shown in the upper panel. Data represent mean ± SD. (C) Effect of supplementing inorganic phosphate (Pi) in the medium on cytosolic and mitochondrial Pi. WT cells were grown in high glucose, and high glucose-high Pi medium (10 mM Pi). The cytosolic fraction was isolated by centrifugation (see Appendix 1), and in separate experiments, mitochondria were isolated by immunoprecipitation from WT and ubp3Δ and mitochondrial Pi estimated. (i) Cytosolic Pi levels (relative and absolute) and (ii) mitochondrial Pi levels normalized to Idh1 protein levels is shown. Data represent mean ± SD from three biological replicates (n=3). Also see Figure 4—figure supplement 1A and B. (D) Effect of supplementing Pi on the total mitochondrial volume. WT cells with mitochondria targeted mNeon green were grown in high glucose, and high glucose, high Pi medium (10 mM Pi), cells were imaged and the total mitochondrial volume per cell was calculated. (E) Increasing Pi concentration in a high glucose medium results in a decrease in basal oxygen consumption rate (OCR). WT cells were grown in high glucose medium (YPD-Pi medium), supplemented with 5 mM Pi and at OD600~0.6, the medium was supplemented with Pi (10 mM and 25 mM final concentrations). The basal OCR was measured 1 hr after Pi supplementation. Data represent mean ± SD from three biological replicates (n=3). (F) Effect of increasing the Pi concentration in a high glucose medium, in the presence of 2DG, on basal OCR. WT cells were grown in high glucose medium (YPD-Pi medium), supplemented with 5 mM Pi and at OD600~0.6, the medium was supplemented with Pi (25 mM final concentration) and 2DG (0.25%) for 1 hr and the basal OCR was measured. Data represent mean ± SD from three biological replicates (n=3). (G) Overexpression of Mir1. C terminal 6x HA epitope-tagged Mir1 was expressed under G6PD promoter in cells with Mir1 endogenously tagged at the C terminus with a 6x HA epitope tag. WT cells (carrying an empty vector, and expressing Mir1-HA under the endogenous Mir1 promoter) and Mir1-OE cells were grown in high glucose. The protein levels of Mir1 were estimated by western blot, and clones with an ~2-fold increase in Mir1 were selected. A representative blot (out of three biological replicates, n=3) is shown in the lower panel. Quantification is shown in the upper panel. Data represent mean ± SD. (H) Mpc3 protein levels in ubp3Δ cells. WT and ubp3Δ cells containing endogenously tagged Mpc3 at the C terminus with a 3x FLAG epitope tag were cultured in high glucose (2% glucose) and high glucose-low Pi (2% glucose, 1 mM Pi). The Mpc3 protein levels were measured by western blot. A representative blot (out of three biological replicates, n=3) is shown in the lower panel, quantifications shown in the upper panel. Data represent mean ± SD. (I) Mpc3 protein amounts upon shifting WT and mir1Δ cells to a low-glucose medium. WT and mir1Δ cells containing Mpc3-FLAG were cultured in high glucose (2% glucose) and shifted to low (0.1%) glucose for 1 hr. Mpc3 protein was measured by western blot. A representative blot (out of three biological replicates, n=3) is shown in the lower panel, quantifications shown in the upper panel. Data represent mean ± SD. (J) Requirement of Mpc3 for the increase in basal OCR upon shifting to low glucose. WT and mpc3Δ cells were cultured in high glucose (2% glucose) and shifted to low (0.1%) glucose for 1 hr. The basal OCR from two independent experiments (n=2) normalized to the OD600 is shown. Data represent mean ± SD. (K) Mpc3 levels and Mir1 overexpression. WT cells and Mir1-OE cells containing endogenously tagged Mpc3 at the C terminus with a 3x FLAG tag were grown in high glucose. The protein levels of Mpc3 were estimated by western blot. A representative blot (out of three biological replicates, n=3) is shown in the panel. Quantification is shown in the upper panel. Data represent mean ± SD. Data information: *p<0.05, **p<0.01, ***p<0.001.
-
Figure 5—figure supplement 1—source data 1
Uncropped and labeled gels and blots for Figure 5—figure supplement 1.
- https://cdn.elifesciences.org/articles/90293/elife-90293-fig5-figsupp1-data1-v1.zip
-
Figure 5—figure supplement 1—source data 2
Raw unedited gels and blots for Figure 5—figure supplement 1.
- https://cdn.elifesciences.org/articles/90293/elife-90293-fig5-figsupp1-data2-v1.zip
Figure 6
Repression of mitochondrial respiration via inorganic phosphate (Pi) budgeting is conserved in Ubp3 mutants across diverse yeast genetic backgrounds.
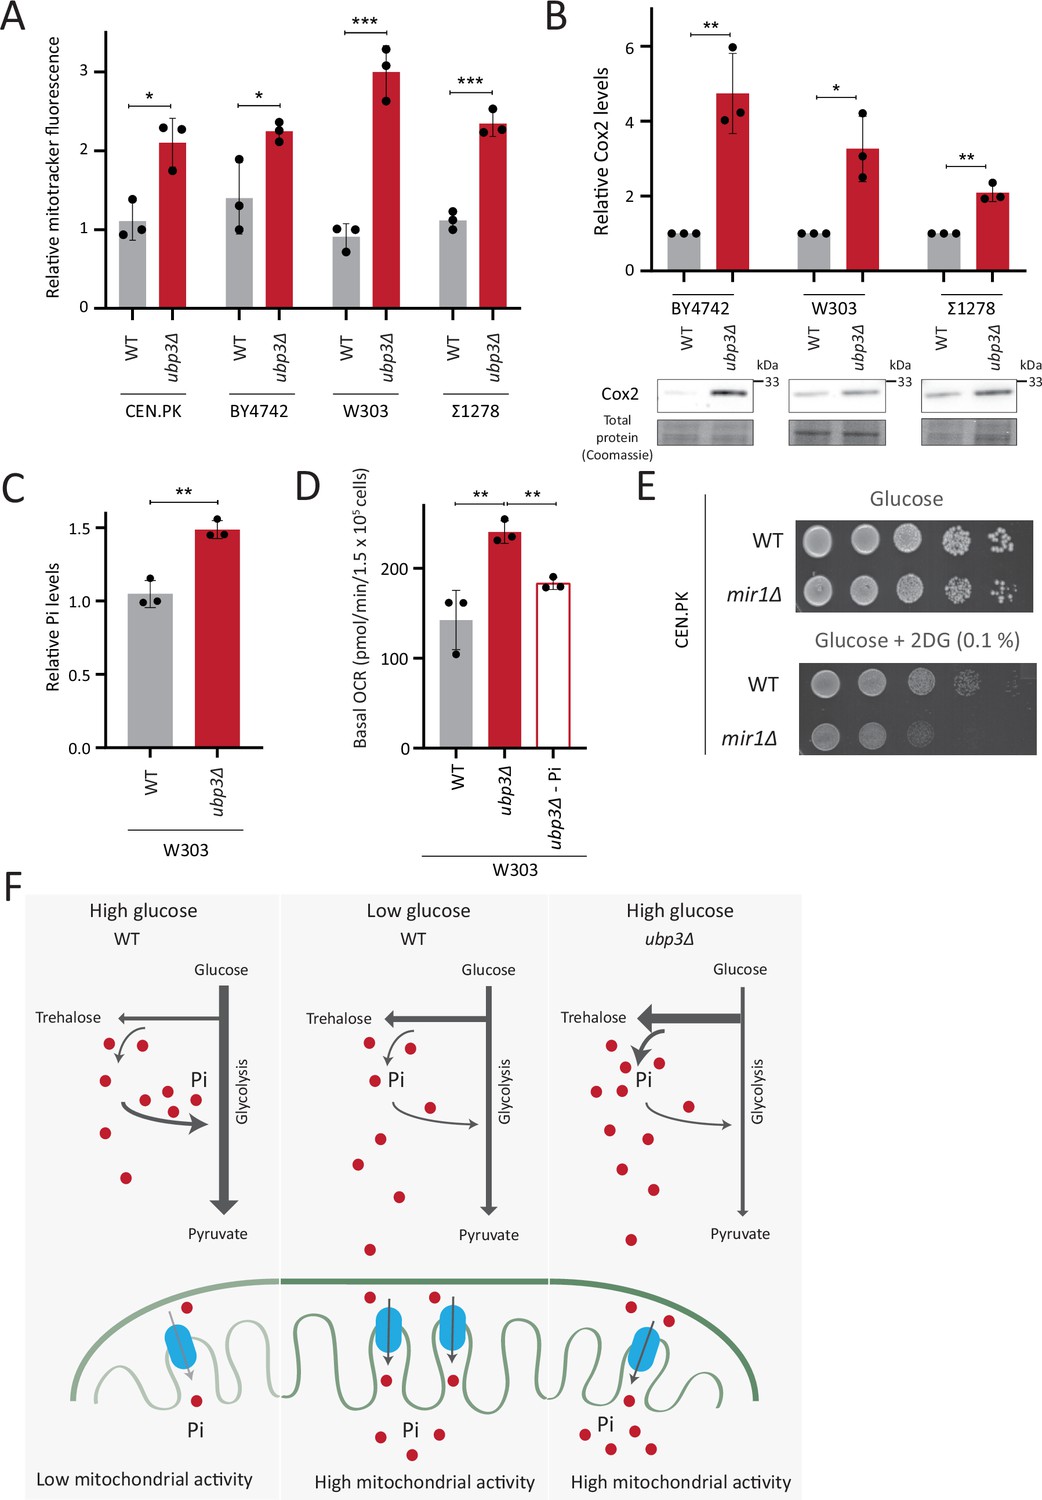
(A) Effect of loss of Ubp3 on mitochondrial membrane potential in different yeast strains. Wild-type (WT) and ubp3Δ cells (in CEN.PK as also shown earlier in the manuscript, BY4742, W303, and Σ1278 strains of S. cerevisiae) were grown in high glucose and relative mitochondrial membrane potential was measured. Data represent mean ± SD from three biological replicates (n=3). (B) Effect of loss of Ubp3 on electron transport chain (ETC) complex IV subunit Cox2. WT and ubp3Δ (in BY4742, W303, and Σ1278 strains of S. cerevisiae) were grown in high glucose, and Cox2 was measured. A representative blot (out of three biological replicates, n=3) and their quantifications are shown. Data represent mean ± SD. (C) Intracellular Pi levels in WT and ubp3Δ in W303 strain background. WT and ubp3Δ (in W303 strain background) were grown in high glucose and the total free phosphate (Pi) levels were estimated. Data represent mean ± SD from three biological replicates (n=3). (D) Effect of low Pi on the basal oxygen consumption rate (OCR) in WT and ubp3Δ cells in W303 strain background. WT cells were grown in high glucose and ubp3Δ were grown in high glucose and low Pi, and basal OCR was measured. Data represent mean ± SD (n=3). (E) Requirement of mitochondrial Pi transport for growth after 2-deoxyglucose (2DG) treatment. Shown are serial dilution growth assays in high glucose in the presence and absence of 0.1% 2DG, using WT and mir1Δ cells. The results after 40 hr incubation/30°C are shown. (F) A model illustrating how mitochondrial Pi availability controls mitochondrial activity. In high glucose, the decreased Pi due to high Pi consumption in glycolysis, along with the glucose-mediated repression of mitochondrial Pi transporters, decreases mitochondrial Pi availability. This reduces mitochondrial activity. In low glucose, increased mitochondrial Pi transporters and lower glycolytic flux increases mitochondrial Pi, leading to enhanced mitochondrial activity. In ubp3Δ cells in high glucose, high trehalose synthesis and lower glycolytic flux results in an increase in Pi. This increases mitochondrial Pi availability and thereby the mitochondrial activity. Data information: *p<0.05, **p<0.01, ***p<0.001.
-
Figure 6—source data 1
Uncropped and labeled gels and blots for Figure 6.
- https://cdn.elifesciences.org/articles/90293/elife-90293-fig6-data1-v1.zip
-
Figure 6—source data 2
Raw unedited gels and blots for Figure 6.
- https://cdn.elifesciences.org/articles/90293/elife-90293-fig6-data2-v1.zip
Tables
Appendix 1—table 1
List of strains used in this study.
| SL no. | Strain name | Genotype | Description | Source |
|---|---|---|---|---|
| 1 | CEN.PK a (WT) | Mat a | haploid strain of CEN.PK MAT ‘a’ mating type | van Dijken et al., 2000 |
| 2 | DUBs KO strains | CEN.PK a::hphMX6 | Deletion of the individual deubiquitinases (see Figure 1—figure supplement 1A) | This study |
| 3 | Ubp3C469A | CEN.PK a UBP3C469A | Catalytically inactive Ubp3 mutant | This study |
| 4 | Δatp1 | CEN.PK a Δatp1::natMX6 | Deletion of ATP1 gene | This study |
| 5 | Δatp1 Δubp3 | CEN.PK a Δubp3::hphMX6 Δatp1:: natMX6 | Deletion of ATP1 gene in a UBP3 deletion strain | This study |
| 6 | Δatp10 | CEN.PK a Δatp10::natMX6 | Deletion of ATP10 gene | This study |
| 7 | Δatp10 Δubp3 | CEN.PK a Δubp3::hphMX6 Δatp10:: natMX6 | Deletion of ATP10 gene in a UBP3 deletion strain | This study |
| 8 | Pfk1-FLAG | CEN.PK a PFK1 3x FLAG::natMX6 | C terminal tagged Pfk1 | This study |
| 9 | Pfk1-FLAG Δubp3 | CEN.PK a PFK1-3x FLAG::natMX6 Δubp3::hphMX6 | C terminal tagged Pfk1 in a UBP3 deletion strain | This study |
| 10 | Tdh2-FLAG | CEN.PK a TDH2-3x FLAG::natMX6 | C terminal tagged Tdh2 | This study |
| 11 | Tdh2-FLAG Δubp3 | CEN.PK a TDH2-3x FLAG::natMX6 Δubp3::hphMX6 | C terminal tagged Tdh2 in a UBP3 deletion strain | This study |
| 12 | Tdh3-FLAG | CEN.PK a TDH3-3x FLAG::natMX6 | C terminal tagged Tdh3 | This study |
| 13 | Tdh3-FLAG Δubp3 | CEN.PK a TDH3-3x FLAG::natMX6 Δubp3::hphMX6 | C terminal tagged Tdh3 in a UBP3 deletion strain | This study |
| 14 | Eno1-FLAG | CEN.PK a ENO1-3x FLAG::natMX6 | C terminal tagged Eno1 | This study |
| 15 | Eno1-FLAG Δubp3 | CEN.PK a ENO1-3x FLAG::natMX6 Δubp3::hphMX6 | C terminal tagged Eno1 in a UBP3 deletion strain | This study |
| 16 | Eno2-FLAG | CEN.PK a ENO2-3x FLAG::natMX6 | C terminal tagged Eno2 | This study |
| 17 | Eno2-FLAG Δubp3 | CEN.PK a ENO2-3x FLAG::natMX6 Δubp3::hphMX6 | C terminal tagged Eno2 in a UBP3 deletion strain | This study |
| 18 | Δtdh2 Δtdh3 | CEN.PK a Δtdh2::natMX6 Δtdh3:: kanMX6 | Deletion of TDH2 gene in a TDH3 deletion strain | This study |
| 19 | Δtps2 | CEN.PK a Δtps2::hphMX6 | Deletion of TPS2 gene | This study |
| 20 | Δtps2 Δubp3 | CEN.PK a Δtps2::hphMX6 Δubp3::natMX6 | Deletion of UBP3 gene in a TPS2 deletion strain | This study |
| 21 | Mir1-HA | CEN.PK a MIR1-6xHA::natMX6 | C terminal tagged Mir1 | This study |
| 22 | Mir1-HA Δubp3 | CEN.PK a MIR1-6xHA::natMX6 Δubp3::hphMX6 | C terminal tagged Mir1 in a UBP3 deletion strain | This study |
| 23 | Pic2-HA | CEN.PK a PIC2-6xHA::natMX6 | C terminal tagged Pic2 | This study |
| 24 | Pic2-HA Δubp3 | CEN.PK a PIC2-6xHA:: natMX6 Δubp3::hphMX6 | C terminal tagged Pic2 in a UBP3 deletion strain | This study |
| 25 | Δmir1 | CEN.PK a Δmir1::natMX6 | Deletion of Mir1 | This study |
| 26 | Δmir1 Δubp3 | CEN.PK a Δmir1::natMX6 Δubp3::hphMX6 | Deletion of Mir1 in a UBP3 deletion strain | This study |
| 27 | WT+ Empty vector | CEN.PK a pG6PD:: kanMX6 | haploid strain of CEN.PK MAT ‘a’ with an empty vector with kanamycin resistance | This study |
| 28 | Mir1-HA OE | CEN.PK a pG6PD-Mir1-6xHA:: kanMX6 | Mir1-HA overexpression under the constitutive G6PD promoter | This study |
| 29 | Mpc3-FLAG | CEN.PK a MPC3- 3xFLAG::natMX6 | C terminal tagged Mpc3 | This study |
| 30 | Mpc3-FLAG Δubp3 | CEN.PK a MPC3-3xFLAG:: natMX6 Δubp3::hphMX6 | C terminal tagged Mpc3 in a UBP3 deletion strain | This study |
| 31 | Mpc3-FLAG Mir1-HA OE | CEN.PK a MPC3-3xFLAG:: natMX6 pG6PD-Mir1-6xHA:: kanMX6 | C terminal tagged Mpc3 in Mir1-HA overexpression | This study |
| 32 | Δmpc3 | CEN.PK a Δmpc3::natMX6 | Deletion of Mpc3 | This study |
| 33 | Tom20-FLAG | CEN.PK a Tom20-3xFLAG::natMX6 | C terminal tagged Tom20 | This study |
| 34 | Tom20-FLAG Vph1-HA | CEN.PK a Tom20-3xFLAG:: natMX6 Vph1-6xHA:: hphMX6 | C terminal tagged Vph1 in c terminal tagged Tom20 | This study |
| 35 | Mito-Mneon green | CEN.PK a HO::PCYC1-SU9m Neongreen-TCYC1-KanMX6 | Mneon gene with a mitochondria targeted sequence at the N terminus | Dua et al., 2022 |
| 36 | cox2-62 | leu2 Δarg8 ΔURA3 ura3-52 kar1-1 ade2-101 | cox2-62 ρ+, Cox2 with deletion of -295 to +363 relative to AUG | Bonnefoy et al., 2001 |
| 37 | W303 | MAT a leu2-3,-112;his3-11,-15;trp11;ura3-1; ade2-1;can1-100 | WT W303 strain | Ralser et al., 2012 |
| 38 | W303 Δubp3 | MAT a leu2-3,-112;his3-11,-15;trp11;ura3-1; ade2-1;can1-100Δubp3::hphMX6 | Deletion of Ubp3 in W303 | This study |
| 39 | BY4742 | MAT α his3Δ1:leu2Δ0:lys2Δ0: MET15:ura3Δ0 | WT BY4742 strain | Winston et al., 1995 |
| 40 | BY4742 Δubp3 | MAT α his3Δ1:leu2Δ0:lys2Δ0: MET15:ura3Δ0 Δubp3::hphMX6 | Deletion of Ubp3 in BY4742 | This study |
| 41 | Σ1278 | MAT a | WT Σ1278 strain | Isolate via Fink lab |
| 42 | Σ1278 Δubp3 | MAT a ura3-52 Δubp3::hphMX6 | Deletion of Ubp3 in BY4742 | This study |
| 43 | S288C | MAT a | WT S288C strain | This study |
| 44 | Rho0 | CEN.PK Mat a | Lacks mitochondrial DNA, generated using EtBr treatment | This study |
| 45 | Rho0 Δubp3 | CEN.PK Mat a | Deletion of Ubp3 in Rho0 strain | This study |
Appendix 1—table 2
Oligonucleotides used for CRISPR-Cas9 based mutagenesis.
| Ubp3C469A gRNA forward | AGAACTCATAAAACAAATGTgtttt |
| Ubp3C469A gRNAreverse | ACATTTGTTTTATGAGTTCTgatca |
| HR fragment Ubp3C469A forward | CAAAATACCAGTCCATTCCATTATTCCAAGAGGCATAATTAACAGAGCCAACATTGCTTTTATGAGTTCT |
| HR fragment Ubp3C469A reverse | ACGTTAATTACATCAATAAATGGCTTACAGTAGAGTAACACTTGTAACACAGAACTCATAAAAGCAATGT |
Appendix 1—table 3
List of parent ion mass and product ion mass (Q1/Q3) used for detection of metabolites.
| Metabolite | Parent Ion (Q1) mass | Product Ion (Q3) mass | Collision energy (V) | Retention time |
|---|---|---|---|---|
| Glucose 6-phosphate (G6P) / Fructose 6-phosphate (F6P) | 259 | 97 | -20 | 2.68 |
| 13C_G6P/F6P_6 | 265 | 97 | -20 | 2.68 |
| Fructose 1,6-bisphosphate (F16BP) | 339 | 97 | -20 | 2.42 |
| 13C_F16BP_6 | 345 | 97 | -20 | 2.42 |
| Trehalose | 341.3 | 179.3 | -17 | 3.85 |
| 13C_Trehalose_6 | 347.3 | 185.3 | -17 | 3.85 |
| 13C_Trehalose_12 | 353.3 | 185.3 | -17 | 3.85 |
| Ribose 5-phosphate (R5P) | 229 | 97 | -20 | 2.69 |
| Sedoheptulose-7-phosphate (S7P) | 289 | 97 | -20 | 2.68 |
| Glyceraldehyde 3-phosphate (G3P) | 169 | 97 | -20 | 2.65 |
| 13C_G3P_3 | 172 | 97 | -20 | 2.65 |
| Phosphoenol pyruvate (PEP) | 167 | 79 | -12 | 2.45 |
| 13C_PEP_3 | 170 | 79 | -12 | 2.45 |
| 3-phosphoglycerate (3PG) | 185 | 97 | -20 | 2.53 |
| 13C_3PG_3 | 188 | 97 | -20 | 2.53 |
| Pyruvate | 299.1 | 91.1 | 28 | 8.89 |
| Citrate | 508 | 385 | 7 | 8.04 |
| 13C_ Citrate _2 | 510 | 387 | 7 | 8.03 |
| 13C_ Citrate _3 | 511 | 388 | 7 | 8.03 |
| 13C_ Citrate _4 | 512 | 389 | 7 | 7.69 |
| 13C_ Citrate _5 | 513 | 390 | 7 | 7.91 |
| 13C_ Citrate _6 | 514 | 391 | 7 | 8.42 |
| 2-Ketoglutarate (2-KG) | 462 | 339 | 11 | 8.68 |
| 13 C_2-KG_1 | 463 | 340 | 11 | 8.67 |
| 13 C_2-KG_2 | 464 | 341 | 11 | 8.67 |
| 13 C_2-KG_3 | 465 | 342 | 11 | 8.63 |
| 13 C_2-KG_4 | 466 | 343 | 11 | 8.6 |
| 13 C_2-KG_5 | 467 | 344 | 11 | 8.69 |
| Succinate | 329 | 206 | 15 | 8.21 |
| 13C_Succinate_1 | 330 | 207 | 15 | 7.32 |
| 13C_Succinate_2 | 331 | 208 | 15 | 7.32 |
| 13C_Succinate_3 | 332 | 209 | 15 | 6.97 |
| 13C_Succinate_4 | 333 | 210 | 15 | 6.96 |
| Fumarate | 327 | 91.2 | 34 | 7.55 |
| 13C_Fumarate_1 | 328 | 91.2 | 34 | 7.74 |
| 13C_Fumarate_2 | 329 | 91.2 | 34 | 7.32 |
| 13C_Fumarate_3 | 330 | 91.2 | 34 | 7.32 |
| 13C_Fumarate_4 | 331 | 91.2 | 34 | 7.32 |
| Malate | 345 | 91.2 | 33 | 7.09 |
| 13C_Malate_1 | 346 | 91.2 | 33 | 7.08 |
| 13C_Malate_2 | 347 | 91.2 | 33 | 7.08 |
| 13C_Malate_3 | 348 | 91.2 | 33 | 7.2 |
| 13C_Malate_4 | 349 | 91.2 | 33 | 6.61 |
| Oxaloacetate | 448 | 325 | 10 | 9.92 |
| 13C_Oxaloacetate_1 | 449 | 326 | 10 | 8.67 |
| 13C_Oxaloacetate_2 | 450 | 327 | 10 | 8.67 |
| 13C_Oxaloacetate_3 | 451 | 328 | 10 | 8.63 |
| 13C_Oxaloacetate_4 | 452 | 329 | 10 | 8.6 |
Additional files
-
Supplementary file 1
The peak areas and retention times for the metabolites (labeled and unlabeled) from the LC-MS/MS measurements are shown for wild-type (WT) and other mutants.
The peak areas were analyzed by Multiquant software, version 3.0.1.
- https://cdn.elifesciences.org/articles/90293/elife-90293-supp1-v1.xlsx
-
MDAR checklist
- https://cdn.elifesciences.org/articles/90293/elife-90293-mdarchecklist1-v1.pdf
Download links
A two-part list of links to download the article, or parts of the article, in various formats.
Downloads (link to download the article as PDF)
Open citations (links to open the citations from this article in various online reference manager services)
Cite this article (links to download the citations from this article in formats compatible with various reference manager tools)
The deubiquitinase Ubp3/Usp10 constrains glucose-mediated mitochondrial repression via phosphate budgeting
eLife 12:RP90293.
https://doi.org/10.7554/eLife.90293.4


