Interpreting roles of mutations associated with the emergence of S. aureus USA300 strains using transcriptional regulatory network reconstruction
- University of California, San Diego, United States
- Palmona Pathogenomics, United States
- Collaborative to Halt Antibiotic-Resistant Microbes (CHARM), Department of Pediatrics, University of California San Diego, United States
- Department of Pediatrics, University of California San Diego, United States
Figures
Figure 1 with 1 supplement
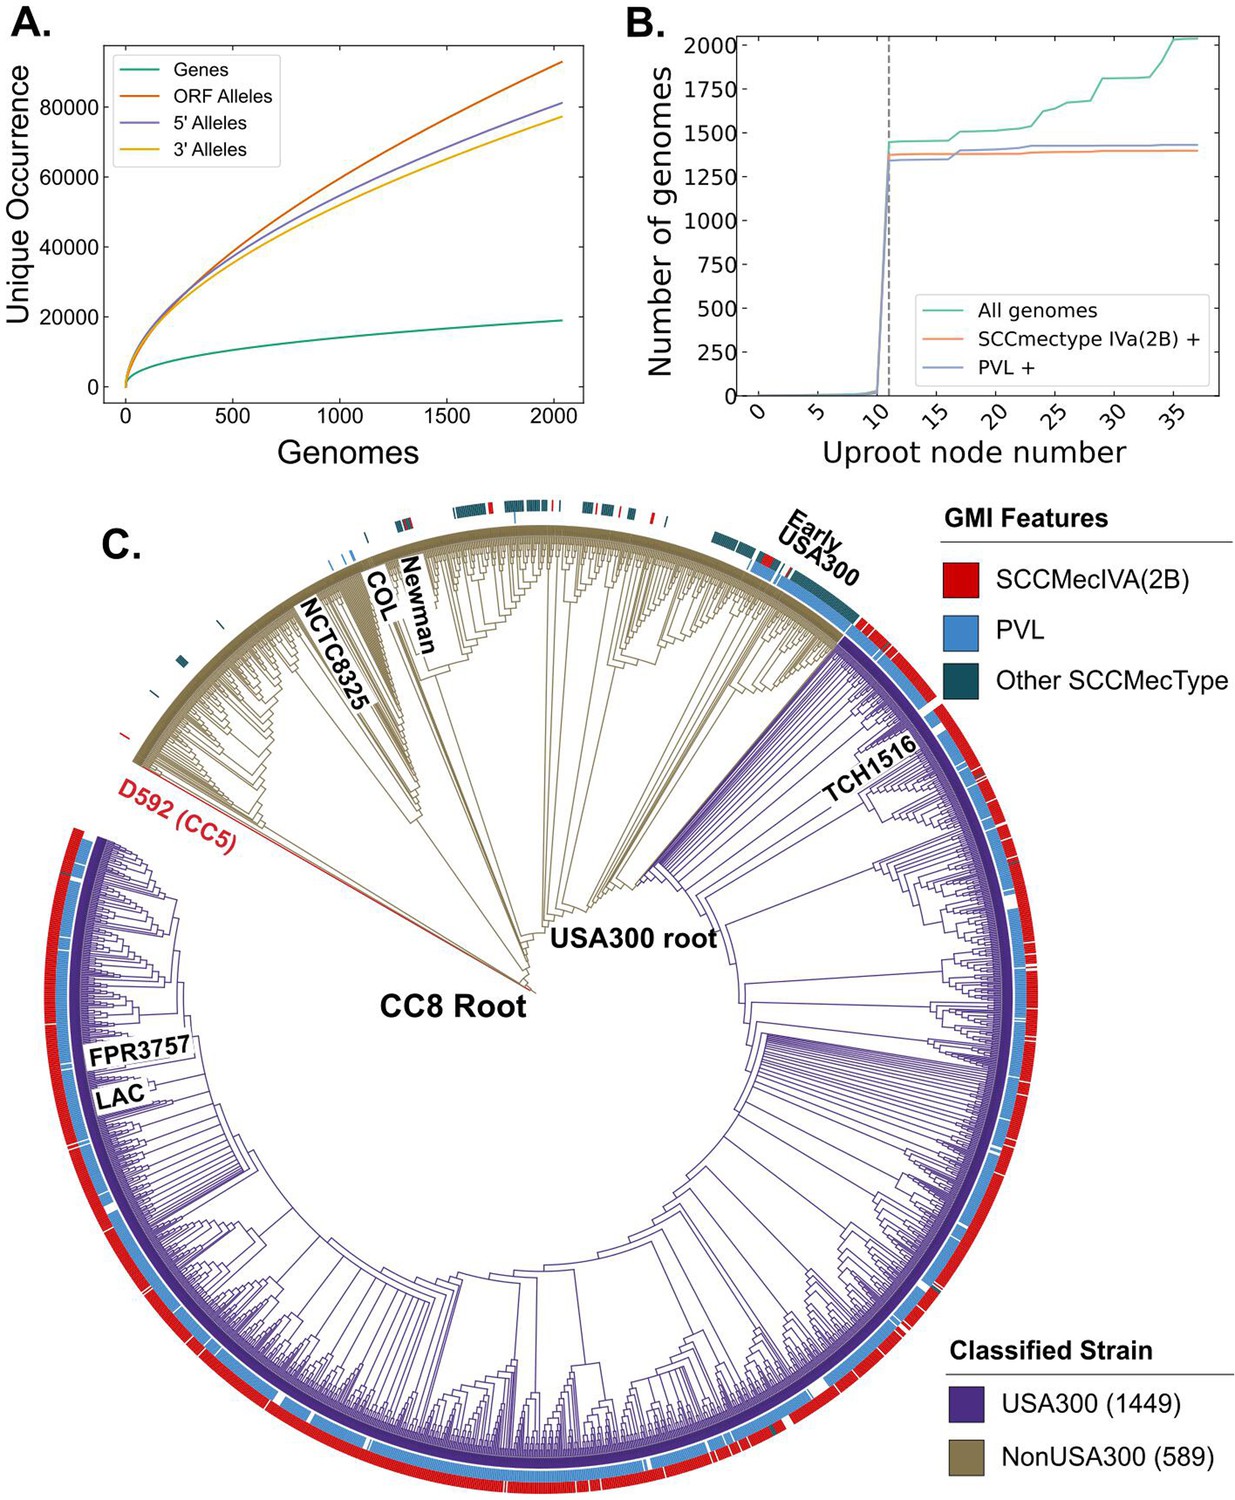
Clonal complex 8 (CC8) pangenome and phylogeny.
(A) Pangenomic analysis of CC8 genomes shows the distribution of genes and mutations in open reading frames (ORFs) and regulatory regions. (B) Prevalence of USA300-specific genetic markers, Panton–Valentine Leukocidin (PVL) and SCCmec IVa, as you traverse up the phylogenetic tree from TCH1516. The gray dashed line represents the node where the USA300 root is placed. (C) Phylogenetic tree of CC8 genomes classified into USA300 and non-USA300 strains.
Figure 1—figure supplement 1
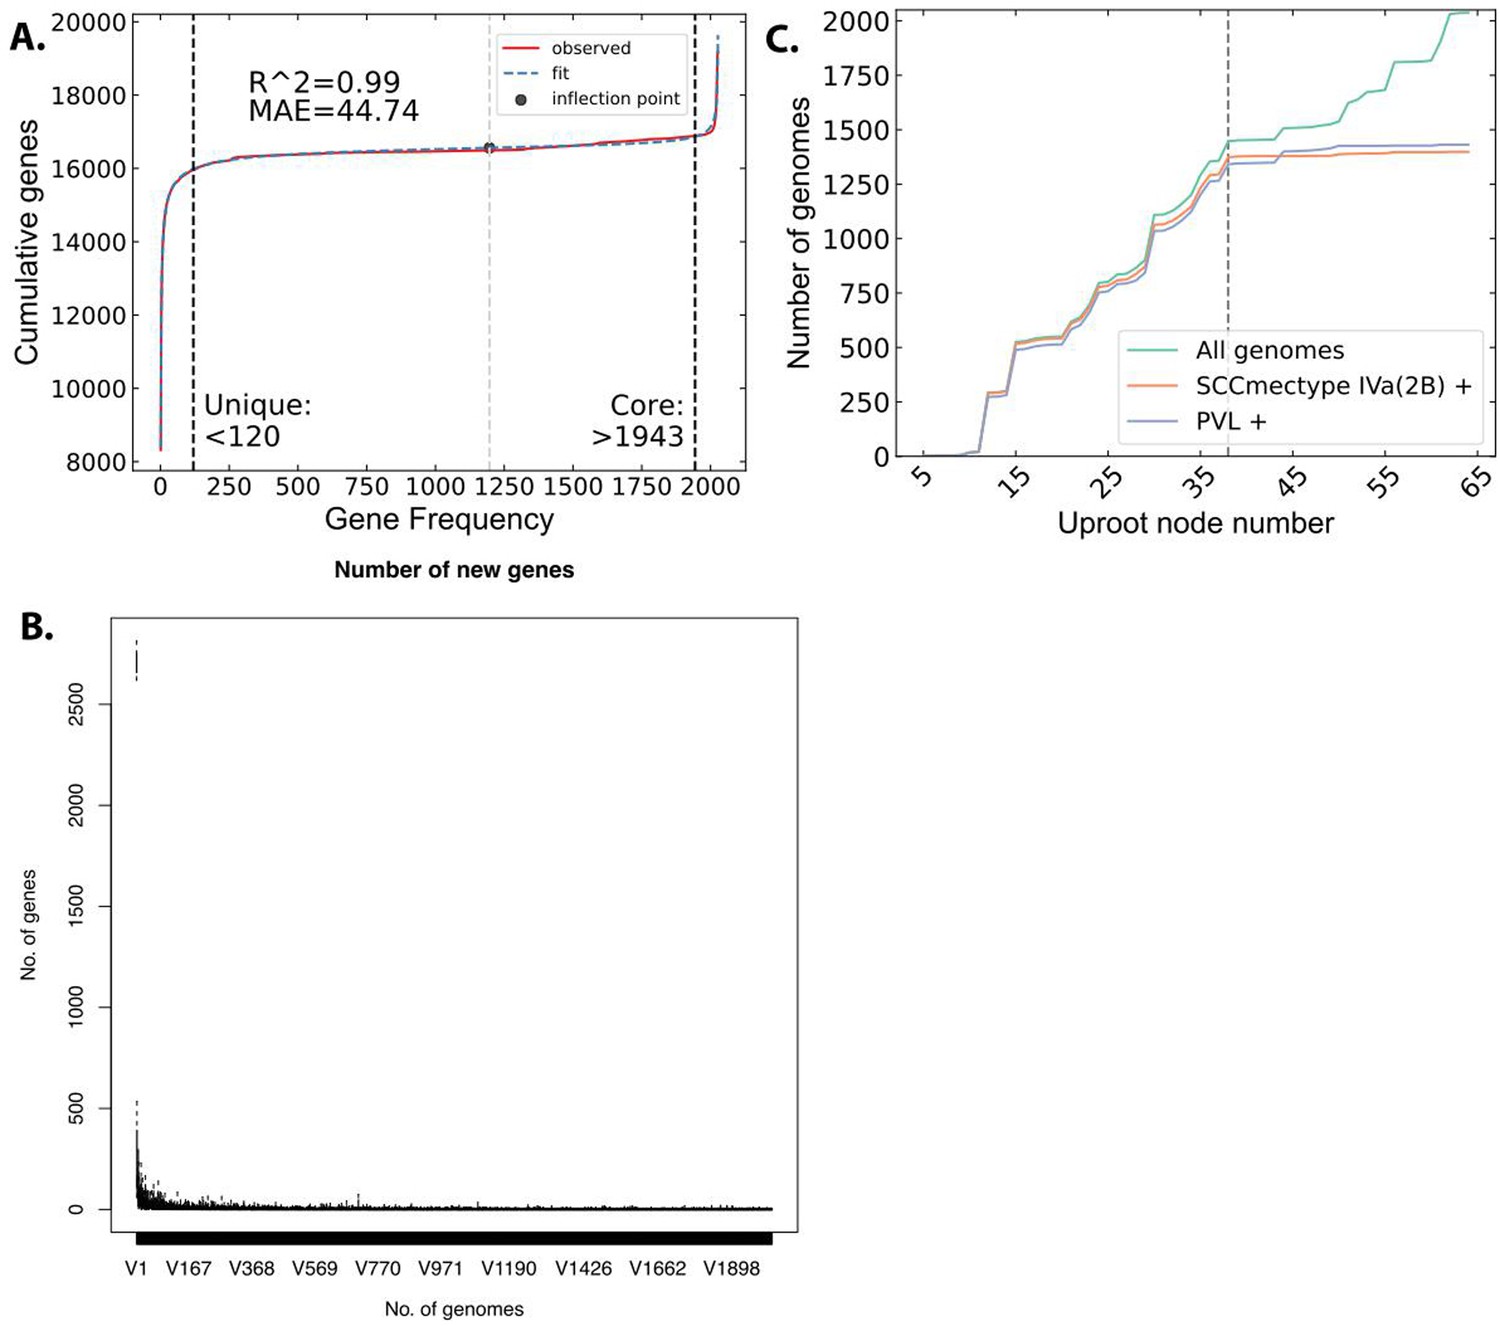
Pangenome analysis and strain classification.
(A) Cumulative distribution of unique genes used to fit the pangenomic parameters. The core and unique genes threshold were calculated at 90% of the distance from the inflection point (black dot) of the curve. (B) Analysis with Roary confirmed that adding new genomes to the analysis collection were unlikely to introduce many new genes which indicates a good gene-level coverage of the clonal complex 8 (CC8) clade. (C) SCCmec and Panton–Valentine Leukocidin (PVL) distribution in the CC8 tree as it is traversed up from the FPR3757 leaf toward the root. Starting from FPR3757 gives the same delineation between USA300 and non-USA300 genomes as the search that starts from TCH1516.
Figure 2 with 2 supplements

USA300 strains associated mutations.
(A) De Bruijn graph genome-wide association study (DBGWAS) recovers components associated with USA300 previously described markers of USA300 strains including mecA (SCCmec IVa), arcA (ACME), cap5e mutation, seq, sek, and Phi-PVL. In addition, components with many other mutations scattered throughout the genome (NC_010079) are also enriched. Each ‘significant node’ represents a k-mer sequence (with minimum size of 31 nucleotides) that are associated with USA300 strains (adjusted p-value <0.05).
Figure 2—figure supplement 1
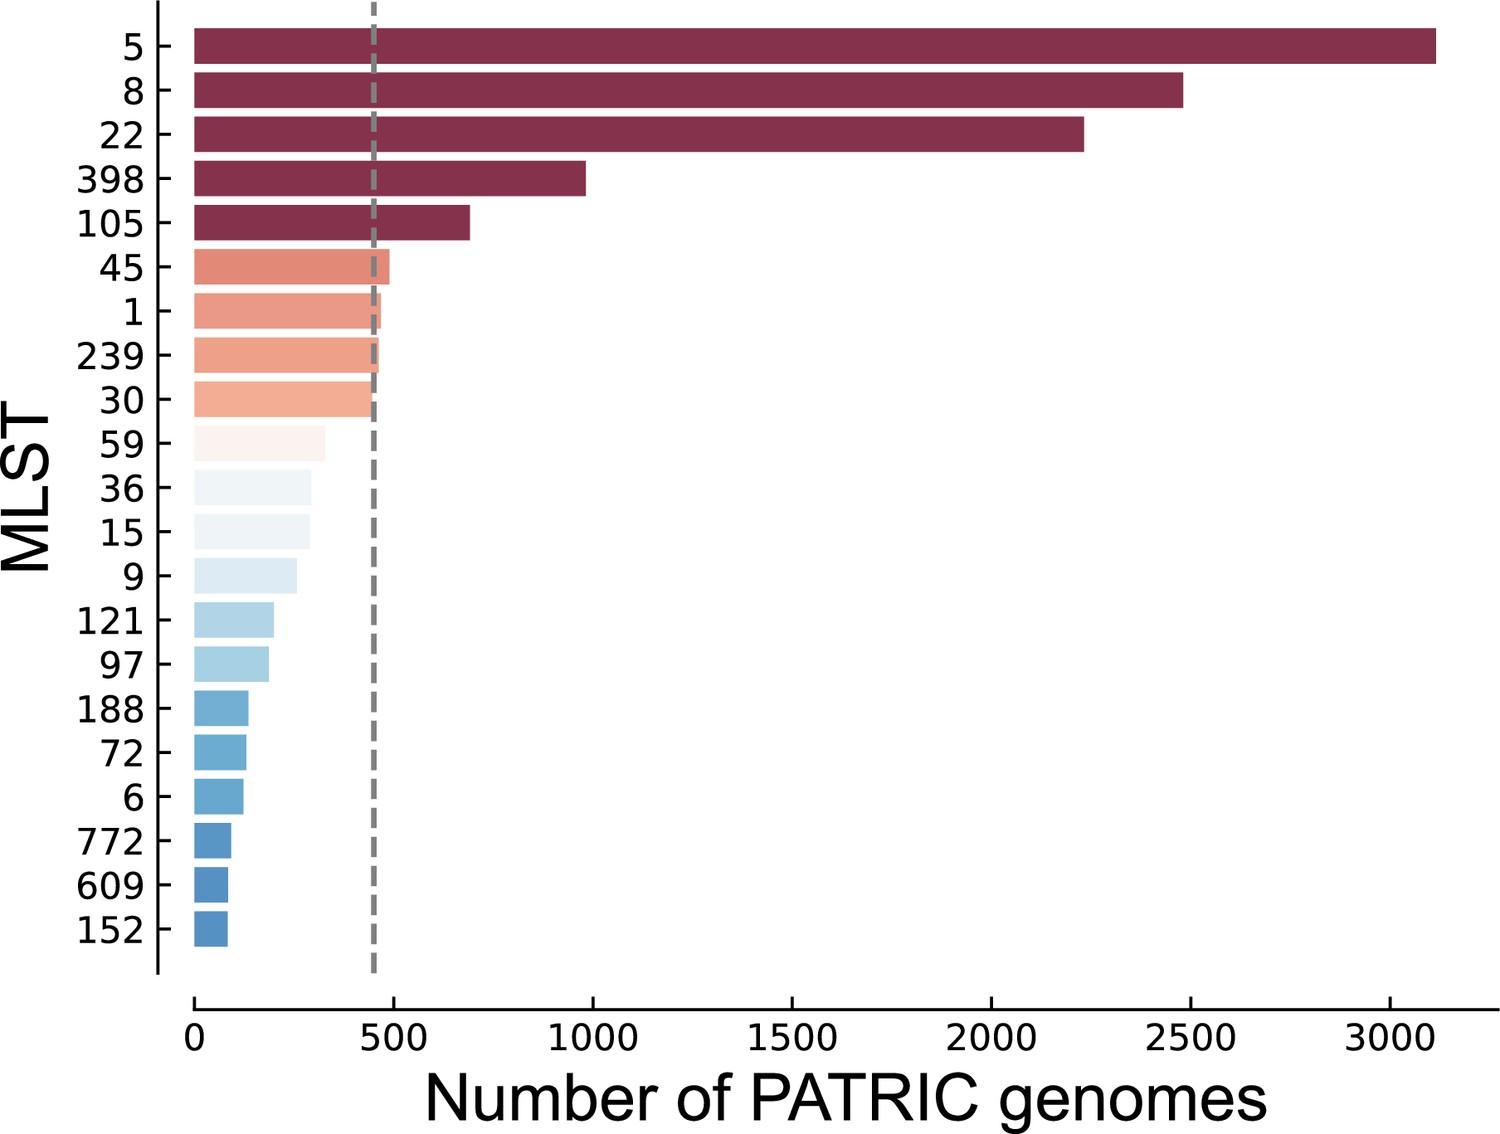
S. aureus multilocus sequence type (MLST) distribution of genomes from PATRIC used in this study.
Figure 2—figure supplement 2

Interpreting De Bruijn graph genome-wide association study (DBGWAS) output.
(A) Example of components associated with mobile genetic elements (MGEs); components have a series of nodes that are enriched in one group (blue circles). (B) Example of components associated with single-nucleotide polymorphism (SNP). Component graph contains a cycle around the mutation location with the paths from the cycle forming a sequence unique to either case or control group. Aligning the sequences reveals the enriched mutation.
Figure 3 with 1 supplement
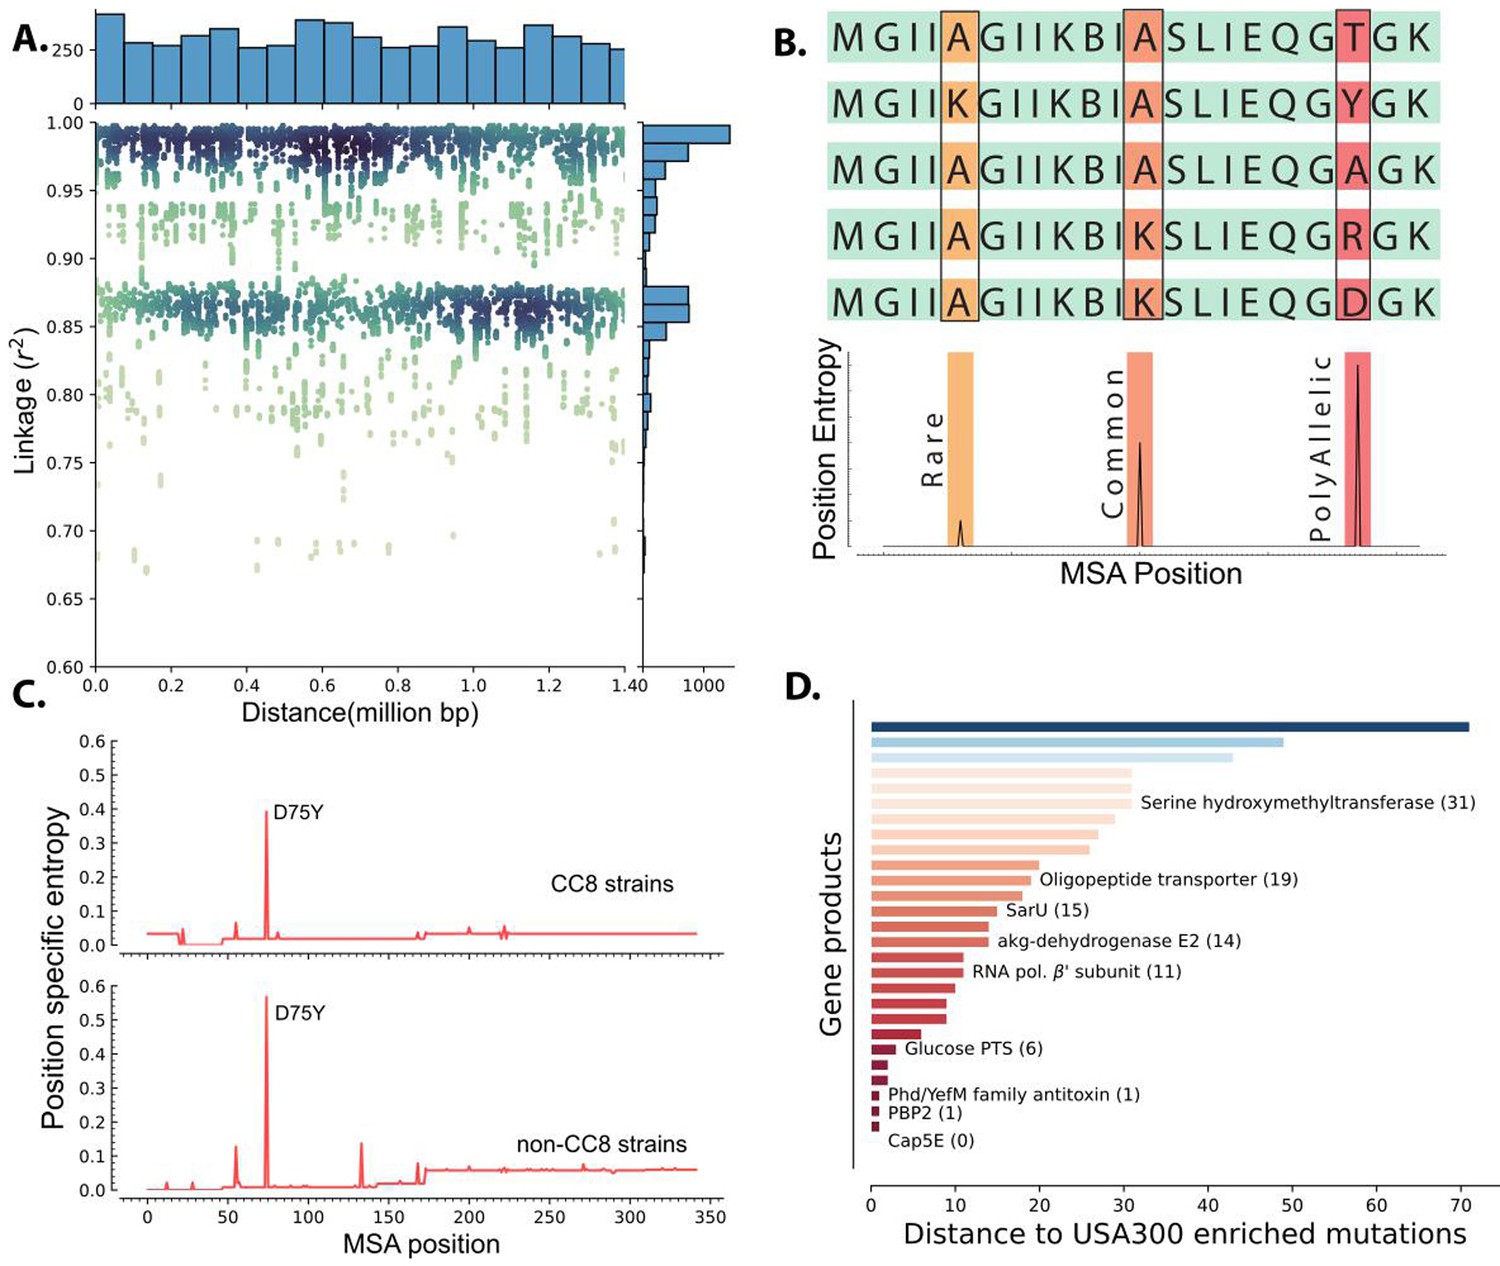
Linkage disequilibrium and de novo mutations in USA300 strains.
(A) Enriched k-mers showed high linkage disequilibrium, with some k-mers at 1.4 Mbp distance still having r2 of greater than 0.98. (B) Schematic of position-specific entropy analysis. Positions with heterogeneous sequences have higher calculated entropy than more conserved sequences with fewer mutations. (C) Using position-specific entropy, we only found one example of shared enriched mutation in open reading frames (ORFs) of USA300 and non-USA300 strains. (D) Distance (in base pairs) between the position of enriched mutation in USA300 strains and the position of the nearest entropy peak in other non-clonal complex 8 (CC8) strains.
Figure 3—figure supplement 1
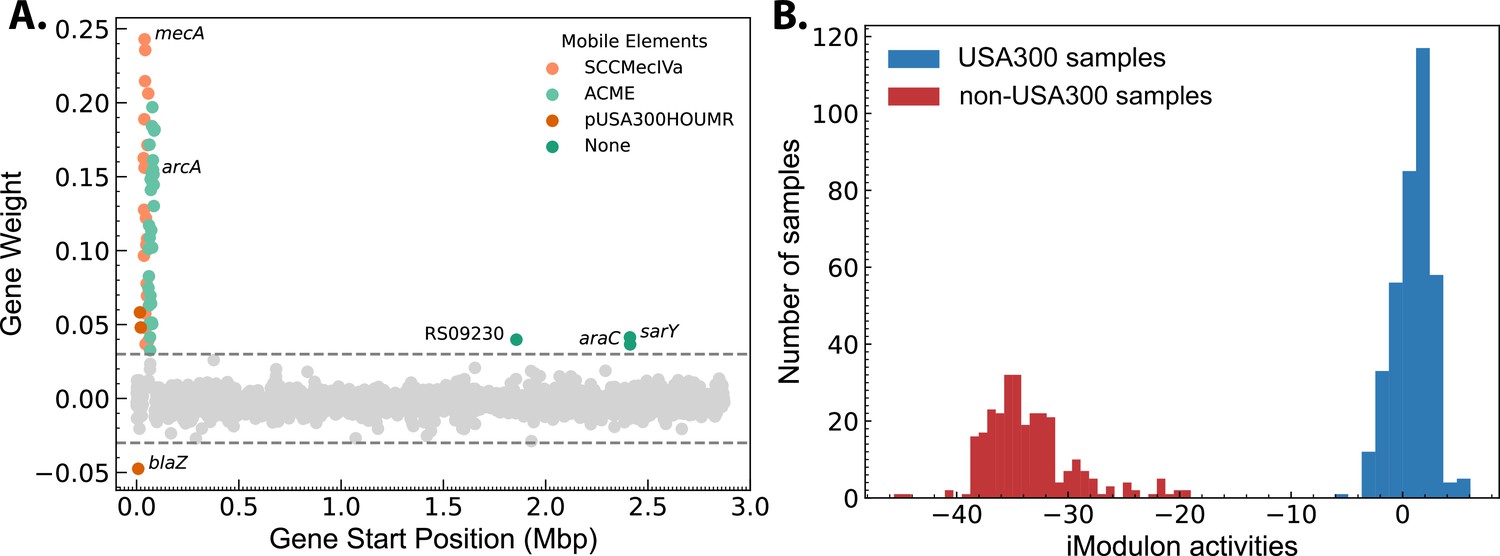
SCCmec/ACME iModulons weighting and strain-specific activity.
(A) The activity of the SCCmec/ACME iModulon shows clear strain-specific separation. (B) Gene weighting for the iModulon primarily containing SCCmec and ACME. Genes encoding SarY and AraC family proteins were also enriched.
Figure 4 with 1 supplement
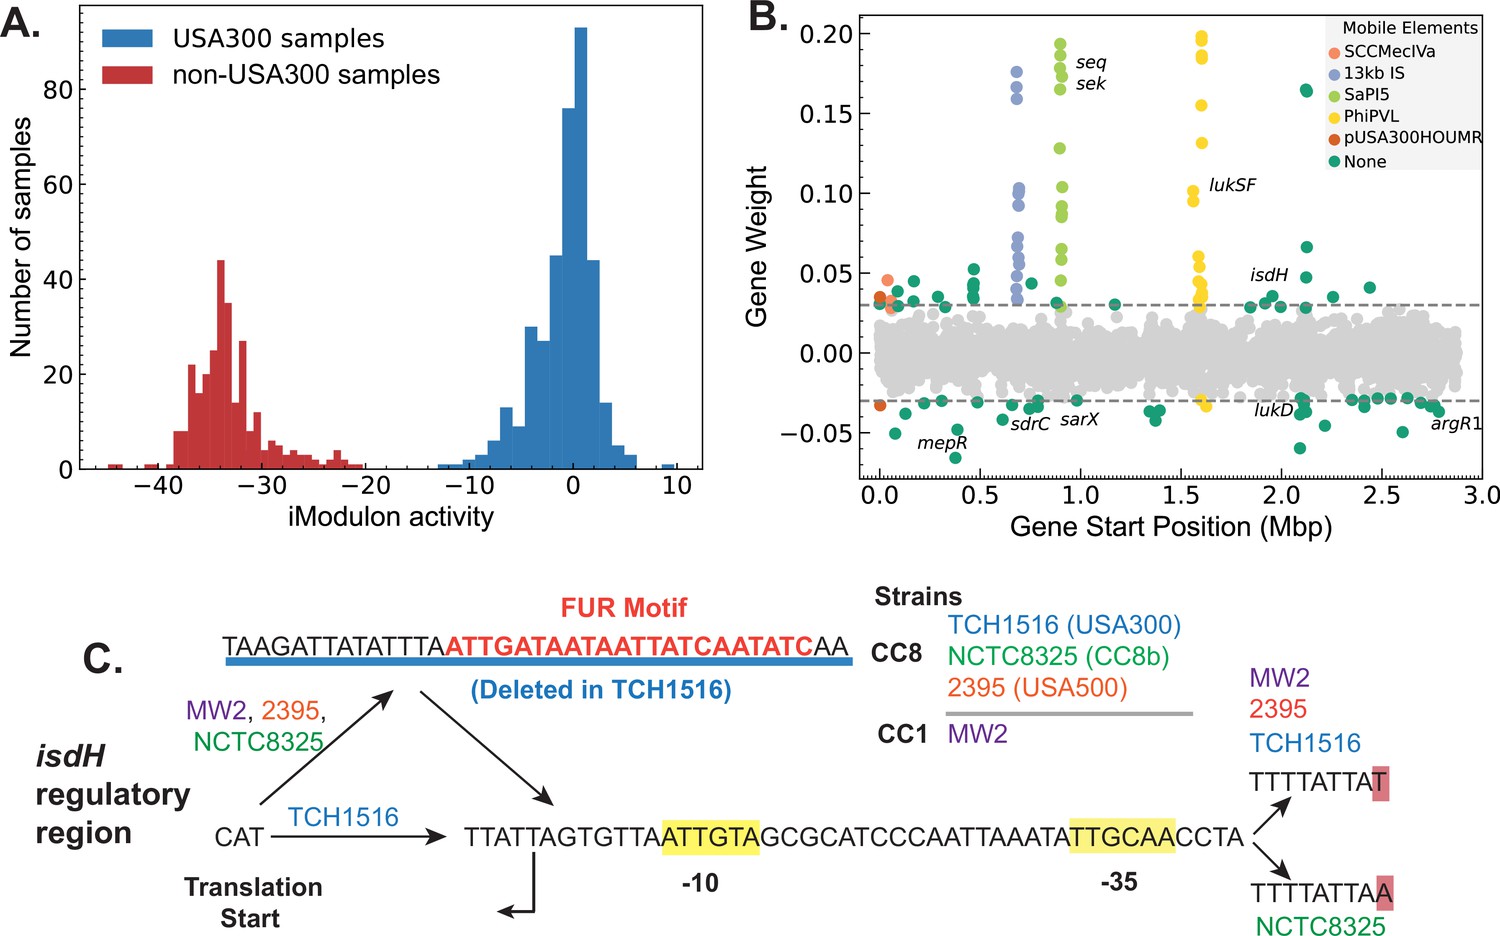
Strain-specific regulatory changes in the clonal complex 8 (CC8) clade.
(A) Independent component analysis (ICA) of USA300 and non-USA300 RNA-sequencing data identified an iModulon with strain-specific activity. (B) The strain-specific iModulon contained various horizontally acquired elements (e.g. ACME, Phi-PVL) that are prevalent in USA300 lineage as well as conserved genes with strain-specific expression patterns. (C) Comparing the 5′ regulatory region of the gene isdH from various S. aureus strains revealed a unique deletion containing Fur-binding site in USA300 reference strain TCH1516.
Figure 4—figure supplement 1
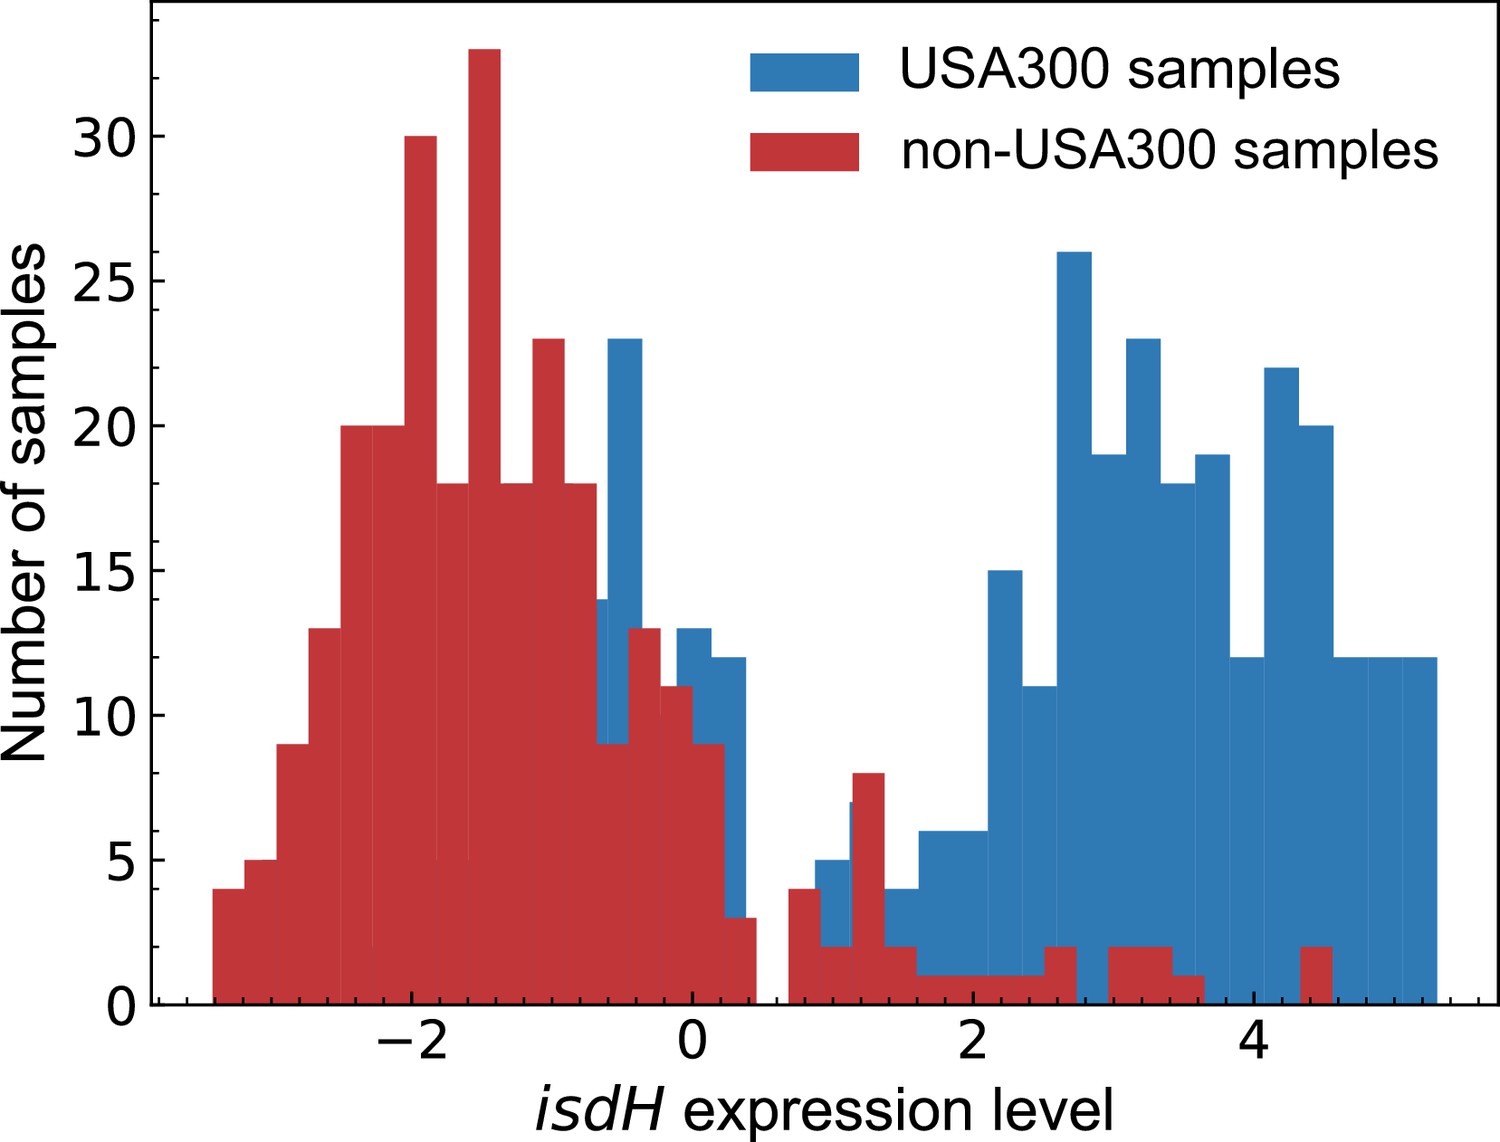
isdH gene shows strain-specific gene expression level.
The increased expression level in USA300 is in line with the deletion of the Fur repressor-binding site. The expression levels are log-TPM centered on the expression profile from the TCH1516 strain grown in RPMI + 10% LB.
Additional files
-
Supplementary file 1
List of S. aureus strains used for De Bruijn graph genome-wide association study (GWAS) analysis.
- https://cdn.elifesciences.org/articles/90668/elife-90668-supp1-v1.zip
-
Supplementary file 2
Raw De Bruijn graph genome-wide association study (DBGWAS) output and network analysis output.
- https://cdn.elifesciences.org/articles/90668/elife-90668-supp2-v1.xlsx
-
Supplementary file 3
Metadata of the RNA-sequencing data used to create the transcriptional regulatory network (TRN) model with independent component analysis (ICA).
- https://cdn.elifesciences.org/articles/90668/elife-90668-supp3-v1.csv
-
Supplementary file 4
Conserved genes that were enriched by De Bruijn graph genome-wide association study (DBGWAS) and by iModulon analysis.
- https://cdn.elifesciences.org/articles/90668/elife-90668-supp4-v1.csv
-
Supplementary file 5
Results of BLASTing Panton–Valentine Leukocidin (PVL) genes against all genomes used in De Bruijn graph genome-wide association study (DBGWAS).
- https://cdn.elifesciences.org/articles/90668/elife-90668-supp5-v1.xlsx
-
MDAR checklist
- https://cdn.elifesciences.org/articles/90668/elife-90668-mdarchecklist1-v1.pdf
Download links
A two-part list of links to download the article, or parts of the article, in various formats.
Downloads (link to download the article as PDF)
Open citations (links to open the citations from this article in various online reference manager services)
Cite this article (links to download the citations from this article in formats compatible with various reference manager tools)
Interpreting roles of mutations associated with the emergence of S. aureus USA300 strains using transcriptional regulatory network reconstruction
eLife 12:RP90668.
https://doi.org/10.7554/eLife.90668.3


