Activity of MukBEF for chromosome management in E. coli and its inhibition by MatP
- Université Paris-Saclay, CEA, CNRS, Institute for Integrative Biology of the Cell, France
Figures
Figure 1 with 1 supplement
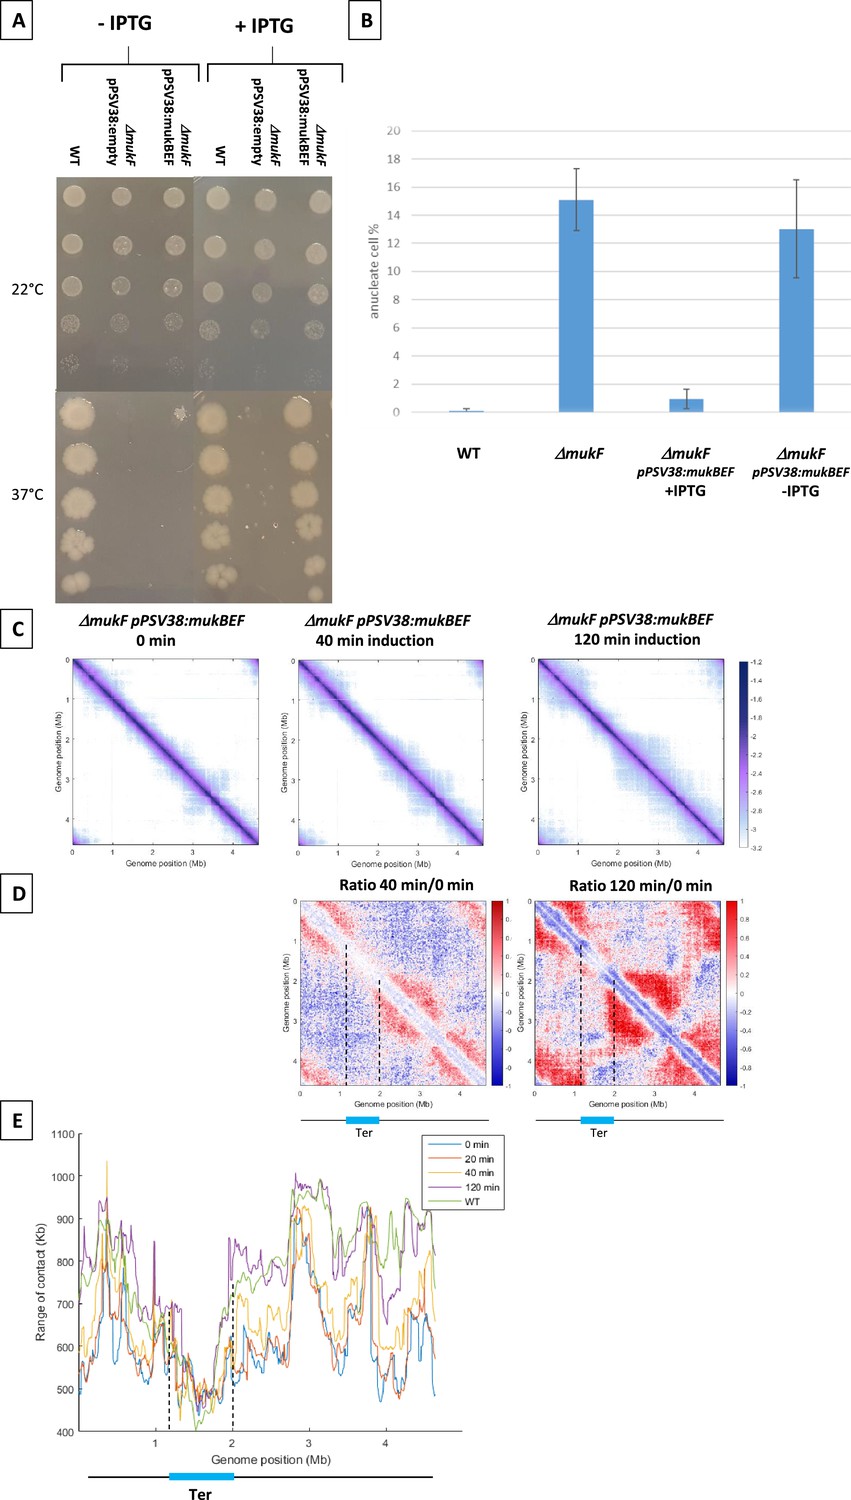
MukBEF activity detected along the chromosome.
(A) Complementation of the ΔmukF mutant. Serial dilutions (10–1 to 10–5) of an exponential culture of MG1655 (wild-type [WT]), MG1655 ΔmukF ppSV38, and MG1655 ΔmukF ppSV38::mukBEF were plated on media with (right) or without (left) inducer (IPTG). Plates were incubated at a permissive temperature of 22°C (top) or at a non-permissive temperature of 37°C (bottom). (B) Percentage of anucleate cells (blue bars) in WT and mukF mutant strains, complemented or not by the plasmid ppsV38::mukBEF, grown in minimal medium at 22°C with or without IPTG. Anucleate cells were identified and counted after DAPI staining. The histograms and error bars represent the means and standard deviations from at least three independent experiments. (C) Normalized Hi-C contact maps (5 kb bin resolution) obtained from a ΔmukF strain complemented with ppsV38::mukBEF after different induction times (0, 40, 120 min). Cells were grown in permissive conditions at 22°C in minimal medium. The x- and y-axes represent genomic coordinates in megabases (Mb). Dashed lines indicate the Ter position. (D) Ratio of normalized contact maps of ΔmukF ppSV38::mukBEF grown in the presence and absence of ITPG, represented in the left panel for 40 min of growth. The right panel shows the ratio of normalized contact maps for 2 hr of growth with and without ITPG. A decrease or increase in contacts in the induced condition compared with the non-induced condition is represented with a blue or red color, respectively. The black line represents a schematic chromosome, with the Ter domain highlighted in light blue. Dashed lines indicate the Ter position. (E) Quantification of the range of cis contacts of chromosomal loci along the chromosome of a WT strain grown at 22°C (green line) and of a ΔmukF derivative carrying ppsV38::mukBEF grown at 22°C under four different conditions: light blue (without ITPG), red (after 20 min of ITPG), yellow (after 40 min of ITPG), and purple (after 2 hr of ITPG). Dashed lines indicate the Ter position.
Figure 1—figure supplement 1
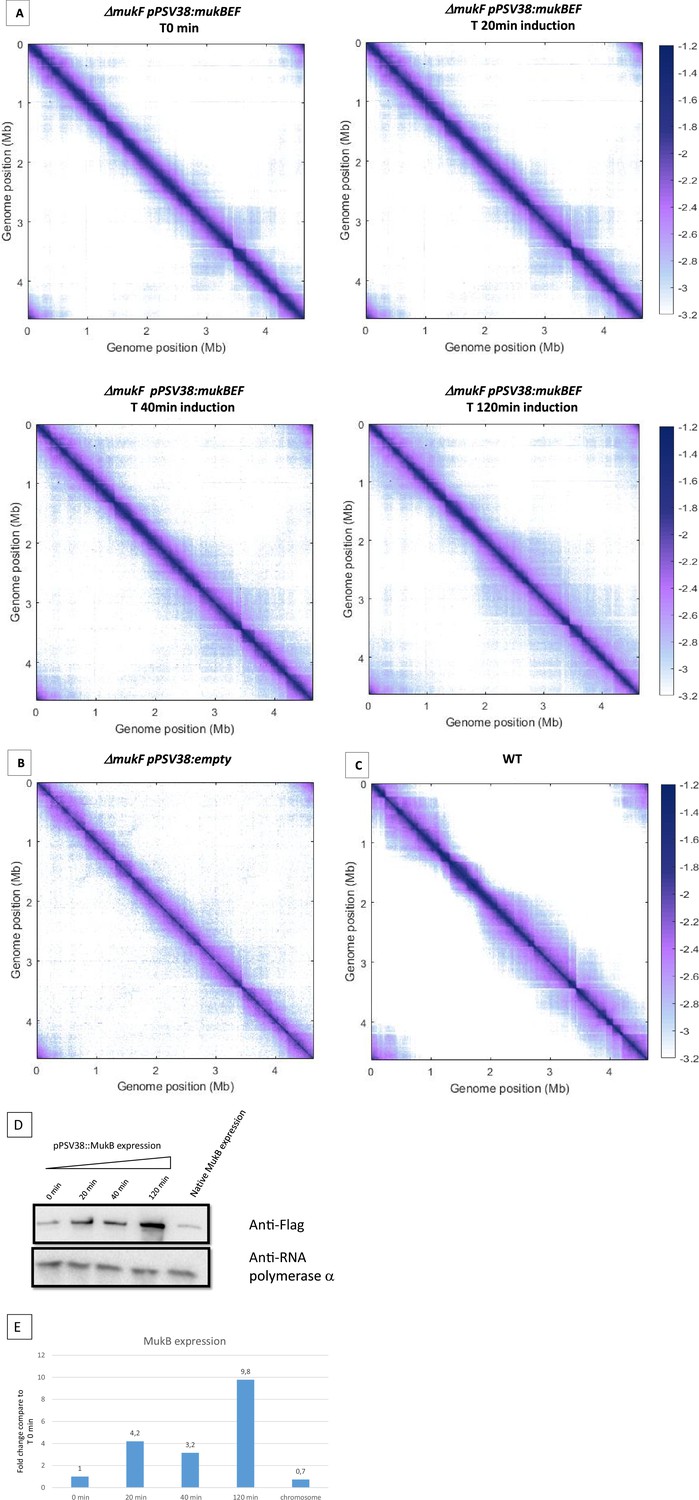
Hi-C matrix of the mukBEF-complemented strain.
(A) shows a normalized Hi-C 5 kb bin contact map of the ΔmukF pPSV38::mukBEF strain. Cells were grown in minimal medium at 22°C, and IPTG was added at 0, 20, 40, and 120 min before formaldehyde crosslinking. This figure represents an independent experiment from the one shown in Figure 1. In addition, the figure also includes representations of a ΔmukF strain with an empty plasmid (B) and a wild-type (WT) strain (C) grown under the same conditions. (D) Immunoblot analysis showing MukB-Flag accumulation in the ΔmukF pPSV38::mukFEB-Flag strain during the induction time course. IPTG was added for 0, 20, 40, and 120 min, as in Figure 1 (first four lanes on the left), before immunoblotting. The same immunoblot was conducted on exponentially growing cells expressing MukB-Flag from the natural mukBEF promoter on MM at 22°C (under the same growth conditions as in Figure 1). Loading control was performed using the quantification of the α subunit of the RNA polymerase (detected with the commercially available Biolegend antibody). Full complementation was observed in Figure 1 after 120 min of induction, corresponding to a 10-fold increase in expression. (E) Quantification of the expression level was performed using ImageJ software to estimate band intensity for each sample. The value of the anti-α RNA polymerase band was used to standardize the loading of each lane. Subsequently, the intensity of the anti-Flag band was compared to that of the T0 min sample, and the fold change was plotted on the graph.
-
Figure 1—figure supplement 1—source data 1
Original file for the Western blot analysis in Figure 1—figure supplement 1D anti-FLAG with MukB-Flag.
- https://cdn.elifesciences.org/articles/91185/elife-91185-fig1-figsupp1-data1-v2.zip
-
Figure 1—figure supplement 1—source data 2
Original file for the Western blot analysis in Figure 1—figure supplement 1D anti-α subunit of the RNA polymerase.
- https://cdn.elifesciences.org/articles/91185/elife-91185-fig1-figsupp1-data2-v2.zip
-
Figure 1—figure supplement 1—source data 3
pdf containing Figure 1—figure supplement 1C and original scans of relevant western blot analysis.
- https://cdn.elifesciences.org/articles/91185/elife-91185-fig1-figsupp1-data3-v2.zip
Figure 2 with 1 supplement
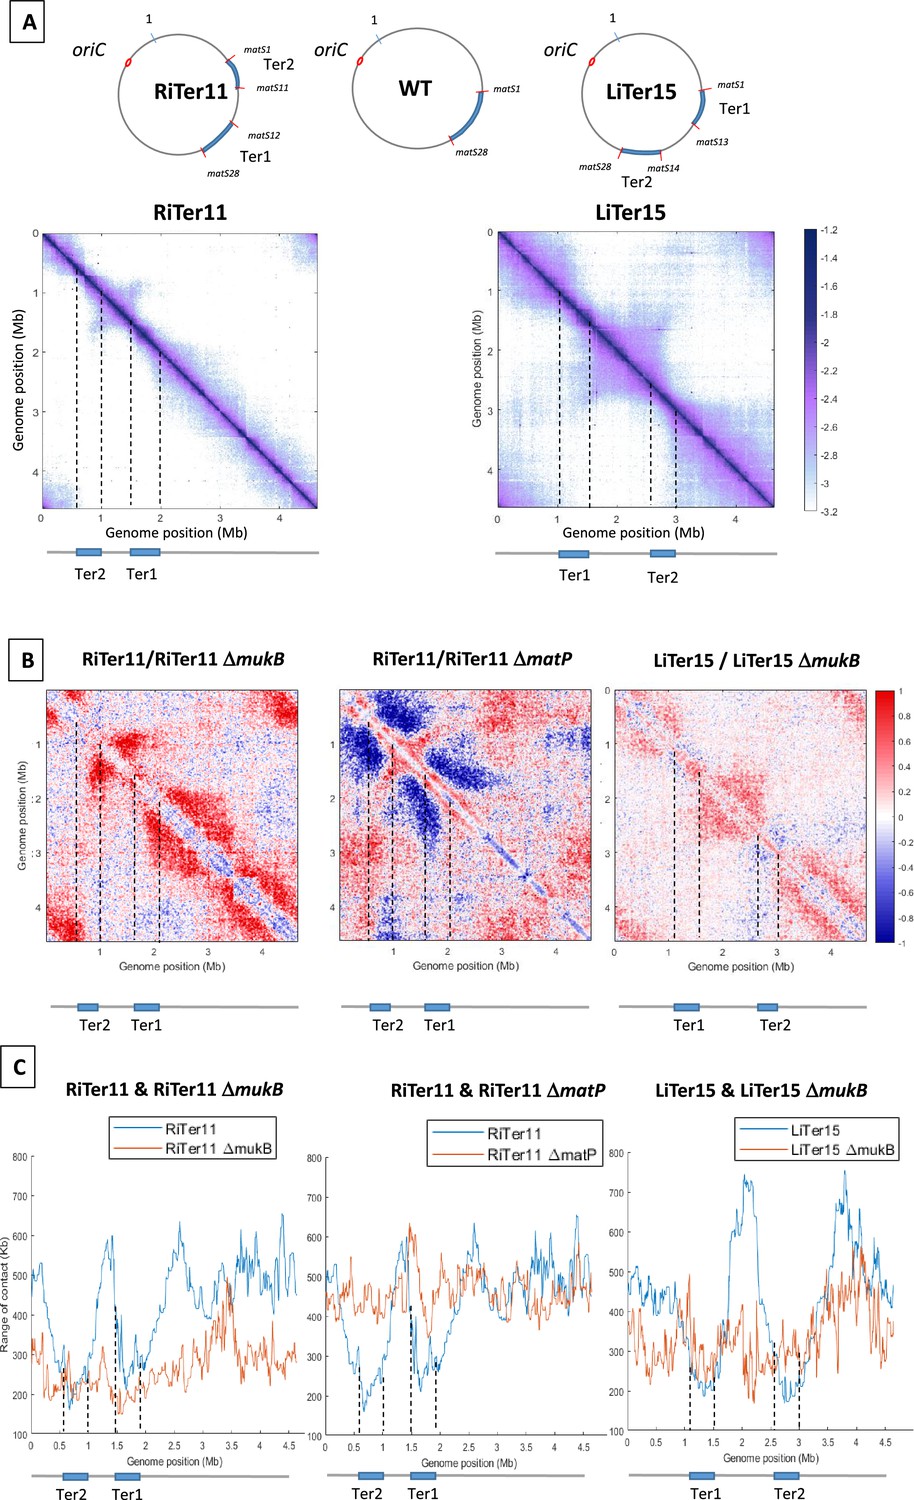
MukBEF activity initiates at different regions of the E. coli chromosome.
(A) (Left) Normalized 3C-seq 5 kb bin contact map of strain RiTer11 and (right) normalized Hi-C 5 kb bin contact map of strain LiTer15. A circular representation of the chromosome for each strain has been drawn on top of each matrix, with the Ter sequence highlighted in blue and the matS delineating each region. Below the matrices, a linear map is provided, and dashed lines indicate the positions of the two Ter sequences on each matrix. (B) Ratio of normalized contact maps of RiTer11 strain on RiTer11 ΔmukB strain (left), or RiTer11 on RiTer11 ΔmatP (middle), and LiTer15 on LiTer15 ΔmukB strain (right). A decrease or increase in contacts in the transposed cells compared to the transposed mutant cells is shown in blue or red color, respectively. Dashed lines indicate the Ter position. (C) The graph shows the quantification of the Hi-C diagonal width for loci along the chromosome of the RiTer11 strain (left panel, blue line) and the RiTer11 ΔmukB strain (left panel, red line), as well as LiTer15 (right panel, blue line) and LiTer15 ΔmukB strain (right panel, red line). Schematic representations of the two Ter segments are indicated below the graph, highlighting the fact that the range of contacts decreased on all Ter fragments. Dashed lines indicate the Ter position.
Figure 2—figure supplement 1

Schematic representation of transpositions and 3C-seq matrix of RiTer mukF, RiTermatp and LiTer15 mukF.
(A) Schematic representation of transpositions. The three att sites are integrated into the chromosome with the same orientation at the indicated position (in kb) and in the wild-type (WT) configuration. The region between the attL and attR sites is transposed to the attB position, generating the transposed strain. It should be noted that transposed strains maintain their orientation and are not reversed.The dif sequence is represented in green and the oriC in red to orient the chromosome. The distribution of matS between the two resulting Ter regions is indicated below the schematic. (B) Normalized 3C-seq 5 kb bin contact map of the RiTer muk- and RiTer matp-, and Hi-C 5 kb bin contact map of LiTer15 muk- strains growth in MM at 22°C.
Figure 3 with 3 supplements
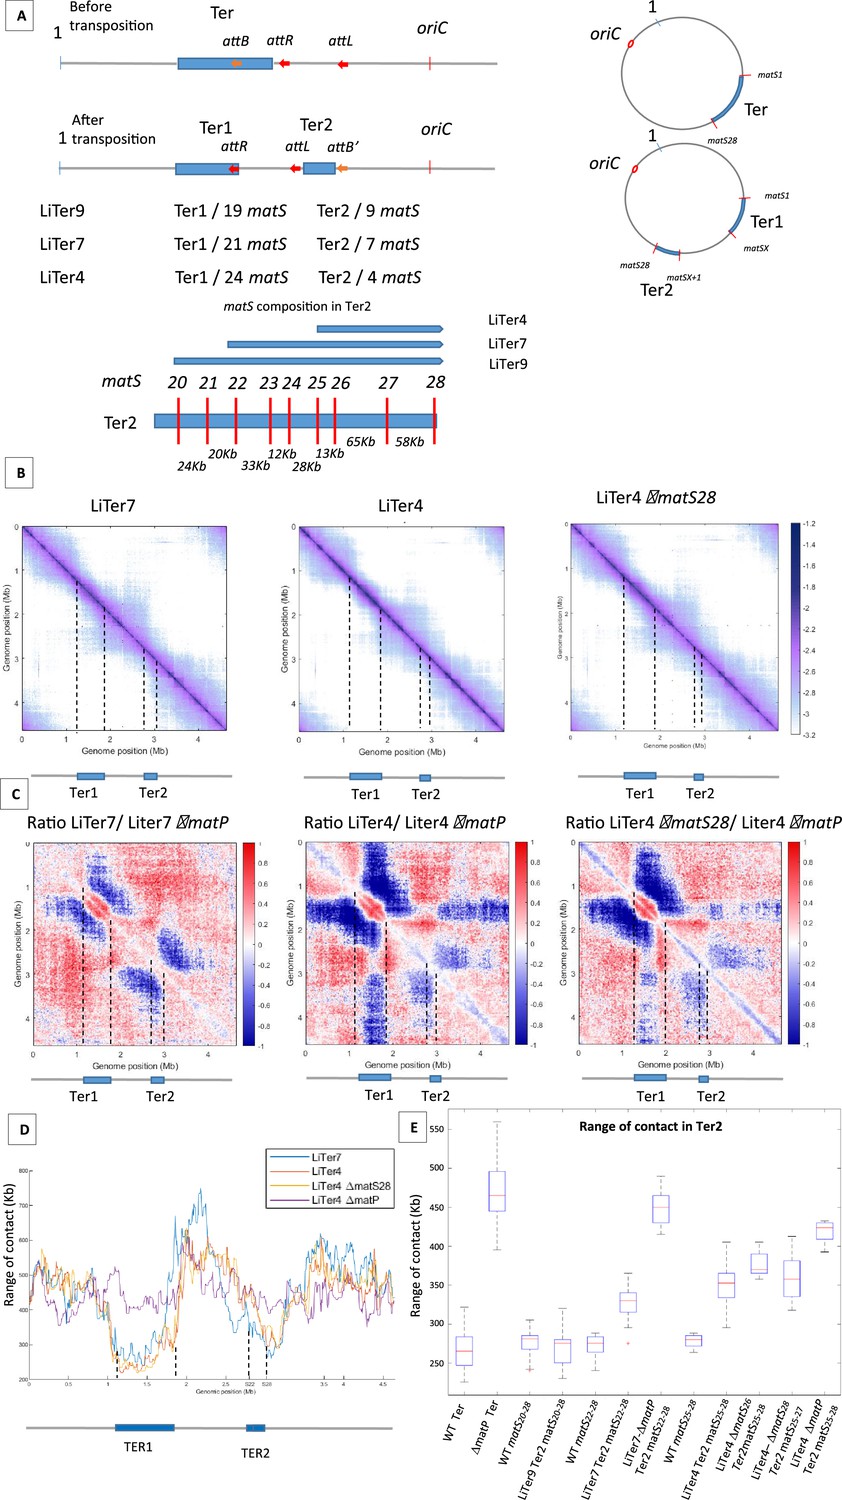
The number and distribution of matS sites have different effects on MukBEF inhibition.
(A) The figure shows a schematic representation of different transpositions with the number of matS sites located on each Ter region. The three att sites are integrated into the chromosome in the same orientation, and attL/attR are fixed positions on all LiTer transpositions. attB is inserted at different positions into the Ter allowing, upon transposition, the division of the Ter domain into two subdomains, Ter1 and Ter2, containing different numbers of matS sites. The number of matS sites is indicated for the different transpositions, and the distribution of matS on the Ter2 segment is indicated in the schematic for the three transposed strains, LiTer4, LiTer7, and LiTer9. (B) Normalized Hi-C contact map with 5 kb bin resolution of the transposed strains LiTer7, LiTer4, and LiTer4 ΔmatS28. The position of the different Ter regions is highlighted below the matrix, and by dashed lines on the matrix. (C) Ratio of normalized 5 kb bin contact maps for the different transpositions compared to the matP mutant on the same genetic organization. The position of the different Ter regions is highlighted below the ratio, and by dashed lines on the ratio. (D) Quantification of the Hi-C diagonal width for loci along the chromosome for the transposed strains LiTer7, LiTer4, the derivative mutant LiTer4ΔmatS28, and LiTer4ΔmatP. The schematic map below represents the LiTer7 configuration. The position of the different Ter regions is highlighted below the graph, and by dashed lines on the graph. (E) This panel quantifies the range of contacts in the Ter2 region or in the corresponding sequence on the wild-type (WT) configuration. Boxplot representations are used, indicating the median (horizontal bar), the 25th and 75th percentiles (open box), and the rest of the population. ‘Ter’ corresponds to the range of contacts over the entire Ter region, in the WT strain (WT Ter) or in the ΔmatP strain (ΔmatP Ter). The column WT matSX-Y corresponds to the range of contacts between the designated matS sites in the WT configuration. This portion of the Ter can be compared with the same Ter segment in the transposed strain (Ter2). Additionally, the matS20-28 segment corresponds to Ter2 in LiTer9, just as matS22-28 corresponds to Ter2 in LiTer7, and matS25-28 to Ter2 in LiTer4. The range of contacts of this segment was also measured in a ΔmatP or ΔmatS background.
Figure 3—figure supplement 1
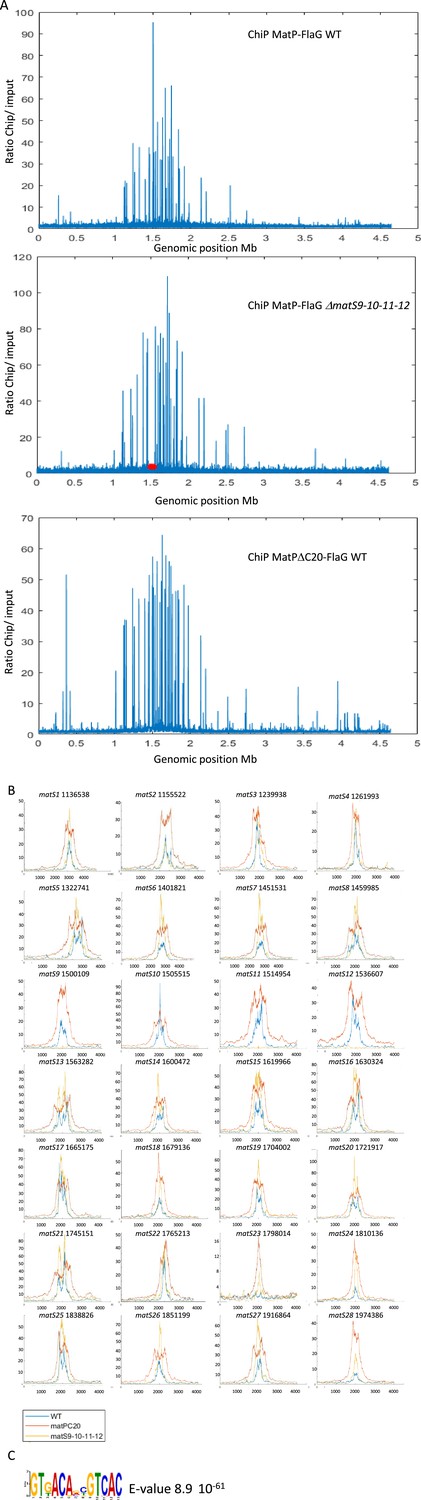
ChIP-seq analysis of MatP-Flag.
(A) Normalized ChiP-to-input ratio representation of three independent ChIP-seq. The first experiment used MatP-3XFlag in a wild-type background, the second used the same MatP-3XFlag in a genetic background where the matS sites 9-10-11-12 (red asterisks are placed at the positions of the missing matS) were deleted, and the third experiment used MatPΔC20-3XFlag in a wild-type background. The MatPΔC20 mutant is described in Dupaigne et al., 2012; Lioy et al., 2018. (B) Representation of the 28 matS ChiP signals from the three experiments. As expected, matS9-10-11-12 did not show any ChIP signals in the deleted strain. (C) Consensus sequence of MatP binding, built using the Meme suite based on the ChIP-seq sequences from the three experiments.
Figure 3—figure supplement 2
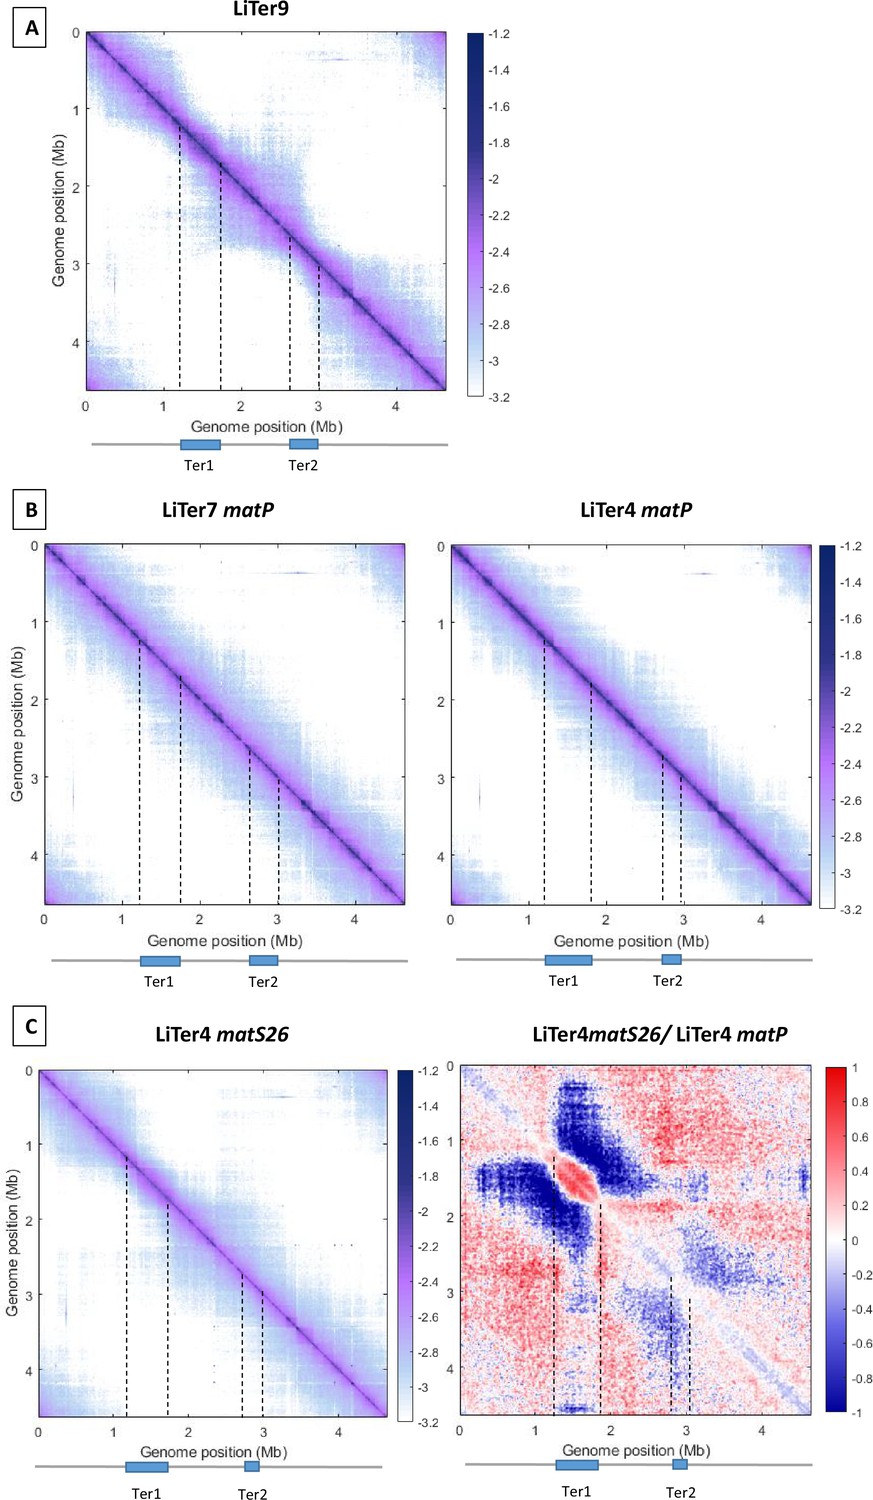
HiC matrix of transposed strain (LiTer9, LiTer7 matP, LiTer4 derivative).
(A) Normalized Hi-C 5 kb bin contact map of LiTer9 strain. The cell was cultivated at 22°C in MM. The two Ter fragments, containing 21 matS (Ter1) and 9 matS (Ter2), are highlighted in blue and with dash line on the matrix. (B) Normalized Hi-C 5 kb bin contact map of LiTer7 ΔmatP and LiTer4 ΔmatP strains, with the position of the Ter segment marked on the schematic below and with dash line on the matrix. These Hi-C matrices were used to build the ratio of the matrix in Figure 3. (C) Normalized Hi-C 5 kb bin contact map of LiTer4 Δmat26 (left) and the ratio of normalized contact maps of LiTer4 Δmat26 to LiTer4 ΔmatP (right). Dashed lines indicate the Ter position.
Figure 3—figure supplement 3

HiC matrix and analysis of MatP5A.
(A) Normalized Hi-C 5 kb bin contact map of MatP5A. The cell was cultivated at 22°C in MM. MatP5A is a substitution of the 5AA H38 to D42 by five alanine. (B) Quantification of the range of cis contacts for chromosomal loci along the chromosome in matP5A (red line), wild-type (WT) (blue line), and ΔmatP (yellow line) strains. The contact profile of the matP5A strain is similar to the WT strain, and the substitutions in matP does not trigger an increase in long-range DNA contacts in the Ter region, as would be expected for a matP deficient in inhibiting MukBEF. Dashed lines indicate the Ter position.
Figure 4 with 3 supplements
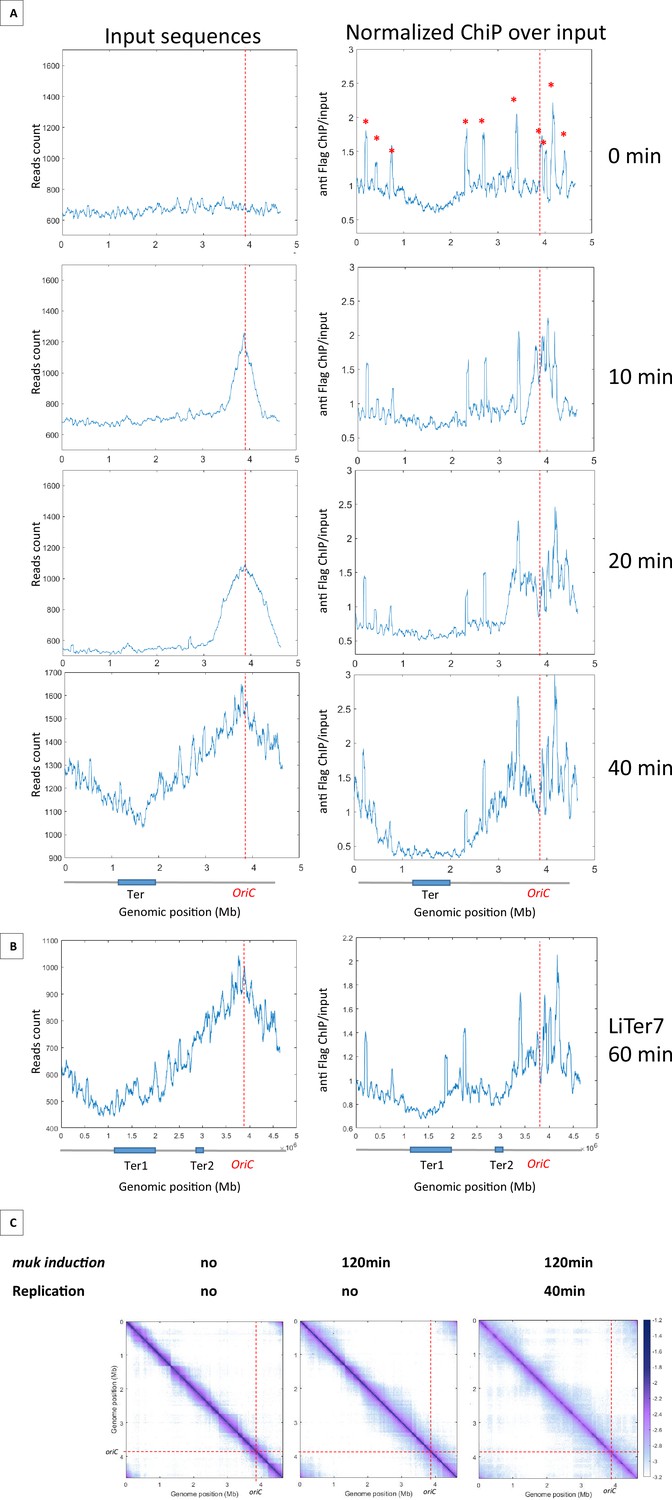
MukBEF preferentially binds in newly replicated regions and is excluded from Ter sequence.
(A) ChIP analysis of mukB-Flag dnaC2 strain. Exponentially growing cells were synchronized by incubating them at 40°C for 2 hr, followed by a shift to 30°C for 0, 10, 20, or 40 min. The replication progression was monitored by plotting the input sequence (left panel) in 50 kb bins. Normalized ChIP (ChIP over input) values for 50 kb bins are presented in the right panel, with the red asterisk indicating the peak observed in all E. coli ChIP-seq experiments. The positions of oriC and Ter are highlighted with a red dashed line and on the chromosome schematic below the figure. To rule out the hypothesis of non-specific antibody binding dependent on replication, we conducted a ChIP experiment without tags in synchronized cells and did not detect enrichment comparable to what is observed here (Figure 4—figure supplement 1). (B) ChIP analysis was conducted on the LiTer7 mukB-Flag dnaC2 strain. We observed that replication restart in this transposed strain exhibited a 20 min lag. Therefore, cells in replication stop state were shifted to 30°C for 60 min to achieve a comparable replication progression to the 40 min wild-type (WT) strain, as shown by the plotting of the input sequence (left panel). MukB enrichment generally followed the replication progression, except in the two Ter regions, as shown in the MukB normalized ChIP (right panel). (C) Normalized Hi-C 5 kb bin contact map of ΔmukF pPSV38::mukBEF dnaC2 strain. Exponential cells were incubated at 40°C for 2 hr to prevent replication initiation (non-replicating condition) and were then shifted to 30°C for 40 min (right panel). MukBEF induction was performed by adding IPTG to the media for 2 hr. Quantification of long-range DNA contacts is shown in Figure 4—figure supplement 3. Red dashed lines indicate the oriC position.
Figure 4—figure supplement 1
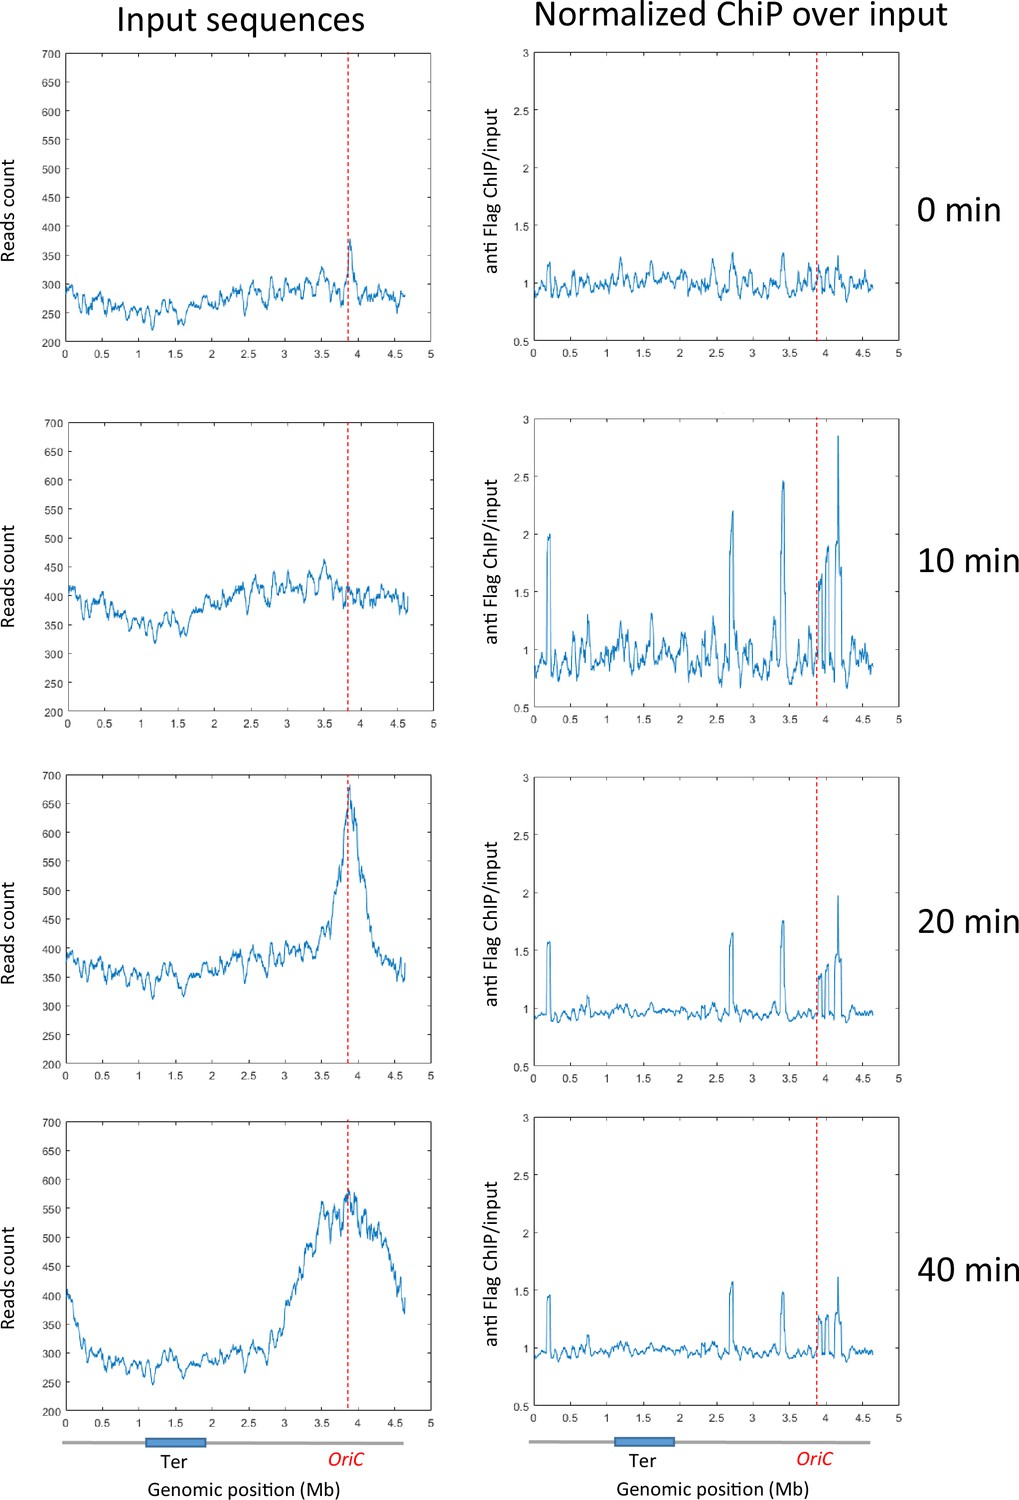
ChIP analysis of a dnaC2 strain without the Flag tag.
Exponentially growing cells were synchronized by incubating them at 40°C for 2 hr, followed by a shift to 30°C for 0, 10, 20, or 40 min. Cell extracts were treated for a regular ChIP procedure and incubated with anti-Flag antibodies. Replication progression was monitored by plotting the input sequence (left panel) in 50 kb bins. Normalized ChIP values (ChIP over input) for 50 kb bins are presented in the right panel. The positions of oriC and Ter are highlighted with red dashed lines, as shown on the chromosome schematic below the figure.
Figure 4—figure supplement 2
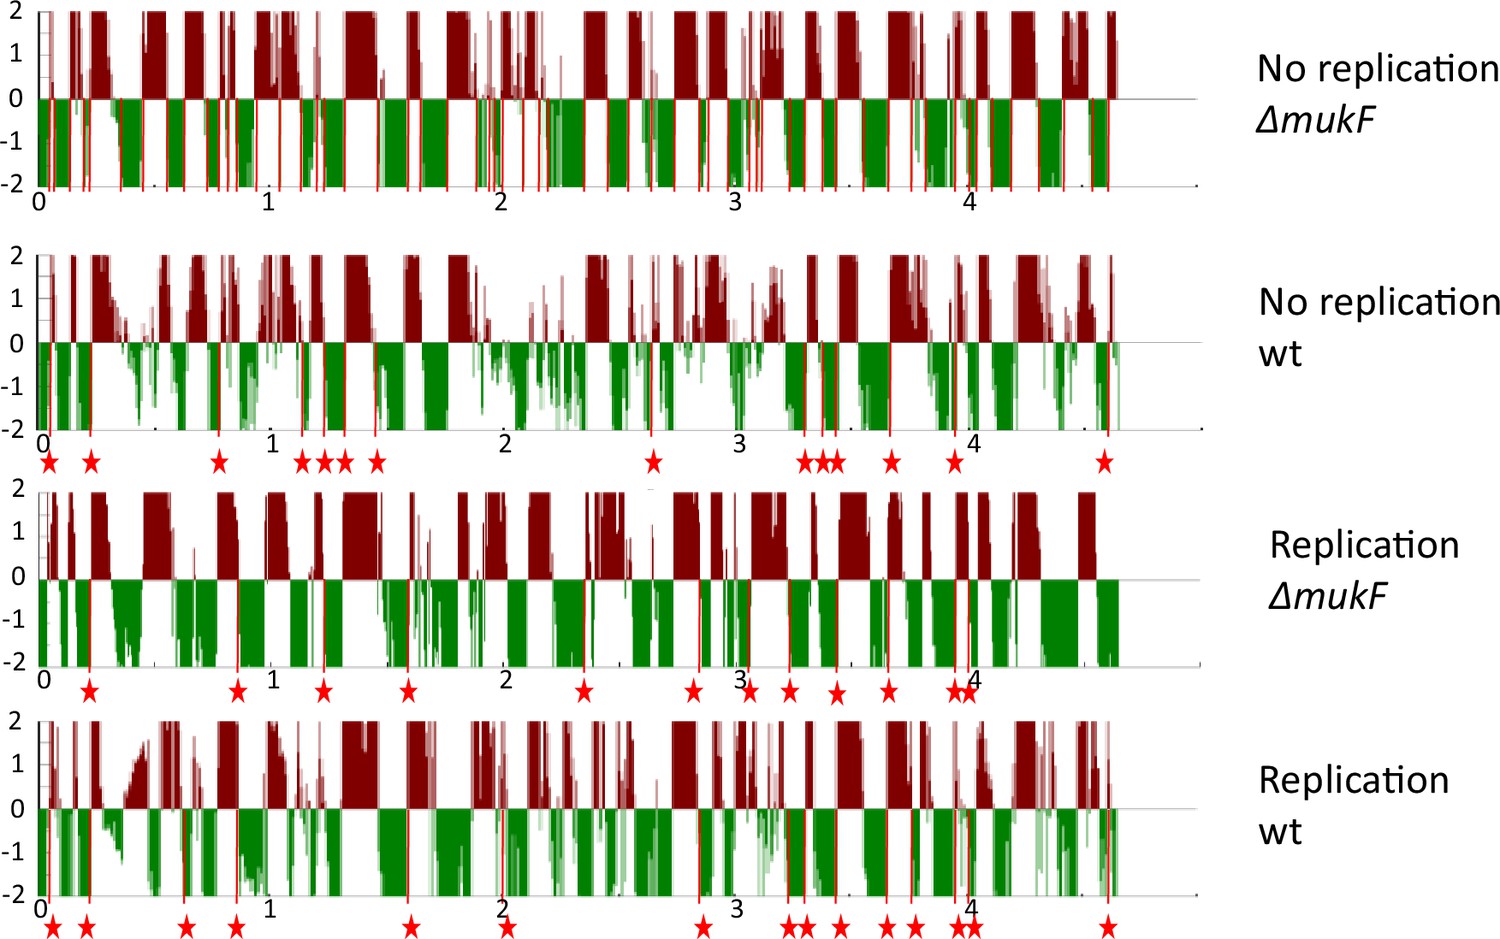
Domain boundaries were characterized for each condition using a DI (directionality index) analysis performed at a scale of 100 kb.
Downstream (red) and upstream (green) biases are indicated. Significant DI boundaries defining chromosomal-interacting domains (CIDs) (Le et al., 2013) are represented with red marks under the condition where replication was absent in the ΔmukF strain (ΔmukF no replication), as shown in the top panel. Boundaries that are similar to those identified in the ΔmukF no replication condition are annotated with a star symbol.
Figure 4—figure supplement 3
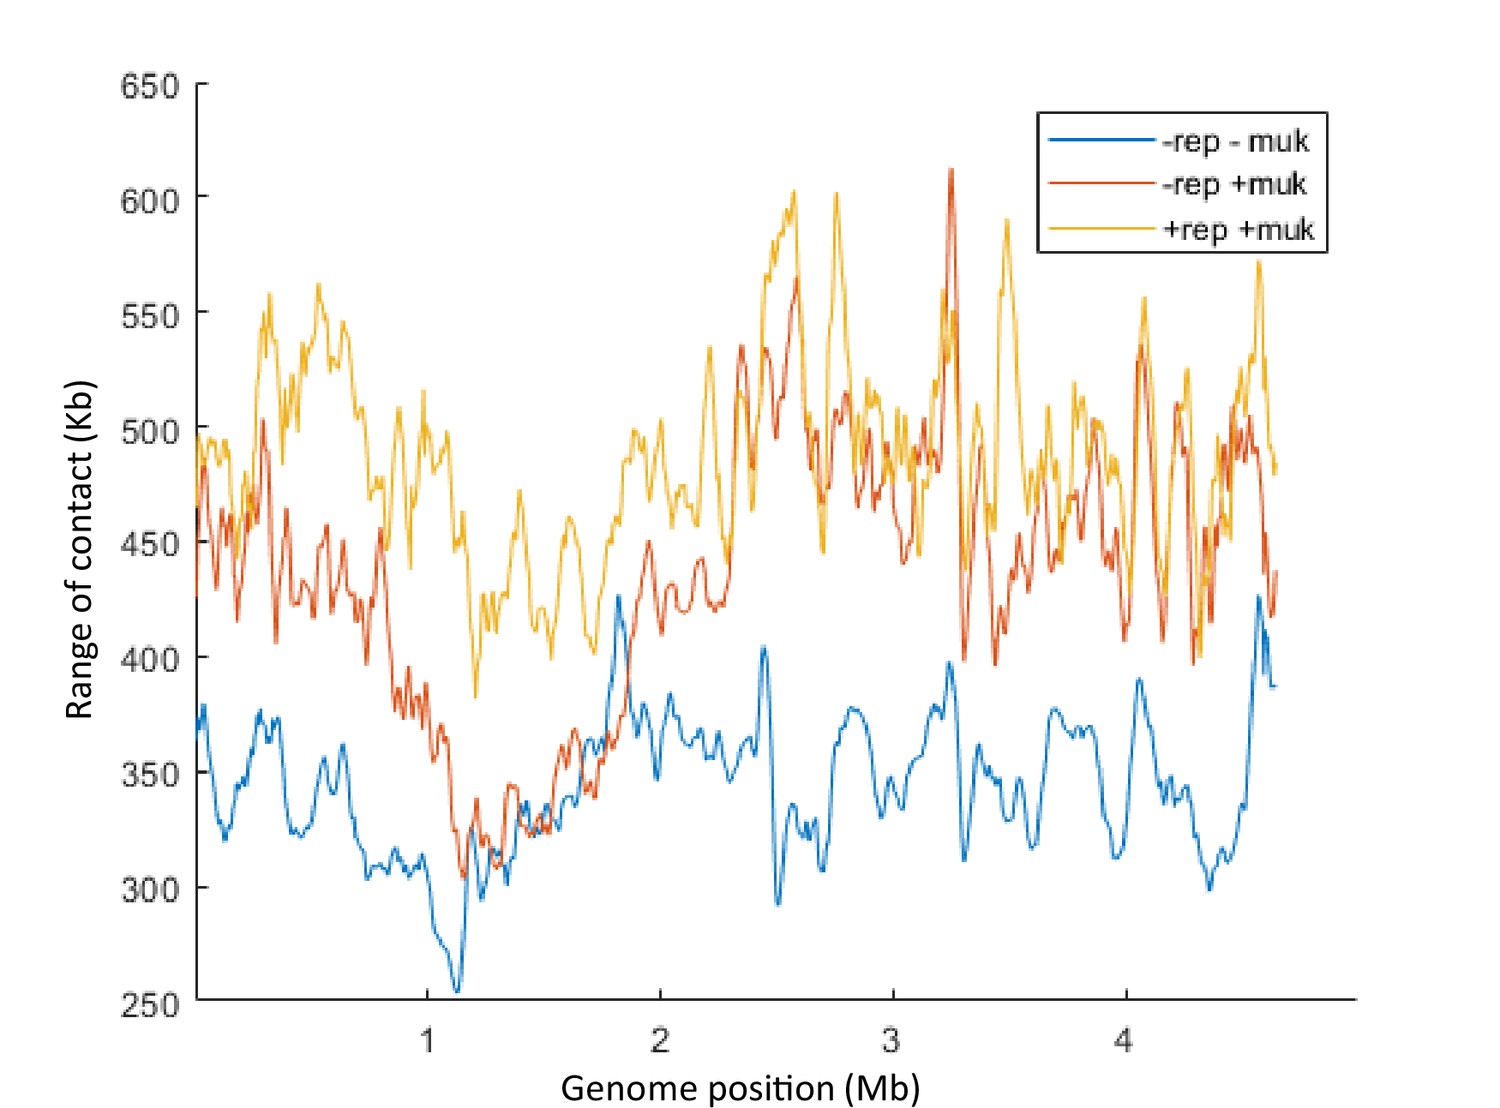
Quantification of the range of cis contacts for chromosomal loci along the chromosome in the dnaC2 ΔmukF pPSV38::mukBEF strain after 2 hr at 40°C without IPTG (-rep -muk, blue line), with IPTG (-rep +muk, red line), or with IPTG followed by a transfer for 40 min at 30°C (+rep +muk, yellow line).
Figure 5 with 1 supplement
Distribution of matS sites culminates at dif across γ-proteobacteria.
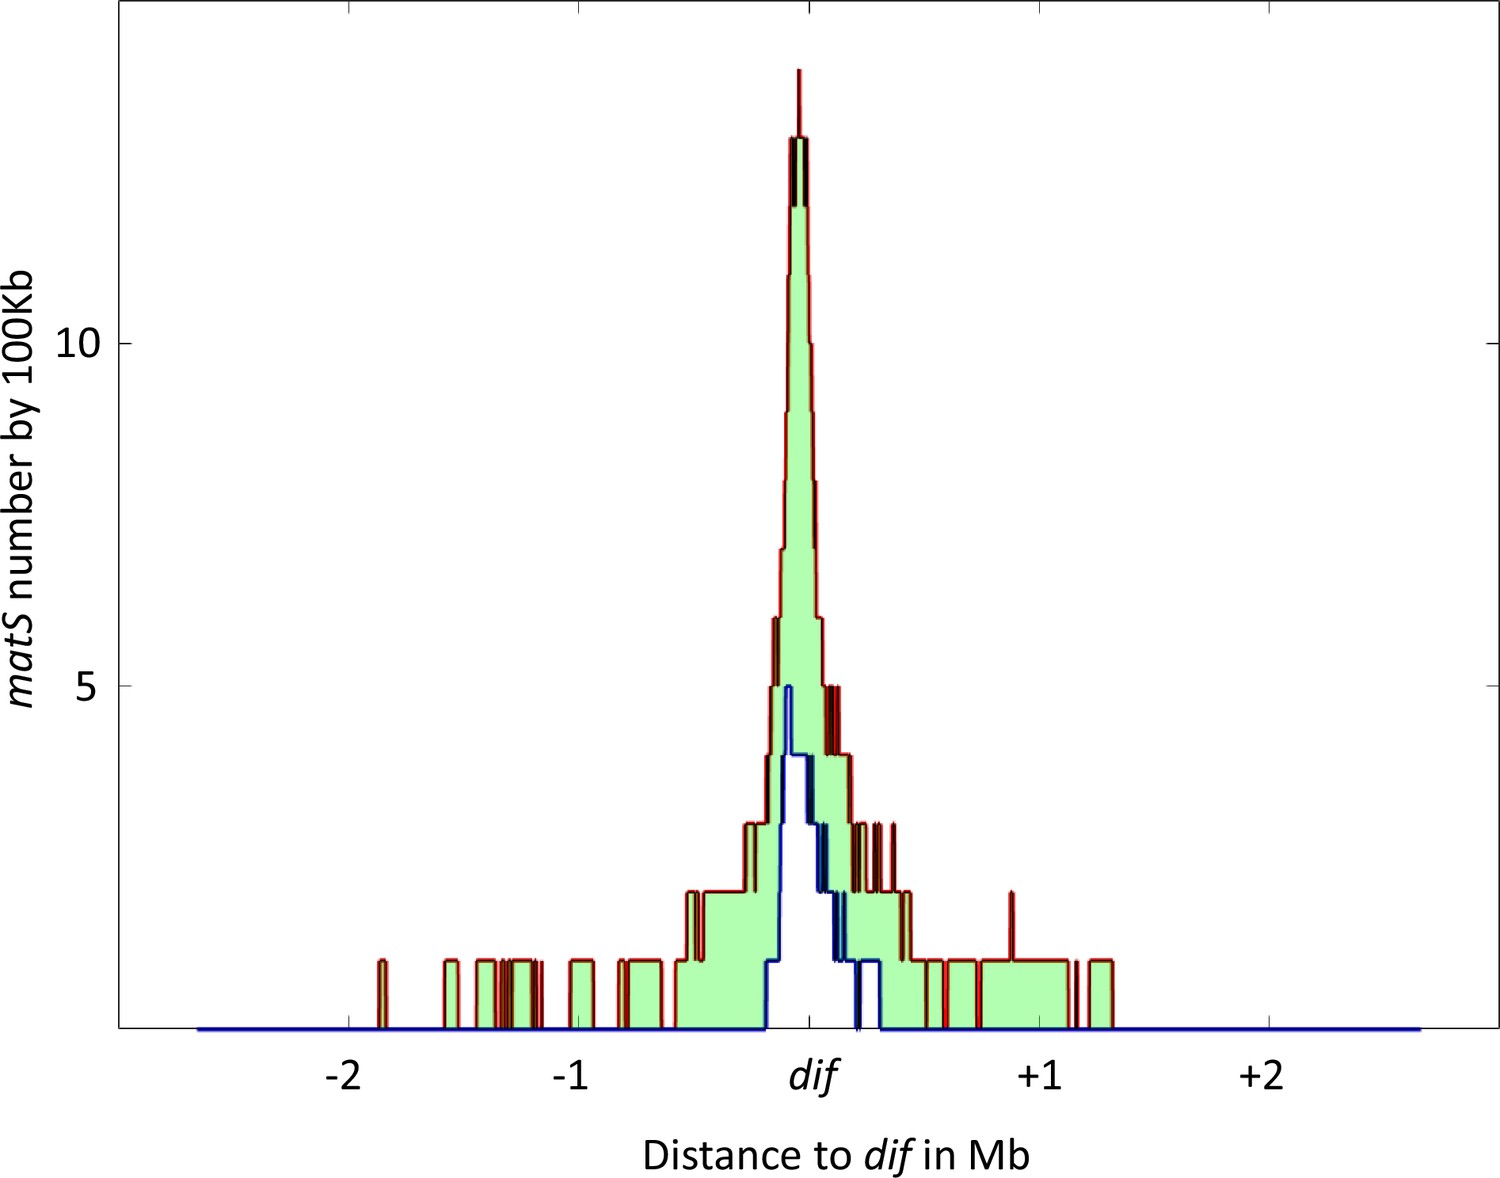
The density of matS sequences over a 100 kb unit region was measured in 16 γ-proteobacteria, and the resulting distribution is plotted in the figure. The red line represents the 75th percentile of this distribution, while the blue line represents the 25th percentile. The light green area between these two lines represents the 50% of values closest to the median. The distribution is centered on the dif site, and the x-axis represents the genomic distance in megabases (Mb) from dif, while the y-axis represents the number of matS sequences per 100 kilobases (kb).
Figure 5—figure supplement 1
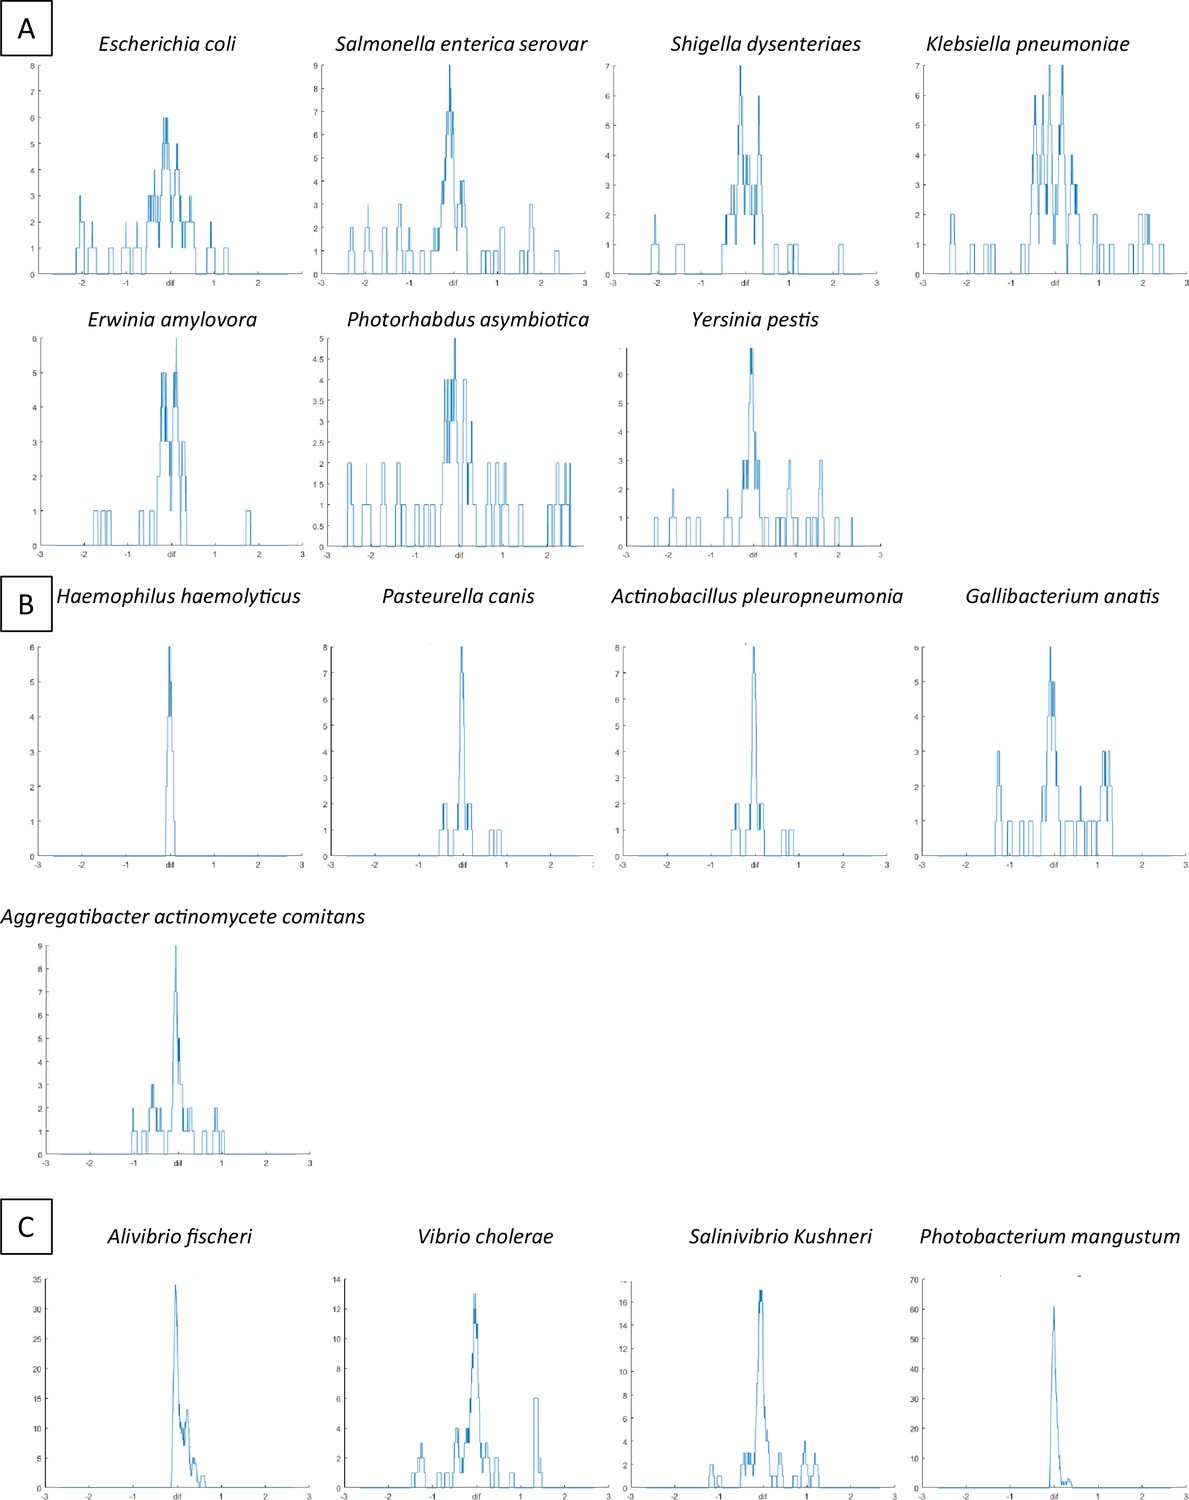
Representation of matS density.
The y-axis represents the number of matS sites per 100 kb, while the x-axis represents the position on the chromosome in Mb centered on the dif sequence. In panel A, data is shown for seven species belonging to the enterobacterales group, in panel B, data is shown for five species belonging to the pasteurellales group (fewer matS sequences were identified in the pasteurellales genomes, indicating a potential divergence of matS sequences within this group of bacteria), and in panel C, data is shown for four species belonging to the vibrionales group. For Vibrio cholerae and Salinivibrio kushneri, only chromosome 1 was included in the analysis.
Author response image 1

Range of interactions measured on the interval matS12-matS18 in different genetic contexts and different configurations (MG1655 WT(1 and 2), ∆mukB, RiTer, RiTer ∆mukB).
Tables
Table 1
Identification of matS sequence and Ter domain over Gammaproteobacteria.
| Ter size* (Kb) | matS in the ter† | Chromsomosome size (Kb) | matS mean by 100 Kb of Ter ‡ | Size Ter/size chromosome § (%) | |
|---|---|---|---|---|---|
| Enterobacterals | |||||
| Escherichia coli | 1037 | 31 | 4641 | 3 | 22 |
| Salmonella enterica serovar | 722 | 27 | 4822 | 3.7 | 15 |
| Shigella dysenteriae | 834 | 25 | 4560 | 3 | 18 |
| Klebsiella pneumoniae | 769 | 60 | 5317 | 7.8 | 14 |
| Erwinia amylovora | 435 | 19 | 3833 | 4.4 | 11 |
| Photorhabdus asymbiotica | 312 | 11 | 5064 | 3.5 | 6 |
| Pectobacterium carotovorum | 346 | 39 | 4886 | 11.3 | 7 |
| Yersinia pestis | 446 | 18 | 4658 | 4 | 10 |
| Pasteurellales | |||||
| Haemophilus haemolyticus | 111 | 6 | 1941 | 5.4 | 6 |
| Pasteurella canis | 332 | 11 | 2344 | 3.3 | 14 |
| Actinobacillus pleuropneumoniae | 506 | 15 | 2391 | 3 | 21 |
| Gallibacterium anatis | 350 | 6 | 2694 | 1.7 | 13 |
| Aggregatibacter actinomycetemcomitans | 506 | 15 | 2105 | 3 | 24 |
| Vibrionales | |||||
| Aliivibrio fischeri | 526 | 66 | 4343 | 12.5 | 12 |
| Photobacterium angustum | 409 | 77 | 4885 | 18.8 | 8 |
| Vibrio cholerae chr1 | 750 | 34 | 2961 | 4.5 | 25 |
| Vibrio cholerae chr2 | 452 | 14 | 1072 | 3.1 | 42 |
| Salinivibrio kushneri chr1 | 613 | 37 | 2840 | 6 | 22 |
| Salinivibrio kushneri Chr2 | 314 | 20 | 602 | 6.4 | 52 |
-
*
Ter size in kilobases. Ter is defined as the longest stretch of DNA containing matS flanked by two regions of 100 kilobases devoid of matS sites.
-
†
Number of matS sites identified in the Ter region using the MEME Suite and based on the matS consensus sequence (see Figure 3—figure supplement 1).
-
‡
matS density inside the Ter region calculated as the number of matS sites divided by the size of the Ter region.
-
§
Proportion of the Ter region compared to the entire chromosome, expressed as a percentage.
Additional files
-
Supplementary file 1
Table of strains.
- https://cdn.elifesciences.org/articles/91185/elife-91185-supp1-v2.docx
-
MDAR checklist
- https://cdn.elifesciences.org/articles/91185/elife-91185-mdarchecklist1-v2.docx
Download links
A two-part list of links to download the article, or parts of the article, in various formats.
Downloads (link to download the article as PDF)
Open citations (links to open the citations from this article in various online reference manager services)
Cite this article (links to download the citations from this article in formats compatible with various reference manager tools)
Activity of MukBEF for chromosome management in E. coli and its inhibition by MatP
eLife 12:RP91185.
https://doi.org/10.7554/eLife.91185.3


