Biobank-wide association scan identifies risk factors for late-onset Alzheimer’s disease and endophenotypes
- University of Wisconsin-Madison, United States
- Department of Statistics, University of Wisconsin-Madison, United States
- Department of Population Health Sciences, University of Wisconsin-Madison, United States
- Division of General Internal Medicine, Department of Medicine, University of Washington, United States
- University of Miami Miller School of Medicine, United States
- Vanderbilt Memory and Alzheimer’s Center, Vanderbilt University Medical Center, Vanderbilt University School of Medicine, United States
- School of Medicine, University of Pennsylvania, United States
- Wisconsin Alzheimer’s Institute, University of Wisconsin School of Medicine and Public Health, United States
- Geriatric Research Education and Clinical Center, Wm. S. Middleton Memorial VA Hospital, United States
- Alzheimer’s Disease Research Center, University of Wisconsin School of Medicine and Public Health, United States
- Department of Psychiatry, Washington University in St. Louis, United States
- Department of Biostatistics and Medical Informatics, University of Wisconsin-Madison, United States
Figures
Figure 1 with 1 supplement
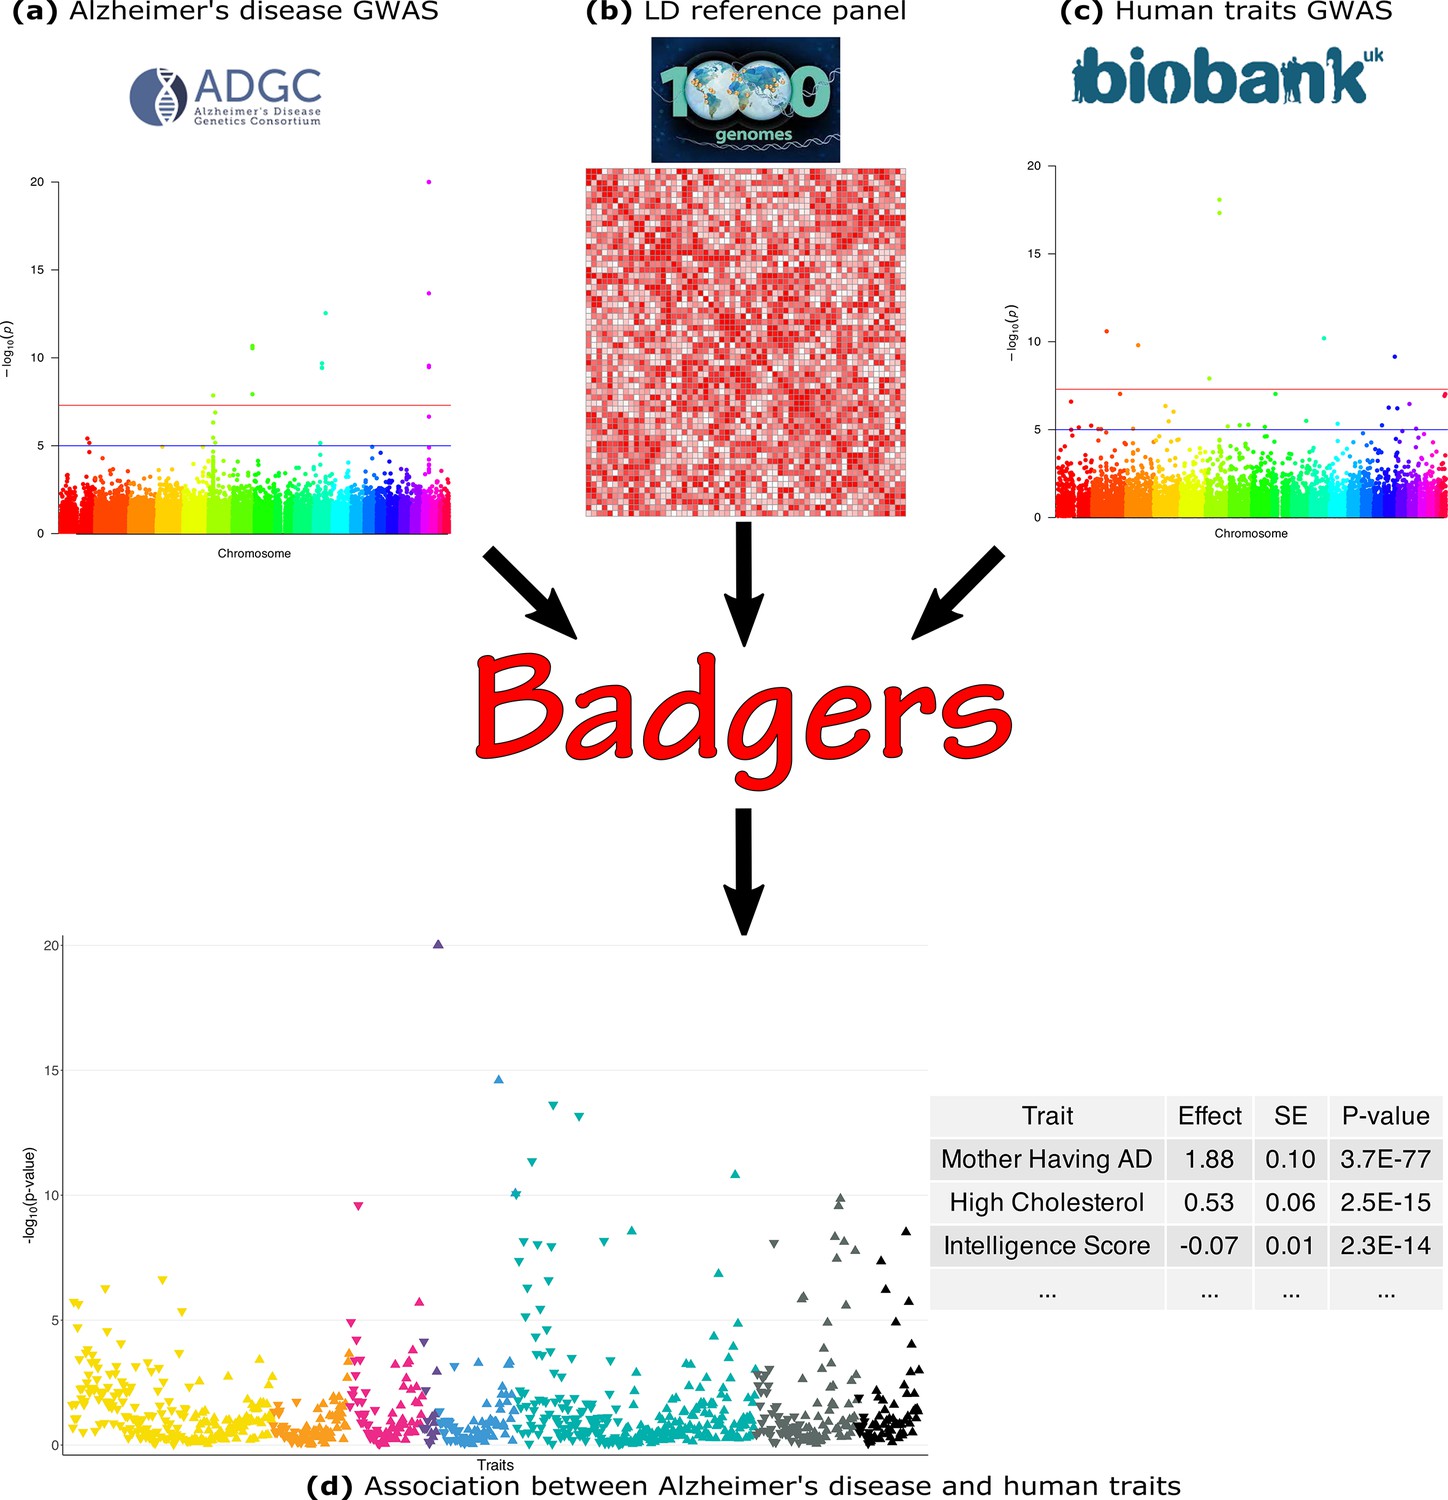
Biobank-wide Association Discovery using GEnetic Risk Scores (BADGERS) Workflow.
BADGERS takes (a) Alzheimer’s disease genome-wide association studies (GWAS), (b) linkage disequilibrium (LD) reference panel, and (c) Human traits GWAS from the UK biobank as input. The generated result will be the (d) Association between Alzheimer’s disease and human traits. In graph (d), each triangle represents one human trait, and different colors represent different trait categories.
Figure 1—figure supplement 1
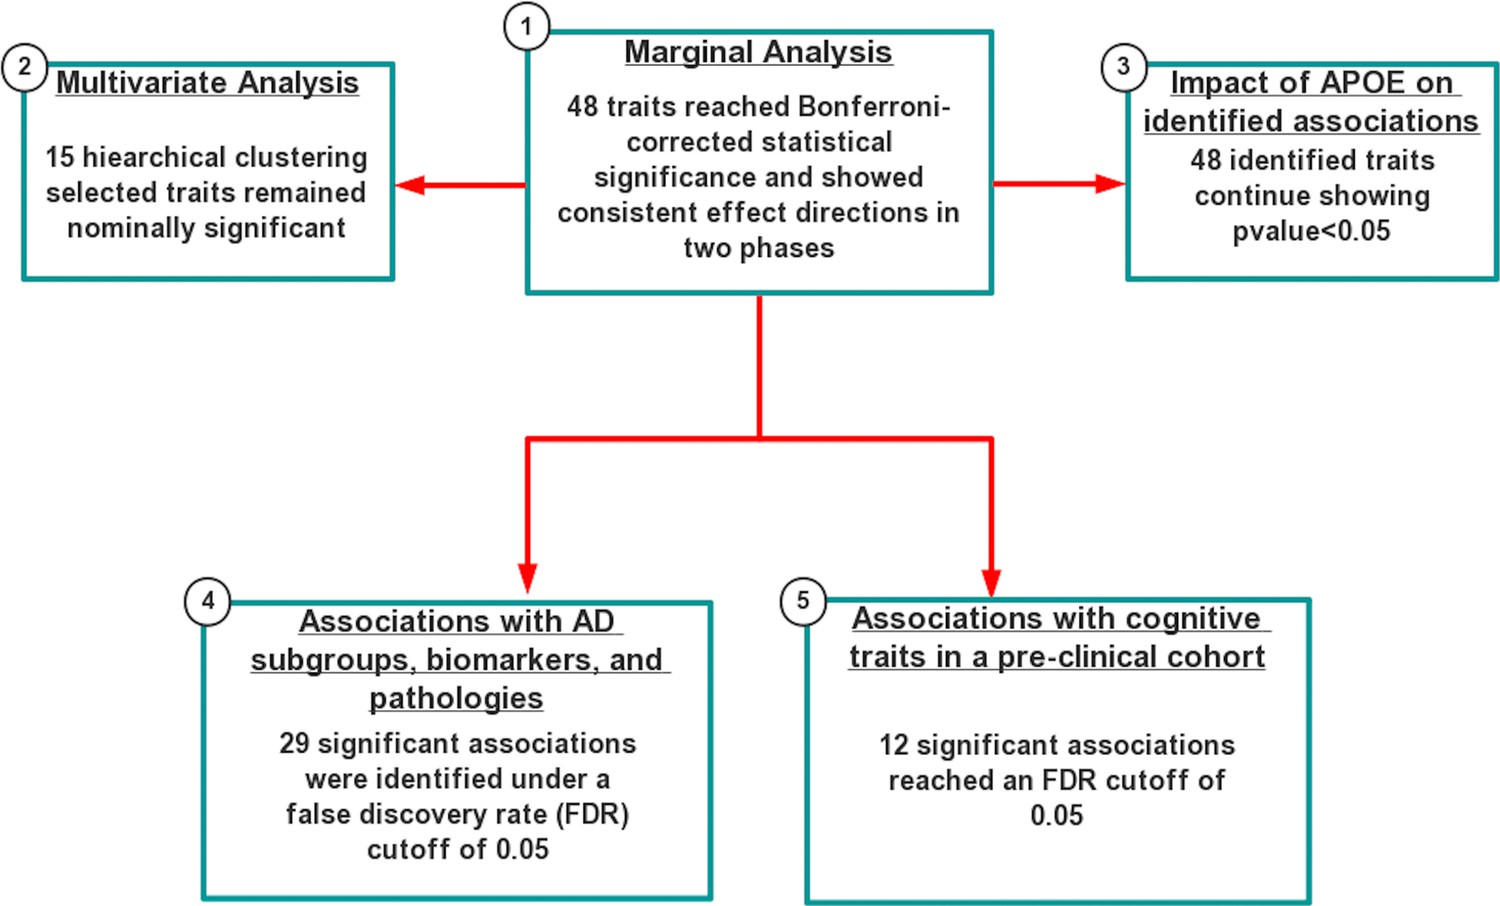
A flowchart for analyses of Alzheimer’s genetic data.
Figure 2 with 4 supplements
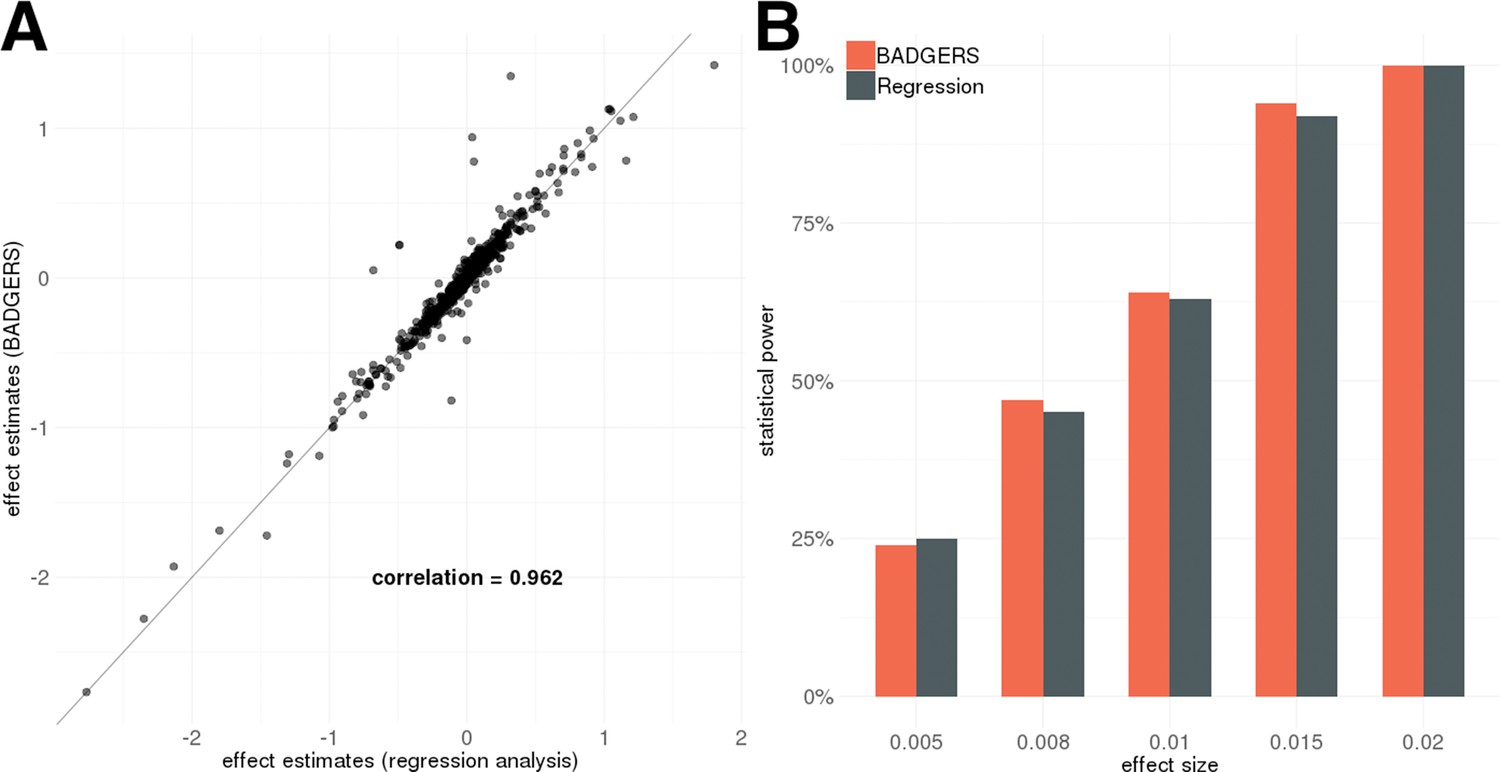
Simulation results.
Biobank-wide Association Discovery using GEnetic Risk Scores (BADGERS) and regression analysis based on individual-level data showed (A) highly consistent effect size estimates for 1738 polygenic risk scores (PRS) in simulation and (B) comparable statistical power (setting 3).
Figure 2—figure supplement 1
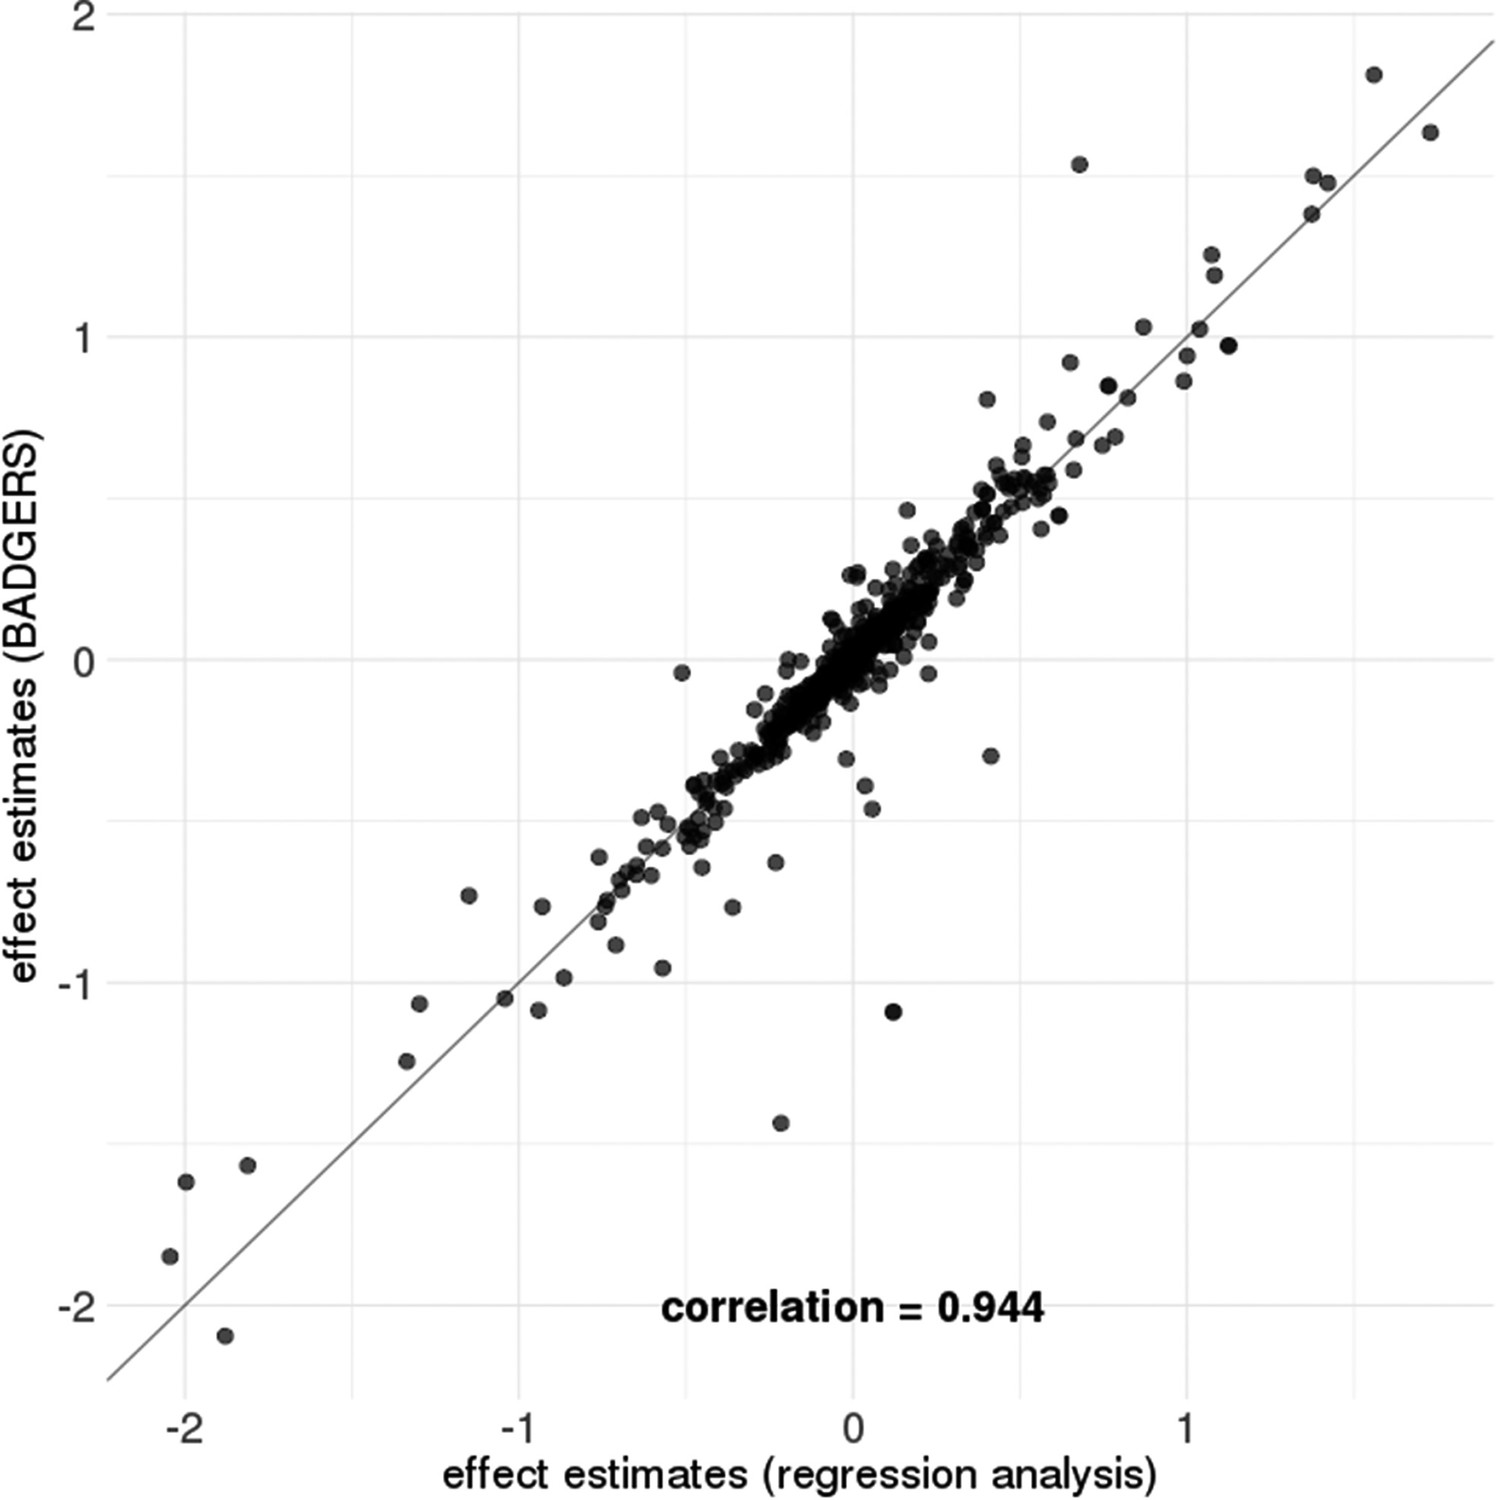
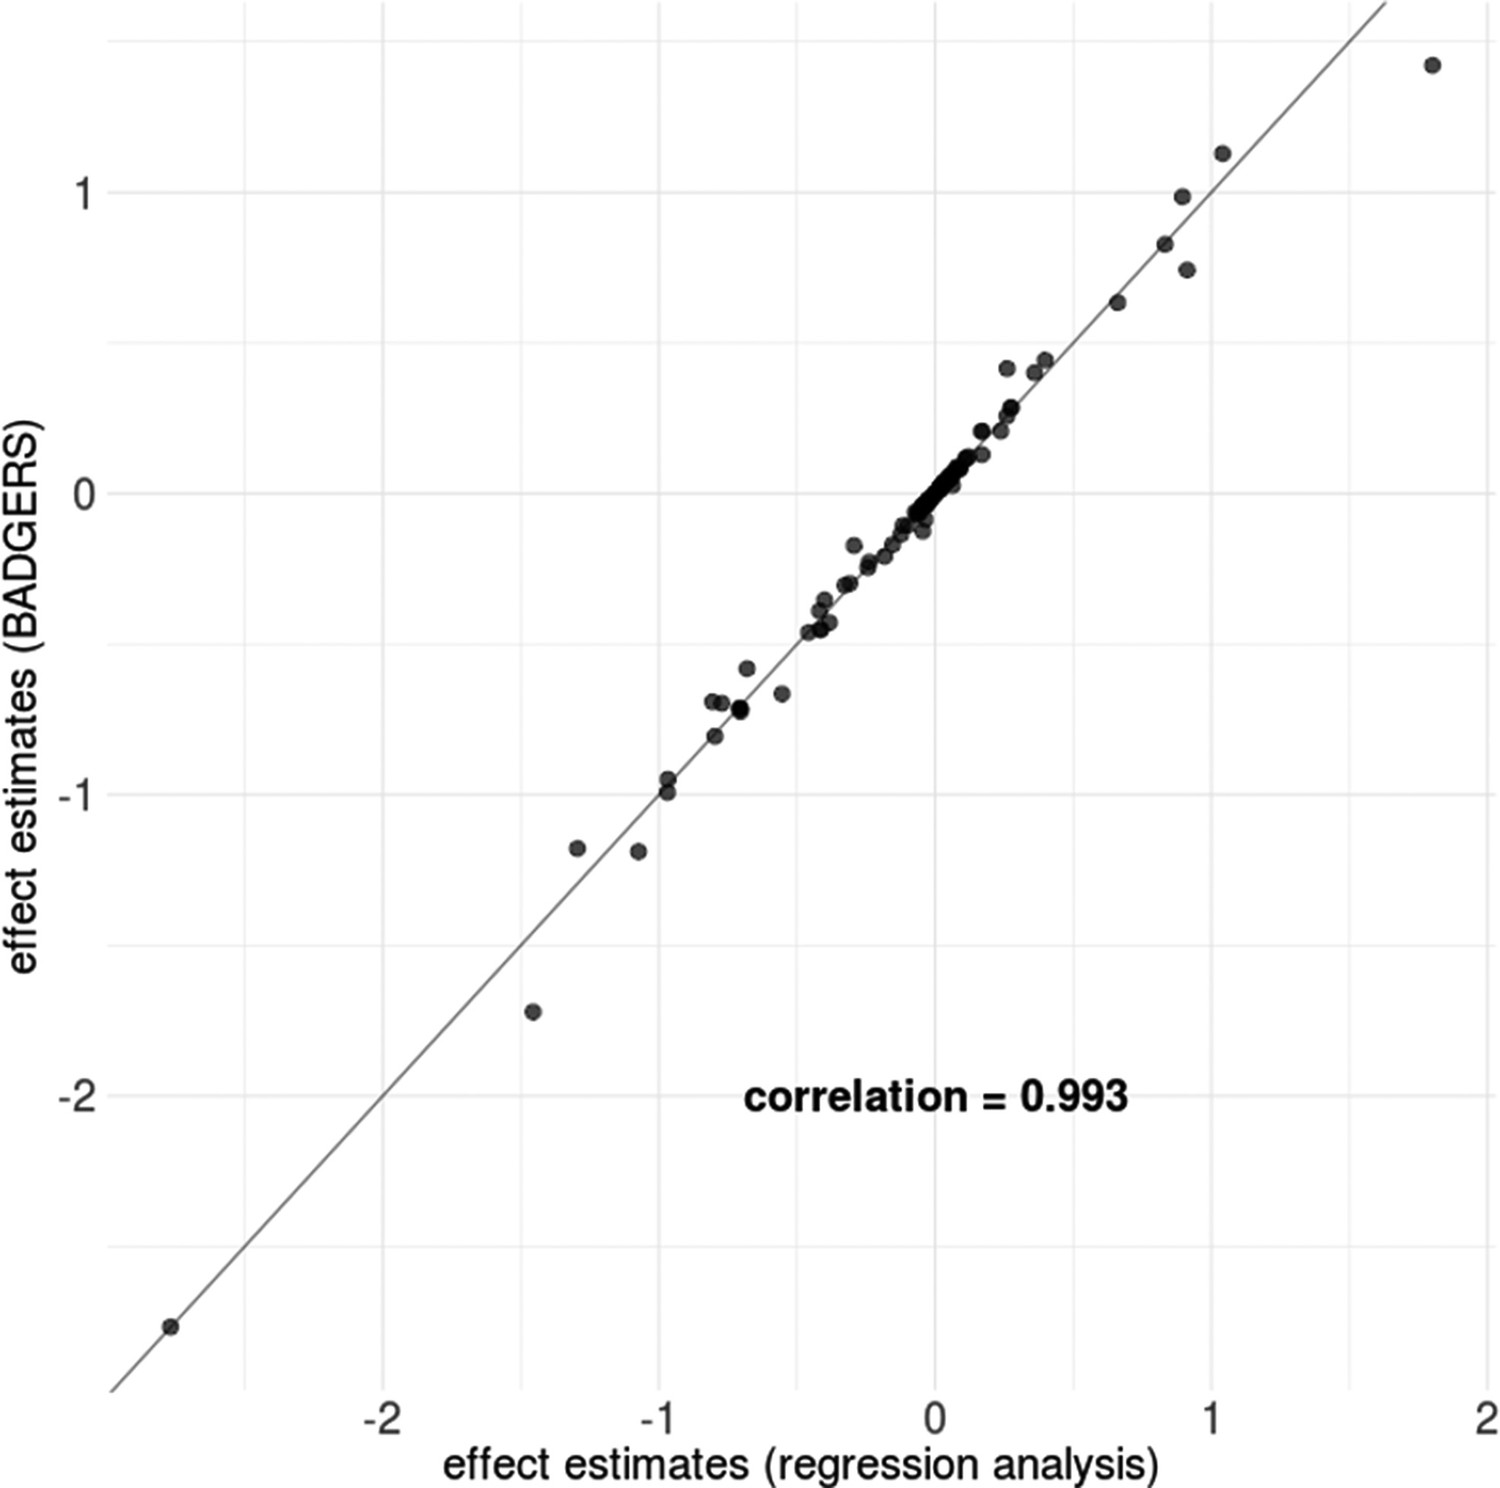
Comparison of effect size estimates from Biobank-wide Association Discovery using GEnetic Risk Scores (BADGERS) and regression analysis based on individual-level data.
BADGERS and regression analysis showed highly consistent effect size estimates for 1738 polygenic risk scores (PRS) in simulation setting 2.
Figure 2—figure supplement 2
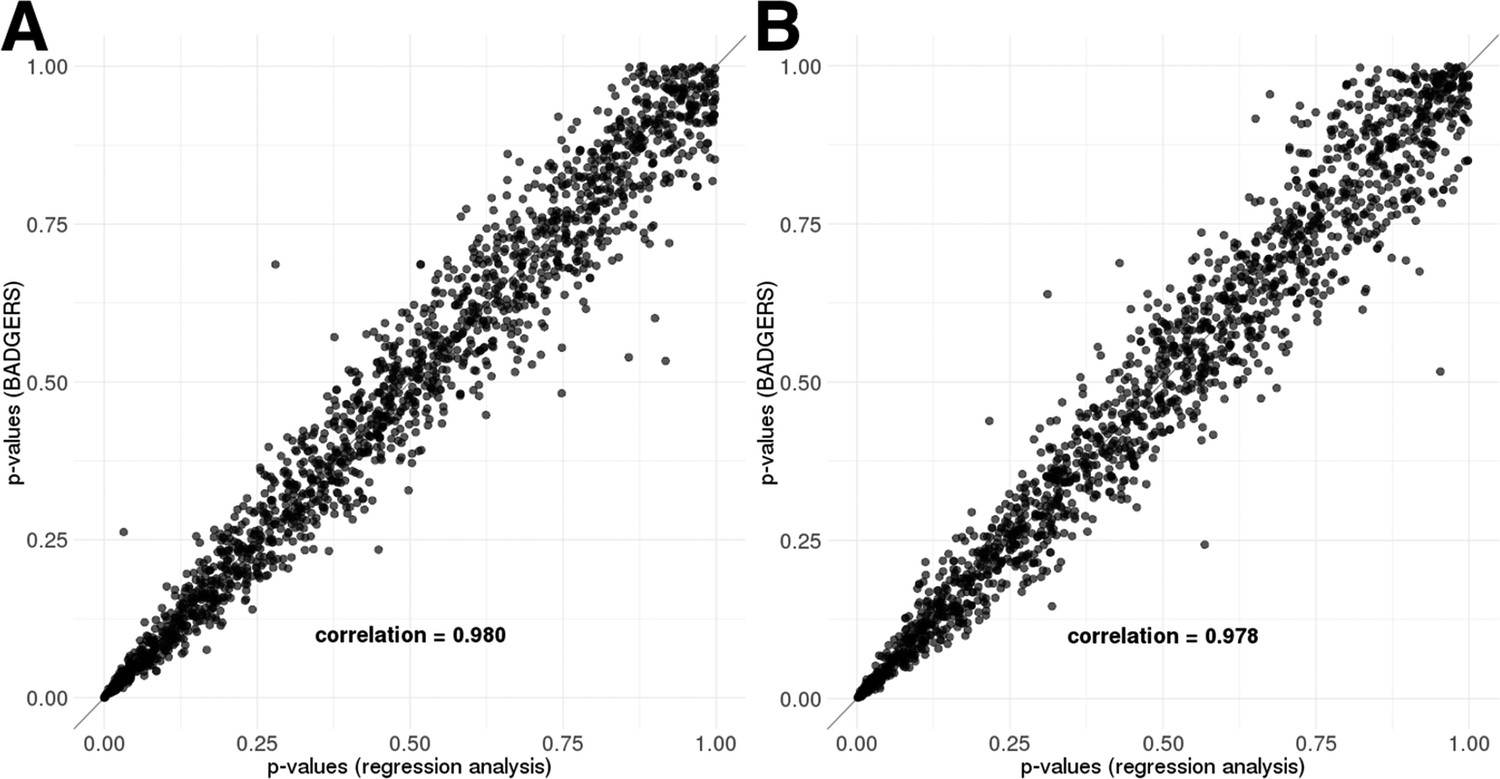
Comparison of p-values from Biobank-wide Association Discovery using GEnetic Risk Scores (BADGERS) and regression analysis based on individual-level data.
BADGERS and regression analysis provided highly consistent p-value results for 1738 polygenic risk scores (PRS) in simulation (A) setting 1 and (B) setting 2.
Figure 2—figure supplement 3
Comparison of effect size estimates from Biobank-wide Association Discovery using GEnetic Risk Scores (BADGERS) and regression analysis based on individual-level data when p-values are smaller than 0.05.
The effect size between two algorithms is highly consistent.
Figure 2—figure supplement 4

Biobank-wide Association Discovery using GEnetic Risk Scores (BADGERS) estimates using marginal polygenic risk scores (PRS) and joint PRS.
Both methods showed consistent effect size estimates with true effect size in simulation.
Figure 3 with 2 supplements
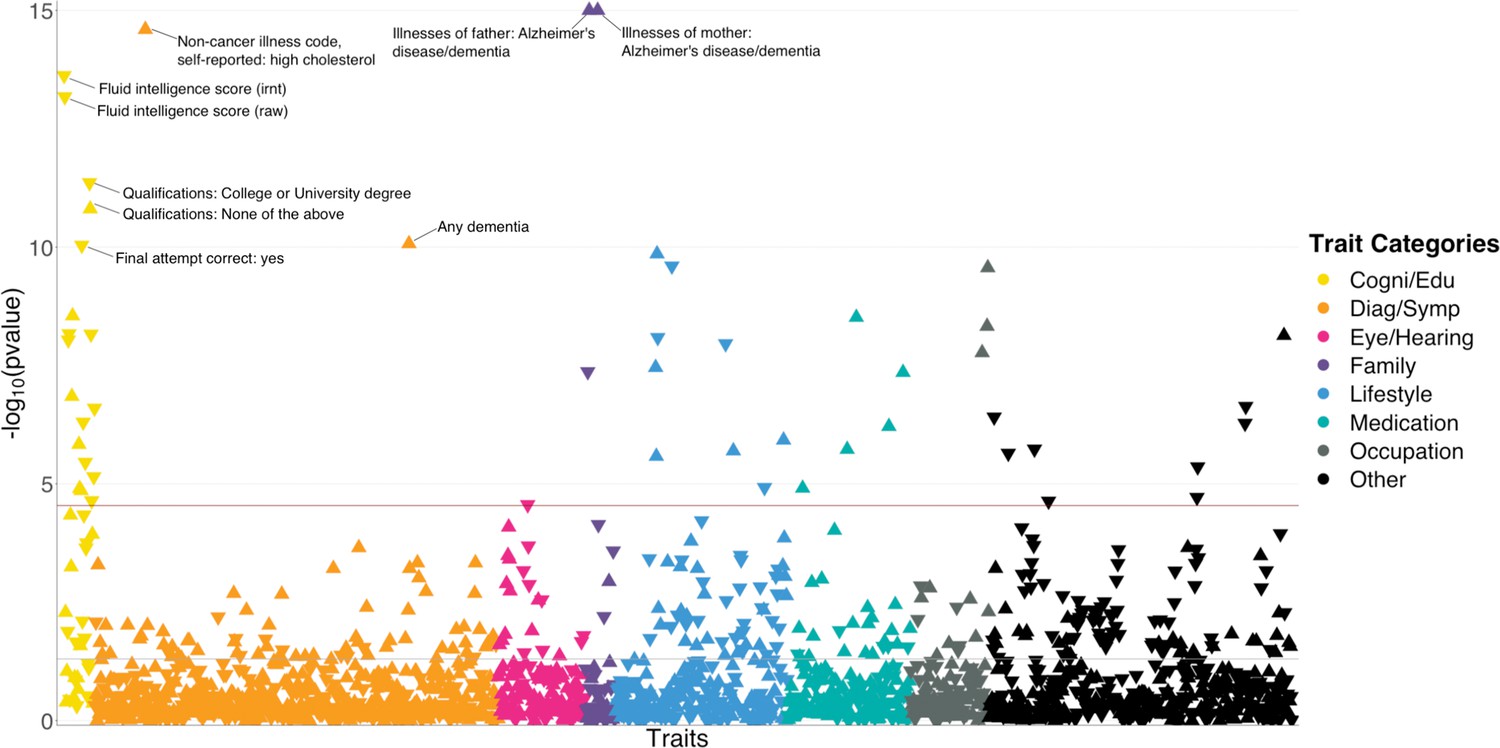
polygenic risk score (PR)S-based biobank-wide association scan (BWAS) identifies risk factors for Alzheimer’s disease (AD).
Meta-analysis p-values for 1738 heritable traits in the UK biobank are shown in the figure. p-values are truncated at 1e-15 for visualization purposes. The horizontal line marks the Bonferroni-corrected significance threshold (i.e. p=0.05/1738). Positive associations point upward, and negative associations point downward.
Figure 3—figure supplement 1
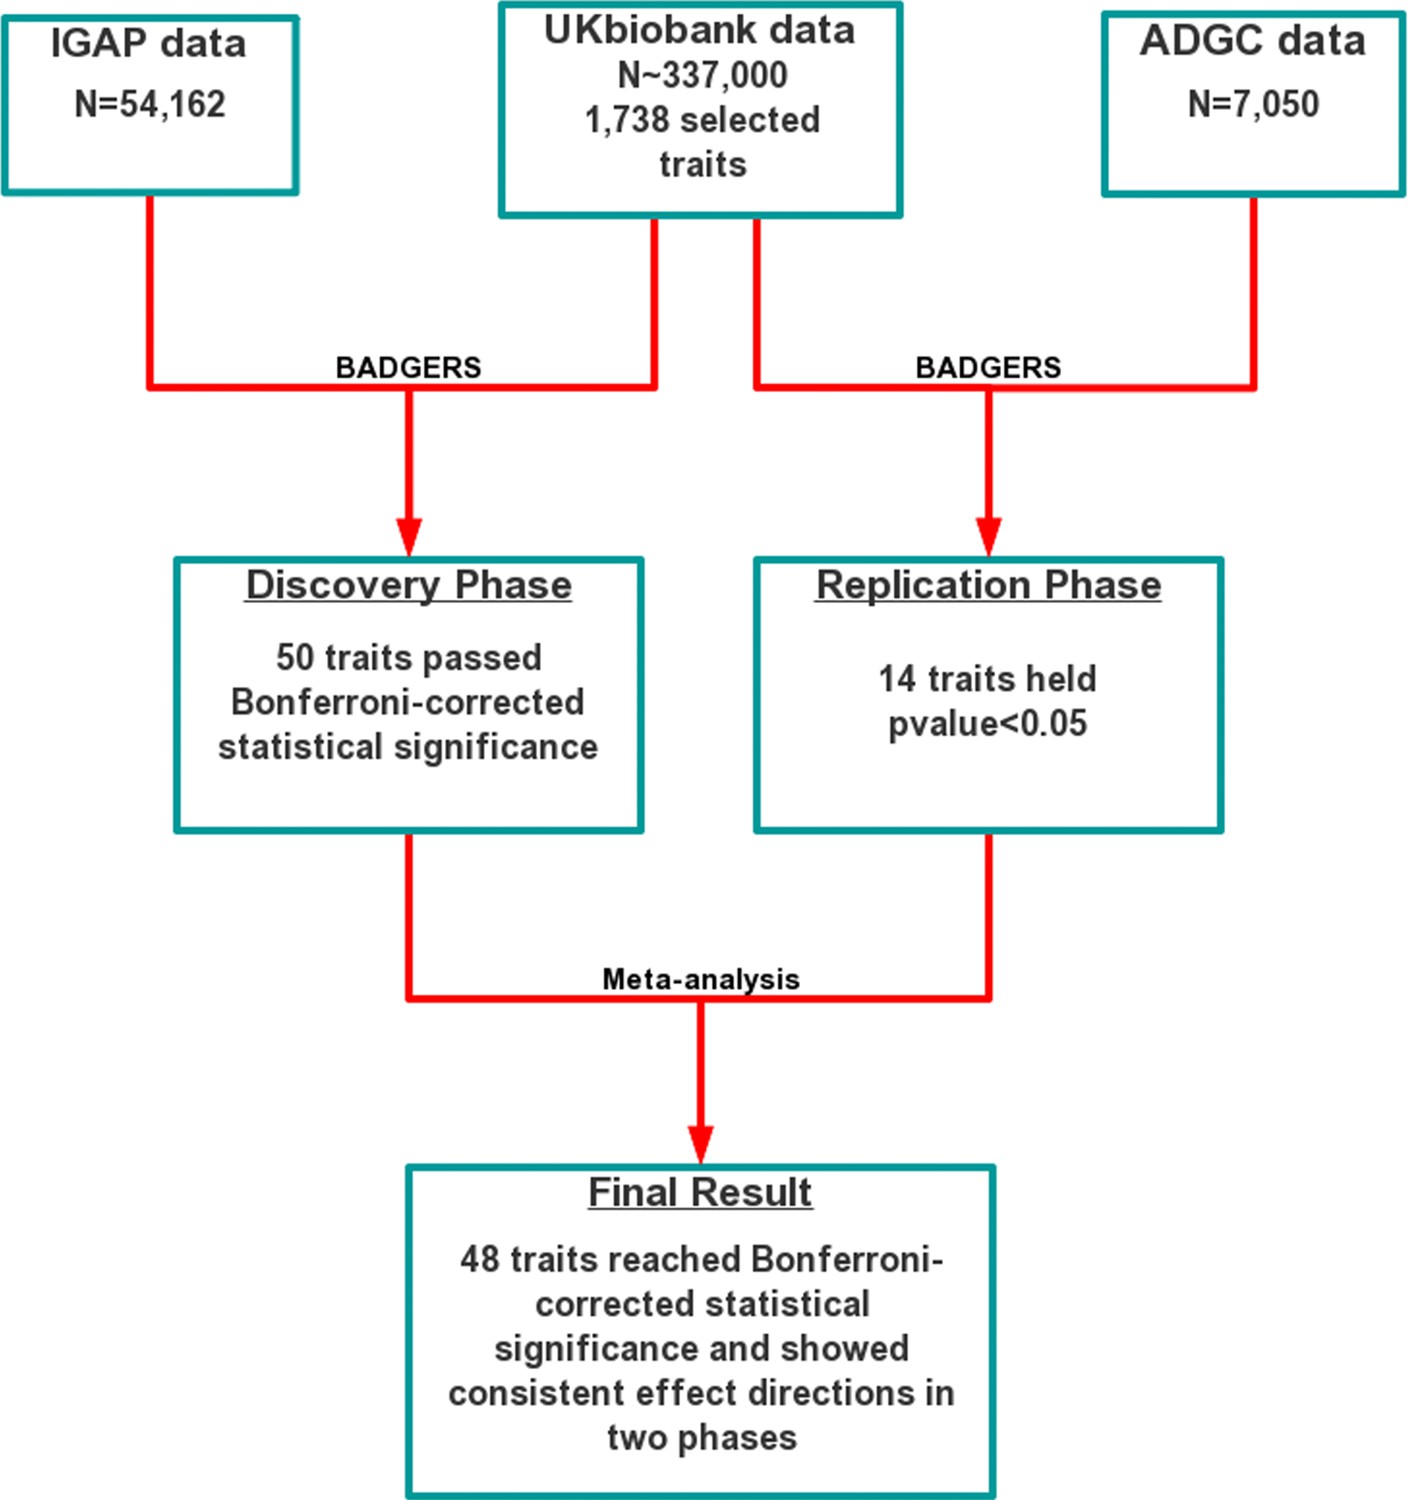
Workflow of the two-stage biobank-wide association scan (BWAS) for late-onset Alzheimer’s disease (AD).
Figure 3—figure supplement 2

Associations between Alzheimer’s disease (AD) and education attainment in two independent analyses.
Error bars denote the standard error of effect estimates.
Figure 4 with 1 supplement
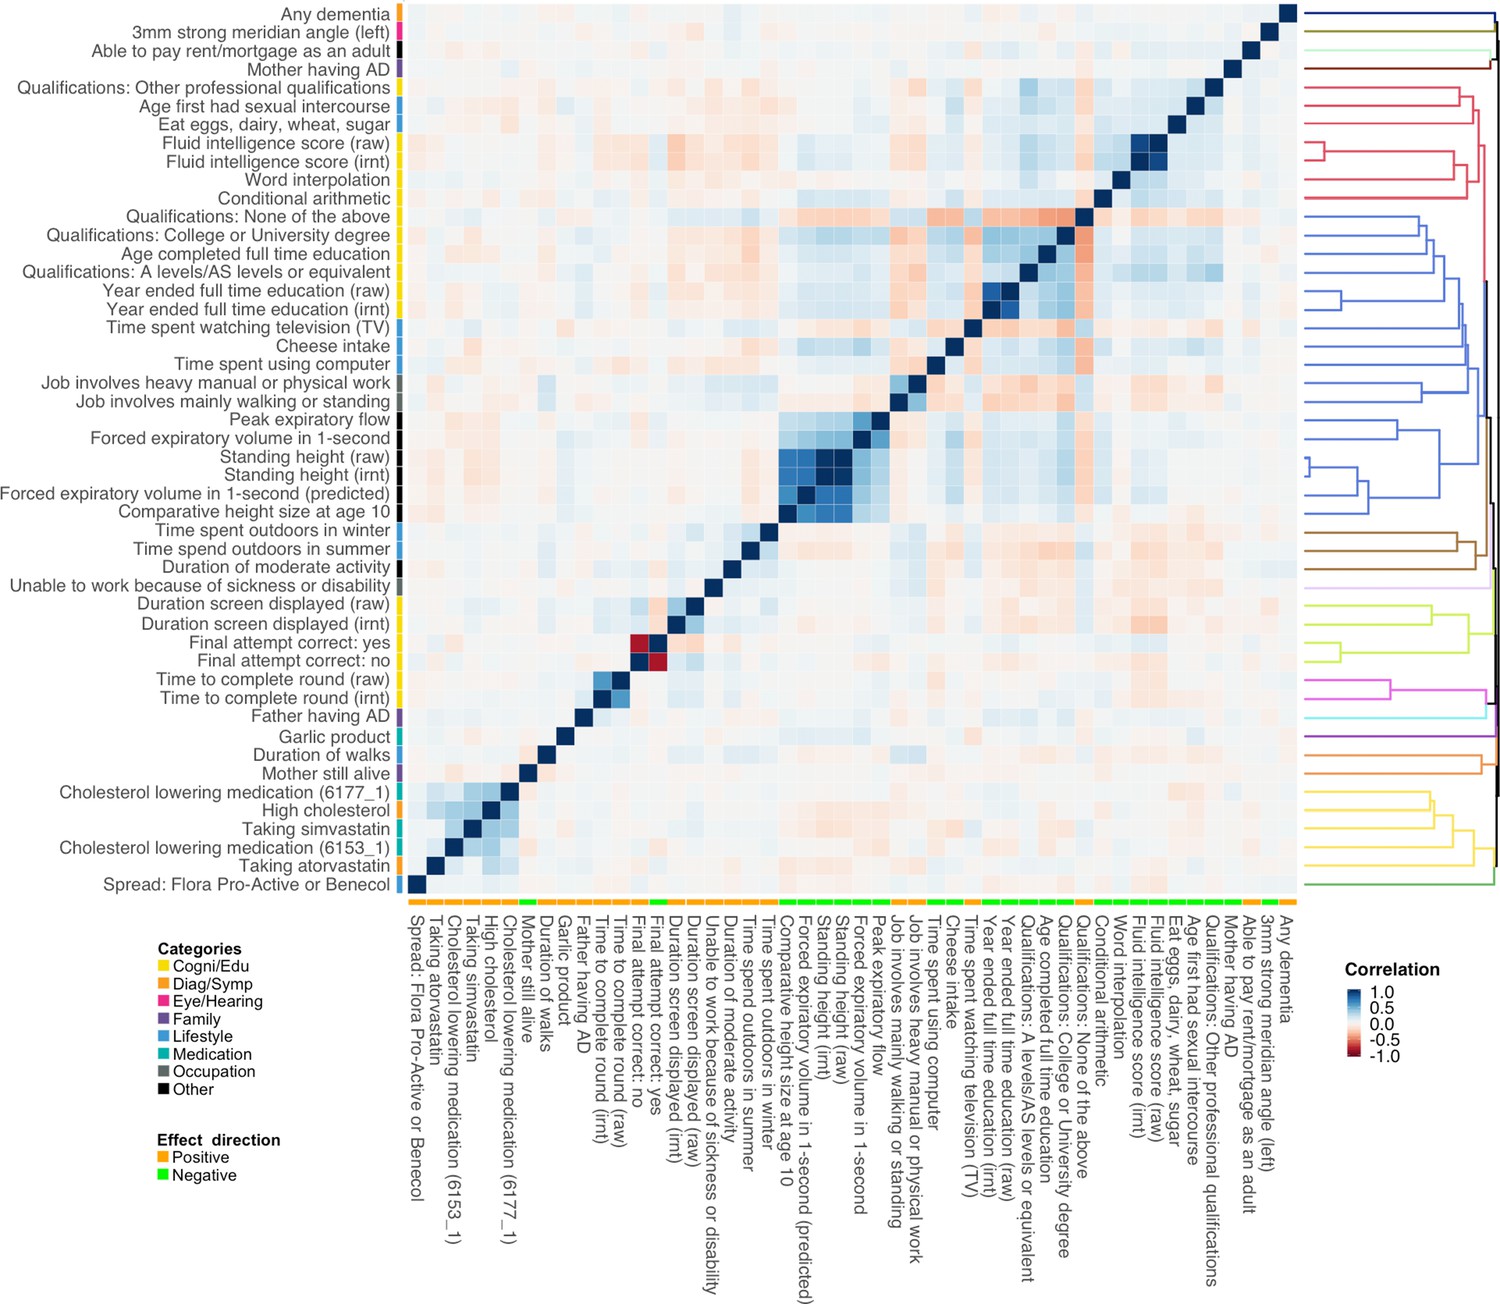
Polygenic risk score (PRS) correlation matrix for the 48 traits identified in marginal association analysis.
Trait categories and association directions with Alzheimer’s disease (AD) are annotated. The dendrogram indicates the results of hierarchical clustering. We used 1000 genome samples with European ancestry to calculate PRS and evaluate their correlations. Label ‘irnt’ means that trait values were standardized using rank-based inverse normal transformation in the genome-wide association study (GWAS) analysis.
Figure 4—figure supplement 1
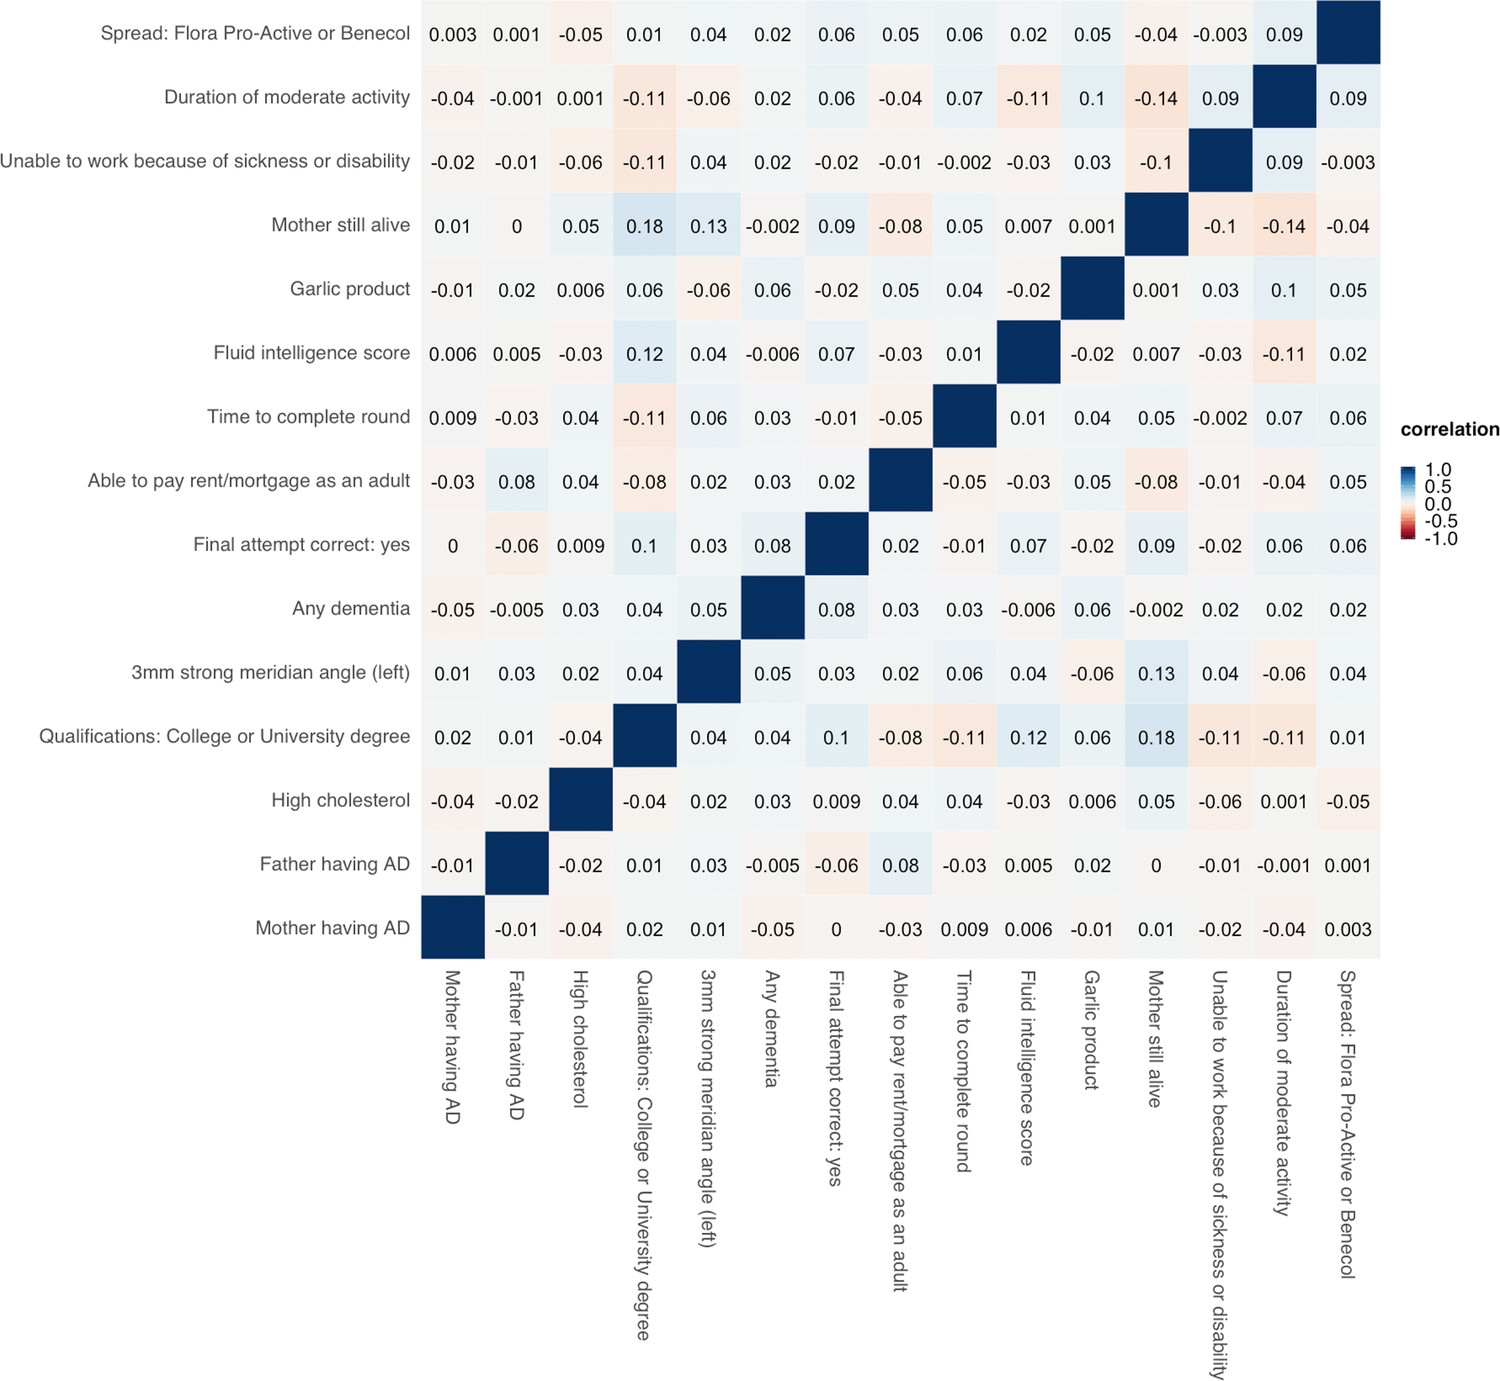
Correlation heatmap for the 15 representative traits selected based on hierarchical clustering.
Figure 5 with 1 supplement
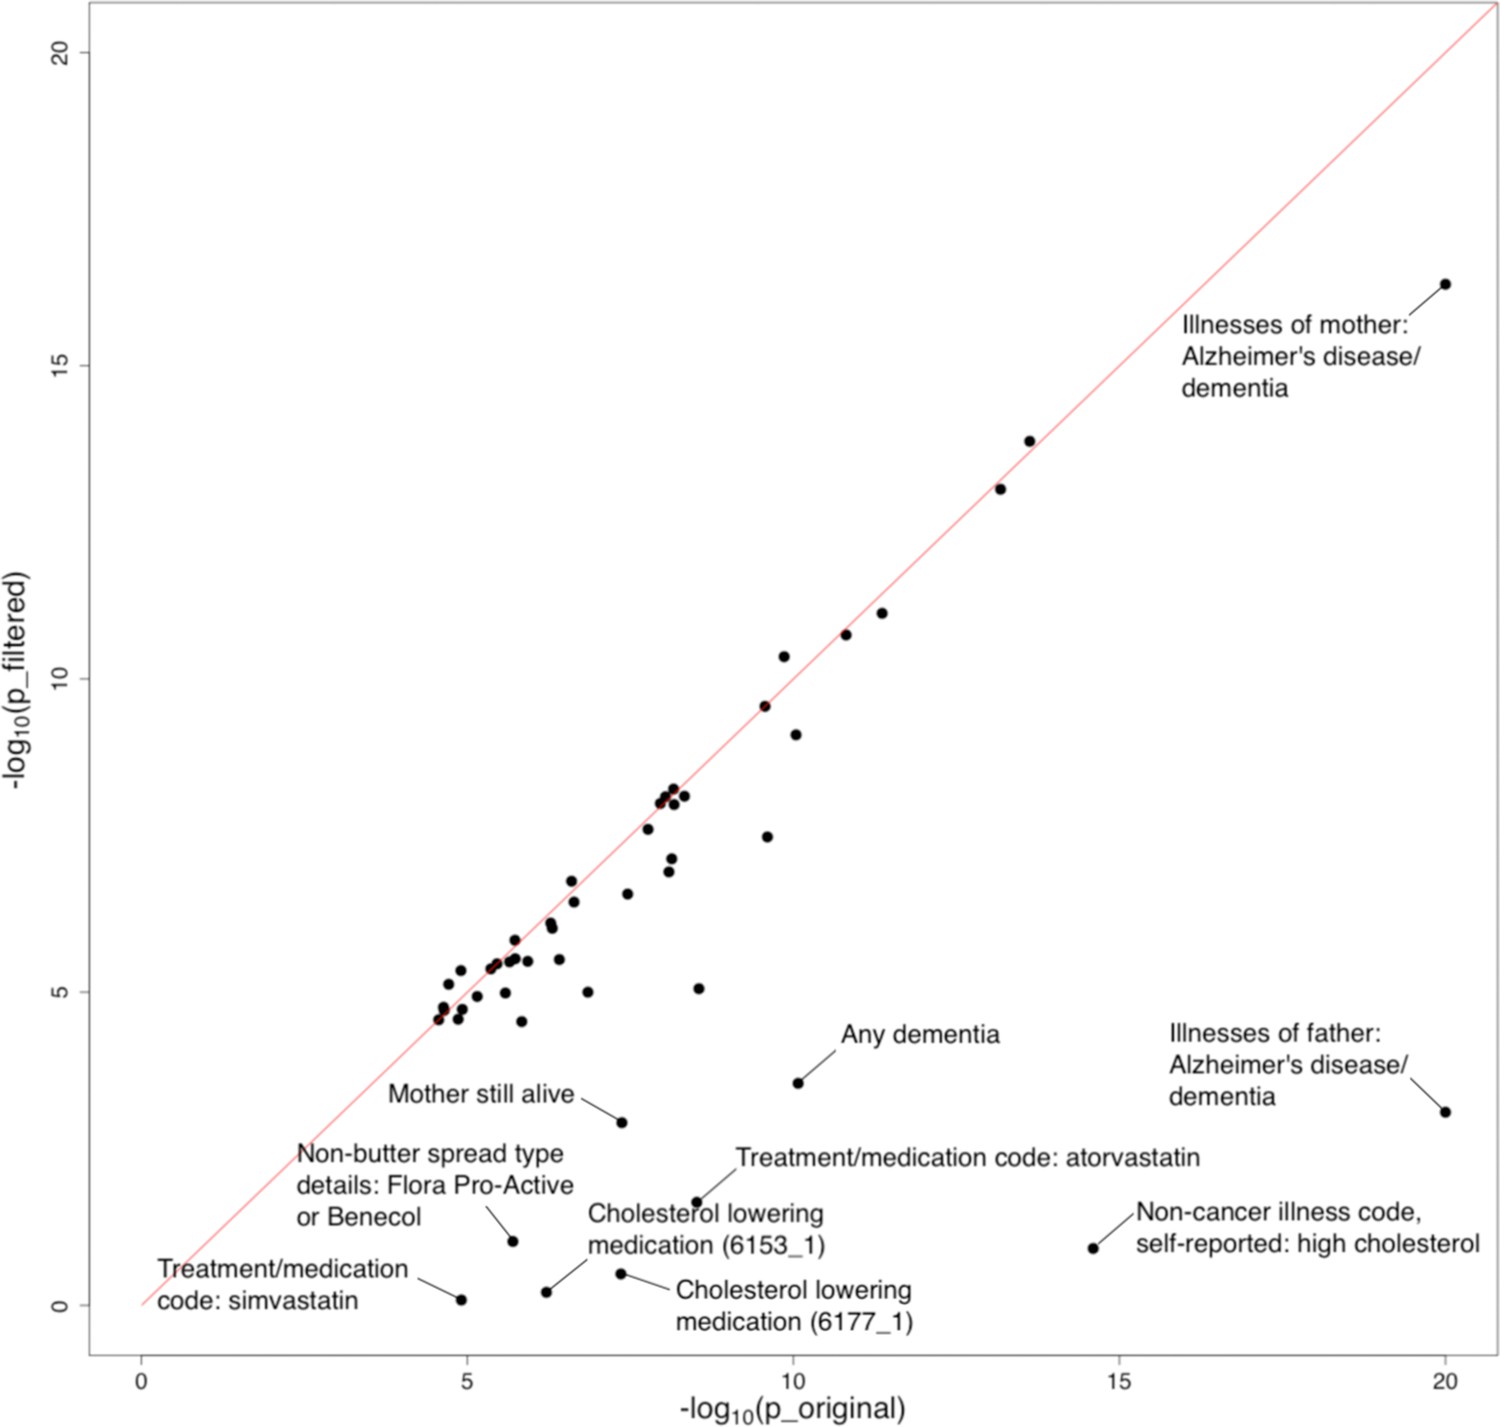
Influence of the APOE region on trait-Alzheimer’s disease (AD) associations.
The horizontal and vertical axes denote association p-values before and after removal of the APOE region, respectively. Original p-values (i.e. the x-axis) were truncated at 1e-20 for visualization purposes.
Figure 5—figure supplement 1
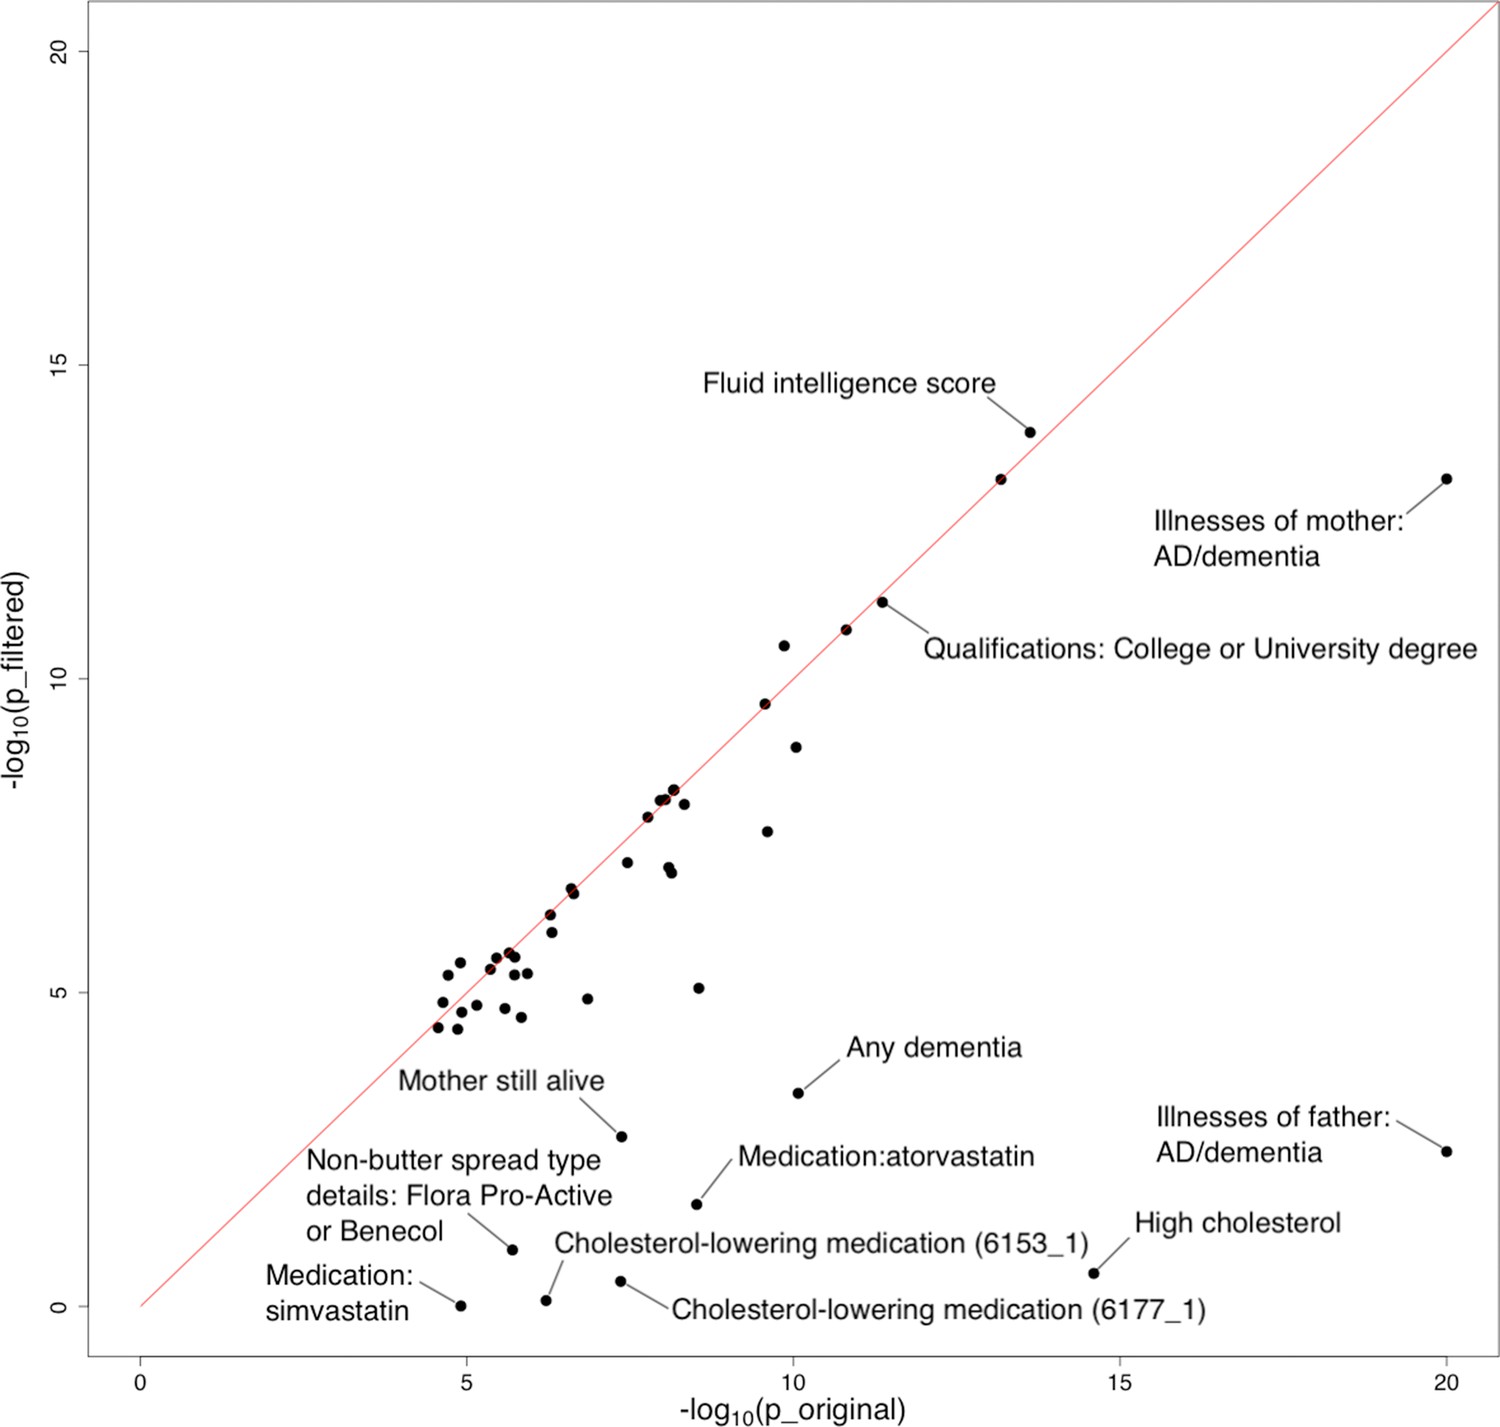
Influence of a wider APOE region on polygenic risk score (PRS)-Alzheimer’s disease (AD) associations.
A region of more than 2 Mb was removed from genome-wide association study (GWAS) summary statistics for this analysis (chr19: 44,409,039–46,412,650). The horizontal and vertical axes denote association p-values before and after removal of the extended APOE region, respectively. Original p-values (i.e. the x-axis) were truncated at 1e-20 for visualization purposes.
Figure 6 with 2 supplements
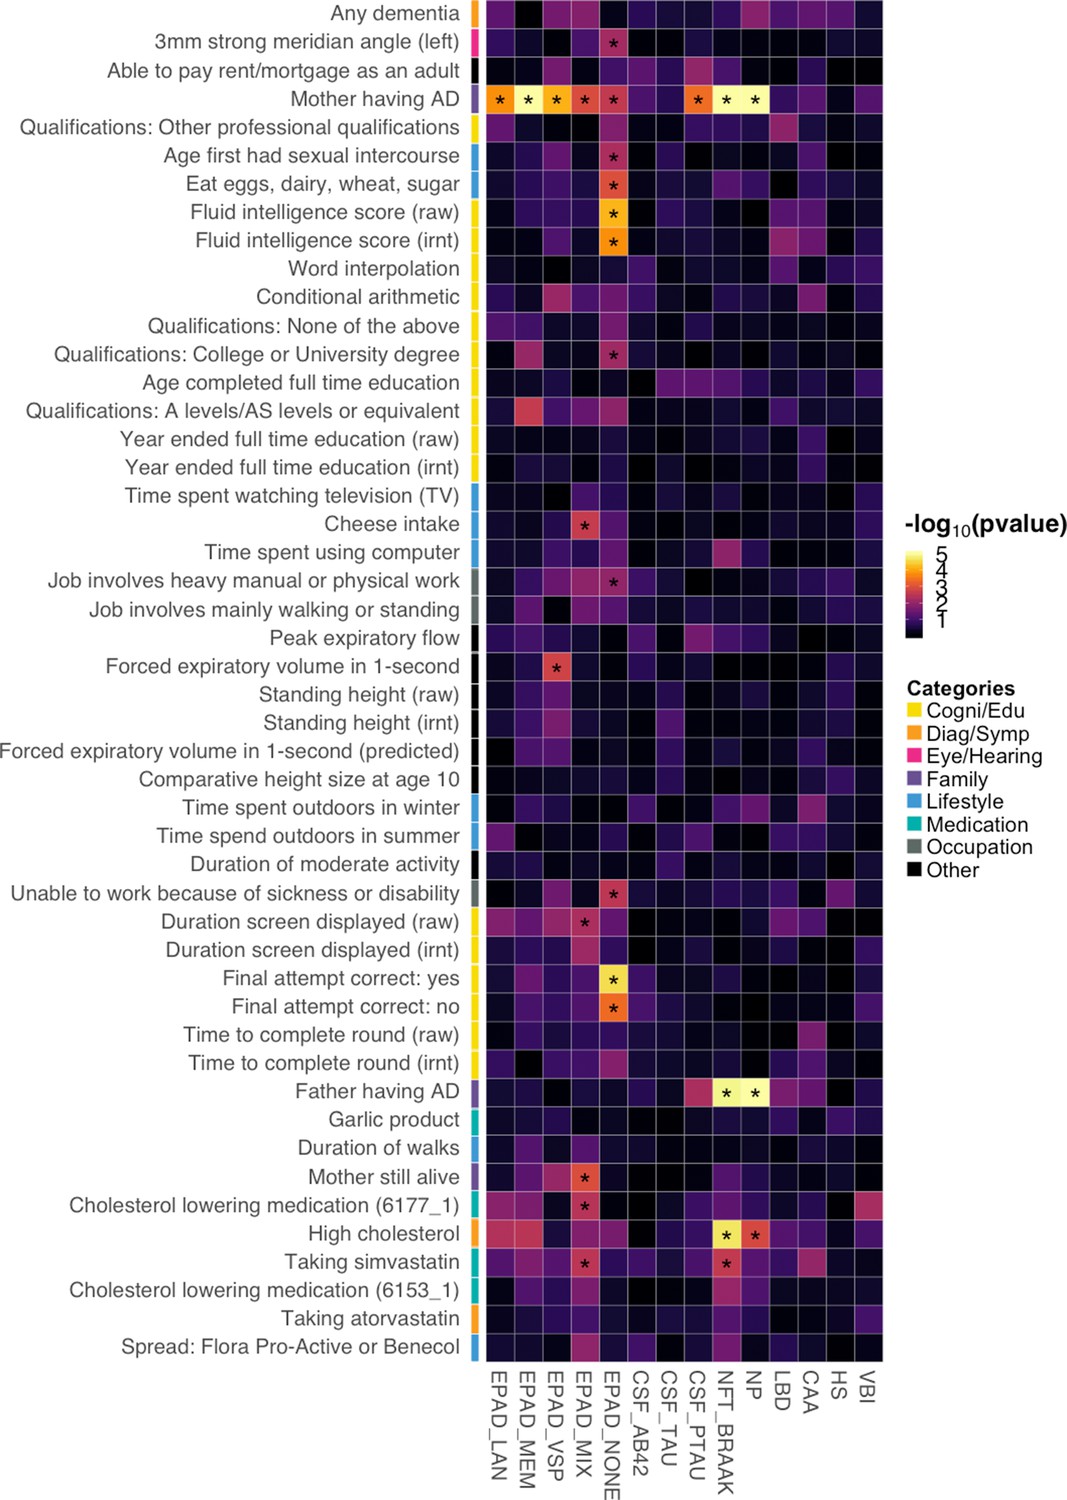
Associations between identified Alzheimer’s disease (AD) risk factors and various AD subgroups, cerebrospinal fluid (CSF) biomarkers, and neuropathologic features.
Asterisks denote significant associations based on an false discovery rate (FDR) cutoff of 0.05. p-values are truncated at 1e-5 for visualization purposes.
Figure 6—figure supplement 1
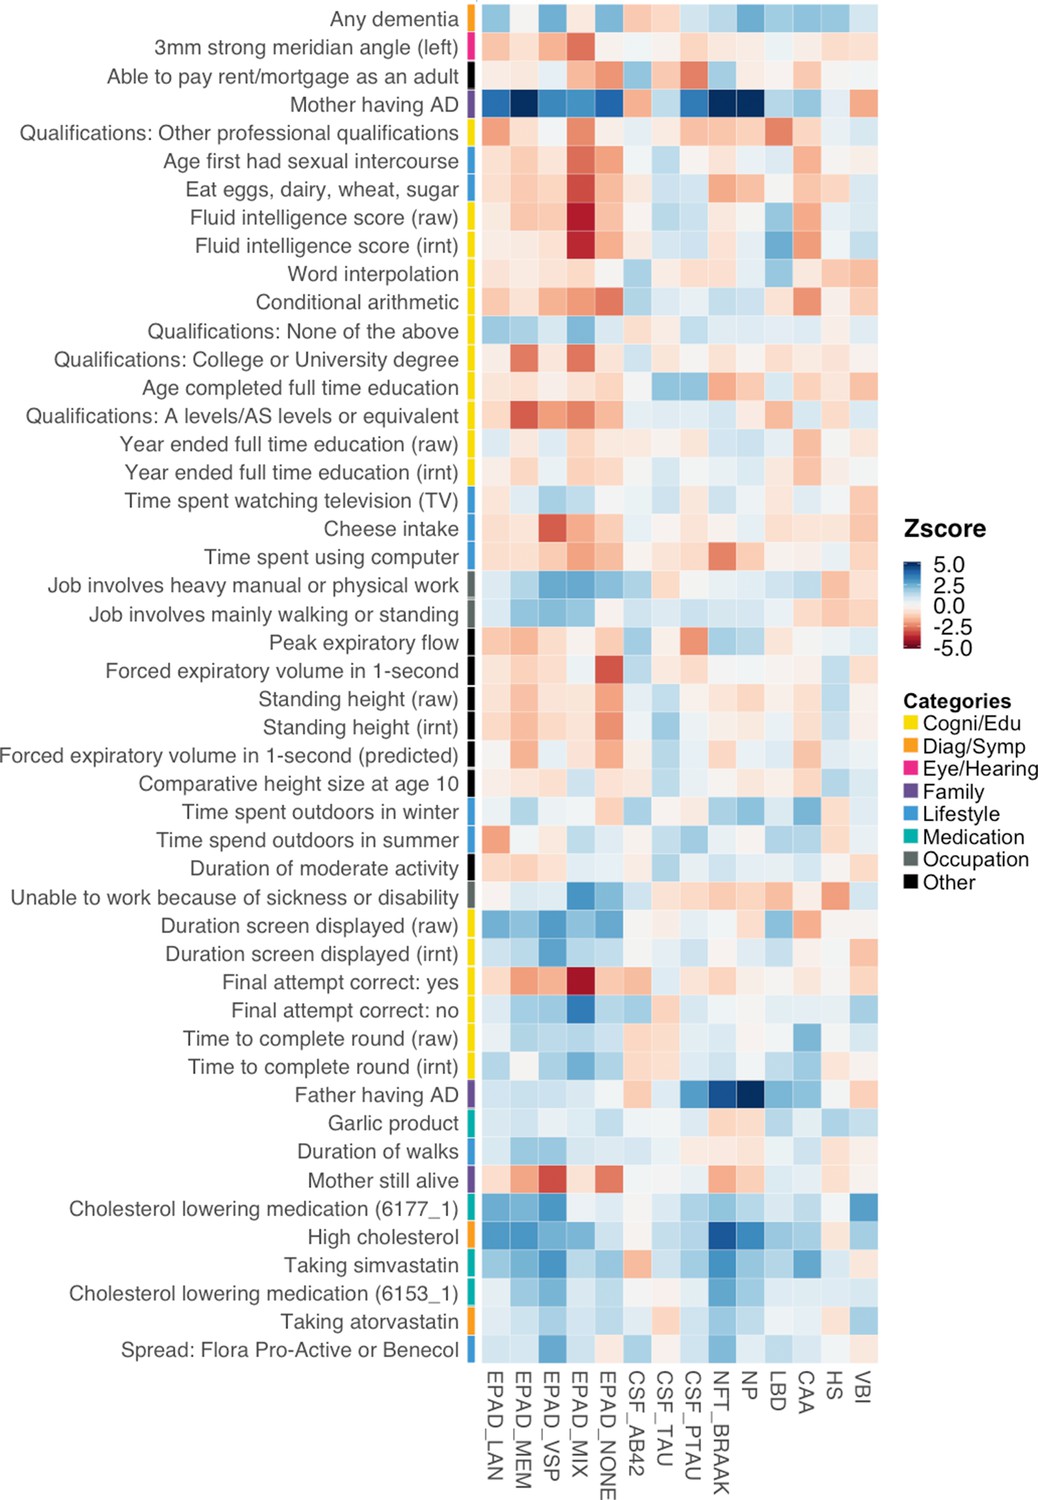
Association directions between identified Alzheimer’s disease (AD) risk factors and AD endophenotypes.
Z-scores are truncated at 5 and –5 for visualization purposes.
Figure 6—figure supplement 2
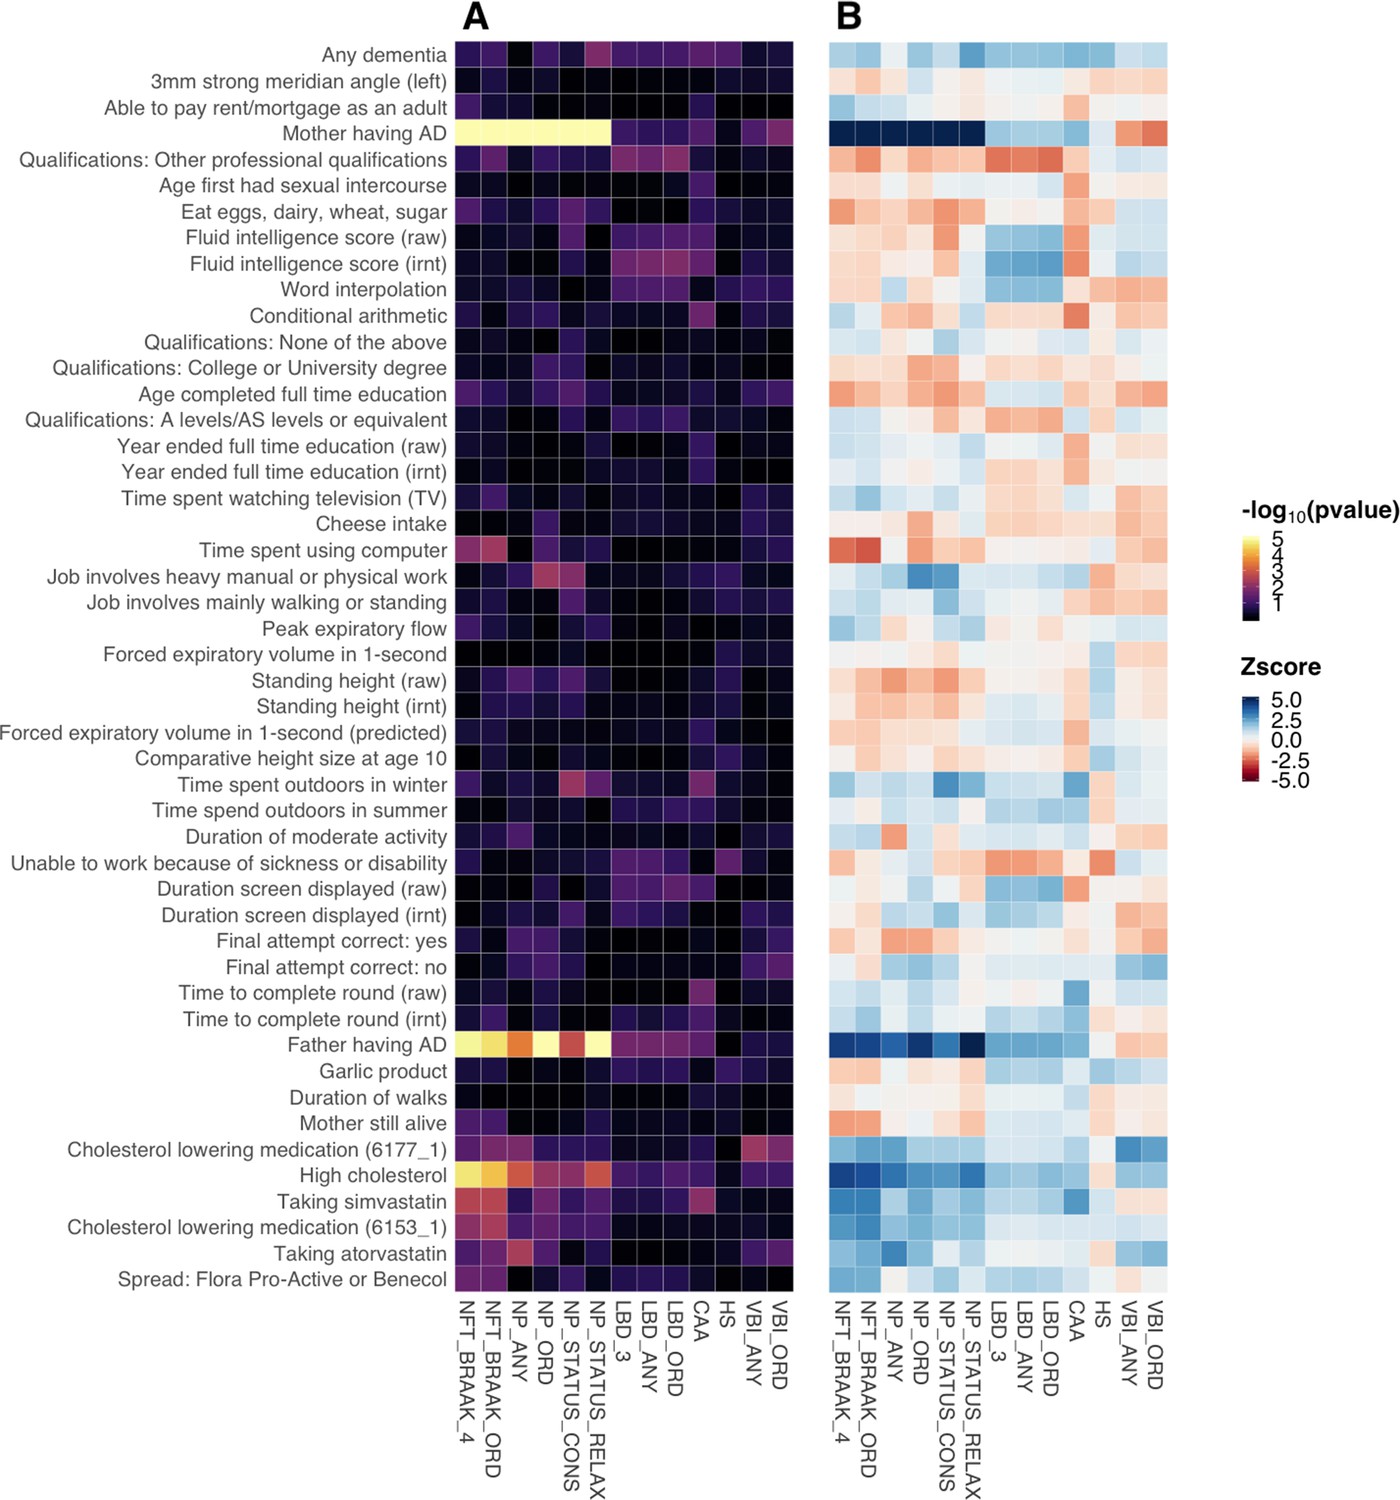
Association results for the complete set of 13 neuropathologic features for Alzheimer’s disease (AD) and other dementias.
(A) Association p-values; (B) Association z-scores. p-values are truncated at 1e-5 and z-scores are truncated at 5 and –5 for visualization purposes.
Figure 7
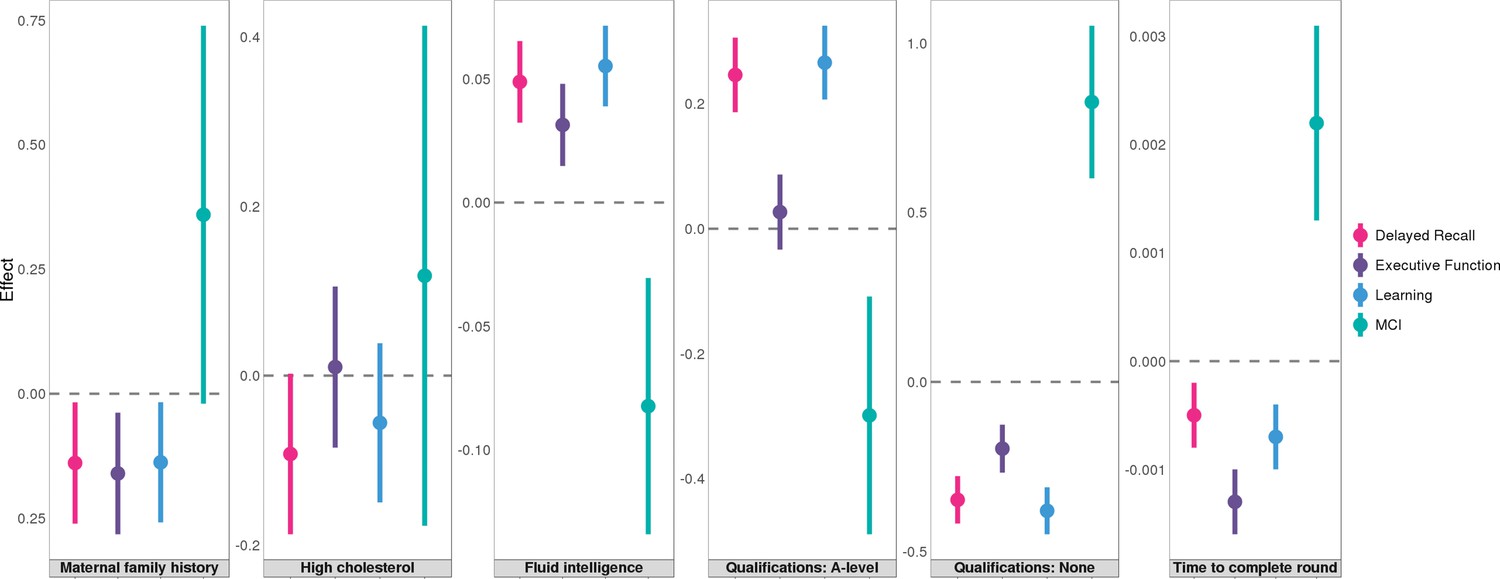
Associations between six traits and pre-clinical cognitive phenotypes in Wisconsin Registry for Alzheimer's Prevention (WRAP).
Error bars denote the standard error of effect estimates. N=1,198.
Additional files
-
Supplementary file 1
Simulation result; Result from Mendelian randomization and GSMR; Acknowledgements to Alzheimer’s Disease Genetics Consortium (ADGC).
- https://cdn.elifesciences.org/articles/91360/elife-91360-supp1-v1.docx
-
Supplementary file 2
Full association result between UK-biobank traits and Alzheimer’s disease/endophenotypes.
- https://cdn.elifesciences.org/articles/91360/elife-91360-supp2-v1.xlsx
-
MDAR checklist
- https://cdn.elifesciences.org/articles/91360/elife-91360-mdarchecklist1-v1.docx
Download links
A two-part list of links to download the article, or parts of the article, in various formats.
Downloads (link to download the article as PDF)
Open citations (links to open the citations from this article in various online reference manager services)
Cite this article (links to download the citations from this article in formats compatible with various reference manager tools)
Biobank-wide association scan identifies risk factors for late-onset Alzheimer’s disease and endophenotypes
eLife 12:RP91360.
https://doi.org/10.7554/eLife.91360.2


