Potassium-mediated bacterial chemotactic response
- Hefei National Research Center for Physical Sciences at the Microscale and Department of Physics, University of Science and Technology of China, China
Figures
Figure 1
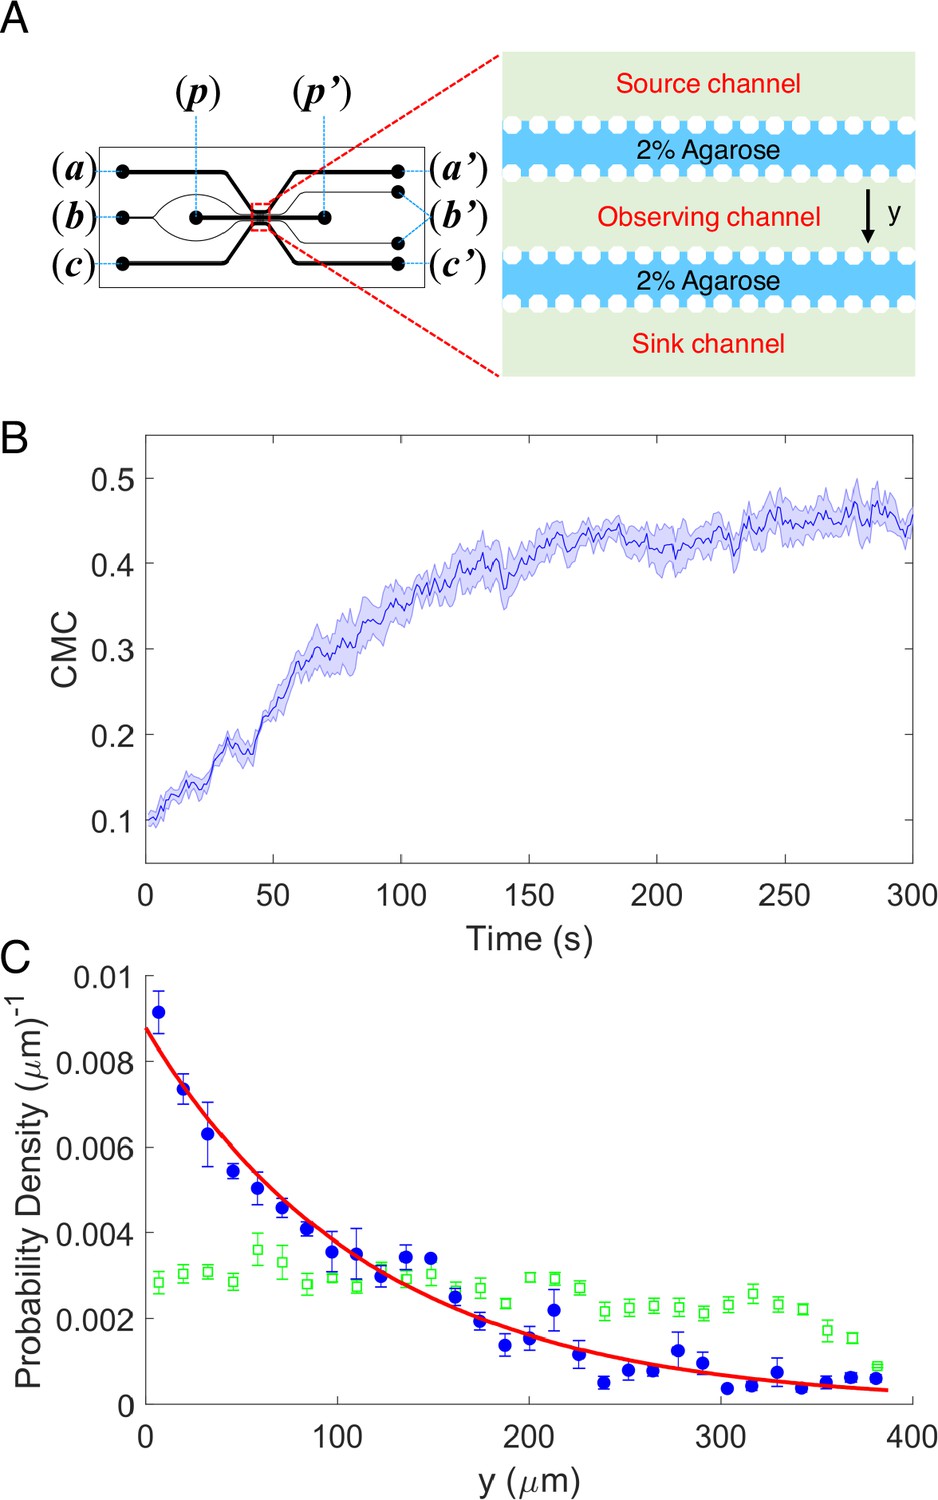
The chemotaxis performance of E.coli in a linear concentration gradient of potassium.
(A) Design diagram of the microfluidic device. The source channel and sink were flowed with 100 mM KCl and motility buffer, respectively. The inlets of KCl, agarose, motility buffer, and cells are denoted by (a), (b), (c), and (p), respectively. The outlets are labeled by the corresponding letters with the prime symbol. (B) The average chemotaxis migration coefficient (CMC) of four datasets as a function of time for the wild-type strain (HCB1) under a linear concentration gradient of KCl. The shaded area denotes standard error of the mean (SEM). (C) The cell density profile in the observing channel along the y-axis at the beginning (t = 1 s, green squares) and a steady state (t = 300 s, blue dots). The red solid line is an exponential fit to the data. Error bars denote SEM.
Figure 2 with 1 supplement
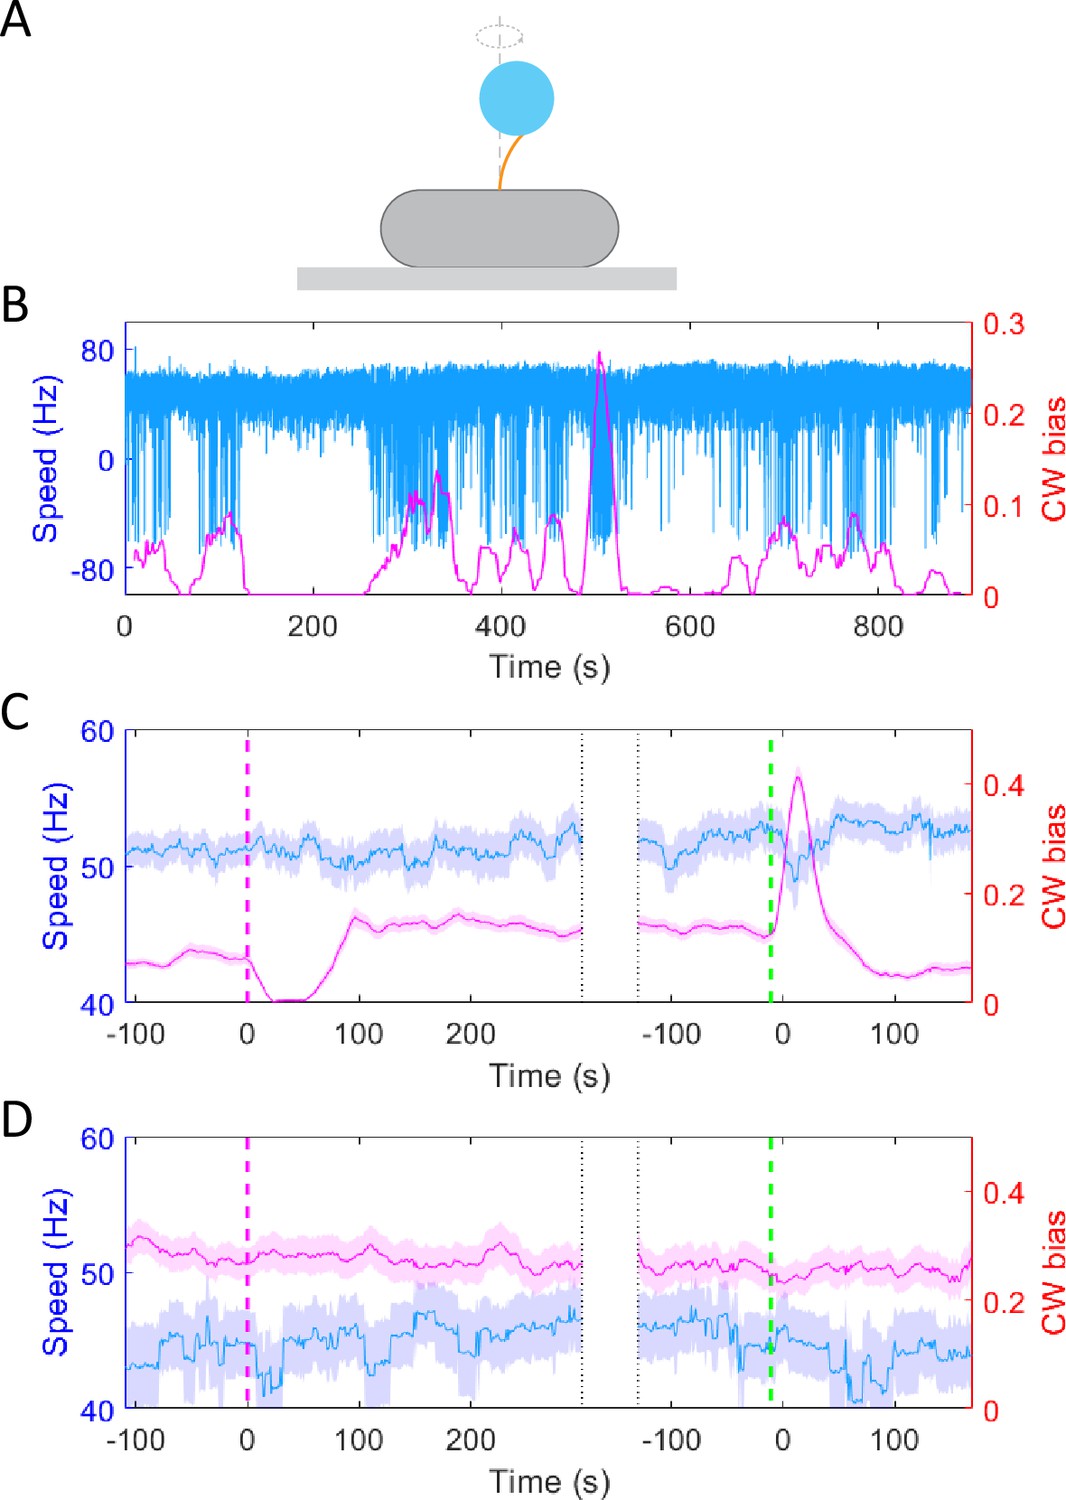
The response of motor rotational signal to potassium.
(A) Schematic diagram of the bead assay for the flagellar motor. (B) Typical trace of rotational speed (blue line) and clockwise (CW) bias (purple line) of individual motors for the wild-type strain (JY26-pKAF131). The positive and negative values of speed denote counter-clockwise (CCW) and CW rotation, respectively. 30 mM KCl was added at t = 120 s and removed at t = 480 s. (C) The average response of 83 motors from 5 samples for the wild-type strain to 30 mM KCl. The vertical purple (green) dashed lines indicate the moment of adding (removing) stimulus. The shaded areas denote standard error of the mean (SEM). (D) The average response of 22 motors from 4 samples for the chemotaxis-defective strain (HCB901-pBES38) to 30 mM KCl. The vertical purple (green) dashed lines indicate the moment of adding (removing) stimulus. The shaded areas denote SEM.
Figure 2—figure supplement 1

The response of motor clockwise (CW) bias to 15 mM K2SO4 (red line) and 30 mM KCl (blue line) for the wild-type strain.
There are 83 motors from 5 samples to 30 mM KCl and 91 motors from 4 samples to 15 mM K2SO4. The shaded areas denote standard error of the mean (SEM).
Figure 3 with 1 supplement

The chemotactic response of the wild-type strain (HCB1288-pVS88) to potassium.
(A) Chemotactic response of the wild-type strain (HCB1288-pVS88) to stepwise addition and removal of KCl. The blue solid line denotes the orignal signal, and the red dots represent the pH-corrected signal, which was recalculated from the pH-corrected cyan fluorescent protein (CFP) and yellow fluorescent protein (YFP) channels using the response of the no-receptor strain. (B) Comparison of the chemotactic response to 30 mM KCl and 60 mM sucrose. The vertical purple (green) dashed lines indicate the moment of adding (removing) stimulus. (C) Quantitative comparison among the responses to 100 μM MeAsp, 30 mM KCl, and 60 mM sucrose. The hollow and solid red bars represent the value calculated from the original signal and the pH-coPlrrected signal, respectively. The errors denote standard error of the mean (SEM).
Figure 3—figure supplement 1
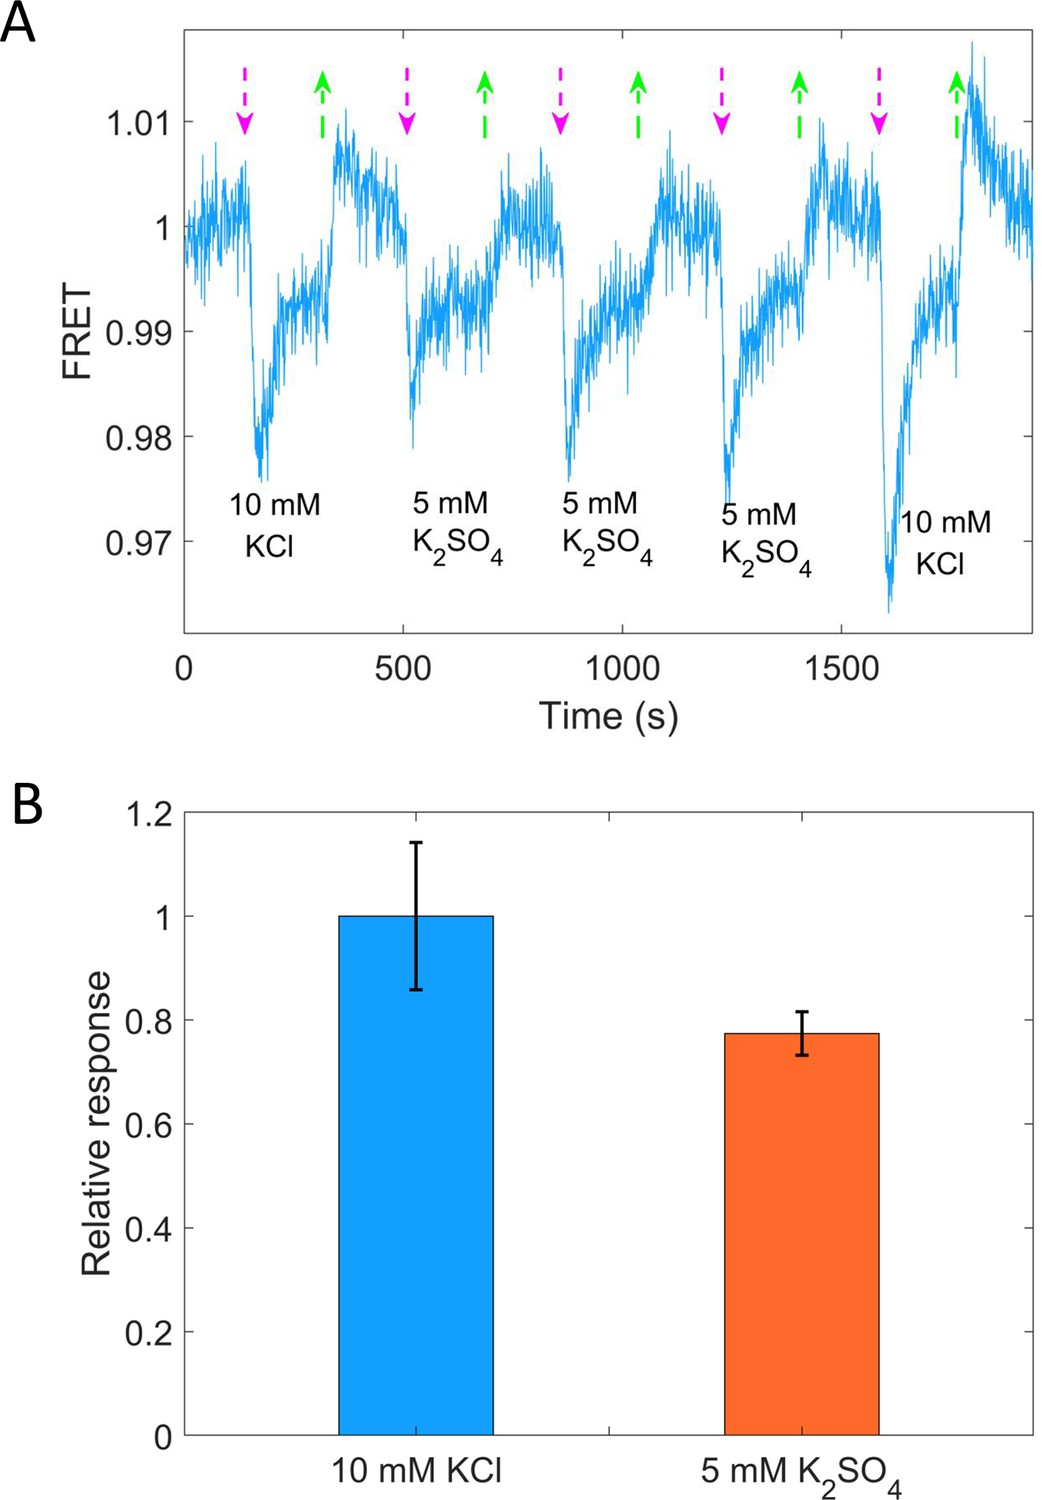
Quantitative comparison of the response of the chemotactic signal to 10 mM KCl and 5 mM K2SO4.
(A) The chemotactic response of the wild-type strain (HCB1288-pVS88) to 10 mM KCl and 5 mM K2SO4. The vertical purple (green) arrows denote the moment of adding (removing) stimulus. (B) Quantitative comparison among the responses to 10 mM KCl and 5 mM K2SO4. The errors denote standard error of the mean (SEM).
Figure 4 with 1 supplement
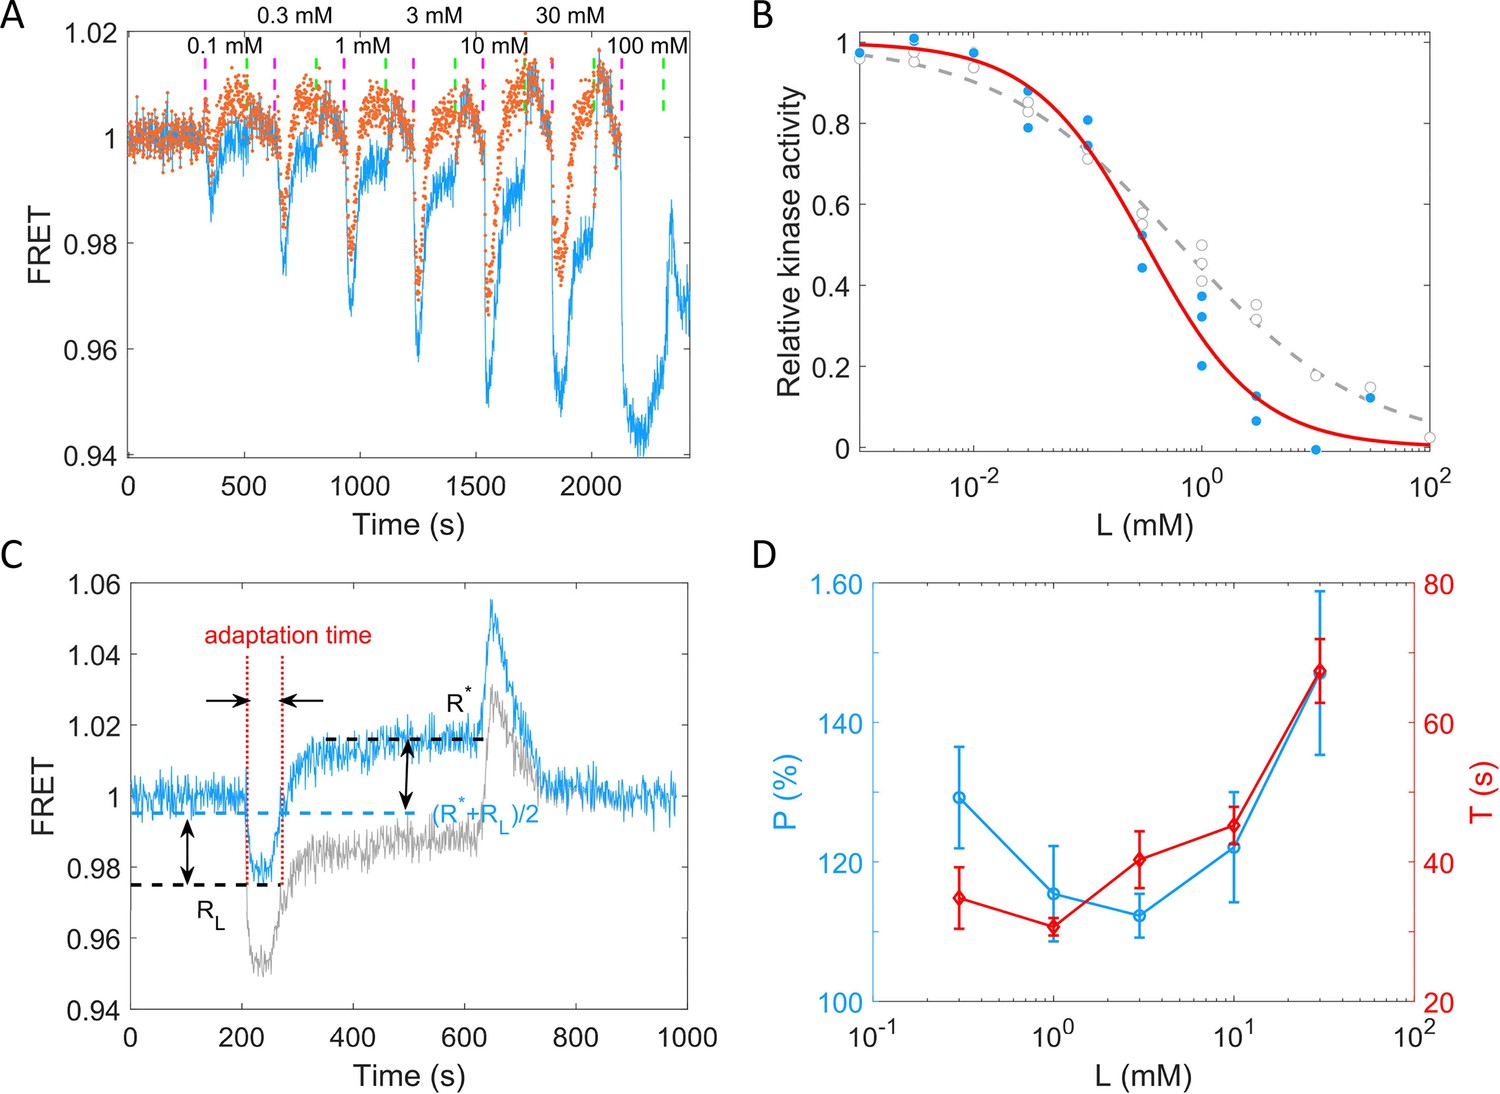
Quantitative results of the chemotactic response of the wild-type strain (HCB1288-pVS88) to potassium.
(A) A typical example of the dose–response measurement. The blue solid line denotes the original signal, and the red dots represent the pH-corrected signal, recalculated from the pH-corrected cyan fluorescent protein (CFP) and yellow fluorescent protein (YFP) signals using the response of the no-receptor strain. The vertical purple (green) dashed lines indicate the moment of adding (removing) stimulus. (B) The dose–response curve of relative kinase activity to KCl. The blue dots and gray circles represent the pH-corrected and original experimental data, respectively. The red solid and gray dashed lines are the fit curves for the blue dots and gray circles, respectively, using a Hill function. The fitted Hill coefficient for original and pH-corrected response were 0.53 ± 0.04 and 0.88 ± 0.14, respectively, and the concentration for half-maximal response (K0.5) were 0.64 ± 0.12 and 0.33 ± 0.06 mM, accordingly. (C) Definition of adaptation time in the step response. The gray and blue lines represent the original and pH-corrected signals, respectively. (D) The adaptation level and adaptation time (T) as a function of the concentration of KCl, calculated with pH-corrected data. The errors denote standard error of the mean (SEM).
Figure 4—figure supplement 1

The response of wild-type strain (HCB1288-pVS88) to KCl.
The blue solid line denotes the ratio of yellow fluorescent protein (YFP) to cyan fluorescent protein (CFP), while the cyan and yellow dots represent the PMT signals from CFP and YFP channel, respectively. The vertical purple (green) dashed lines indicate the moment of adding (removing) 30 and 100 mM KCl in order.
Figure 5 with 3 supplements

The response of intracellular pH for the wild-type strain and the chemotactic response of different mutant strains to potassium.
(A) The response of intracellular pH to 30 mM KCl for the wild-type strain (HCB33-pTrc99a_pHluorin2). The response to 20 mM sodium benzoate solution with pH = 4.55 was used as a control. (B) The chemotactic response of the Tsr-only strain (HCB1414-pPA114-pVS88) to four typical concentrations of potassium. The blue line denotes the orignal signal, and the red dots represent the pH-correcting signal. (C) The chemotactic response of the Tar-only strain (HCB1414-pLC113-pVS88) to four typical concentrations of potassium. The blue line denotes the orignal signal, and the red dots represent the pH-correcting signal. (D) The chemotactic response of the no-receptor strain (HCB1414-pVS88) to 30 mM KCl. The vertical purple (green) arrows denote the moment of adding (removing) stimulus.
Figure 5—figure supplement 1

The chemotactic response of the Tar-only strain (HCB1414-pLC113-pVS88) to 40 mM sodium benzoate at pH = 7.0.
The vertical purple (green) arrows denote the moment of adding (removing) stimulus. The response to the removal of sodium benzoate seems to be a superposition of an attractant and a repellent response, the reason for which deserves to be further explored.
Figure 5—figure supplement 2

The cyan fluorescent protein (CFP) intensity response to 30 mM KCl.
(A) The CFP intensity response of HCB1414-pVS88 to 30 mM KCl before and after YFP bleaching (50 min, yellow shaded area). Blue dots are experimental data. Fr and Fb are the CFP intensities for cells in motility medium (green dashed line) and 30 mM KCl (red dashed line), respectively. (B) The CFP intensity response of HCB1288-pVS88 to 30 mM KCl. Blue dots are experimental data. The CFP intensity for cells in motility medium is denoted with the green dashed line. The theoretical fluorescence enhancement (red dashed line) was calculated by multiplying the level of the green dashed line by Fr/Fb in A. The vertical down (up) arrows denote the moment of adding (removing) 30 mM KCl. The background measured with HCB1288-pVS18 was subtracted.
Figure 5—figure supplement 3
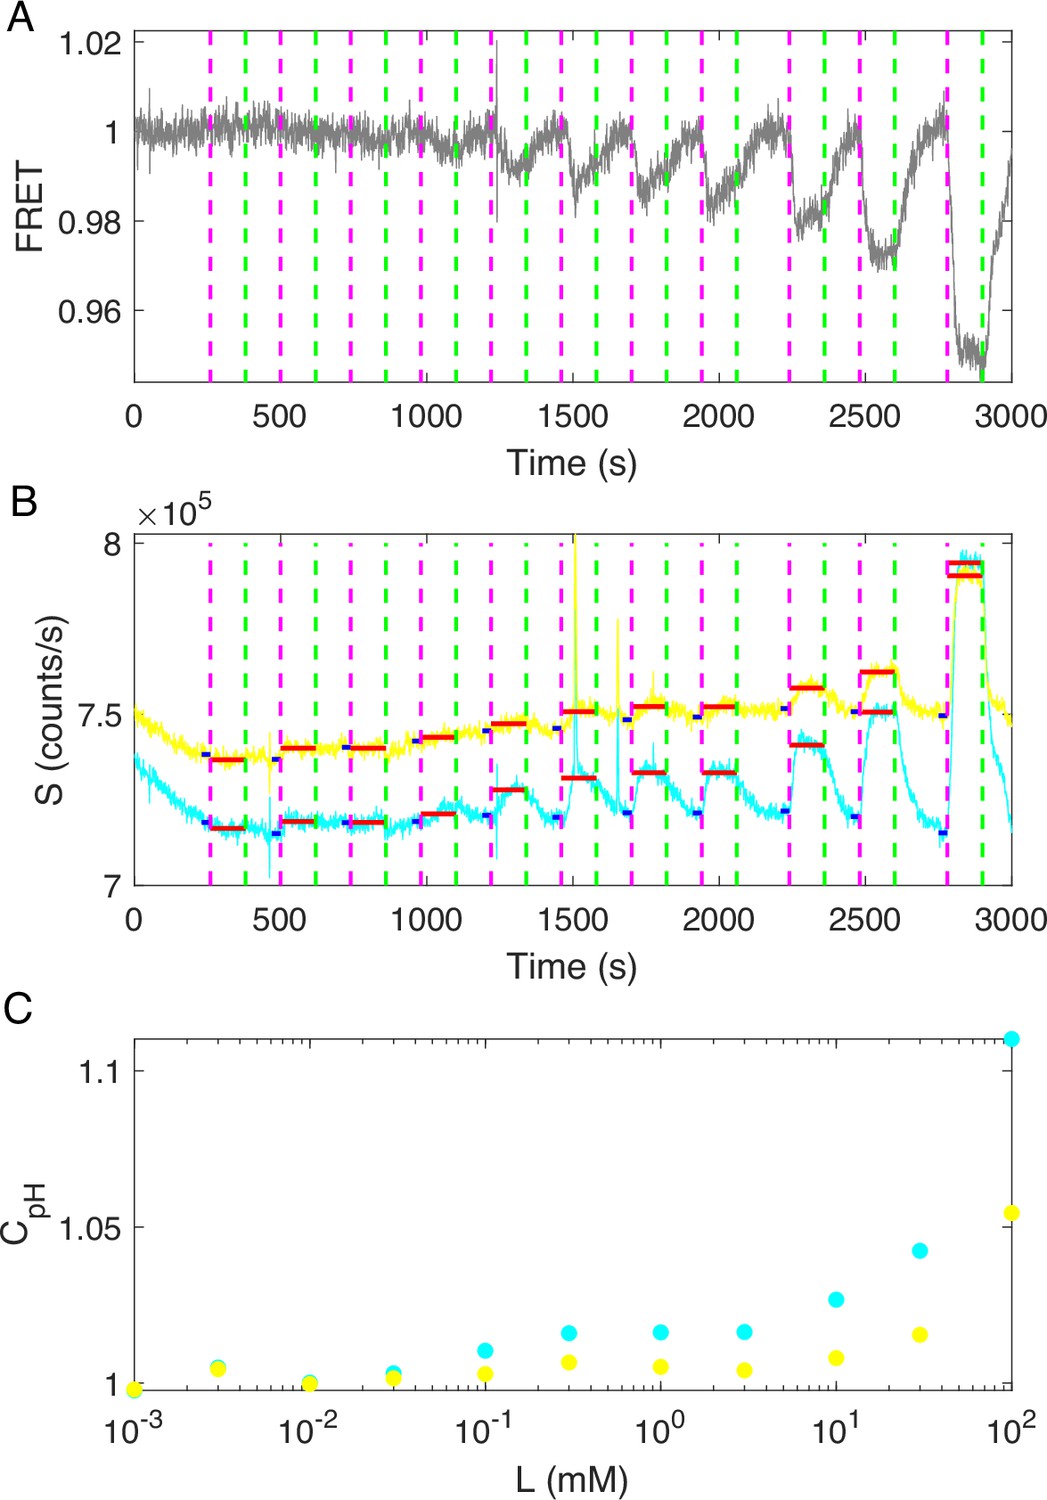
The response of the no-receptor mutant (HCB1414-pVS88) to different concentrations of KCl.
(A) The original FRET signal of the no-receptor mutant in response to KCl. The vertical purple (green) dashed lines indicate the moment of adding (removing) KCl in the following order: 0.001, 0.003, 0.01, 0.03, 0.1, 0.3, 1, 3, 10, 30, and 100 mM. (B) The original cyan fluorescent protein (CFP) (cyan solid line) and yellow fluorescent protein (YFP) (yellow solid line) signals of the no-receptor mutant in response to KCl. The vertical purple (green) dashed lines represent the same events as in (A). The horizontal blue (red) solid lines represent the PMT signal values before (after) the addition of KCl at special concentrations. (C) The relationship between the ratio of PMT signal post- to pre-KCl addition and the concentration of KCl for CFP (cyan dots) and YFP (yellow dots).
Figure 6 with 2 supplements
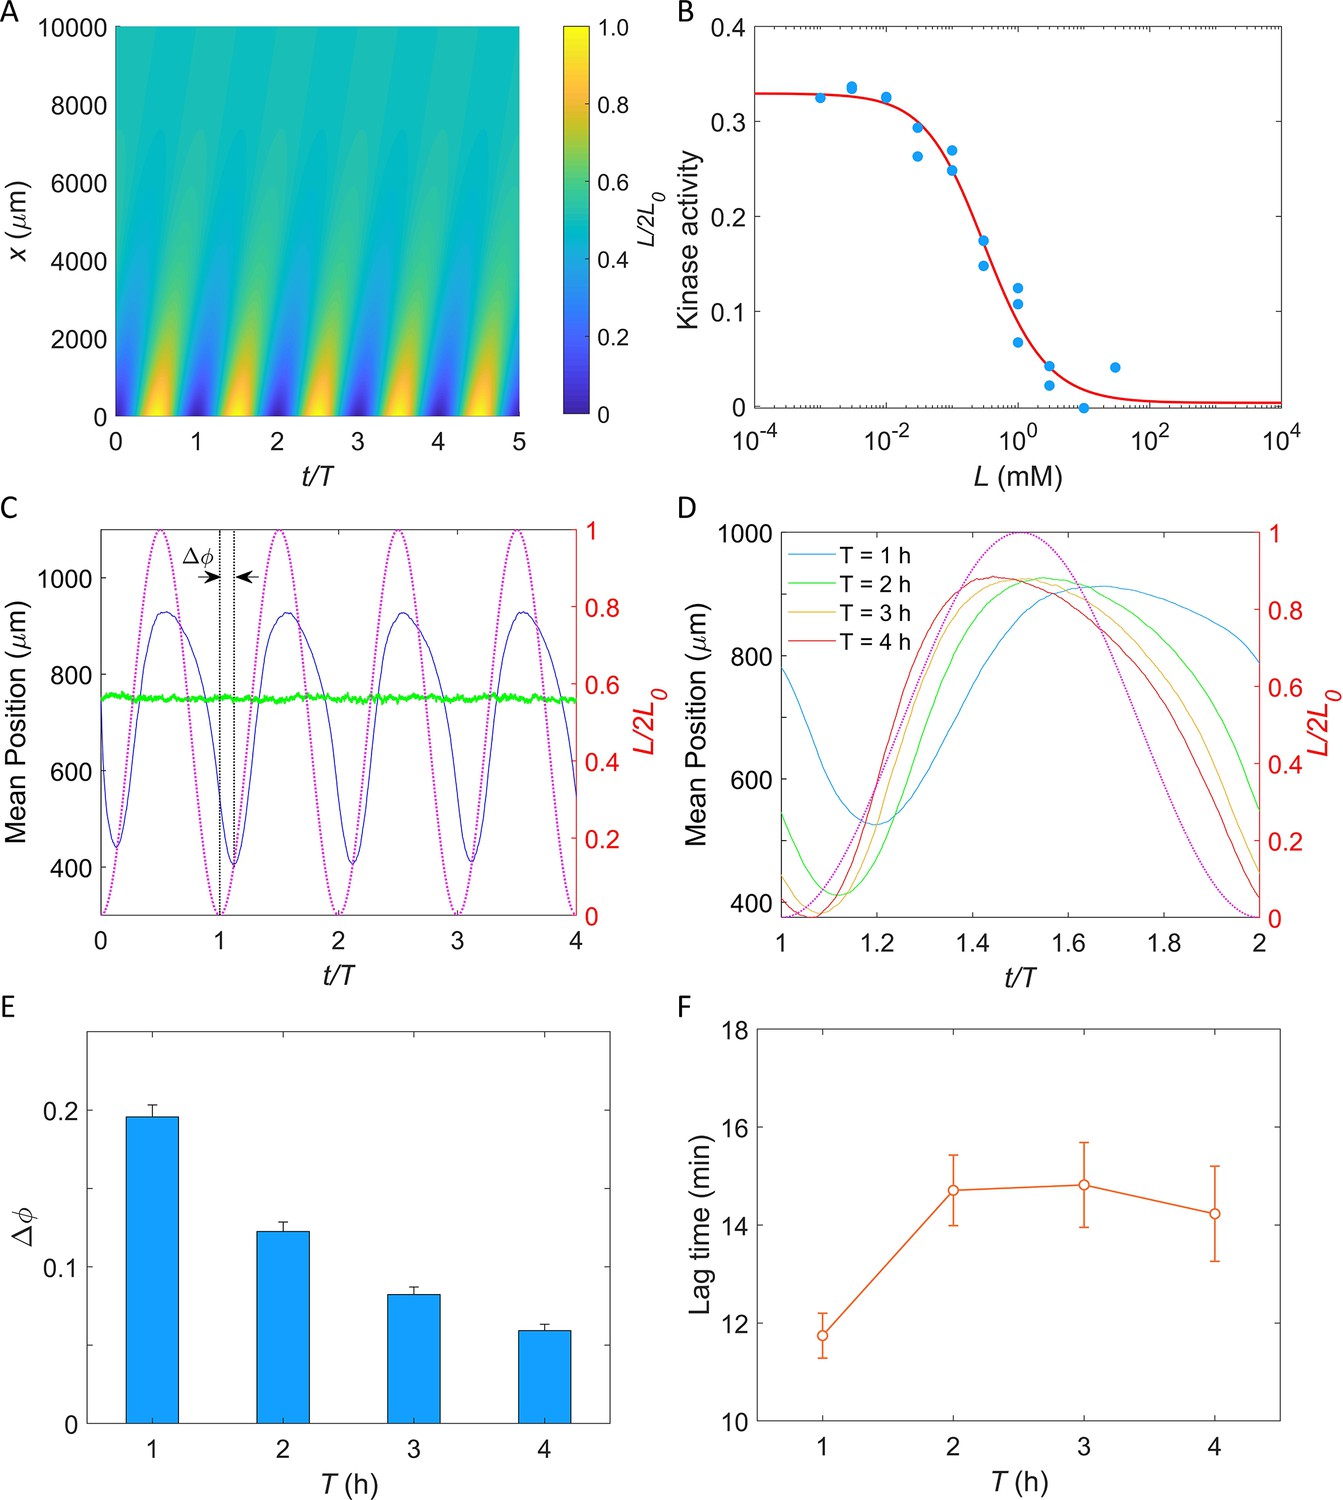
Simulation of E. coli chemotactic swimming in response to a periodic potassium signal produced by a typical biofilm.
(A) The oscillating spatial gradient of potassium. (B) The dose–response curve of receptor-kinase activity to potassium. Blue dots are pH-corrected experimental data (blue dots in Figure 4B). Red solid line is the fitting curve with Equation 2. (C) Typical traces of simulated mean positions with = 1.0 mM and T = 2 hr. The blue and green lines denote the mean x-position () and mean y-position (), respectively. The purple dashed line indicates the oscillating potassium source at x = 0. The phase delay is defined as the phase shift between the trough of the mean x-position and the trough of potassium source except for t/T = 0. (D) The comparison of the mean x-position under different periods of the driving source: T = 1, 2, 3, and 4 hr. The purple dashed line indicates the oscillating potassium source at x = 0. (E) The relation between the phase delay and the driving period T. Each data was calculated by the average of 10 simulations. The error denotes standard deviation. (F) The relation between lag time () and the driving period T. The error denotes standard deviation.
Figure 6—figure supplement 1

The relation between phase delay () and driving periods (T) with different L0.
Each data point was calculated by the average of 10 simulations. Error bars denote standard deviation.
Figure 6—figure supplement 2

The relationship between the lag time (∆ϕ∙T) and the methylation rate kR.
Each data point was calculated by the average of 10 simulations. Error bars denote standard deviation.
Author response image 1

Chemotactic response of the wild-type strain (A, HCB1288-pVS88) and the no-receptor strain (B, HCB1414-pVS88) to stepwise addition and removal of KCl.
The blue solid line denotes the original normalized signal. Downward and upward arrows indicate the time points of addition and removal of 3 mM KCl, respectively. The horizontal red dashed line denotes the original normalized FRET response value to 3 mM KCl.
Videos
Video 1
An example video of wild-type E. coli HCB1 cells swimming up the potassium gradient in a microfludic device.
The left side is the source channel. Scale bar = 20 µm.
Tables
Key resources table
| Reagent type (species) or resource | Designation | Source or reference | Identifiers | Additional information |
|---|---|---|---|---|
| Strain, strain background (Escherichia coli) | Wild-type AW405 | Howard Berg Lab Armstrong et al., 1967 | HCB1 | Also known as AW405 |
| Strain, strain background (Escherichia coli) | Wild-type RP437 | Howard Berg Lab Parkinson, 1978 | HCB33 | Also known as RP437 |
| Strain, strain background (Escherichia coli) | CheY** strain | Howard Berg Lab | HCB901 | ΔcheZ fliC, Ptrc420 cheY13DK106YW |
| Strain, strain background (Escherichia coli) | RP437 with ΔcheY cheZ | Howard Berg Lab Sourjik and Berg, 2002b | HCB1288 | Also known as VS104; ΔcheY cheZ |
| Strain, strain background (Escherichia coli) | RP437 with Δtar tsr tap trg aer cheY cheZ | Howard Berg Lab Sourjik and Berg, 2002a | HCB1414 | Also known as VS181; Δtar tsr tap trg aer cheY cheZ |
| Strain, strain background (Escherichia coli) | RP437 with ΔfliC | This paper | JY26 | The fliC gene of strain RP437 was deleted; ΔfliC |
| Recombinant DNA reagent | pVS18 (plasmid) | Howard Berg Lab Sourjik and Berg, 2002a | pVS18 | CheY-eYFP |
| Recombinant DNA reagent | pVS88 (plasmid) | Howard Berg Lab Sourjik and Berg, 2004 | pVS88 | CheY-eYFP and CheZ-eCFP |
| Recombinant DNA reagent | pBES38 (plasmid) | Howard Berg Lab | pBES38 | LacIq and FliCsticky |
| Recombinant DNA reagent | pKAF131 (plasmid) | Howard Berg Lab Yuan et al., 2010 | pKAF131 | FliCsticky |
| Recombinant DNA reagent | pLC113 (plasmid) | Howard Berg Lab Ames et al., 2002 | pLC113 | Tar |
| Recombinant DNA reagent | pPA114 (plasmid) | Howard Berg Lab Ames et al., 2002 | pPA114 | Tsr |
| Recombinant DNA reagent | pTrc99a_pHluorin2 (plasmid) | This paper | pTrc99a_pHluorin2 | The gene pHluorin2 was cloned into pTrc99a under an IPTG-inducible promoter. |
| Chemical compound, drug | Tryptone | Oxoid | CAT# LP0042B | |
| Chemical compound, drug | IPTG | Sigma-Aldrich | CAT# I6758 | |
| Chemical compound, drug | Lactic acid | Sigma-Aldrich | CAT# 252476 | |
| Software, algorithm | Custom script | Zhang, 2024 | https://github.com/CZhang2023/2024_eLife_potassium |
Table 1
Strains and plasmids used in this study.
| Strain | Plasmids | Assay |
|---|---|---|
| HCB1 | - | Microfluidic assay |
| JY26 | pKAF131 | Bead assay |
| HCB901 | pBES38 | Bead assay |
| HCB1288 | pVS88 | FRET assay |
| pVS18 | FRET assay | |
| HCB1414 | pVS88 | FRET assay |
| pLC113, pVS88 | FRET assay | |
| pPA114, pVS88 | FRET assay | |
| HCB33 | pTrc99a_pHluorin2 | Intracellular pH measurement |
Additional files
Download links
A two-part list of links to download the article, or parts of the article, in various formats.
Downloads (link to download the article as PDF)
Open citations (links to open the citations from this article in various online reference manager services)
Cite this article (links to download the citations from this article in formats compatible with various reference manager tools)
Potassium-mediated bacterial chemotactic response
eLife 12:RP91452.
https://doi.org/10.7554/eLife.91452.4


