Soil-borne fungi alter the apoplastic purinergic signaling in plants by deregulating the homeostasis of extracellular ATP and its metabolite adenosine
- Department of Biology and Zürich-Basel Plant Science Center, Switzerland
- Department for Plant and Environmental Sciences, University of Copenhagen, Denmark
- Department of Environmental Systems Science, ETH Zürich, Switzerland
- Institute of Plant and Microbial Biology and Zürich-Basel Plant Science Center, University of Zürich, Switzerland
- Centro de Biotecnología y Genómica de Plantas, Universidad Politécnica de Madrid (UPM) – Instituto Nacional de Investigación y Tecnología Agraria y Alimentaria (INIA/CSIC), Spain
Figures
Figure 1 with 2 supplements

Enhanced apoplastic Ado counteracts eATP-induced reduction of fungal penetration on root vasculature.
(A) Overlayed LC-MS extracted ion chromatograms of blank (red), adenosine (green), plant and fungus (blue).Overlayed LC-MS extracted ion chromatogram of blank (black), 250 ng adenosine (blue), fungi (red), plant (gray), plant and fungi (green) (B) and (C) Fo5’NT (B) and FoENT (C) expression relative to FoTub in hydroponically-grown Arabidopsis roots at various days post treatment (dpt) with Fo spores. Values are mean ± SEM, N≥20, Welch’s unpaired t-test: (B) 1 dpt vs. 4 dpt: * p-value ≤0.05, 1 dpt vs. 6 dpt: ** p-value ≤0.01; (C) 1 dpt vs. 6 dpt: * p-value ≤0.05. (D) Cumulative Fo5176 pSIX1::GFP root vascular penetrations in wild-type (Col-0) seedlings at different days post-transfer to plates containing ½ MS (control) and 1 mM Ado and/or 0.5 mM ATP. Values are mean ± SEM, N≥52 from three independent experiments. RM two-way ANOVA with Tukey post-hoc test on control vs. 0.5 mM ATP: p≤0.001 (treatment), p≤0.001 (time), p≤0.0001 (treatment x time). Significant differences compared to control (black asterisk) and 500 µM ATP (blue asterisks) at 7 dpt are indicated on the graph (Tukey test); statistics of remaining time points are summarized in Supplementary file 2. (E) Representative images of Col-0 seedlings at 7 dpt to mock (left) or Fo5176 pSIX1::GFP (right) plates. Scale bar = 1 cm. (F) Root growth of plants as shown in (E) at different days post transfer to mock or Fo5176 pSIX1::GFP-containing plates. Values are mean ± SEM, N≥52 roots from three independent experiments, RM two-way ANOVA p (treatment, time, treatment x time): control vs 500 µM ATP (≤0.0001, ≤0.0001, ≤0.0001); control vs 500 µM ATP +1 mM Ado (≤0.0001, ≤0.0001, ≤0.0001); control infected vs 500 µM ATP infected (≤0.0001, ≤0.0001, ≤0.001); control infected vs 500 µM ATP +1 mM Ado-infected (≤0.0001, ≤0.0001, ≤0.0001). (G) Colony diameters of Fo5176 grown for 4 days on plates containing ½ MS (control) and 1 mM Ado and/or 0.5 mM ATP. Values are mean ± SEM, N=4, Welch’s unpaired t-test control vs 0.5 mM ATP: **** p-value ≤0.0001; control vs. 0.5 mM ATP +1 mM Ado: **** p-value ≤0.0001. Scale bar = 1 cm.
-
Figure 1—source data 1
Enhanced apoplastic Ado counteracts eATP-induced reduction of fungal penetration on root vasculature.
- https://cdn.elifesciences.org/articles/92913/elife-92913-fig1-data1-v2.xlsx
Figure 1—figure supplement 1
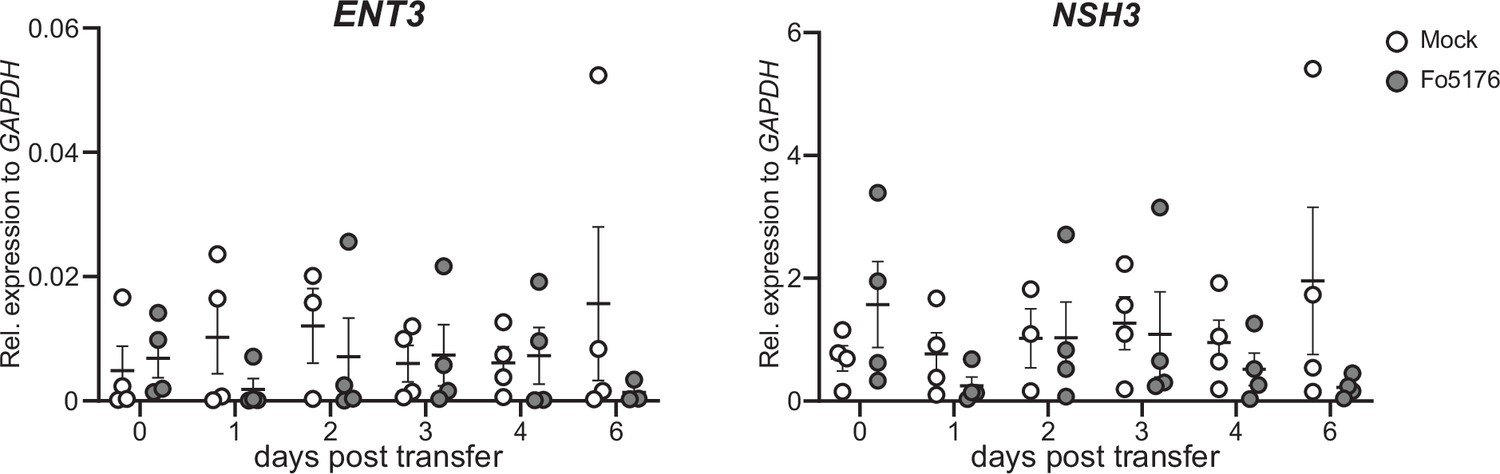
Plant ENT3 and NSH3 expression do not change in response to Fo5176.
ENT3 and NSH3 expression relative to AtGAPDH in hydroponically-grown Arabidopsis roots at the respective days post treatment with Fo5176 spores or with control media (Mock). Values are mean ± SEM, N≥3.
-
Figure 1—figure supplement 1—source data 1
Plant ENT3 and NSH3 expression do not change in response to Fo5176.
- https://cdn.elifesciences.org/articles/92913/elife-92913-fig1-figsupp1-data1-v2.xlsx
Figure 1—figure supplement 2

ATP-induced plant defense is counteracted by doubled concentration of eAdo.
Cumulative Fo5176 pSIX1::GFP vascular penetrations per root in 8-day-old Col-0 plants at different days post transfer to plates with fungal spores alone (control), or with ATP (A) or ATP +Ado (B). Values are mean ± SEM, N≥63 from three independent experiments. RM two-way ANOVA P (genotype, time, genotype x time) on (A) control vs. 300 µM ATP (≤0.05, ≤0.0001, ≤0.05); control vs. 500 µM ATP (≤0.05, ≤0.0001, ≤0.0001); (B) control vs. 500 µM ATP (≤0.01, ≤0.0001, ≤0.0001); control vs. 500 µM ATP +500 µM Ado (≤0.01, ≤0.0001, ≤0.001). Significant differences compared to control at 7 dpt are indicated on the graph (Tukey test); statistics of remaining time points are summarized in Supplementary file 2.
-
Figure 1—figure supplement 2—source data 1
ATP-induced plant defense is counteracted by doubled concentration of eAdo.
- https://cdn.elifesciences.org/articles/92913/elife-92913-fig1-figsupp2-data1-v2.xlsx
Figure 2 with 1 supplement

Increased extracellular Adenosine levels enhance fungal penetration rates.
(A) Cumulative Fo5176 pSIX1::GFP root vascular penetrations in wild-type (WT; Col-0), dorn1, ent3, and ent3nsh3 seedlings at different days post-transfer (dpt) to spore-containing plates. Values are mean ± SEM, N≥94 from three independent experiments. RM two-way ANOVA P (treatment, time, treatment x time) on WT vs. dorn1 (≤0.05,≤0.0001,≤0.05); WT vs. ent3nsh3 (≤0.0075,≤0.0001,≤0.0061). Significant differences compared to WT plants at 7 dpt are indicated on the graph (Tukey test); statistics of remaining time points are summarized in Supplementary file 2. (B) Representative images of 8-day-old mock or Fo5176 pSIX1::GFP infected plants as indicated in (A) at 7 days post-transfer to plates containing Fo5176 pSIX::GFP spores. Scale bar = 1 cm. (C) Root growth of plants indicated in (B) at different days post transfer to mock or Fo5176 pSIX1::GFP-containing plates. Values are mean ± SEM, N≥79 from three independent experiments, RM two-way ANOVA P (genotype, time, genotype x time): WT vs. dorn1 (≤0.01,≤0.0001,≤0.001); WT vs. ent3 (≤0.0001,≤0.0001,≤0.0001); WT vs. ent3nsh3 (≤0.0001,≤0.0001,≤0.05); WT infected vs. dorn1 infected (≤0.0001,≤0.0001,≤0.0001); WT infected vs. ent3 infected (≤0.05,≤0.0001,≤0.05). (D) Ado/ATP ratio content in media from 10 days-old hydroponically-grown wild-type (WT; Col-0), dorn1, and ent3nsh3 seedlings at 4 days after transfer to media with (+Fo5176) and without (Mock) Fo5176 spores, and in media where Fo5176 was growing alone for 4 days (Fo5176). Values are mean ± SEM, N≥3 biological replicates, Welch’s unpaired t-test in respect to their mock (black) or among genotypes (blue): * p-value ≤0.05.
-
Figure 2—source data 1
Increased extracellular Adenosine levels enhance fungal penetration rates.
- https://cdn.elifesciences.org/articles/92913/elife-92913-fig2-data1-v2.xlsx
Figure 2—figure supplement 1

Ado and ATP levels in the media are altered by Fo5176 infection.
Ado (left panel) and ATP (right panel) content in the media from 10 days old hydroponically grown wildtype (WT, Col-0), dorn1 and ent3nsh3 seedlings at four days after transfer to media with and without Fo5176 spores and media of four days Fo5176 growth alone. Values are mean ± SEM, N≥3 biological replicates, Welch’s unpaired t-test in respect to their mock (black) or among genotypes (blue): * p-value ≤0.05.
-
Figure 2—figure supplement 1—source data 1
Ado and ATP levels in the media are altered by Fo5176 infection.
- https://cdn.elifesciences.org/articles/92913/elife-92913-fig2-figsupp1-data1-v2.xlsx
Figure 3 with 1 supplement

eAdo enhances eATP-induced DORN1-mediated cytosolic Ca2+ peak.
(A), (C), and (E) Representative images of five-days-old wild-type (WT; Col-0; A), ent3nsh3 (C) and dorn1 (E) roots expressing the cytoCa2+ sensor, R-GECO1-mTurquoise –180 s before and 100 s after being exposed to ATP (upper panels) or ATP +Ado (bottom panels). Heatmaps indicate signal intensity (arbitrary units). Scale bar = 125 μm. (B), (D), and (F) cytoCa2+ in roots as in (A), (C), and (E) represented as normalized fluorescence intensity changes (ΔF:F) of R-GECO1: mTurquoise. Imaging started 180 s before either ATP or ATP +Ado was added (0 min; arrow head). Values are means ± SEM, N≥18 from three independent experiments. RM two-way ANOVA P (treatment, time, treatment x time): (B) control vs. 10 μM ATP (≤0.0001,≤0.01,≤0.0001); control vs. 10 μM ATP +50 μM Ado (≤0.0001,≤0.01,≤0.0001); 10 μM ATP vs. 10 μM ATP +50 μM Ado (≤0.0001,≤0.0001,≤0.0001); (D) control vs. 10 μM ATP (≤0.0001,≤0.0001,≤0.0001); control vs. 10 μM ATP +50 μM Ado (≤0.0001,≤0.01,≤0.0001).
-
Figure 3—source data 1
eAdo enhances eATP-induced DORN1-mediated cytosolic Ca2+ peak.
- https://cdn.elifesciences.org/articles/92913/elife-92913-fig3-data1-v2.xlsx
Figure 3—figure supplement 1
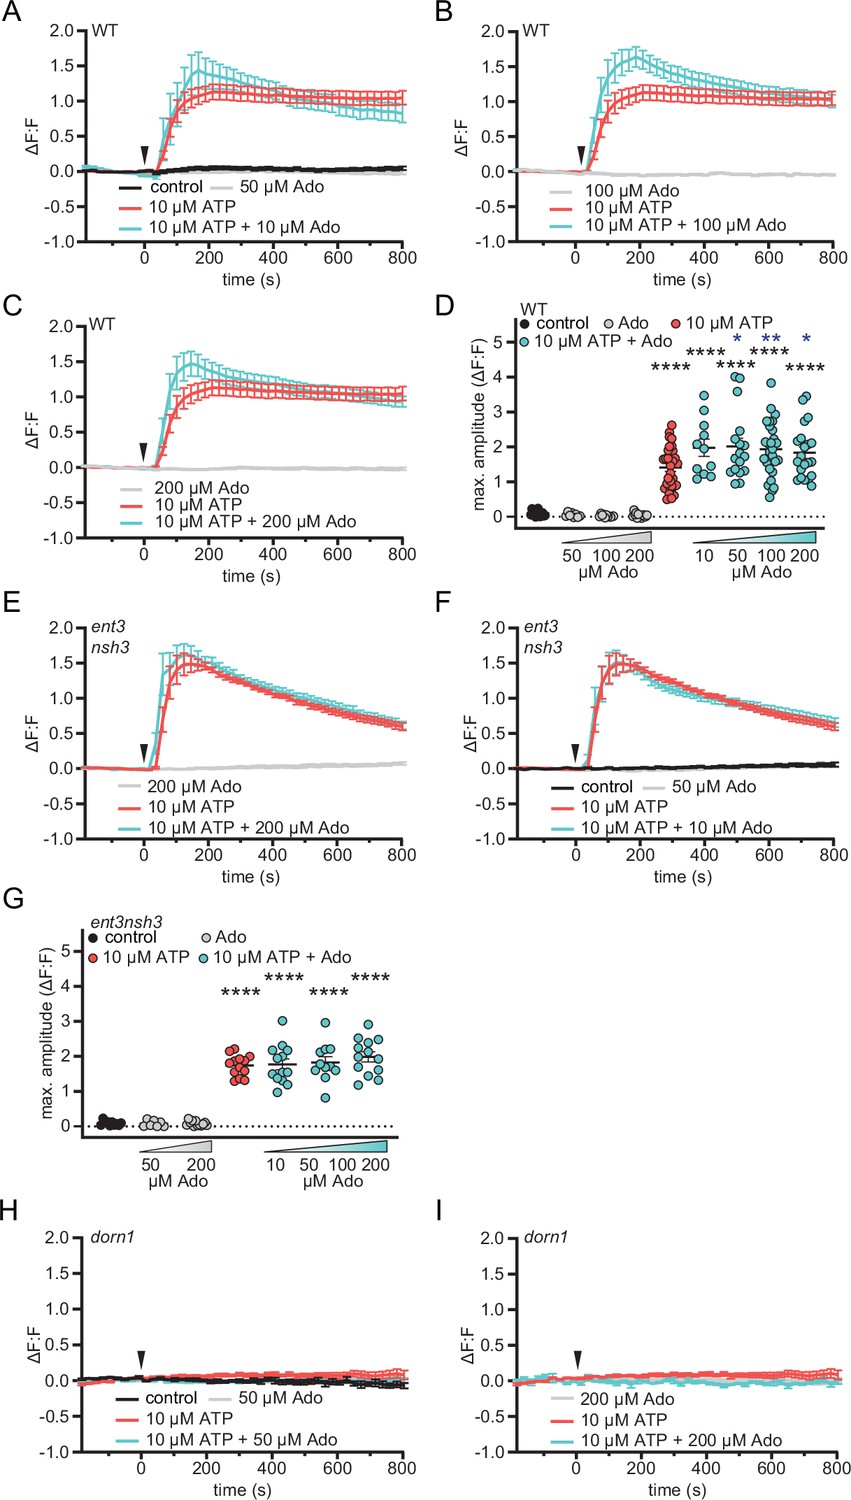
Extracellular adenosine increases extracellular ATP induced DORN1 mediated Ca2+ influx.
Five-day-old RGECO-mTurquoise fluorometric calcium reporter line seedlings were imaged in ½ MS (−180–0 s)s. At 0 min, either ATP or ATP +Ado at the indicated concentrations were added ΔF:F represents the relative signal compared to the averaged baseline recorded prior to application (arrow). RM two-way ANOVA P (treatment, time, treatment x time): (A) control vs. 10 μM ATP (≤0.0001,≤0.01,≤0.0001); control vs. 10 μM ATP +10 μM Ado (≤0.0001,≤0.01,≤0.0001); (B) 100 μM Ado vs. 10 μM ATP (0.0001,≤0.05,≤0.0001); 100 μM Ado vs. 10 μM ATP +100 μM Ado (≤0.0001,≤0.05,≤0.0001); 10 μM ATP vs. 10 μM ATP +100 μM Ado (≥0.05,≤0.0001,≤0.0001); (C) 200 μM Ado vs. 10 μM ATP (≤0.0001,≤0.01,≤0.0001); 200 μM Ado vs. 10 μM ATP +200 μM Ado (≤0.0001,≤0.01,≤0.0001); 10 μM ATP vs. 10 μM ATP +200 μM Ado (≥0.05,≤0.0001,≤0.0001); (E) 200 μM Ado vs. 10 μM ATP (≤0.0001,≤0.01,≤0.0001); 200 μM Ado vs. 10 μM ATP +200 μM Ado (≤0.0001,≤0.001,≤0.0001); (F) control vs. 10 μM ATP (≤0.0001,≤0.001,≤0.0001); control vs. 10 μM ATP +10 μM Ado (≤0.0001,≤0.01,≤0.0001); Maximum amplitudes (D), (G) correspond to (A) - (C) and (B) (WT) respectively (E), (F) and (D) (ent3nsh3). N≥13 from three independent experiments. Welch’s unpaired t-test in respect to control (black) or to ATP alone (blue): * p-value ≤0.05, ** p-value ≤0.01.
-
Figure 3—figure supplement 1—source data 1
Extracellular adenosine increases extracellular ATP induced DORN1 mediated Ca2+ influx.
- https://cdn.elifesciences.org/articles/92913/elife-92913-fig3-figsupp1-data1-v2.xlsx
Figure 4 with 1 supplement
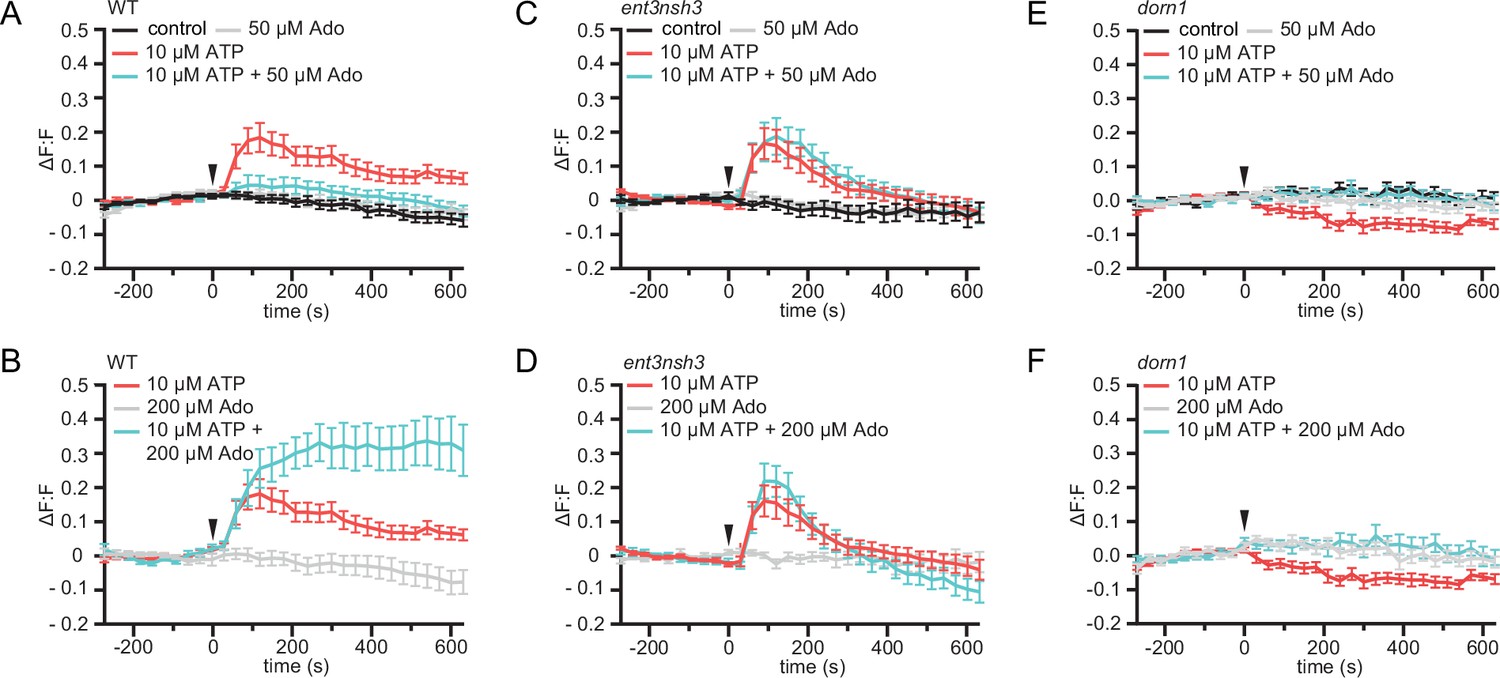
eAdo alters eATP-induced DORN1-mediated apoplast alkalization.
(A), (B), (C), (D), (E), and (F) Apoplastic pH over time in roots expressing the pHapo sensor SYP122-pHusion represented as the relative signal compared to the averaged baseline recorded prior to treatments (ΔF:F).Imaging started 270 s before either ATP or ATP +Ado was added (0 s; arrow head). Values are mean ± SEM; N≥12 seedlings from three independent experiments. RM two-way ANOVA, P (treatment, time, treatment x time) on (A) control vs. 10 μM ATP (≤0.0001,≤0.0001,≤0.0001); 10 μM ATP vs. 10 μM ATP +50 μM Ado (≥0.05,≤0.0001,≤0.05); (B) 200 μM Ado vs. 10 μM ATP +200 μM Ado (≤0.05,≤0.001,≤0.0001); 10 μM ATP vs. 10 μM ATP +200 μM Ado (≤0.01,≤0.01,≤0.0001); 200 μM Ado vs. 10 μM ATP (≤0.05,≤0.001,≤0.0001); (C) control vs. 10 μM ATP (≤0.05,≤0.0001,≤0.0001); control vs. 10 μM ATP +50 μM Ado (≤0.05,≤0.0001,≤0.0001); ATP vs. 10 μM ATP +50 μM Ado (≤0.01,≤0.0001,≤0.0001); (D) 200 μM Ado vs. 10 μM ATP (≥0.05,≤0.0001,≤0.0001); 200 μM Ado vs. 10 μM ATP +200 μM Ado (≥0.05,≤0.0001,≤0.0001); 10 μM ATP vs. 200 μM Ado +10 μM ATP; (E) control vs. 10 μM ATP (≤0.001,≤0.0001,≤0.0001); (F) 200 μM Ado vs. 10 μM ATP (≥0.05,≤0.001,≤0.01).
-
Figure 4—source data 1
eAdo alters eATP-induced DORN1-mediated apoplast alkalization.
- https://cdn.elifesciences.org/articles/92913/elife-92913-fig4-data1-v2.xlsx
Figure 4—figure supplement 1

Extracellular adenosine accumulation and absent extracellular ATP receptor DORN1 elevate apoplastic pH.
Five-day-old fluorometric SYP122-pHusion pH reporter lines were imaged in ½ MS pH 5.75 (−270–0 s) with SP8 microscope. At 0 sec, either ATP or ATP +Ado at the indicated concentrations were added. (A), (B) and (C) correspond to Figure 4B, (C), (E), (F), (H), (I) and display the averaged maximal amplitude of each curve. (D) Apoplastic pH was determined using standard curves. Values are mean ± SEM, N≥16 from three independent experiments, Welch’s unpaired t-test in respect to control or wild-type (black) or to ATP alone (blue): * p-value ≤0.05, ** p-value ≤0.01 **** p-value ≤0.0001.
-
Figure 4—figure supplement 1—source data 1
Extracellular adenosine accumulation and absent extracellular ATP receptor DORN1 elevate apoplastic pH.
- https://cdn.elifesciences.org/articles/92913/elife-92913-fig4-figsupp1-data1-v2.xlsx
Figure 5

Accumulation of extracellular Ado impedes DORN1-mediated gene defense upregulation DONR1, WRKY45, WRKY53, and At1g51890 expression relative to AtGAPDH in WT (Col-0), dorn1, or ent3nsh3 roots 4 days post-treatment with Fo5176 spores or with control media (Mock).
Values are mean ± SEM, N≥3 biological replicates, Welch’s unpaired t-test within each genotype in respect to their mock (black) or among genotypes (blue); * p-value ≤0.05, ** p-value ≤0.01.
-
Figure 5—source data 1
Accumulation of extracellular Ado impedes DORN1-mediated gene defense upregulation.
- https://cdn.elifesciences.org/articles/92913/elife-92913-fig5-data1-v2.xlsx
Figure 6
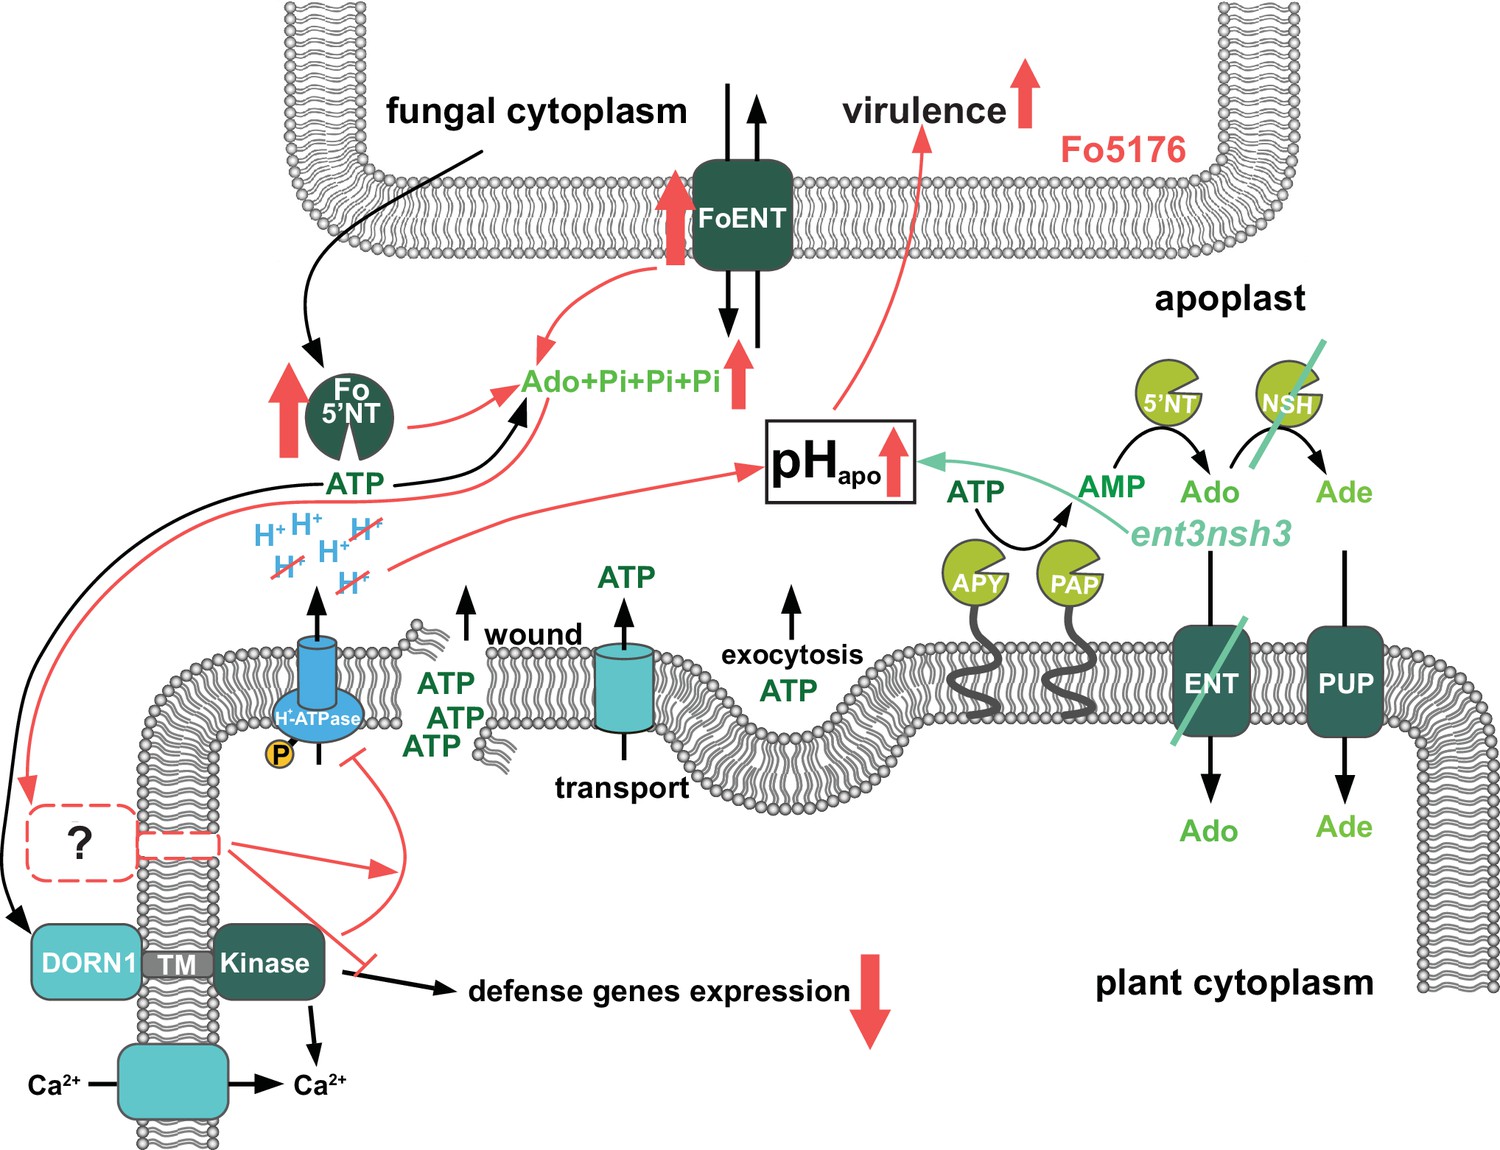
Scheme of the fungal-induced downregulation of the extracellular ATP and Adenosine homeostasis to increase its virulence.
Previously published results (adapted from Nizam et al., 2019) showed that ATP is released into the apoplast by wounding, active transport and exocytosis. Apyrases (APY) and purple acid phosphatases (PAP) degrade ATP to AMP, which is further processed by 5’ nucletotidases (5’NT) and nucleoside hydrolases (NSH) to adenosine (Ado) and adenine (Ade). Equilibrative nucleotide transporters (ENT) and purine permease transporters (PUP) mediate take up of Ado and Ade into the cytoplasm. ATP is perceived by the puringeric receptor DORN1, which triggers Ca2+ influx. Subsequently calcium dependent downstream signaling re-programming is initiated. First contact with F. oxysporum 5176 (Fo5176) elicits phosphorylation of Arabidopsis H+-ATPases (AHAs) and accordingly the apoplast acidifies (Kesten et al., 2019). In this work, we show that during root colonization (red symbols), Fo5176 upregulates expression of eATP hydrolyzing ecto-5’ nucleotidase (Fo5’NT) and Ado transporter (FoENT) and secretes more Fo5’NT, increasing the extracellular Ado (eAdo) levels. eAdo interferes with ATP-induced plant immune system activation above a certain eAdo/eATP ratio by boosting ATP-induced apoplast alkalinization and thereby enhancing fungal virulence. Similar results were obtained in the ent3nsh3 mutant where we detected higher eAdo/eATP levels compared to WT plants. Accordingly, this plant mutant is more susceptible to Fo5176 than WT plants and we observed a lack of upregulation of Fo5176-induced defense genes. Our data suggest that eAdo is perceived via a hitherto undiscovered dedicated plant receptor.
Tables
Table 1
NMR data of Ado.The chemical shifts of 1H and 13C found in Ado. Blanks are heteroatoms in the main chain. Selected COSY and HMBC correlations are included to demonstrate linkage.
| Atom | δ13C | δ1H | HMBC | COSY |
|---|---|---|---|---|
| 1 | ||||
| 2 | 152.4 | 1H 8.13 (s) | 4, 6 | |
| 3 | ||||
| 4 | 149.1 | - | ||
| 5 | 119.1 | - | ||
| 6 | 156.1 | - | ||
| 7 | ||||
| 8 | 139.7 | 1H 8.34 (s) | 4, 5 | |
| 9 | ||||
| 1' | 90.8 | 1H 5.95 (d, J=3.9Hz) | 4, 8, 2' | 2' |
| 2' | 81.1 | 1H 4.52 (dd, J=6.3, 3.9 Hz) | 1', 3' | |
| 3' | 77.1 | 1H 4.22 (dd J=6.3, 3.8 Hz) | 2', 4' | |
| 4' | 87.7 | 1H 3.93 (q J=3.8 Hz) | 3', 5' | |
| 5' | 62.4 | 1H 3.61 (m), 1H 3.50 (m) | 5', 4' |
Additional files
-
Supplementary file 1
Primers used in this study.
- https://cdn.elifesciences.org/articles/92913/elife-92913-supp1-v2.docx
-
Supplementary file 2
Statistical analysis of Fo5176 pSIX1::GFP root vascular penetrations in the indicated Arabidopsis genotypes.
- https://cdn.elifesciences.org/articles/92913/elife-92913-supp2-v2.docx
Download links
A two-part list of links to download the article, or parts of the article, in various formats.
Downloads (link to download the article as PDF)
Open citations (links to open the citations from this article in various online reference manager services)
Cite this article (links to download the citations from this article in formats compatible with various reference manager tools)
Soil-borne fungi alter the apoplastic purinergic signaling in plants by deregulating the homeostasis of extracellular ATP and its metabolite adenosine
eLife 12:e92913.
https://doi.org/10.7554/eLife.92913


